Energy Master Plan 2018 Árainn and Inis Meáin - 10 August 2018 - SEAI
←
→
Page content transcription
If your browser does not render page correctly, please read the page content below
Energy Master Plan 2018

Árainn and Inis Meáin

      10 August 2018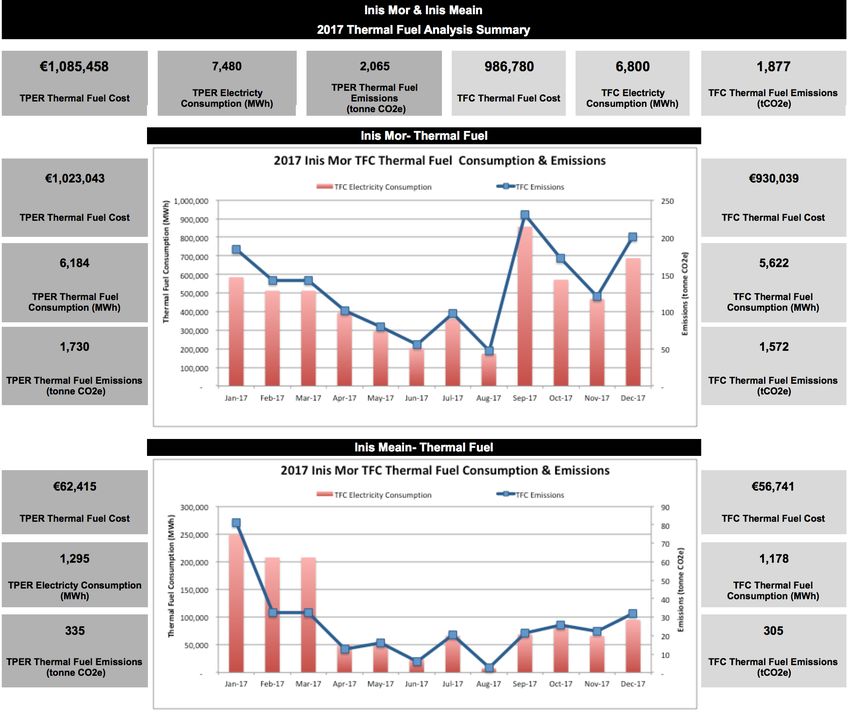
P20180001                                       Árainn and Inis Meáin Energy Master Plan

Table of Contents
Acknowledgements ..................................................................................................................................... 4
1.     Introduction ......................................................................................................................................... 6
2.     The Energy Master Plan ...................................................................................................................... 6
     2.1.    Objectives of the Energy Master Plan ......................................................................................... 6
     2.2.    Methodology of The study ........................................................................................................... 7
        2.2.1.     Data Assumptions and potential sources of errors ............................................................. 8
     2.3.    Relevant Policy Context ............................................................................................................... 9
     2.4.    Overview of Comharchumann Fuinnimh Oileáin Árann Teoranta ......................................... 10
3.     Energy Baseline ................................................................................................................................... 12
     3.1.    The Aran islands .......................................................................................................................... 12
        3.1.1.     Árainn .................................................................................................................................... 12
        3.1.2.     Inis Meain .............................................................................................................................. 13
     3.2.    Energy Baseline ............................................................................................................................ 15
        3.2.1.     Electricity ............................................................................................................................... 18
        3.2.2.     Thermal Fuels ........................................................................................................................ 22
        3.2.3.     Transportation fuel .............................................................................................................. 26
     3.3.    Energy breakdown by sector ....................................................................................................... 27
        3.3.1.     Residential Sector ................................................................................................................. 27
        3.3.2.     Commercial Sector ............................................................................................................... 28
        3.3.3.     Public Sector and Utilities ................................................................................................... 30
        3.3.4.     Fisheries ................................................................................................................................. 31
        3.3.5.     Transport ............................................................................................................................... 31
        3.3.6.     Electricity Breakdown by sector .......................................................................................... 32
        3.3.7.     Thermal fuels Breakdown by sector .................................................................................... 33
        3.3.8.     Transportation energy Breakdown ...................................................................................... 35
4.     The Register of Opportunities .......................................................................................................... 40
     4.1.    Methodology ............................................................................................................................... 40
     4.2.    Recommendations Catagorised by Sector ................................................................................ 42
        4.2.1.     Residential Sector ................................................................................................................ 42
        4.2.2.     Commercial Sector ................................................................................................................43

                                                                                                                                                     PAGE 1
P20180001                                      Árainn and Inis Meáin Energy Master Plan

       4.2.3.      Public Sector and Utilities ................................................................................................... 45
       4.2.4.      Transport .............................................................................................................................. 46
     4.3.    Recommendations for Renewable ENergy Technologies Implementation............................ 47
       4.3.1.      Renewable electricity ........................................................................................................... 47
       4.3.2.      Renewable heat .................................................................................................................... 48
       4.3.5.      Renewable transport ............................................................................................................. 51
       4.3.8.      Energy Storage Options and Electricity network ............................................................... 52
     4.4.    Awareness, Dissemination and Secondary Benefits .................................................................. 53
     4.5.    Mechanism of Support ............................................................................................................... 54
5.     Conclusions and Recommendations ................................................................................................. 55
6.     Bibliography ....................................................................................................................................... 58

Figures
Figure 2-1 Energy Master Plan approach ................................................................................................... 7

Figure 2-2 Energy Master Plan boundary .................................................................................................. 7

Figure 3-1 The Aran Islands (Google Maps, 2018) .................................................................................... 12

Figure 3-2Árainn Energy Balance (2017)................................................................................................... 17

Figure 3-3 Inis Meáin Energy Balance (2017) ........................................................................................... 17

Figure 3-4 Electricity Import from Main Land to the Aran Islands ....................................................... 18

Figure 3-5 2017 Electricity Analysis for Árainn and Inis Méain ............................................................. 20

Figure 3-6Árainn and Inis Meáin load profiles ....................................................................................... 21

Figure 3-7 2013 to 2017 TFC Thermal fuel imports- Inis Mór .................................................................. 23

Figure 3-8 2013-2017 TFC Thermal Fuel Imports- Inis Meáin ................................................................ 24

Figure 3-9 2017 Thermal Fuel Analysis for Árainn and Inis Meáin ....................................................... 25

Figure 3-102013-2017 Árainnestimated transportation fuel TFC ............................................................ 26

Figure 3-11 2013-2017 Inis Meáin estimated transportation fuel TFC ..................................................... 27

Figure 3-12Árainn estimated Electricity TFC breakdown by sector (2017) ............................................ 32

Figure 3-13 Inis Meáin estimated Electricity emission breakdown by sector ........................................ 33

                                                                                                                                                  PAGE 2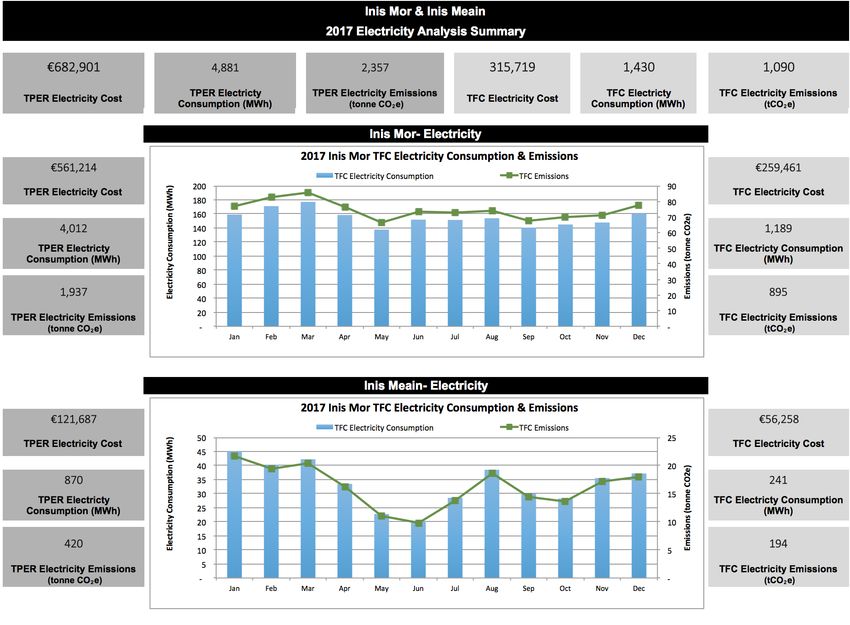
P20180001                               Árainn and Inis Meáin Energy Master Plan

Figure 3-14Árainn estimated Thermal Fuels TFC breakdown by sector (2017) .....................................34

Figure 3-15 Inis MeáinEstimated Thermal Fuels TFC breakdown by sector (2017) .............................. 35

Figure 3-16 Estimated transportation fuel breakdown for Árainn (2017) ............................................. 36

Figure 3-17 Estimated transportation fuel breakdown for Inis Meáin (2017) ....................................... 36

Figure 3-18 2013-2017 Árainn and Inis Meáin AV G consumption .......................................................... 37

Figure 3-19 2013-2017 Árainn and Inis Meáin Av G emissions ................................................................ 37

Figure 3-202013-2017 Árann Road Diesel TFC ..........................................................................................38

Tables
Table 3-1 2017 Energy Summary for Árainn and Inis Mein ..................................................................... 15

Table 3-2Total primary consumption breakdown by sector................................................................... 16

Table 4-1Summary of Renewable Electricity proposals.......................................................................... 48

Table 4-2 Summary of Renewable Heat Proposals ................................................................................. 49

Table 4-3 Renewable Energy Proposals for Transportation.................................................................... 51

                                                                                                                             PAGE 3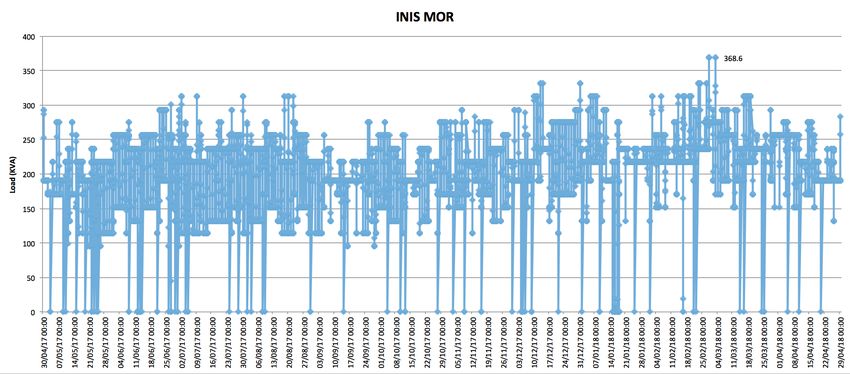
P20180001                    Árainn and Inis Meáin Energy Master Plan

  Acknowledgements

Sustainable Energy Authority of Ireland

ESB Networks

Irish Water

Tipperary Energy Agency

Dr. Pau Farras, NUIG

Lasta Mara

Comharchumann Fuinnimh Oileáin Árann Teoranta

Inis Meain Development Coop

                                                                        PAGE 4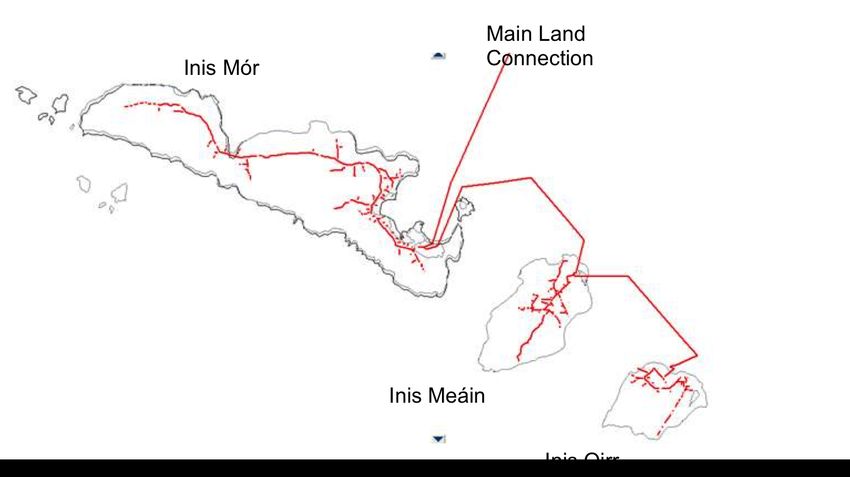
P20180001                        Árainn and Inis Meáin Energy Master Plan

Prepared by:

Maria J Rivas, Renergia

Jack Stanley, Plan Energy Consulting

Gavin Forkan, Plan Energy Consulting

For comments or queries, please contact:

Maria J Rivas: maria@renergia.ie

Jack Stanley: jack.stanley@planenergy.co.uk

Document History

 Issue      Date             Originator              Reviewer     Customer         Reason for
  No                                                              Approver           issue

1.0      01 Aug 18        M.Rivas &              G.Forkan
                          J.Stanley

Draft    20 Jun 18        M.Rivas, J. Stanley,   -              Dara Maoildhia   First issue of
                          G.Forkan                                               report.

                                                                                                  PAGE 5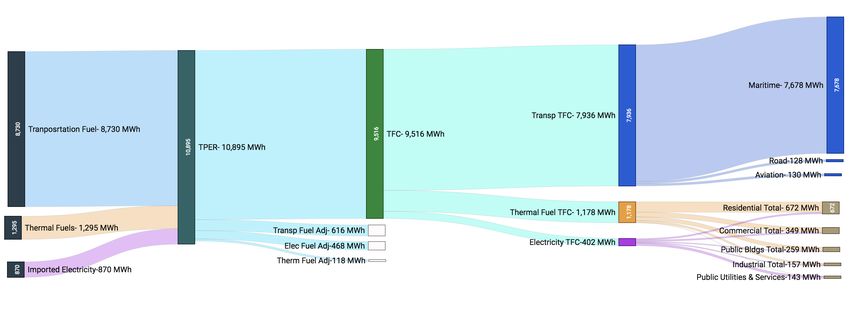
P20180001                        Árainn and Inis Meáin Energy Master Plan

1.         Introduction
Renergia in conjunction with Plan Energy Consulting were commissioned by Comharchumann
Fuinnimh Oileáin Árann Teoranta (CFOAT) to develop an Energy Master Plan (EMP) for Árainn
(Inis Mór) and Inis Meáin that reviewed the energy import and consumption of the island, as well
as reviewed past and future energy efficiency and renewable technology opportunities.

The key objectives of this energy master plan is:

       •   Review the current energy baseline of energy imports to the Islands
       •   Review the energy usage by sectors
       •   Provide an over-arching energy strategy for the islands and identify discrete project
           opportunities
       •   Identify grant and funding mechanisms available to support project opportunities
       •   Establish an action plan to sustain and develop energy efficiency and renewable generation

This energy master plan aims to future-proof planning and energy policy in light of the potential
future impact of National and European legislation in subsequent sections. A key objective of this
initiative is to continue to develop a structure to allow all local stakeholders to make more informed
policy decisions relating to energy provision and development in the area. It is also hoped that the
work will act as an exemplar for other local authorities to demonstrate the value of the energy
master planning process, to encourage similar initiatives elsewhere, and the engagement of the
community.

2.         The Energy Master Plan
2.1.       OBJECTIVES OF THE ENERGY MASTER PLAN
The goal of the Energy Master Plan is to provide a roadmap for efficient, practical, cost effective and
robust energy infrastructure systems for the Aran Islands. This goal can was further broken down
into the following objectives:

       •   Review the current energy baseline of energy imports to the Islands
       •   Review the energy usage by sectors
       •   Provide an over-arching energy strategy for the islands and identify discrete project
           opportunities

                                                                                               PAGE 6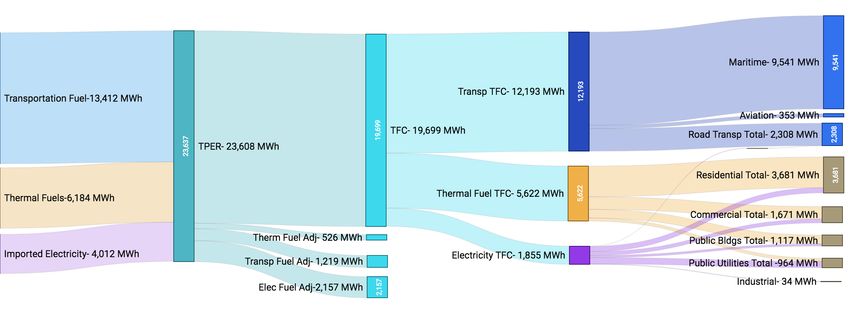
P20180001                      Árainn and Inis Meáin Energy Master Plan

2.2.   METHODOLOGY OF THE STUDY
The approach to the plan is detailed in Figure 2-1.

                               Figure 2-1 Energy Master Plan approach

The first step was defining the boundaries of the plan. Due to the geographical nature, fuels are
imported to the island. However, certain fuels are not directly linked with the Islands’ economic
activity or are not directly utilised in situ, hence they were discounted. This particularly pertains to
transportation fuel associated with large Fishery vessels. Boats are fuelled in Rossaveal, and the
economic activity (fishing) takes place at a significant distance from the Island. Although these
Fishery companies employ some Islanders, the activity is not directly associated with the Island as
the fish is sold in the mainland, the fishermen/fisherwomen do not moor the boats on the island,
and they spend a significant time at sea.

The main Primary Energy Sources (PES) used on the Islands are; imported electricity, thermal fuels
(solid fuel, gas and oil and non-road diesel), and transportation fuels. Transportation diesel used for
ferries, and aviation fuel have also been included, despite refuelling taking place in the main land,
as they are the two main sources of transportation to and from the Islands. The resulting boundary
of the EMP is depicted in the figure below.

             Electricity

         Solid fuels, Gas
         and Oil

            Diesel &
            Aviation Fuel

                               Figure 2-2 Energy Master Plan boundary

ESB networks provided electricity consumption data for a year’s period (from 30 April 2017 -29th
April 2018) in the form of 30-minute interval data that was tallied and organised.

                                                                                                PAGE 7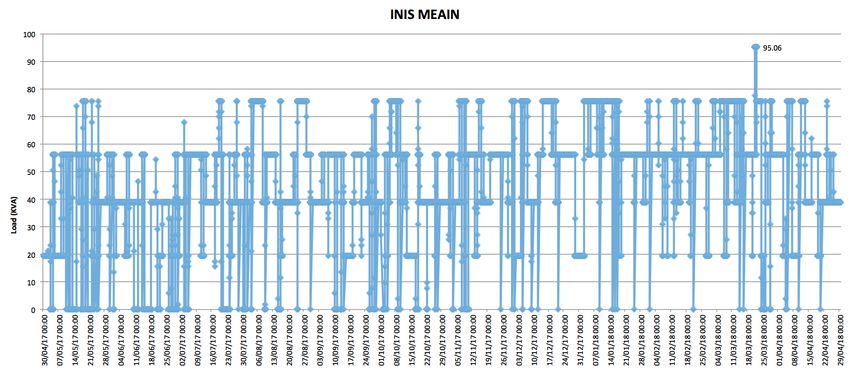
P20180001                     Árainn and Inis Meáin Energy Master Plan

Lasta Mara, a Galway based fuel cargo company, provided records of solid fuels, gas and oil
imported to the Islands. The Comharchumann Forbartha Árann Teo (CFTA) also provided fuel
records for imported kerosene and gas oil. These records were tallied and organised.

Aviation fuel records were provided by Aer Aran Islands. Records of road diesel associated were
only available for Inis Mór, which were provided by the CFTA. Ferry diesel consumption data was
not made available by the companies providing the services, hence figures were estimated based on
number of vessels, frequency of journeys and average usage of diesel per vessel.

Energy costs and emissions records were not readily available for all fuels, hence SEAI published
documents on average cost of fuel and emissions were utilised[1].

The energy baseline was then further broken down into sectors that utilise the imported energy.
This includes Residential, Commercial, Public Buildings and Utilities and Public Services, and
Transport. Some data on the premises and vehicles associated with each sector were collected via
site visit, telephone interview, online and direct surveying. However, the majority of the energy
usage data was not available, hence it was estimated using CIBSE Guide F benchmarking data[2] for
similar buildings based on size of the premise. The size of the premise was mostly obtained via
measurements through Google maps. Furthermore, by means of a literature review of, journals,
reports and other work conducted by third parties on the islands and the 2016 census[3, 4]further
information was gathered.

As part of the data collection process, energy efficiency projects completed on the islands were
reviewed. This included participation in Better Energy Community (BEC) projects, research projects
or any other funded project. Details are further discussed in each section.

Having evaluated the energy usage and the sectors that utilise it, a register of opportunities for
Energy Efficiency Measures (EEM) and Renewable Energy Technology (RET) projects was
developed. The register was subdivided into sectors, and EEMs and RETs were prioritised based on
ease of implementation, technology readiness, and costs. Furthermore, funding and grants available
to support these projects, along with government and international programs that could support
the initiatives of this plan were highlighted. This resulted in a plan for short, medium and long-
term actions to achieve CFOAT’s goals.

The outputs of this body of work include the compilation of this report detailing the action plan,
development of the live Register of Opportunities, and the design of data gathering and analysis
tools that will facilitate the on-going Energy Baseline review for the islands.

2.2.1.           DATA ASSUMPTIONS AND POTENTIAL SOURCES OF ERRORS
Fuel data was gathered from various sources, and the authors of the report have carried out
calculations on the assumptions that all these records are accurate. It is worth noting that:

    •    Thermal fuel records obtained were manually transcribed from shipping dockets into
         spreadsheets, which were then provided in the form of raw data. The person transcribing

                                                                                          PAGE 8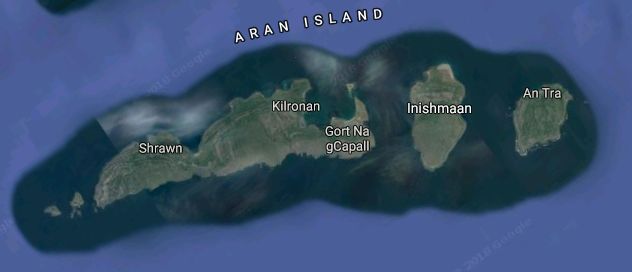
P20180001                         Árainn and Inis Meáin Energy Master Plan

           determined the classification of each fuel, hence there is potential for error particularly in
           the differentiation between fuels.
       •   Thermal fuel records for 2012 were provided, however figures did not seem to be accurate in
           various instances, and corresponding dockets from which data was obtained were not
           readily available, hence this data was not utilized.
       •   For all fuels, the periods for analysis considered were the last 5 years (2013 to 2017);
           electricity data was available only for 2017, Thermal fuel data was available from 2012 to 2017
           and Aviation fuel and Road Diesel figures were available from 2013 to 2017.

2.3.       RELEVANT POLICY CONTEXT
Ireland has developed the National Energy Efficiency Action Plan (NEEAP), which presents the
country’s min policy targets to energy efficiency. The fourth published version of NEEAP was
published in early 2017[5]. The policy outlines the plan to deliver 20% energy efficiency by target
date of 2020, based on the European Union (EU) Energy Efficiency Directive. This represents 2.4
billion in energy cost and 7.7 million tons of carbon emissions reduction. To date, the country has
achieved 12% of its national target.

The key points of the plan include:

       •   The Public Sector has been set an energy efficiency target of 33%. A comprehensive Action
           Plan for Energy Efficiency in the Public Sector has been deployed, and the most recent
           Annual report published (2015 figures) reported a 21% improve efficiency amounting to
           2,422 GWh annual primary savings. SI 426 mandates that all public buildings with gross
           internal floor areas greater than 250m2 have Display Energy Certificates in prominent places
           clearly visible to the public, and that all buildings with floor area greater than 500m2 or an
           energy spend of greater than €35,000 must have an energy audit completed every 4-years by
           a Registered Energy Auditor.
       •   The EU Energy Performance in Buildings Directive (EPBD) legislation Article 9 requires all
           new buildings to be “nearly zero energy” by end of 2020. NEAP has set a target to achieve
           70% energy efficiency in Residential buildings compared to 2005 standards, and 60% energy
           efficiency in Non-residential buildings compared to 2008 standards
       •   In the Commercial sector there is a target to reduce energy usage by 20%. It is primarily
           driven by the Energy Auditing Scheme which requires companies with more than 250
           employees or a turnover greater than €50M to carry out an energy audit by a registered
           SEAI auditor.
       •   Improvements to Electricity and Natural gas transmission and distribution systems are a key
           priority to increase generation and distribution efficiency. To date 3,279 GWH PPE.
       •   In transportation, Ireland set an initial target of converting 10% of its passenger and light
           commercial vehicle stock to Electric Vehicles (EVs) by 2020

In terms of alterative technology, the EU’s Renewable Energy Directive has been adapted in Ireland
under the Nation Renewable Energy Action Plan (NREAP). The fourth version of the plan published
in February 2018 continues to support the goals set of 40% electricity consumption from renewable

                                                                                                  PAGE 9
P20180001 Árainn and Inis Meáin Energy Master Plan
energy sources (RES), 10% electric vehicles and 12% renewable heat by 2020. In the last 5 years in
particular, Ireland has made big strides in accelerating renewable generation achieving 14.4% RES
electricity in 2009 and has risen to 27.2% based on 2016 figures. RES in transport was 5%, and RES
for heat was at 6.8% as of end of 2016[6].
The energy efficiency and renewable energy implementation targets align with the objectives of
CFOAT to become fossil fuel free by 2020.
2.4. OVERVIEW OF COMHARCHUMANN FUINNIMH OILEÁIN ÁRANN TEORANTA
Comharchumann Fuinnimh Oileáin Árann Teoranta is a community owned energy cooperative on
the Aran Islands. The aim is for every resident of the island to become a member. At the moment,
there are 85 members. The intention of the organization is to steer the broad direction of
sustainability goals and ambitions for the three islands, while securing the essential assets and
resources for the community. The Coop aims to make the Aran Islands self-sufficient in clean
locally owned energy and build its economy on the related benefits that accrue from this. The key
objectives of the group:
1. To secure the future energy needs of the three Aran Islands by gaining a
controlling interest in the local sources of alternative energy production.
2. To reduce and gradually remove the dependency of the Aran Islands communities
on fossil fuels (oil, gas, coal, including transport) by replacing them with
alternative and more sustainable sources of energy.
3. To preserve the islands’ unique language, heritage and culture by providing
sustainable employment and a sustainable environment for people to live in.
4. To facilitate the conversion of homes and other buildings on the three islands to
be more sustainable in their energy usage.
5. To provide low-cost energy to industry so as to create employment on the islands
6. To create, provide and encourage employment in projects of sustainable energy
7. To facilitate and at least part-own initiatives and projects in research and
development into sustainable energy.
8. To provide education and training to both residents and non-residents in
sustainable living.
To date the organization has promoted and carried out the following initiatives:
• Electric Vehicles: There was a 3yr pilot involving 10 electric vehicles deployed in
partnership with SEAI. The vehicles were removed after the culmination of the pilot. There
are currently 9 privately owned EVs in Árainn. There are also 8 electric bicycles for hire.
• Residential and Commercial Sector Retrofitting: With the support of SEAI’s Better
Energy Community scheme, approximately half of the Árainn residential and various
commercial properties have been undergone energy efficient retrofits including; building
fabric upgrades, solar thermal installations, air source heat pumps and photovoltaic. Similar
work has also been carried out in Inis Meain at a smaller scale.
• Renewable Energy Generation: A feasibility study has been conducted for a 2.3 MW
PAGE 10P20180001 Árainn and Inis Meáin Energy Master Plan
turbine that did not go ahead, as the location was not accepted by the island
community. There is a proposal to install 3 x 900 kW Wind Turbines, and the
organisation is working on procuring a feasibility study.
• Research and Development: The organisation is participating in several research and
development programs with universities in Ireland, including;
o RESPOND (Horizon 2020) researching Demand-Response sensors and meters in
buildings to improve efficiencies. Over 20 houses on Árainn will participate.
o SEAFUEL (InterREg Atlantic area) researching the feasibility of generating hydrogen
fuel from surplus wind and photovoltaic energy on Árainn
o GEOFIT (Horizon 2020) researching larger geothermal heating systems that supply
large buildings or a number of residential homes. 8 homes on Árainn will
participate.
o C-VVP (InterREg) researching a virtual power plant. Aran will participate by
supplying micro-generated power and buy it back for residential usage.
PAGE 11P20180001 Árainn and Inis Meáin Energy Master Plan
3. Energy Baseline
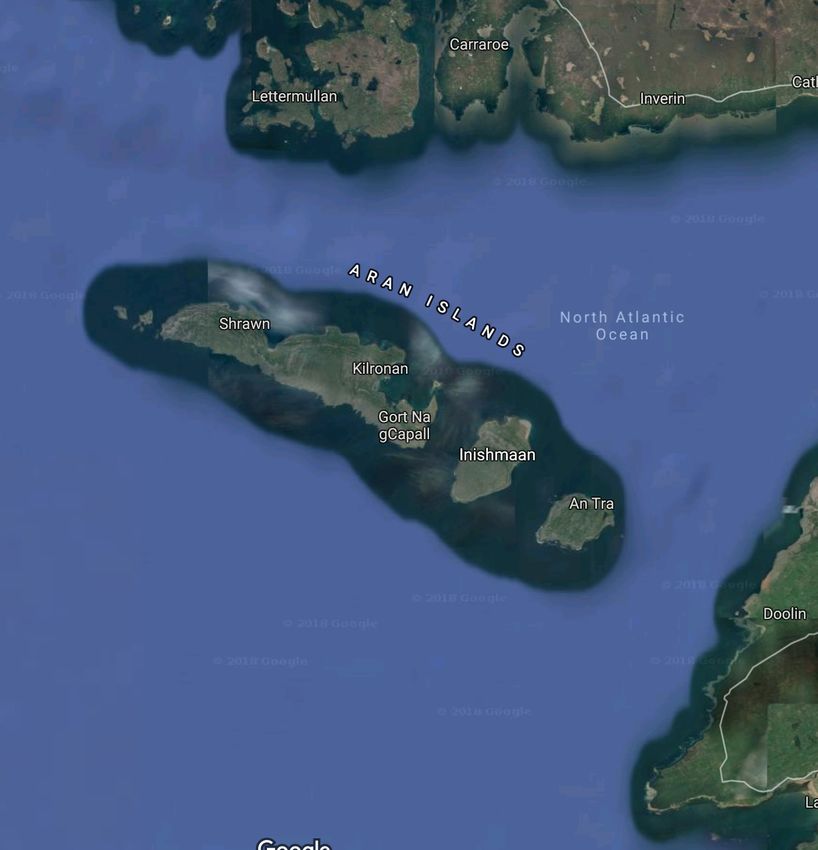
3.1. THE ARAN ISLANDS
The Aran Islands are located approximately 20 kilometres from Rossaveal, Co Galway on Ireland’s
west coast, and are 5-12 nautical miles out in the Atlantic Ocean. The island group consists of Inis
Mór, Inis Meáin and Inis Oírr. This report will focus on the first two islands only.
Figure 3-1 The Aran Islands (Google Maps, 2018)
3.1.1. ÁRAINN
Árainn (Inis Mór), meaning the big island, stretches over 31 km2. It has the largest population of the
Aran Islands with 712 regular residents [7]. Its inhabitants primarily speak Irish but are also fluent in
English. The island is one of the most popular tourist destinations in Ireland due to its historical
interest and its importance in modern Irish Culture. Annually circa 250,000 tourist visit the Aran
Islands, with daily visitors ranging from 1,000 to 3,000 per day during summer months[8].
Most islanders make their income on tourism, and hence the season commencing in May and
culminating in late September is vital in terms of sustainable living through the rest of the year.
PAGE 12P20180001 Árainn and Inis Meáin Energy Master Plan
Fishing industry is also a large employer of the island, however most of the activity is managed from
Rossaveal, and fishing takes place in open waters mainly across the Atlantic as well as in the Irish
Sea.
There are also small and medium enterprises (SMEs) established on the Island. These include a
Goat Farms, and a Sea Weed processing plant. In addition there is a supermarket, clothes, souvenirs
and crafts retail businesses, and a bank. There are also seven restaurants and cafes, as well as 11
B&Bs, a Glamping site and the Aran Islands hotel. There are also 20 minibuses servicing locals and
tourist. There are approximately 20 pony and traps, and two bicycle hire shops with up to 1000
bicycles.
There are various public buildings including; churches, a Garda Station, a Fire Station, the
Community Centre, a HSE medical building, Aras Rónáin, a community owned facility for the
elderly which includes a HSE run nursing home and some sheltered social housing units, two
primary schools and a secondary school, and the Post Office.
There is also a Recycling Centre that processes and manages waste for the islands. In terms of water
treatment, there are public schemes set up to manage household and commercial sewage, as well as
individual septic tanks located across the island. There is a water processing plant that provides
water from 3 water sources, and distributes them across the island.
In terms of settlement, there are 14 villages across the island. The main settlement of Cill Ronaín
contains all the main facilities and services for the island. Housing is located primarily along
existing roads of the island. Based on the 2016 Census results, there are a total of 462 homes built on
the island. Out of these, 297 are fulltime occupied households, 58 are holiday homes occupied only
partly during the year, approximately 19% or 87 of them are vacant dwellings.
The great majority of family houses are connected to septic tanks, and commercial premises are
connected to proprietary sewage treatment plants, most of them being in Cill Rónáin. A new public
sewerage scheme is being designed and currently not in operation to treat the effluent of the two
principal villages on Árainn i.e. Cill Rónáin and Cill Éinne. There are public water schemes serving
Árainn and Inis Oírr. Improvements to both schemes have been carried out in recent years, and
further source development is planned for Inis Oírr[3, 8].
3.1.2. INIS MEAIN
Inis Meáin is the second largest of the Islands, stretching over 9km². It has a population of 183
residents. 82% of the Islanders are Irish speaking. The island has maintained its distinctive
traditional field pattern, giving it a unique visual character.
Tourism is also a source of income; include the Inis Meain Suites, and smaller B&Bs. The local
business includes; a knitwear factory shop, a craft shop, a small supermarket, a bike hire shop, a
pub, and restaurants.
PAGE 13P20180001 Árainn and Inis Meáin Energy Master Plan
There are various public buildings, including a Catholic Church, a primary and secondary school
and a co- operative.
The island has approximately 135 houses with approximately 40 remaining vacant. Most houses are
built in linear type development along the main routes of the Island. Inis Meáin is served by a group
water scheme managed through a private contract by a third party[4, 8]
PAGE 14P20180001 Árainn and Inis Meáin Energy Master Plan
3.2. ENERGY BASELINE
To establish the energy baseline for the two islands fuel import data was gathered. As detailed in
Section 2.2, there are three main fuel imports associated with the island daily life and economic
activity; imported electricity, imported thermal fuels, and transportation fuel. Concurrent data was
not available for all fuels; Electricity import data was available from May 17 to April 18 for both
Islands, as well as maximum load data made available for Árainn from 15 December 2013 to 10
October 2014 by a previous study conducted on the island[9]. Thermal fuels (solid, gas and oil)
import data was available from 2012 to 2017, aviation fuel data was available from 2013 to 2017, and
road diesel for Árainn was available from 2012 to 2017. Inis Meain road diesel and ferry diesel data
for both islands was not available, hence it was estimated. To establish a full picture of fuel imports,
2017 was selected as it coincided with the year for which most data was available.
Table 3-1 summarizes the Total Primary Energy Requirement (TPEF) and Total Final Consumption
(TFC) per sector for 2017. It should be noted that TPEF conversion, TFC emissions and TFC cost
were based on SEAI conversion publications[10, 11].
Table 3-1 2017 Energy Summary for Árainn and Inis Mein
Árainn (2017) Inis Meain (2017)
Total Primary Total Final Consumption (TFC) Total Primary Total Final Consumption (TFC)
Energy Energy
Requirement Requirement
Emissions Cost Emissions Cost
Usage Usage Usage Usage
(MWh) (MWh) (tCO2) (€) (MWh) (MWh) (tCO2) (€)
Transportation 13,412 12,193 3,215 €1,166,458 8,730 7,936 2,093 €712,447
Thermal Fuel 6,184 5,622 1,572 €930,039 1,295 1,178 305 €56,741
Imported
Electricity 4,012 1,855 895 €259,461 870 402 194 €56,258
Total 23,608 19,669 5,682 €2,355,958 10,895 9,516 2,592 €825,446
Table 3-2 details the breakdown by sector of the TFC for each island for 2017.
PAGE 15P20180001 Árainn and Inis Meáin Energy Master Plan
Table 3-2Total primary consumption breakdown by sector
Árainn (2017) Inis Meain (2017)
Total Final Consumption (TFC) Total Primary Consumption (TPC)
Sector Usage Emissions Cost Usage Emissions Cost
(MWh) (tCO2) (€) (MWh) (tCO2) (€)
Transportation Maritime
Fuel (Ferries only) 9,541 2,519 €801,441 7,678 2,026 €664,952
Road Diesel 2,298 607 €278,093 128 34 €15,461
Aviation 353 89 €86,925 130 33 €32,034
12,193 3,215 €1,166,458 7,936 2,093 €712,447
Thermal Fuel Residential 3,144 879 €520,103 584 151 €96,610
Commercial 1,283 359 €212,296 266 74 €44,027
Industrial 0 - €- 110 31 €18,205
Public Bldgs. 894 250 €147,846 214 60 €35,326
Utilities 301 84 €49,794 4 1 €662
5,622 1,572 €930,039 1,178 305 €56,741
Electricity Residential 537 259 €75,126 88 42 €12,311
−
− 3 €54 −
8 ,26 − 8 €11,5
Commercial 8 − 187 4 3 − 40 85
Industrial 34 16 €4,704 47 22 €6,505
Public Bldgs. 224 108 €31,285 46 22 €6,417
Utilities 663 320 €92,689 139 67 €19,409
Transport (EV) 10 5 €1,399 0 - €-
1,855 895 €259,467 402 194 €56,228
Figure 3-2 and Figure 3-3 further detail the energy balance for each island; from Total Primary
Energy Requirement (TPEF) to Total Final Consumption (TFC) per sector.
PAGE 16P20180001 Árainn and Inis Meáin Energy Master Plan
Figure 3-2Árainn Energy Balance (2017)
Figure 3-3 Inis Meáin Energy Balance (2017)
PAGE 17P20180001 Árainn and Inis Meáin Energy Master Plan
3.2.1. ELECTRICITY
Electricity is imported to the Islands via a 3 MW cable connection from Irish mainland into Inis
Mór, and is then distributed to the other two islands as detailed in the figure below. There is a
recloser located at the Main Land (Rossaveal) and then one on each island. Data was available from
each of the 4 reclosers.
Figure 3-4 Electricity Import from Main Land to the Aran Islands
Data provided by ESB was analysed, and a consumption pattern for 2017 was established. It should
be noted, that the original data set was supplied in amps readings for a year’s period (May 17 to
April 18), and it was assumed that the consumption from Jan to April 2018 was representative of Jan
to April 2017, as the average load did not change significantly throughout the year.
These figures represent Total Final Consumption (TFC) or the electricity at point of use. Total
Primary Energy Requirement (TPER), the measure of all of the electricity consumed that accounts
for the energy that is consumed and/or lost in transformation, transmission and distribution
processes (e.g. electricity generation transmission and distribution)[11], was calculated by applying
SEAI published conversion factors as per Public Sector reporting requirements.
The mainland recloser recorded a total of 4,433 MWh of electricity consumption, however the sum
of the 3 island reclosers totalled to 1, 913 MWh. This means that there was a total of 2,520 MWh of
electricity difference between that recorded on the main land and that supplied to the islands. It
would be important to review the nature of the difference is records (57% difference), as despite
potential transmission losses from the mainland recloser to the islands, the value seems
significantly high. It would be advisable to carry out an in depth study to further determine the
unaccounted amount.
PAGE 18P20180001 Árainn and Inis Meáin Energy Master Plan
Figure 3-5(next page) details the electricity analysis carried out for both islands quantifying TFC
and TPER.
A total of 1,913 MWh of electricity was imported into the Aran Island reclosers. Árainn is the most
energy intensive of the islands, accounting for 62% of the Electricity imported to the three islands.
It accounts for 62% of the total emissions and cost. The winter months were the most energy
intensive, with March being the month with most consumption.
Inis Meáin accounts for 13% of the overall Electricity imported, 13% of electricity emissions and cost.
Winter months are also the most energy intensive in Inis Meáin, with January having the largest
recorded consumption.
PAGE 19P20180001 Árainn and Inis Meáin Energy Master Plan
Figure 3-5 2017 Electricity Analysis for Árainn and Inis Méain
PAGE 20The average load in Árainn during this period was 208 kVA, with a max load of 368 kVA.
While Inis Méain had an average load on the island during this period was 45 kVA, with a
max load of 95 kVA.
Figure 3-6Árainn and Inis Meáin load profiles
PAGE 21P20180001 Árainn and Inis Meáin Energy Master Plan
3.2.2. THERMAL FUELS
The two islands import thermal fuels from the main land from Lasta Mara, and have
recently (since mid 2016) also importing kerosene and diesel from Sweeney Oils based in
Cliffden, Co Galway. Lasta Mara provided fuel import records for both islands, and the
Comharchumann Forbartha Árann provided fuel import data for Inis Mór.
The import records were compiled for each fuel source, and aggregated monthly resulting in
an annual thermal fuel baseline for each island. As with electricity, the TPER was also
calculated for each fuel. The thermal element of the consumption was adjusted for degree
days to account for weather-related variations in energy consumption, and the SEAI
conversion factor was applied [11].
Records were analysed from 2013 to 2017 for each island. This section will discuss thermal
fuel imports (based on records provided which correspond to the TFC) for each island, as
well as provide an analysis for 2017 data set both for TPER and TFC.
Inis Mór
Árainn has had an average Thermal fuel TFC import of 6,500 MWh per annum, with 2015
representing the year with the highest annual import. The most predominant imports are
coal, kerosene and gasoil.
Kerosene is the main import (average of 32%) followed by Gasoil (26%) and, Coal (25%).
These fuels are predominantly used for heating both in the residential sectors and the
commercial properties (hotels, B&B, amongst others). Diesel for non-transport purposes
accounts for 10% of imports on average, and is used for heating and as principle fuel for
generators. Wood and peat briquette are used for heating, and account to an average of 2%
of imports, each.
Butane and propane tanks are delivered in cylinder sizes (34 kg and 47 kg cylinder for
propane, and 11.34 kg for butane), and are mainly used as residential and commercial
cooking fuel. These represent a combined average import figure of 6%.
PAGE 22P20180001 Árainn and Inis Meáin Energy Master Plan
2013-2017 TFC Thermal Fuels
Inis Mor
Wood Briquettes Diesel-NonTransp Gasoil Kero Coal Butane Propane
8,000
7,000
Energy Import (MWh)
6,000
5,000
4,000
3,000
2,000
1,000
0
2013 2014 2015 2016 2017
Figure 3-7 2013 to 2017 TFC Thermal fuel imports- Inis Mór
In terms of emissions from fuel imports, Kerosene, Coal and Gasoil are the main
contributors, with average percentages of 29%, 30%, and 25%. Diesel for not transportation
purposes accounts for 10% of the emissions, and the other fuels account for the remaining
6%.
This highlights as significant opportunity for the island in terms of alternative heating fuels.
Inis Meain
Inis Meain had an average of 1,500 MWh of fossil fuel imports per annum between 2013 and
2015, with 2015 representing the most imports at 2,135 MWh/annum. Diesel, coal and
kerosene are the most predominant fuels imported.
PAGE 23P20180001 Árainn and Inis Meáin Energy Master Plan
Figure 3-8 2013-2017 TFC Thermal Fuel Imports- Inis Meáin
Coal was the main fuel import during this period, representing approximately 58% of the
overall imports. It is used mainly for residential heating. Kerosene represented on average
26% of the overall fuel imports during this period, and was mainly used as commercial and
residential heating source. Diesel represented approximately 8% of thermal fuels, it is
estimated that the majority was used for heating along with generators for electricity back
up.
Butane and propane each represent approximately two and three per cent, respectively, of
the fuel imports between 2013 through 2015. Butane and propane are mainly used as cooking
fuels. Briquettes represented on average 1% of the energy imports. Wood was not imported
between 2013-2016, however in 2016 it represented 16% of fuel imports for that year.
In terms of emissions from fuel imports, Kerosene and Coal are the main contributors, with
average percentages of 21% and 64%, respectively. Diesel for not transportation purposes
accounts for 7% of the emissions, and the other fuels account for the remaining 8%.
The patterns of imports have significantly increased in 2014, and then had decreased steadily
until 2016. In 2017, a spike in wood imports took place that generated an overall increase in
imports. There is a significant opportunity for the island in terms of alternative heating fuels
to reduce thermal fossil fuel imports, decrease emissions and increase security of supply.
The 2017 Thermal fuel imports were analysed on the basis of TPER and TFC, similar to the
analysis completed for electricity imports in section 3.2.1. The analysis is depicted in Figure
3-9
PAGE 24P20180001 Árainn and Inis Meáin Energy Master Plan
Figure 3-9 2017 Thermal Fuel Analysis for Árainn and Inis Meáin
During 2017, Inis Mór's imports represented 83% of the overall imports to the two islands.
The associated emissions corresponded to 84%, and costs summed to 94%. Inis Meáin was
responsible for 17% of the imports, which accounted to 16% of the emissions and 6% of the
total cost.
The monthly pattern of consumption for both islands during 2017 was not consistent
throughout the year. It is worth noting that the monthly records correspond to deliveries
rather than to actual consumption. Hence it is difficult to determine if outside temperatures
PAGE 25P20180001 Árainn and Inis Meáin Energy Master Plan
(Heating Degree Days) are in fact the main drivers of energy consumption, as would be
expected.
3.2.3. TRANSPORTATION FUEL
The three main fuels associated with transportation are; Road diesel, Ferry diesel and
Aviation Gasoline (AVGAS). Road diesel figures for Árainn were provided by
Comharchumann Forbartha Árann, while Inis Meáin figures were estimated based on
private vehicles reported by the 2016 Census and estimated mini buses based on the hotel
and B&B. Cost and conversion figures were calculated using SEAI publications [3, 11].
The Doolin and Rossaveal ferry companies, and Aer Aran Airlines are the main providers of
maritime and aviation transportation, respectively. They were contacted directly to obtain
fuel consumption related data. Only Aer Aran Airlines provided data. The ferry fuel
consumption has been estimated based on vessel types, and ferry services published on their
websites for 2017.
Árainn
2013-2017 Estimated Transportation Fuel TFC
Ferry Diesel AV Gas Road Diesel
14,000
12,000
10,000
Energy (MWh)
8,000
6,000
4,000
2,000
-
2013 2014 2015 2016 2017
Figure 3-102013-2017 Árainn estimated transportation fuel TFC
PAGE 26P20180001 Árainn and Inis Meáin Energy Master Plan
Inis Meáin
2013-2017 Estimated Transportation Fuel TFC
Marine Diesel AV Gas Road Diesel
9,000
8,000
7,000
6,000
Energy (MWh)
5,000
4,000
3,000
2,000
1,000
-
2013 2014 2015 2016 2017
Figure 3-11 2013-2017 Inis Meáin estimated transportation fuel TFC
3.3. ENERGY BREAKDOWN BY SECTOR
This section will first discuss the sectors analysed during this study, and then detail the
Electricity, Thermal and Transportation fuels breakdown by sector. It should be noted that a
significant attempt was carried out to collect data from all sectors, however based on project
constraints (schedule and budget) it was not possible to gather all desired data. Hence,
reasonable assumptions were made based on literature and previous studies, and
calculations and estimations based on these assumptions were carried out. It would be
advisable to consider more thorough data collection from each sector, with the aim of
further fine-tuning the data presented, and obtaining a more accurate sectorial breakdown.
3.3.1. RESIDENTIAL SECTOR
Residential sector data was collected for the two Islands by means of reviewing the 2016
Census for Árainn and Inis Meáin, and an online questionnaire distributed to Árainn
inhabitants with support from one of the CFOAT members. The online questionnaire was
not distributed in Inis Meáin, as contact details of the inhabitants were not made available
at the time of the study.
Inis Mór
PAGE 27P20180001 Árainn and Inis Meáin Energy Master Plan
Based on the 2016 Census, there are 762 inhabitants in Inis Mór, and 297 fulltime occupied
households on the island. A total of 19 respondents participated in the survey; hence the
majority of the data was obtained from the Census.
From the 297 properties on the island, 94% of them are houses or bungalows, 3.4% are
apartments and the remaining are caravans or mobile homes. The majority of the homes are
one or two bedrooms (38% and 25%, respectively), with several three, four and five
bedrooms and only 4% properties larger than five rooms.
The majority of the properties on the Island were constructed before 1980’s (66%), 20% were
built between 1981-2000, and 14% after 2001. In addition to these homes, the Census
reported 87 vacant dwellings, 58 unoccupied holiday homes and 22 temporarily absent
(during the time of the Census) premises. This would equate to a total of 462 residential
properties on the island.
To establish an energy consumption for the residential sector, the average Irish household
energy usage published by SEAI in there most recent report [12]was considered, along with
number of occupied dwellings and their heating technologies detailed in the 2016 Census
and information gathered from the survey respondents in relation to their billed
consumption.
Inis Meáin
The 2016 Census indicated that the population of Inis Meáin is 183, and that there are a total
of 78 occupied households, all of which are house or bungalows. The majority of the homes
are one or two bedrooms (43% and 27%, respectively), 14% have 3 bedrooms and the
remaining properties vary between four, five and seven bedrooms.
The majority of the properties on the Island were constructed before 1980’s (59%), 29% were
built between 1981-2000, and 14% after 2001.
The Census indicated that there were 11 unoccupied holiday homes, and 38 vacant dwellings,
in addition to the 78 occupied homes.
3.3.2. COMMERCIAL SECTOR
The commercial sector is primarily divided into; hospitality, retail and small industries.
Data was collected in Árainn by means of an online questionnaire, interviews with the
CFAO main point of contact and some representatives of the main commercial and
industrial premises. Data for Inis Meain was collected via interview with the main contact
person Chomhlacht Forbartha Inis Meáin.
In addition, information was obtained through literature review of previous studies and
reports carried out in the islands, well as information available on individual businesses.
PAGE 28P20180001 Árainn and Inis Meáin Energy Master Plan
Inis Mór
The primary industry on the Islands is tourism with the average population doubling during
the summer months. As a result, the number of guesthouse per capita is significantly higher
on average on the Aran Islands than for the mainland. There is one main hotel, the Aran
Islands hotel, and 14 bed and breakfast/guest houses, along with a Glamping site and rental
holiday homes. There are 4 main restaurants, 4 pubs and ice cream shop that operate year
round. The hotel is the main energy consumer of this sub-sector.
The retails sector includes a large Spar shop in Kilronan, 4 craft shops, and an art shop.
There are also 5 knitwear and Aran Islands specialty-clothing shops, as well as a jewellery
shop. There is a Bank of Ireland branch located in Kilronan, and a Credit Union. The largest
energy consumer in this sub-sector is the Spar shop.
There are two main industrial companies on the island; Blath na Mara, a seaweed factory
and Aran Islands Goats Cheese, a goat farm and shop,
Blath Na Mara specializes in hand harvesting wild seaweed with the purpose of bring
seaweed from tide to table. Their main product is dried organic milled or whole seaweed,
brought to market wholesale. They utilise a specialised drying process ensuring the
harvested seaweed retains its nutrients. They operate at a 160m2building located in Onaght,
on the north side of the island. Their main energy fuel is electricity. They utilise
dehumidifiers and fans to carry out their process, as well as use electrical immersion and
heaters for hot water and ambient heat. When surveyed in reference to their energy usage,
they were not sure of what their annual energy consumption totalled to, however the
indicated that they had carried out a series of energy efficiency projects including LED light
change over and building fabric upgrades.
Aran Islands Goats Cheese, produce a variety of goat cheese that is distributed locally and in
the Galway area. The 150m2 premise consists of a goat farm with a herd of 93 adult goats
and 70 kids, and a dairy processing plant equipped with a 1,000-litre vat pasteurizer, press
and moulds. They produce approximately 1000ltrs of milk a week, yielding approximately
100 kg of cheese (it takes 50ltr of milk to produce 5kg of hard cheese). The site utilises
electricity mainly for pasteurising, milk cooling and for cold-room storage. Based on survey
responses from the owner of the company, the site consumes around 16,000 kWh of
electricity per annum. Their most recent energy efficiency upgrade was the installation of
air to water heat pump to heat process water.
Inis Meáin
Inis Meáin has a 5-star boutique hotel, Inis Meáin Suites that operates year round, and 5 bed
& breakfast that operate during 6 months of the year (April to September). There is one pub
that operates year round and several restaurants. The hotel is the main energy consumer of
this sub-sector.
PAGE 29P20180001 Árainn and Inis Meáin Energy Master Plan
The retail sector includes a shop that operates year round, a souvenir shop and a craft shop.
The Inis Meáin Knitting Co. is the main industrial company on the island. It was founded in
1976 and supplies knitwear to stores around the world. It is the main employer on the island.
It stretches over 775 m2, which include both the factory building and a shop.
3.3.3. PUBLIC SECTOR AND UTILITIES
Árainn has a mix of community and office service buildings, education, health and public
services, and spiritual and cultural centres.
There is a Community Development and Office services, the Co-Op Offices and a general
office building. There is a Village hall, sport pavilion and a public library. In terms of
education and child services, there is a crèche, two primary schools and a secondary school.
There is a general practitioners office and a nurse station, as well as a nursing home. There
is Garda station that serves all three islands, a fire station and coast guard station. There is
also a post office. There are three churches, a tourist office and a heritage centre.
The main public buildings on Inis Meáin include; a community building, a primary school
and a secondary school. It also has a health centre and a fire station. There is a post office
located in the convenience store.
The main utilities reviewed on both islands include; recycling plant, water treatment plants,
public lighting, the harbour, and telecommunication infrastructure. Data was gathered
mainly from published reports and as well as during the site visit.
Athchúrsáil Árann Teoranta, the recycling plant set up by Comharchumann Forbartha
Árann and Galway County Council processes waste for Árainn and Inis Meáin. All of the
food waste, paper and cardboard and glass are fully recycled and re-used on the island,
reducing the amount of energy required to transport waste to the mainland. Only around
20% of the islands waste ends in landfill. The site also severs as the main diesel pump station
for Inis Mór.
Árainn is served by three water treatment plants; Kilcarna, Oghill and Cregacareen. The first
two plants share the same source (Kilcarna rainwater spring source supplemented by
boreholes), while Cregacareen is served by a separate rainwater spring source. The
treatment processes at each plant involves pressure filtration, UV disinfection and
chlorination[13]. The plant is operated and maintained by Irish Water.
Inis Meáin has its own water treatment plant. A third party has a Design Build and Operate
(DBO) contract for the plant. Details on the plant were not readily available at the time of
this study. It was assumed that it consist of a rainwater spring source and boreholes, and a
treatment process similar to that of Inis Mór. Based on review of publications, there are
plans to upgrade the current scheme to ensure security and quality of supply; this includes
PAGE 30P20180001 Árainn and Inis Meáin Energy Master Plan
preparation of detailed designs for raw water storage tanks and seeking planning permission
to construct the storage tanks in highly scenic areas with a capacity of 4,500m3[14].
There are no wastewater treatment plants currently in operation at either island.
Wastewater is managed via septic tank systems with overflow.
Public lighting is located across the main roads of both islands, and in the harbour areas.
Most of the lighting is either Low or High Pressure Sodium (SOX or SON) or Metal Halide.
In Árainn harbour, a couple of lamps have been upgraded to Light Emitting Diodes (LEDs).
There is a main harbour at each island, utilised for passenger and goods fleet management.
Árainn has a secondary harbour that is currently only used by small fishing or recreational
boats.
The islands have telecom mast installed that allow for the telecommunication
infrastructure. Data was not available on their configuration or management.
3.3.4. FISHERIES
The majority of the Fishery vessels are based and fuelled in Rossaveal. Although these
companies employ some islanders, the economic activity (fishing) takes place at a significant
distance from the Island. There are few local fishermen that have small boats that carry out
fishing close to the Islands’ shores. They were surveyed on the energy consumption
associated with their activity, however none provided responses.
It is estimated that there are 7-8 regular finishing boats in Inis Mór, and 5-6 regular fishing
boats year round in Inis Meain. Information was not available on the size or type of boats
utilised, nor was there detail on the daily activity. .
3.3.5. TRANSPORT
There are two sources of transport to the islands; ferry crossings and flights. On the main
land, public transportation is available via mini buses and bikes. Furthermore, there are also
private vehicles owned by those residing in the island. This section will discuss each form of
transportation further. Aviation was evaluated from 2013 to 2017 for the two islands, road
diesel imports for Inis Mór, and discusses an overall transportation import breakdown based
on 2017 figures calculated.
PAGE 31P20180001 Árainn and Inis Meáin Energy Master Plan
3.3.6. ELECTRICITY BREAKDOWN BY SECTOR
Figure 3-12 details the electricity TFC breakdown per sector for Inis Mór. The most energy
intensive sectors were Utilities and Public Services, followed by Residential and Commercial
Buildings, and Public Sector.
When compared to national energy usage [15], the residential sector electricity TFC is very
similar (30.8% for Ireland and 29% for Inis Mór). The commercial and public sectors (public
utilities and buildings) are reported together at national level, and represent 27.2% of the
electricity TFC, while for Inis Mór, the same sector represents 68.7% of the total electricity
TFC. At a national level, industry is the most energy intensive sector, at 39.7% of the total
electricity TFC, while for Inis Mór, the industrial sector accounts for 1.8% of the total
electricity TFC. In terms of transport, electricity corresponds to 0.2% at a national level,
while it represents 0.5% for Inis Mór.
Árainn
2017 Estimated Electricity TFC Breakdown by Sector
Transport (EV)
0.5%
Utilities Residential
35.7% 29.0%
Commercial
Public 20.9%
Bldgs
12.1%
Industrial
1.8%
Figure 3-12Árainn estimated Electricity TFC breakdown by sector (2017)
Figure 3-13 details the electricity TFC by sector for Inis Meáin. The most energy intensive
sector was Utilities and Public services, Residential and Commercial Buildings. When
compared to national energy usage [15], the residential sector electricity TFC is slightly less
(30.8% for Ireland and 22.9% for Inis Meáin). The commercial and public sectors (public
utilities and buildings) represent 27.2% of the national electricity TFC, while for Inis Meain,
the same sector represented66.5% of the total electricity TFC. At a national level, industry
was the most energy intensive sector, with 39.7% of the total electricity TFC, while for Inis
Meáin, the industrial sector accounts for 11.6% of the total electricity TFC. In terms of
PAGE 32You can also read