ELECTRICITY FOR ALL IN INDIA - Why coal is not always king A Report by Vasudha Foundation
←
→
Page content transcription
If your browser does not render page correctly, please read the page content below
ELECTRICITY
FOR ALL IN
INDIA
Why coal is not
always king
A Report by Vasudha Foundation
Authors: Sunita Dubey,
Siddharth Chatpalliwar
and Srinivas Krishnaswamy.
October 2014

Editorial services provided by
Severine Harrison and Louise Waters,
Practical Action Consulting. Research
inputs from Shradha Dagar and
Sumana Dutta.
Cover photo: Greenpeace India
Photos: page 7 Jackie Murray, page
19 Zishaan Latif/Greenpeace

contents

Executive summary                                                                                4

1. Introduction                                                                                  6

2. Power from coal                                                                               8

  2.1. India’s dependence on coal                                                                8

  2.2. Coal, electricity access and development                                                 10

  2.3. The myth of cheap coal                                                                   15

3. Social and environmental impacts of coal mining and coal power plants                        16

  3.1. Impacts of coal mining                                                                   17

  3.2. Impacts of coal power plants                                                             18

  3.3. Coal and community self‑determination                                                    23

4. Decentralised renewable energy: a win-win solution for communities                           25

5. Conclusion                                                                                   27

List of Tables                                         Figure 5: Household electrification rates around
Table 1: Losses from India’s transmission and          major coal-fired power plants
distribution networks                                  Figure 6: Relationship between state per capita
Table 2: Estimated annual health impacts and           income and total installed coal power capacity
associated costs due to PM pollution from coal         Figure 7: Chronic gap between energy supply and
Table 3: Renewable energy capacity by source:          demand
March 2014                                             Figure 8: Annual cost of environmental
                                                       degradation in India
List of Figures                                        Figure 9: Areas affected by PM2.5
Figure 1: Projections of coal demand for India         Figure 10: Water consumption projections for
under various ‘business as usual’ policies             various power generation technologies
Figure 2: Regional distribution of existing coal       Figure 11: Water stress levels of major river basins
capacity in India and planned UMPPs                    in India
Figure 3: Relationship between household               Figure 12: Estimated emissions from coal power
electrification and human development                  plants by state
Figure 4: Percentage of population with and without    Figure 13: Cost comparison of low carbon solutions
access to electricity: 2009 data and 2030 projection   with high carbon ‘business as usual’ energy projects

                                                                                                              3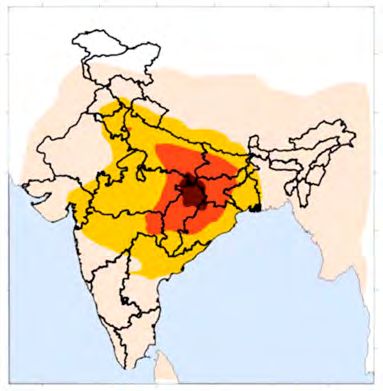
Executive summary
Coal has always been the mainstay of the Indian electricity
sector and many policymakers and analysts believe that it must
remain the primary source of electricity generation for at least
the next three to four decades. This view is based on the belief
that a centralised electricity system based on an ever-expanding
coal power generation base will ensure energy security, provide
affordable energy for all and, importantly, address the issue of
energy scarcity in India. In the world’s third largest producer of
coal (after China and the United States), coal is king. This report
challenges this view and proposes an alternative approach for India.

The assumption that India has an abundance             generation solutions. The cost of generating
of cheap coal is mistaken. Projections                 electricity from solar is now only marginally
assuming a ‘business as usual’ policy approach         higher than the cost of generating electricity with
show demand for coal at least doubling over            a 90:10 blend of imported and domestic coal,
a twenty-year period. The proven extractable           a typical ratio for the new UMPPs. For village
reserves are simply not adequate to meet this          electrification when the village is more than 5km
huge expansion in demand. Furthermore, the             from the grid, the cost of supplying electricity
bulk of proven coal reserves are located in            from decentralised renewable sources is far
ecologically sensitive or densely populated            below the costs of supplying from conventional
areas of the country, meaning that it is not           sources when grid transmission infrastructure is
economically, technically, environmentally,            taken into account.
socially or legally feasible to mine the reserves to
the extent that would be required.                     Coal will not deliver sustainable energy
                                                       for all. According to the International Energy
The acute supply shortage, coupled with the fact       Agency, 147 million Indians will remain without
that domestic coal is generally of low quality,        access to electricity even in 2030 if business
has led a number of power plants to resort to          as usual policies are followed. The pattern
using imported coal. According to a Reserve            of household electrification rates across the
Bank of India 2013 report, the coal imports bill       country reveals a further injustice, with the coal-
adds a burden of US$18 billion every year to           rich states often the ones still in darkness and
the country’s economy. What is more, the new           with the highest levels of poverty.
generation of coal-fired Ultra Mega Power Plants
(UMPPs) planned by the Indian government will          Fuel shortages mean that coal-powered
only be able to use high grade coal, and so will       electricity generation is unable to meet demand,
be permanently dependent on imports.                   resulting in blackouts and brownouts (electricity
                                                       voltage fluctuations), which particularly affect
Coal is not a cheap source of electricity.             rural areas. This puts in question the belief that
The cost of electricity generation from coal is        India’s energy gap can be filled mainly by coal
rising while the cost of renewable energy is           power. The level of power wastage through
falling. The increasing use of imported coal and       transmission, distribution and commercial
the fourfold increase in the price of imported         losses shows the importance of investing in
coal mean that coal power is already more              the electricity network as a priority, rather than
expensive than many renewable electricity              in new coal-fired power stations.

4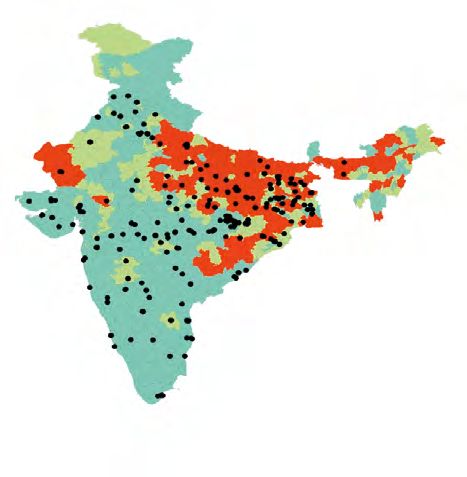
The true cost of coal includes its toll on social      Renewable energy reduces emissions,
structures and the environment. The mining,            improves energy security and can drive
processing, transportation and burning of              regional development. On average, every
coal and the disposal of coal waste harm the           GW of additional renewable energy capacity
poor or indigenous communities where they              reduces carbon dioxide (CO2) emissions by
take place. Threats to these communities from          3.3 million tonnes a year. If CO2 reductions
coal mining include population displacement,           are correlated with particulate emissions
polluted or depleted water sources and the             reductions, each GW of renewable energy
loss of livelihoods through deforestation. Coal        capacity saves around 1,100 lives through
power plants also deplete and pollute water            reduced mortality. A further benefit of
sources, frequently being sited in areas of water      renewable energy is an increase in long-term
stress despite their huge appetite for water.          energy security through the diversification
Power plants also have more widespread health          of supply, reduction of import dependency,
implications through their toxic particulate           and mitigation of fuel price volatility. The
emissions, and contribute to climate change            promotion of renewable energy can also be an
through the greenhouse gases they emit.                important tool for regional development within
                                                       India, given that many of the states with the
Various policies are in place intended to ensure       greatest renewable energy potential also lag
that social and environmental concerns are taken       in economic development.
into account when decisions are made about
new developments. However, the manner in               This report recommends that India pursues
which Environmental Impact Assessment reports          a policy of diversifying energy sources,
are published makes it difficult for communities       including both on-grid and off-grid solutions.
to mobilise effective opposition. Furthermore,         A robust cost benefit analysis of coal, covering
the recent changes to regulations mean that            all externalities, will support policymakers’
some expansions can now take place without             decisions to favour renewables and energy
any public hearings or other formal consultation.      efficiency over coal power.

In short, many of the arguments made in favour         It will be important to invest in energy efficiency,
of coal do not hold true when subjected to             particularly addressing transmission and
closer scrutiny. This report proposes a different      distribution losses, as well as in new generation
strategy, which would instead direct India’s           capacity. A transparent and consultative
energy sector towards the use of sustainable,          institutional and governance framework is
affordable renewable energy to deliver new and         needed to ensure that energy developments
improved access for the energy poor.                   do not threaten fragile ecosystems or the rights
                                                       and livelihoods of local people. The carbon
Renewable sources have the potential to                tax on coal should be adjusted upwards so
contribute a much greater share of India’s             that it reflects the true cost of coal, with the
energy. The contribution made by renewable             revenue raised clearly earmarked for research
sources to India’s energy mix has grown at a           and development into clean energy and
phenomenal rate recently, leaping from 13              environmental remediation programmes.
gigawatts (GW) in 2010 to 32 GW in March
2014, with a further 40 GW planned by 2022 in          By following the recommendations in this report,
order to meet a government target. However,            India has the opportunity to ensure reliable
this total is still well below the most conservative   access to sustainable energy for all.
estimates of renewable energy potential.

                                                                                                          5
1. introduction
India is the dominant energy consumer and producer in South Asia;
its energy policies matter significantly in terms of how the region
as a whole will meet its energy requirements. One of the most
significant problems today, as this report explores, is the continued
reliance on dirty coal-fired power plants which dominate the Indian
power sector.
Direct impacts resulting from the construction a capacity of 4,000 megawatts or more,
and operation of coal-fired power plants that represent India’s big push towards coal
include emissions of particulates and power as the solution to its energy deficit. 2
hazardous chemicals, pollution of local
waterways and degradation of land used Tata Mundra is a shining example of
for storing the by-product of burned coal, modern technology. Its ‘supercritical’ steam
known as fly ash. The indirect impacts, which generation systems are significantly more
result mainly from coal mining, include efficient than the rest of India’s aging coal
degradation and destruction of land, water, fleet, and it will burn less-damaging imported
forests, habitats and societies in general. low-ash and low-sulphur coal. However,
Tata Mundra and the other planned UMPPs
Despite being a regional energy giant, India highlight many of the formidable costs
has a low per-capita electricity consumption associated with India’s decision to base its
(879 kilowatt hours (kWh) per person per electricity generation capacity expansion
year) compared to China (3,29kWh per on coal. Tata Mundra is just a part of the story
person) and the US (13,246kWh per person).1 of coal in India, the true cost of which this
The low per-capita energy consumption in report will address.
India is primarily due to the fact that a vast
majority of the population does not have The report focuses on coal use in power
access to modern energy sources to deliver stations, as coal power currently provides
basic energy needs. One in four Indians 75% of electricity consumed in India’.3 It is
does not have access to electricity; about largely through power generation that the
two thirds of the population use traditional benefits and costs of coal are realised for
biomass for cooking. ‘Energy poverty’ – the the Indian population, offering the prospect
inability to access sufficient energy – is of improved access to energy for some while
one of the reasons for the low levels of elsewhere threatening health, rights and the
development in some regions, as energy environment. Power generation also offers
deprivation has significant health, social, an alternative path: one of decentralised
environmental and economic implications. renewable energy that delivers electricity
access for the most marginalised, while
The government is relying on coal-fired operating in greater harmony with the
power plants to reduce the energy deficit environment, health and people’s rights.
and lift people out of energy poverty. In
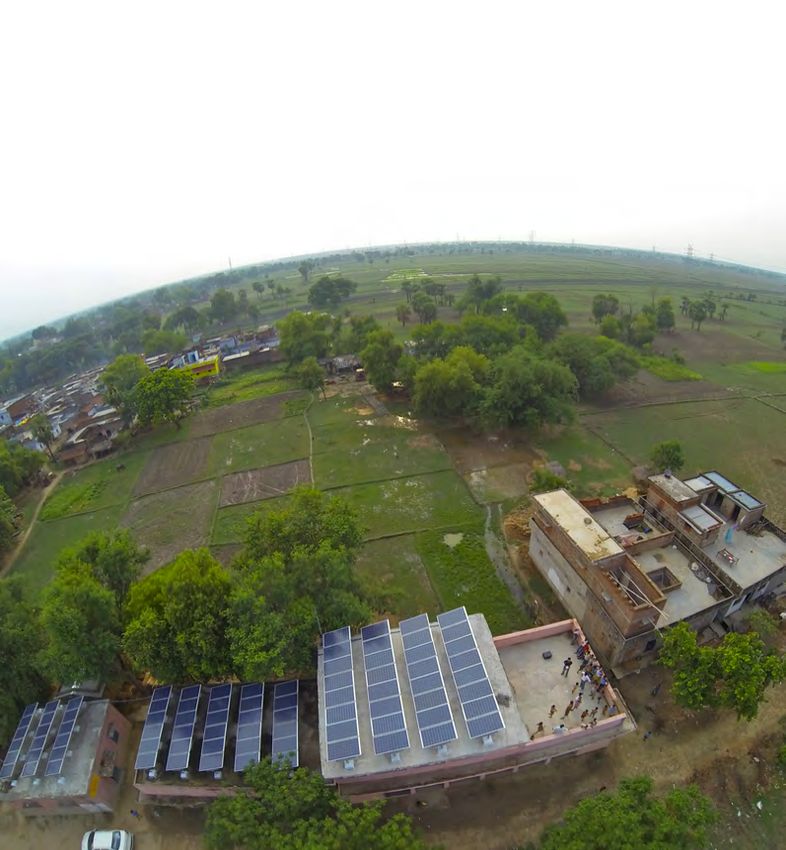
Right: A view of
March 2013, it commissioned the final This report is a challenge to perceived Moolchand, Delhi. The
section of the 4,000-megawatt Tata Mundra wisdom on the supremacy of coal in area is polluted with ash
from a coal-fired power
coal power plant in Gujarat. This installation India, presenting realities and trends that plant, which threatens
is one of sixteen planned UMPPs, each with provide evidence to the contrary. It digs people’s health.
6It is largely through power generation that the benefits
and costs of coal are realised for the Indian population,
offering the prospect of improved access to energy for
some while elsewhere threatening health, rights and
the environment
deep into the problems that surround the source of electricity. In doing so, it also
mining and use of coal in India, examining counters some of the misconceptions about
evidence of the environmental, social alternative sources of energy, showing that
and economic implications of continued a sustainable future is possible without dirty
dependence on coal as the dominant and destructive coal.
72. Power from coal
2.1. India’s dependence on coal In recent years, India’s electricity sector has
India’s dependence on coal can be seen in grown at a rapid pace. Installed generation
its electricity generation mix. As of January capacity has grown phenomenally post
2014, 139 GW (approximately 59% of the total independence from some 1.4 GW in 1948 to
installed capacity) came from coal-powered about 236 GW in 2012. Electricity consumption
thermal generation.4 The balance consists of in the last decade rose approximately 3.8% per
a combination of hydro (17%), other fossil fuel annum,6 and is continuing in a rapid upward
(9%), nuclear (2%) and non-hydro renewable trajectory. This growth has been fuelled in part
energy sources (13%). The energy delivered by increased private sector participation in the
highlights this coal dependence to an even sector, enabled by the reforms initiated by the
greater extent: in 2011, 68% of electricity Electricity Act of 2003.
generated was derived from coal.5
Figure 1: Projections of coal demand for India under various ‘business as usual’ policies7
2000
1500
Million Tonnes
1000
500
0
2006/07 2011/12 0216/17 2021/22 2026/27 2031/32
Years
TERI MARKAL model Integrated Energy Policy
Coal Vision 2025 @ 8% GDP X Plan document Mid‑term appraisal
Coal Vision 2025 @ 7% GDP XI Plan working group
82. Power from coal
Figure 1 shows six projections of future coal (such as the low productivity of Indian coal
demand in India based on different policy mines, and delays in obtaining government
scenarios. However, these policy scenarios are clearances for new mining activities), but other
all broadly ‘business as usual’ – that is to say, they constraints cannot be removed without severe
assume that coal generation will continue to grow negative social and environmental impacts.
at an accelerating pace. They do not account
for the impacts of three major issues: limited Ignoring these constraints, even a steep increase
domestic coal resources, technology constraints in domestic coal output would not solve India’s
for India’s low-grade coal, and climate change. electricity problems. India’s latest generation of
large new coal-fired power stations are called
India’s indigenous coal production is not able to Ultra Mega Power Plants (UMPPs). Most of the
keep pace with demand, in terms of quality or planned UMPPs use ‘supercritical’ technology
quantity. Coal shortages are a major contributor and require coal with a high calorific value and
to shortfalls in electricity generation and low sulphur and ash content. Most domestic
consequent blackouts throughout the country. coal does not meet those standards. The
Between 2008 and 2012, India imported 10 coastal locations of a number of the new UMPPs,
per cent of its coal. This situation is projected shown in Figure 2, betray their reliance on
to worsen: the Planning Commission projects imported coal.
that, over the next 20 to 25 years, 11 to 45 per
cent of total coal demand will have to be met Increased dependence on this constrained
by imports,8 with implications not only for the and finite resource weakens the country’s
energy sector but also for national security and energy security and will expose the electricity
finances. Prospects for increasing domestic sector to the forces of international markets,
coal output are mixed; it may be possible to which operate in an environment of increasing
overcome some constraints on production resource constraints.
Figure 2: Regional distribution of existing coal capacity in India and planned UMPPs9
Coal capacity by district (MW)
1 – 100
100 – 300
300 – 1000
1000 – 2000
2000 – 3000
3000 – 4000
4000 – 5000
5000 – 7000
Utra mega power projects
Coal capacity by state (MW)
0 – 2500
2500 – 5000
5000 – 7500
7500 – 10000
10000 – 12500
92. Power from coal
2.2. Coal, electricity access Electricity, while not the only form of energy
and development that can deliver these services, is unique in
Policymakers in India have long equated energy its versatility and potential for convenience
from coal with development and growth, and safety.
considering the country’s coal resources to
be a national asset to be exploited to deliver The lack of modern and affordable forms of
prosperity for Indians and lift poor people out energy (including electricity) adversely affects
of poverty. The government has invested heavily agricultural and economic productivity and
in coal, and India as a nation has indeed grown opportunities for income generation, with
more prosperous. However, this growth has impacts in terms of malnutrition, low earnings,
not benefited the underprivileged majority. and a lack of surplus cash amongst affected
Perversely, the benefits of coal exploitation – communities.11 The inability to pay for electricity
at least in terms of electrical generation – seem generation equipment, electrical devices or the
to be denied to those populations which are power itself is a key contributor to the vicious
most richly endowed in terms of coal resources. cycle that ensures that poor people remain poor.
The importance of energy access The Human Development Index, a composite
Modern energy services are crucial to human measure of health, education and income
wellbeing and to a country’s economic indicators, shows a positive correlation with
development, being essential for the household electrification – see Figure 3. This
provision of clean water, sanitation and relationship suggests that improving access
healthcare as well as reliable and efficient to clean and affordable energy is critical to
lighting, heating, cooking, mechanical power, improving the overall human development
transport and telecommunications services.10 in those areas which are most lacking.
Figure 3: Relationship between household electrification and human development
KERALA
0.8
DELHI
Human DeveIopment Index values
0.7
HIMACHAL PRADESH
GOA
TAMIL NADU
0.6 HARYANA
J&K MAHARASHTRA
GUJARAT
N.E(EXCLUDING
KARNATAKA ASSAM)
ANDHRA PRADESH
0.5 WEST BENGAL
ASSAM UTTARAKHAND
JHARKHAND
RAJASTHAN
UTTAR PRADESH
0.4
BIHAR MADHYA PRADESH
ORISSA
Chhattisgarh
0.3
0 20 40 60 80 100
Percentage of households with electricity
102. Power from coal
Electrification and inequality According to the International Energy Agency,
Despite the emphasis on increasing installed 147 million Indians will remain without access
electricity generation capacity (predominantly to electricity even in 203013 - see Figure 4. This
through the building of new coal-fired power will represent a dismal failure on the part of
plants), projections show that many millions the government to achieve its own targets.
of Indians still have no prospect of electricity Historical targets aimed for 100% village
access in the medium term. electrification by 2010 and 100% household
electrification by 2012. These targets were
Existing policies and provisions, including the accompanied by a statement of intent to
Electricity Act 2003 and Rural Electrification Policy provide free electricity connections to all families
2006, have merely facilitated the expansion of living below the poverty line. The government
the installed capacity in the sector rather than has not announced new targets, although in
providing access to those that are deprived of the 2014 election campaign some political
electricity. Almost 33 per cent of the country’s parties promised 100% household electrification
population is still waiting for access to electricity by 2015.
and per capita electricity consumption stands at
approximately 879 kWh,12 far below the world
average of almost 3,000 kWh.
Figure 4: Percentage of population with and without access to electricity: 2009 data and 2030 projection
2000
1500 10%
Millions
1000 25%
90%
500
75%
0
2009 2030
Year
Population without access to electricity Population with access to electricity
112. Power from coal
Some of the states with the greatest coal-fired generation
capacity – such as Uttar Pradesh and West Bengal – are
also the poorest in terms of per capita income
The pattern of household electrification rates more than 100 per cent between 2002 and 2013
across the country reveals a further injustice. (from 72 GW to 153 GW), the number of rural
The coal-rich states, considered to be India’s households reached by electricity increased by
electricity ‘hub’, are still in the dark and suffering only 6.4 per cent during the same period.
from abject poverty. Figure 5 shows that some
of the areas with the densest concentrations Figure 6 shows that some of the states with the
of coal power plants also have the lowest rates greatest coal-fired generation capacity – such
of household electrification. The rapid rate of as Uttar Pradesh and West Bengal – are also
urbanisation and migration to India’s major the poorest in terms of per capita income. The
cities will ensure that these more rural regions installation and operation of coal power plants
continue to be deprioritised for grid connection does not go hand in hand with wealth creation
and extension. Despite the fact that thermal and wealth does not ‘trickle down’.
electricity generation capacity increased by
Figure 5: Household electrification rates around major coal fired power plants
(Household electrification data from 2011 Census and power plant data from Central Electricity Authority, 2013)
% of household electrification
High
Medium
HighLow
• Coal power plants
122. Power from coal
Figure 6: Relationship between state per capita income and total installed coal power capacity
(State per capita GDP data from the Planning Commission and installed coal power capacity data
from Central Electricity Authority, 2013)
12 UTTAR PRADESH
10 WEST BENGAL
Total installed capacity (MW)
ANDHRA MAHARASHTRA
PRADESH
8
CHHATTISGARH
GUJARAT
MADHYA
PRADESH
6
TAMIL
NADU
4 RAJASTHAN ORISSA
BIHAR PUNJAB
JHARKHAND KARNATAKA HARYANA
2
DELHI
0
0 50000 100000 150000 200000
Per capita income (Indian rupees)
Limitations of the Indian electricity Despite increased installed capacity over
system the years, there remains a significant gap
So far, government policies for the electricity between demand and supply of electricity, as
sector have not succeeded in resolving issues illustrated by Figure 7. According to Central
such as transmission and distribution losses, Electricity Authority estimates, in 2012-13 the
power quality and the gap between supply peak demand was 160 GW, compared with
and demand. These issues act to reduce an actual availability of 144 GW,15 leading to
the level of energy access experienced an overall peak deficit of 10.4 per cent. The
by those who have a grid connection impacts of power deficit are around 2 per
through availability and reliability problems cent of India’s GDP.16 The most severe supply-
(scheduled and unscheduled blackouts), demand ‘crunches’ occur during coal shortages,
voltage and frequency instability, and highlighting the need for additional non-coal-
affordability. fired generation. These shortages are partly
responsible for the low average coal plant load
factor in 2013 of 68 per cent.
132. Power from coal
Figure 7: Chronic gap energy supply and demand 1984‑2013 (Data from Annual Load Generation
Balance Reports from the Central Electricity Authority17)
35
30
25
Deficit in percentage
20
15
10
5
0
1984-85
1985-86
1986-87
1987-88
1988-89
1989-90
1990-91
1991-92
1992-93
1993-94
1994-95
1995-96
1996-97
1997-98
1998-99
1999-00
2000-01
2001-02
2002-03
2003-04
2004-05
2005-06
2006-07
2007-08
2008-09
2009-10
2010-11
2011-12
1912-13
Energy deficit Peak deficit
The effects of the power deficit are not equally The transmission and distribution losses
shared across the population. In general, associated with India’s electricity system
supplies to rural areas are interrupted in order continue to be amongst the highest in the
to meet demand in cities and urban centres, world. Almost a quarter of all power generated
a phenomenon that looks set to worsen as is lost through network inefficiencies, theft
urbanisation increases the emphasis on cities and inaccurate metering, with further losses
and towns. Furthermore, power shortage is not occurring through wastage by those who benefit
uniform across states because of differences from cheap or even free electricity (see Table 1).
in the quality of governance and the effective These losses drive up the cost of electricity for
implementation of demand management. all users, taking tariffs beyond the reach of the
States that have effectively enforced energy poorest people. It is therefore essential to match
conservation and renewable energy norms, investment in generation capacity (whether
such as the mandatory installation of solar renewable or non-renewable) with investment
water heaters and the use of energy-efficient in power transmission and distribution,
water pumping systems, have comparatively including off-grid systems where these are most
low daily peak demand shortages.18 appropriate. Without this focus, India may invest
more and more in new coal-fired generation
while reaping diminishing economic and
developmental benefits.
142. Power from coal
Table 1: Losses from India’s transmission and 2.3. The myth of cheap coal
distribution networks The conventional belief that electricity
generated from coal is cheap is now being
Year T&D Losses (%) AT&C Losses
questioned in India for two reasons.
(%)
2004-05 31.25 34.33 First, the quantification of all the externalities
associated with coal, such as air pollution, land
2005-06 30.42 33.02 degradation and depletion and pollution of
water, has led to a reassessment of the economics
2006-07 28.65 30.62 of coal power. These costs are explored in more
detail in Section 3 of this report.
2007-08 27.20 29.45
2008-09 25.47 27.37 Second, policymakers are waking up to the fact
that India’s coal reserves, though huge, may not
2009-10 25.39 26.58 be sufficient to meet the growing demands of
electricity generation. India’s continued reliance
2010-11 23.97 26.15 on coal will necessitate the import of significant
quantities of coal at high and volatile prices.
T&D losses: transmission and distribution losses: energy According to a Reserve Bank of India 2013
dissipated in the conductors and equipment used for
transmission, transformation and distribution of power.
report19, the Coal Imports Bill has already added
Can be described as ‘technical’ losses. a burden of US$18 billion on the country. The
Tata Mundra UMPP had to renegotiate its power
AT&C losses: aggregate technical and commercial losses:
purchase agreement with the state electricity
T&D losses plus the additional energy that is ‘lost’ in
terms of revenue to the supplier through theft, defective regulator before commissioning due to a
metering and errors in estimating unmetered supplies. four‑fold increase in the price of coal imported
from Indonesia.
The magnitude of the problems that prevent
the benefits of electrification from being One reason why power from coal will not deliver
realised for the majority reveal the fallacy of electricity for all is that the technology relies on
relying on increased coal-fired generation a system of highly centralised generation. In
and grid connections to deliver electricity the medium term, many communities will be
access. A balanced strategy is needed to too remote to connect to the grid at reasonable
drive improvements in availability, reliability cost. The needs of these communities call for
and quality which are necessary to deliver full the promotion of decentralised electricity supply
electricity access to the entire population. systems such as mini-grids and solar home
systems. Renewable energy sources such as solar,
small hydro and biomass are well suited to off-grid
systems and are low-cost and locally available.
153. Social and Environmental
Impacts of Coal Mining and
Coal Power Plants
The mining, processing, transportation and to the global phenomenon of climate change
burning of coal and the disposal of coal waste through their greenhouse gas emissions.
are polluting, wasteful, and harm the poor To add to the injustice, the communities who
or indigenous communities where they take bear the brunt of pollution, health hazards and
place. This is a form of social and environmental degraded lands often do not reap the benefit,
injustice as poor communities often have fewer as electricity and other resources derived from
resources with which to protect their lands and coal are transported out of the area to power
livelihoods. Threats to these communities from cities and industry elsewhere.
coal mining include population displacement,
polluted or depleted water sources and the A 2013 World Bank report provides an
loss of livelihoods through deforestation. Coal overview of the staggering impacts of growth
power plants also deplete and pollute water based on fossil fuel-derived energy on the
sources. Power plants have more widespread economy, the environment and society.
health implications through their emissions of Figure 8 shows the estimated costs of six
toxic substances and particulates, and contribute types of environmental degradation.
Figure 8: Annual cost of environmental degradation in India20
1200
1000
800
Billion Rupees
600
400
200
0
Outdoor air Indoor air Crop land Water supply Pastures Forest
pollution pollution degradation sanitation degradation degradation
& hygiene
The report has estimated the total annual in 2009, which is equivalent to 5.7 per cent of
cost of environmental degradation in India to GDP21. The worst contributor was outdoor air
be in the region of Rs. 3.75 trillion (US $80 billion) pollution arising from particulate matter.
163. Social and Environmental Impacts of Coal Mining and Coal Power Plants
Power plants have widespread health implications
through their emissions of toxic substances and
particulates, and contribute to the global phenomenon of
climate change through their greenhouse gas emissions.
3.1. Impacts of coal mining Communities and displacement
An estimated 21 million people have been
Land degradation and deforestation displaced by development projects between
Coal mining and related activities are 1951 and 1991.23 Mining of all minerals has
responsible for the temporary and permanent been the second-largest cause of displacement
degradation of the land around which they (after irrigation and hydropower), with an
are sited. Four relatively small states – Odisha, estimated 2.55 million people displaced,
Jharkhand, Chhattisgarh and West Bengal of whom 55 per cent are members of
– account for the majority of India’s coal scheduled tribes.24 A new law, The Right to
production. Potential land use conflicts are Fair Compensation and Transparency in Land
already making the development of new coal Acquisition, Rehabilitation and Resettlement Act,
mines and distribution infrastructure difficult. 2013, has now come into force to improve the
way land is acquired and how the populations
The granting of ‘forest clearances’ (permission affected are compensated and resettled.
to clear forest) is evidence of the scale of
destruction. In India’s latest Five Year Plan period But even with better resettlement and
(2007-11), forest clearances were granted, fully rehabilitation provision, displaced people
or in principle, for the ‘diversion’ of 31,500 still face multi-dimensional human, social and
hectares (ha) of forest for coal mining.22 economic impacts, including breakdown of
This represents a significant acceleration family and community structures, exacerbated
compared to the preceding plan period class and caste conflicts, increased vulnerability
(2002‑07), when less than 30,000 ha were of women, children and the elderly, loss of
approved for all mining projects, not just coal. livelihoods and deterioration of the local
economic situation due to disruption.25
Deforestation is most severe where surface coal
is mined, but underground mines nevertheless Impacts on water resources
require a significant land area for infrastructure, The mining and washing of coal and associated
coal storage and waste disposal. Forest cover activities significantly impact water resources.
loss from large-scale coal mining in central This is of particular concern as many coal mines
and eastern India has negatively impacted are in regions with water scarcity.26 Opencast
the survival of wildlife, especially tigers and mines can affect the level of underground
elephants. It is important to preserve these aquifers in surrounding areas, while runoff
forests not only for their flora and fauna but from mines and coal washeries can result
also because they have served as homes in significant groundwater pollution.27 The
and providers of livelihoods for tribal people water runoff from coal washeries carries heavy
over centuries. metals that affect aquatic flora and fauna in
rivers, lakes and oceans. Acid mine drainage
A further problem caused by underground (the draining of acidic water resulting from
mining is land subsidence, which can damage sulphur in the coal and associated strata) can
structures in neighbouring areas. pollute local water bodies. This is an important
issue in the north-eastern coalfields, which
have high sulphur content.
173. Social and Environmental Impacts of Coal Mining and Coal Power Plants
Mining and transporting the vast tonnage of coal used
creates significant hazards, both to workers and the
public, through emissions of mercury and other toxic
constituents within unburned coal
The regulatory framework governing the However air pollution from coal burning is
impacts of mining on water systems remains thought to create the largest health burdens
unchanged since 2005. Furthermore, authorities in terms of heart and respiratory diseases. The
have extremely low capacities to monitor and major killer among the air pollutants from coal
enforce the conditions on which environmental combustion is PM2.529 (particles smaller than
clearances were granted, while mining and 0.0025mm in diameter), which due to their
electricity companies exert lobbying pressure extremely small size are able to travel deep
on the authorities to go slow on regulating into the respiratory tract and reach the lungs.
environmental conditions. Excessive exposure to these particles affects
lung function and also causes asthma and
3.2. Impacts of coal power plants heart disease.30 A study by Greenpeace India
Coal-fired power comes with significant costs to and Conservation Action Trust estimates the
environment and human health. Fly ash residue monetary cost for India of premature mortality
and pollutants settle on and contaminate soil, due to PM pollution to be in excess of INR 160
being especially harmful to agricultural activities. billion to 230 billion (US$3.3-4.6 billion) per
year. Table 2 gives an overview of the estimated
Combustion of coal releases emissions of annual health impacts and health costs of PM
sulphur dioxide (SO2), nitrogen oxides (NOx), pollution across several effect categories.31
particulate matter (PM), carbon monoxide
(CO), volatile organic compounds (VOCs), and The worst air pollution impacts are felt over
various trace metals such as mercury, which can the states of Delhi, Haryana, Maharashtra,
disperse over large areas. Chronic and acute Madhya Pradesh and Chhattisgarh, the Indo-
exposure to these pollutants has health impacts Gangetic plain, and most of central India.
that include respiratory illnesses, compromised Adverse impacts are especially severe for elderly
immune systems, cardiovascular conditions and people, children and those with respiratory
premature death. disease. In addition, the poor, minority groups,
and people who live in areas downwind
While India has some regulations for thermal of multiple power plants are likely to be
power plant discharges and fly ash storage, the disproportionately exposed to the health risks
implementation and monitoring of adherence to of fine particle pollution. As shown in Figure
these regulations is a huge challenge. In 2006- 9, the plume of particulate matter over India
07, 28 per cent of plants failed to comply.28 coincides with the locations of coal mining
and thermal power plants. Acid rain-causing air
Local health impacts pollution and scattered fly ash also contaminate
Mining and transporting the vast tonnage water and vegetation in the surrounding forests
of coal used creates significant hazards, both and other habitats.
to workers and the public, through emissions
of mercury and other toxic constituents within
unburned coal.
183. Social and Environmental Impacts of Coal Mining and Coal Power Plants
Children collect
cenosphere, a
byproduct of coal
combustion, from an
ash pond at Bhusawal
thermal power station,
Maharashtra. Villagers
work long hours to
collect cenosphere
to sell to private
companies. The ash
pond is close to water
sources that villagers
depend on for water
for household use
and farming. Toxic
fly ash residue can
pollute water and soil,
and regulations for
its management are
poorly enforced.
© Zishaan Latif/
Greenpeace
Table 2: Estimated annual health impacts and associated costs due to PM pollution from coal32
Effect Number of people Health costs Health costs
affected (in million rupees)* (million US$)**
Total premature mortality 80,000 to 115,000 160,000-230,000 3300-4600
Child mortality (under 5) 10,000 21,000 420
Respiratory symptoms 625 million 62,000 1200
Chronic bronchitis 170,000 9,000 170
Chest discomforts 8.4 million 1700 35
Asthma attacks 20.9 million 21,000 420
Emergency room visits 900,000 3,200 60
Restricted activity days 160 million 80,000 1600
** Applied conversion rate of 1US$ = 50 rupees
193. Social and Environmental Impacts of Coal Mining and Coal Power Plants
Several studies have found that surface and groundwater
around thermal power plants is contaminated with
leachates, heavy metals and other poisonous effluents
Figure 9: Areas affected by PM 2.5
PM2.5
μg/m3
35
8
30
6
25
4
20
2
15
Arabian Sea Bay of Bengal
0
Andaman Sea
10
Indian Ocean
70 75 80 85 90 95
Impacts on water resources Mission estimates that thermal power plants in
Thermal power generation is an extremely India consume approximately 35 billion cubic
water intensive process. Water is used heavily metres of water annually, which accounts for
for washing coal and in the cooling towers of 87.8 per cent of total industrial water use.33
the plants. Large quantities of water are also Another study estimated the consumption
used for carrying ash from the plants to the of various power generation technologies in
ash ponds or pits. Several studies have found 2005 and projected future consumption in
that surface and groundwater around thermal 2020 and 2035, with steep increases expected
power plants is contaminated with leachates, from coal, hydro and geothermal power. These
heavy metals and other poisonous effluents. projections are shown in Figure 10, which
This excessive consumption and contamination clearly demonstrates that thermal generation
leads not just to water pollution but also to the technologies (including coal, gas and nuclear
eventual destruction of the water table. power plants) use many times more water than
India’s most promising non-hydro renewable
A report from the Federation of Indian energy sources: wind and solar.
Chambers of Commerce and Industry Water
203. Social and Environmental Impacts of Coal Mining and Coal Power Plants
Figure 10: Water consumption projections for various power generation technologies34
Wind and solar
Hydro and
geothermal
Sources of energy
Nuclear
Biomass
and wastes
Oil
Gas
Coal
2035 0 5 10 15 20 25 30
2020
Water consumption in billion cubic metres
2005
In light of the above, it is pertinent to look at
the water stress levels in regions that have the
highest concentration of coal-fired power plants.
Figure 11 shows that many coal-fired power
plants are located in areas that suffer from water
scarcity and stress, and even areas defined as
suffering from ‘absolute scarcity’ (with less than
500 cubic metres of water per person per year).
Thermal generation technologies (including coal, gas and
nuclear power plants) use many times more water than
India’s most promising non-hydro renewable energy
sources: wind and solar.
213. Social and Environmental Impacts of Coal Mining and Coal Power Plants
Figure 11: Water stress levels of major river basins in India35
Indus
Pakistan
Nepal
Brahmaputra
WFR Ganga BangladeshBarak
incl
Sabarmati
Luni
Mahi Narmada
Subernarekha
Tapi Mahanadi Brahmani and Baitarani
Godavari EFR
Krishna EFR Sources: Water scarcity
WFR
EFR Bay of Bengal map developed by the
Water and Resources
Arabian Sea Pennar Institute using Central
EFR Water Commission
WFR (2010) and IDFC
Cauvery Per capita water availability (2010) (2011) data;
and power plant
EFR Absolute scarcity [1700 m3] Strategies (IGES) using
Based on Falkenmark Index
[derived from average annual surface water potential] the Global Energy
Thermal power plants
EFR: East Flowing River Observatory
WFR: West Flowing River Basin database.
Besides chemical pollution and water extraction, CO2 emissions come from coal power stations.
coastal power plants have been found to These emissions (1.7 billion tonnes in 2011)36
adversely affect marine ecosystems through make India the third largest emitter of CO2 after
the release of hot water into the sea. This affects China and the US, with emissions expected to
fishermen and communities which depend on grow significantly over the next two decades.
the sea for their livelihoods.
Figure 12 shows how these emissions are shared
Climate change across the coal power producing states. The five
Globally, coal power plants are the biggest states with the greatest coal generation capacity
source of manmade carbon dioxide (CO2) also have the highest CO2 emissions.
emissions. In India up to 40 per cent of current
India’s rural population of nearly 700 million directly
depends on climate-sensitive sectors and natural
resources for their subsistence and livelihoods
223. Social and Environmental Impacts of Coal Mining and Coal Power Plants
Figure 12: Estimated emissions from coal power plants by state37
80
70
Emissions from coal power plants
[Millions of tonnes of CO2]
60
50
40
30
20
10
0
sh
h
tB h
ah gal
a
h
t
u
sa
n
Ha b
a
Jh ihar
d
hi
ra
hy shtr
an
ad
ha
es
r
es
a
an
el
ga
ris
de
a
nj
en
ad
ad
D
ry
st
uj
B
il N
kh
Pu
O
s
a
ra
ja
G
tti
ar
Pr
Pr
ar
rP
Ra
m
ha
es
ra
a
Ta
ta
Ch
W
M
dh
Ut
ad
An
M
India’s rural population of nearly 700 million development and the dilution of regulation
directly depends on climate-sensitive sectors have had predictable consequences. Today, two
(agriculture, forests and fisheries) and natural decades after the Act was passed, environmental
resources (water, biodiversity, mangroves, clearances continue to be given despite
coastal zones, grasslands) for their subsistence opposition from communities and NGOs.
and livelihoods. Farmers, forest dwellers, fisher-
folk, and nomadic shepherds have very low The Environment Protection Act, 1986 and
capacity to adapt to changes in the climate.38 rulings of various courts have ensured that EIA
Sea level rise and storm surges (made more reports have to be accessible to the public
likely by manmade climate change) risk causing before a public hearing. However, the reports
saltwater intrusion in coastal areas, damaging are mostly published in English, a language
agriculture and degrading groundwater that 99 per cent of the tribal population does
quality. Abrupt changes to the monsoon cycle not understand, and hence it is very difficult for
could precipitate major crises, triggering more villagers or tribal communities to decipher the
frequent droughts as well as greater flooding in impacts on their lives and environment. It can be
large parts of India. argued that the manner in which the EIA reports
are published actively discourages people from
3.3. Coal and community participating in the process.
self‑determination
India adopted the Environment Impact In January 2014, the Ministry of Environment
Assessment (EIA) Notification Act of and Forests passed an order allowing existing
1994 as a way to formally address social coal mines of a certain size to expand their
and environmental concerns as part of capacity by up to 50 per cent without being
environmental decision making. Nevertheless, obliged to conduct public hearings with affected
over the years the prioritisation of infrastructure communities, currently the only formal means
233. Social and Environmental Impacts of Coal Mining and Coal Power Plants
of consultation. As public opposition to specific the EIA process, but also of the public views
projects is becoming increasingly intense – regarding development on their lands.
leading to such incidents as police firing on
demonstrators – it is growing more evident Despite sound legislative, administrative
that the peoples’ voices and choices are not and procedural set-up, EIA has not yet
being heard. evolved satisfactorily in India. EIA is used as
a project justification tool rather than as a
Analysis by the Delhi-based EIA Resource and tool to contribute to achieving sustainable
Response Center shows that none of the coal development. A proper public consultation
power projects or coal mines that were up process can add value to development projects,
for environmental clearance have ever been not erode them, and give people choices about
rejected or declined by the expert committee. the kind of projects they want in their vicinity.
This fact shows a complete disregard of not only
As public opposition to specific projects is becoming
increasingly intense – leading to such incidents as police
firing on demonstrators – it is growing more evident
that the peoples’ voices and choices are not being heard.
244. Decentralised renewable
energy: a win-win solution
for communities
Historically, renewable energy technologies decentralised off-grid renewable electricity
have been perceived as expensive and indicates the reverse. In grid-connected
inefficient, making energy users – both on-grid context, renewable sources are now able
and off-grid – dependent on natural systems to compete successfully with conventional
beyond human control. However, a detailed electricity generation in India due to a policy
analysis of the actual cost of generation that gives a rebate on transmission costs for
from conventional systems compared with renewable electricity generation.
Figure 13: Cost comparison of low carbon solutions with high carbon, business as usual, energy projects39
30
25
Cost of Generation (in Rupees)
20
15
10
5
0
1 km 5 km 15 km 20 km
Distance from grid (km)
100% Domestic coal olar PV
S
Blend of imported and domestic Biomass
coal at a ratio of 30:70 Wind
Blend of imported and domestic Micro‑hydro
coal at a ratio of 50:50
Blend of imported and domestic
coal at a ratio of 90:10
Figure 13 shows the costs associated with large hydro) to the installed electrical generation
generation, transmission and distribution based capacity has jumped from a mere 13 GW in
on distance from the grid for electricity from a 2010 to 32 GW in March 2014. The breakdown
variety of renewable energy sources as well as a of this total by technology is given in Table
range of coal fuel blends (domestic coal being 3. However, these totals are well below even
significantly cheaper than imported coal). the most conservative estimates of renewable
The total contribution of renewables (excluding energy’s potential.
254. Decentralised renewable energy: a win-win solution for communities
Table 3: Renewable energy capacity by source, By focusing on increasing generation capacity
March 201440 by bringing new coal power plants online,
the Indian government is missing the boat
Energy Source Installed
as regards the other benefits that India’s
capacity
huge renewable energy potential can bring.
Wind 21 GW Development of renewable energy sources
can increase energy security in the long
Small hydro 4 GW term by diversifying supply, reducing import
dependence and mitigating fuel price volatility.
Biomass 4 GW Conversely, at current usage coal reserves
(including bagasse cogeneration)
are projected to be depleted in 45 years and
Solar 3 GW the increase in demand for coal throughout
Asia is expected to drive global coal prices
Total 32 GW ever upwards.
The Indian government has set a target of The promotion of renewable energy can also
increasing renewable energy installed capacity be an important tool for regional economic
by a further 40 GW by 2022.41 However, development within India. Many of the states
renewable sources account for just 12.25 per endowed with rich renewable energy potential
cent of India’s energy generation at present.42 (Arunachal Pradesh, Himachal Pradesh, Orissa,
Accelerating the use of renewable electricity is Uttarakhand) lag in economic development.
indispensable if India is to meet its commitments Investing in renewable energy in these states
to reduce carbon intensity. On average, every can promote local industrial development and
1 GW of additional renewable energy capacity generate additional state income through the
reduces CO2 emissions by 3.3 million tonnes sale of renewable energy trading certificates
a year.43 Local ancillary benefits in terms of to other states.
reduced mortality and morbidity from lower
particulate concentrations are estimated at The coal industry is a major employer in India.
334 lives saved for each million tonnes of However, a system based on the exploitation of
carbon abated. renewable energy has the potential to generate
even more jobs. Furthermore, these jobs would
be inherently long term and sustainable, unlike
employment associated with domestic coal.
265. Conclusion
Many policymakers see coal as the ‘go to’ other development indicators, but don’t even
energy source for India’s economic future. Coal benefit in terms of increased electrification.
is sometimes called the ‘poor people’s resource
for energy access’. The huge cost this dirty The pursuit of social justice, including gender
resource incurs on communities, environment equity, drives policymakers and investors to
and the climate is often overlooked, as is its promote increased energy access. In parallel, the
inability to meet India’s long-term energy needs. development of social justice plays a paramount
Destruction and damage attend every stage of role in the achievement of energy access. Thus,
the life cycle of coal power, starting with mining, efforts to bring improved energy services to the
which causes widespread deforestation, soil poor don’t only have to enhance the supply of
erosion, water shortages and pollution. energy, they also have to include programmes
and policies that provide an enabling
Burning coal in thermal power stations leaves environment in terms of economic, financial,
a similar trail of harm, leaving a permanent cultural and institutional factors. Past experience
mark on water bodies, soil, and human life has shown that increasing installed capacity of
while emitting colossal volumes of greenhouse power generation alone cannot achieve energy
gases. Many power plants operate in areas of access; rather, this objective requires a localised
high water stress, their appetite for cooling approach and the selection of renewable
water taking away life-sustaining resources energy. Some specific recommendations for
from local communities and destroying farmers’ securing a clean and equitable energy future for
livelihoods. Pollutants from chimneys threaten India’s poor, without harming the environment
public health; fine dust particles are a major or human health (including through climate
cause of lung disease. change), are given below:
Many of India’s coal mines and power Diversification of energy sources: It is
•
plants are located in areas inhabited by important not to rely too heavily on coal as
tribal people and populations belonging to a primary source of electricity generation.
scheduled castes. The negative impacts of This is critical given that the Indian coal-
coal exploitation leave the social fabric of such fired power plants are already being run
areas vulnerable to total breakdown. Once coal on imported coal, and the idea of coal as a
resources are depleted, communities are left domestically-available and cheap resource
with abandoned mines and devastated lands. no longer holds ground. Even a pure
economic analysis shows the imperative for
While the costs with respect to the environment India to invest in renewable energy, and both
and climate change can be estimated in grid and off-grid solutions.
monetary terms, it is impossible to attach
a cost to the social destruction wreaked by Mainstreaming robust cost-benefit analysis
•
coal mining and use in power plants. In India, of coal extraction and burning, inclusive
the main argument for coal extraction and of social and environmental costs, and
burning is its potential to deliver much-needed similar analysis for alternative options for
increases in energy access. The evidence electricity generation. Costs factored into
outlined in this report shows that the states with the analysis would include the displacement
coal mines and power plants not only tend to of communities and impacts on health
report below average per-capita income and and livelihoods.
275. CONCLUSION
Developing transparent and consultative
• nationwide carbon tax which applied to coal
institutional and governance frameworks: consumption. The rate was set at 50 rupees
Existing requirements for the consultation (US$1.07) per tonne of coal produced in
processes that should accompany the or imported to India. The revenue raised is
awarding of environmental and forest earmarked for the National Clean Energy
clearances are ineffective. It is important Funds for research and innovation in clean
to institute a transparent and consultative energy technologies and environmental
environmental decision-making process remedial programmes. These taxes will be
which follows a bottom-up approach. more effective if they more closely reflect the
true cost of coal. In many cases, this would
Public participation is a means of enabling make the extraction and burning of coal
citizens to provide inputs once basic prohibitively expensive. Meanwhile, the cost
transparency norms are established and of renewable energy generation would be
implemented. New requirements for public untaxed and expected to fall and fall.
participation are needed, and those which
are already legally mandated must be Shifting coal subsidies: The Indian
•
implemented in earnest. In the coal sector, government spends approximately US$19
this would be applicable in at least the billion on energy subsidies annually,44
following situations: commonly citing two main justifications:
the promotion of overall economic
• Meaningful public participation regarding development and the targeting of benefits
starting new mines in a particular area to poorer members of the population. The
and rehabilitating citizens in that area; extent to which subsidies achieve either
of these ends is highly questionable. It
• Involving citizens in the monitoring of is critically important to remove those
on-going projects to ensure that local subsidies and use the money to deploy and
environmental damage is minimised scale up renewable energy technologies,
and, where unavoidable, adequately which will be cheaper for the country in an
compensated for. economic sense and more beneficial socially
and environmentally.
Reaping the benefits of energy efficiency:
•
Before adding more coal-based generation Stop investing in obsolete technologies:
•
capacity, it is vital that India first prioritises Continued investments in coal fired power
energy efficiency, energy conservation plants is sure to become an economic,
and loss reduction, particularly in the social and climate liability in the medium to
transmission and distribution system. long period and therefore, policy makers
need to factor in this aspect in any energy
Offering equity: Affected people can be
• planning exercise and plan its investments
offered a financial share in the coal projects accordingly. With the falling prices of
for which their land has been acquired. This alternate and clean sources of energy,
will ensure that they continue to receive the particularly that of solar, coupled with rising
benefits of the development taking place on prices of coal, there is already a trend setting
their land. It would also reduce the pressure in, where the role of coal in the energy mix
on economically displaced people to take is already started to fall. This trend is likely
hazardous jobs in the mining sector. to reach the level of coal having a very little
role to play in a low carbon world. From an
Implementing a robust carbon tax
• Indian perspective, it is all the more a reason
on coal: In 2010, India established a for its energy planners to look at alternate
28You can also read