FAILURE TO ACT INFRASTRUCTURE - THE ECONOMIC IMPACT OF CURRENT INVESTMENT TRENDS IN - SEC.gov
←
→
Page content transcription
If your browser does not render page correctly, please read the page content below
FAILURE TO ACT
THE ECONOMIC IMPACT
OF CURRENT INVESTMENT TRENDS IN
ELECTRICIT Y
INFRASTRUCTURE

This report was prepared for the
American Society of Civil Engineers
by Economic Development Research
Group, Inc. in association with
La Capra Associates.

The report was funded by a generous
grant from the ASCE Foundation.

American Society of Civil Engineers
1801 Alexander Bell Drive
Reston, Virginia, 20191-4400
World Headquarters

101 Constitution Avenue, NW
Suite 375 East
Washington, DC 20001
Washington Office

reportcard@asce.org
www.asce.org/failuretoact

Economic Development Research Group, Inc.
2 Oliver Street, 9th Floor
Boston, MA 02109

www.edrgroup.com

La Capra Associates
One Washington Mall, 9th Floor
Boston, MA 02108

www.lacapra.com

Copyright © 2011 by the American Society of Civil Engineers.
All Rights Reserved.
ELECTRICITY

      ★| CONTENTS
        2 | List of Figures and Tables
        3 | Preface
        4 | Executive Summary

      11 | Section 1 INTRODUCTION
      15 | Section 2 OVERVIEW OF THE ELECTRICITY INFRASTRUCTURE
      20 | Section 3 SUPPLY AND DEMAND
      24 | Section 4 THE POTENTIAL INVESTMENT GAP
      38 | Section 5 THE COST INCURRED BY A FAILURE TO INVEST
      42 | Section 6 ECONOMIC IMPACTS
      46 | Section 7 CONCLUSIONS

      48 | About the Study
      49 | Endnotes
      51 | References
      52 | Acknowledgments
      53 | About EDR Group and La Capra Associates
              A technical appendix is separately available at
              www.asce.org/failuretoact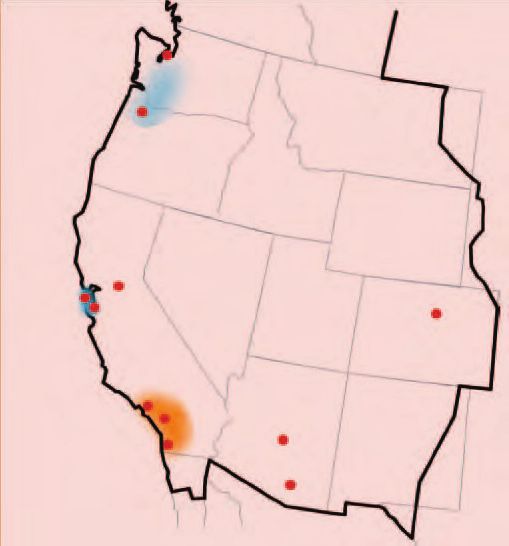
Tables
                                                          1 Annual Average Construction Expenditures
                                                            for Generation, Transmission, and Distribution:
                                                            2001–10
                                                          2 National Electricity Infrastructure Gap:
    ★| FIGURES AND TABLES                                   Estimated at $107 Billion by 2020
                                                          3 Regional Breakdown of Electric Distribution
        Figures                                             Investment Gap, 2020 and 2040

     1 Elements of Generation, Transmission, and          4 Cumulative Impacts by Region, 2012, 2012–20,
       Distribution Systems                                 and 2012–40
     2 Projected Needs and Gap by Year Compared           5 Effects on U.S. GDP and Jobs, 2011–40
       with 2001–10 Average Investment Levels             6 U.S. Demand for Electric Energy Is Expected
     3 NERC’s Regional Entities                             to Increase 8% between 2011 and 2020
     4 Fuel Source of U.S. Electricity Generation, 2009   7 Construction Expenditures for Generation,
                                                            Transmission, and Distribution: 2001–10
     5 The U.S. Electricity Transmission Grid
                                                          8 Projected Needs and Gap by Year Compared
     6 Map of Congested Paths in Electric
                                                            with 2001–10 Average Investment Levels
       Transmission Systems
                                                          9 Proportion of Reliance on Electricity Generation
     7 Comparison of NERC and EIA Projections
                                                            Technologies by Region
       for U.S. Summer Capacity, through 2040
                                                          10 Additions of New Capacity Expected by Region
     8 NERC Projection of Planning Reserve Margins
                                                             for Electricity Generation Technologies
       by Region, 2011–21
                                                          11 Projected Changes in U.S. Electric Energy
     9 NERC Projection of Planning Reserve Margins
                                                             Demand, 2010, 2020, and 2040
       by Region, 2021–40
                                                          12 Peak Demand Projections, 2010, 2011, 2020, and 2040
     10 Actual and Planned Transmission Infrastructure,
        1990–2015                                         13 Generation Supply Forecast—National Aggregations
     11 Distribution Expenditures from 1980 Show          14 Electric Generation Investment Gap: Estimated
        Compound Annual Growth Rates of 1.5% to 2%           at $12 Billion by 2020 and $401 Billion by 2040
     12 Distribution Additions, NERC Regions’ Share       15 Electric Transmission Investment Gap: Estimated
        of the National Total, 2001–9                        at $37 Billion by 2020 and $112 Billion by 2040
     13 Electricity Intensity by Industry                 16 Electric Distribution Investment Gap: Estimated
                                                             at $57 Billion by 2020 and $219 Billion by 2040
                                                          17 Regional Breakdown of Electric Distribution
                                                             Investment Gap, 2020 and 2040
                                                          18 Average Cost of Power Interruptions per
                                                             Household and per Business
                                                          19 Comparison of Annual Impacts of Inadequate
                                                             Electricity Delivery, Selected Study Years
                                                          20 Cumulative Impacts by Sector, 2012, 2012–20,
                                                             and 2012–40
                                                          21 Job Losses by Sector, 2020 and 2040

2                                                                           !"#$%&'()*%$"+,(*-(.$/$0(1'2$'""#3
★| PREFACE
The purpose of the Failure to Act report series
is to provide an objective analysis of the eco-
nomic implications for the United States of its
continued underinvestment in infrastructure.               The focus of this report is on electricity,
The reports in the series assess the implications       including generation, transmission, and the
of present trends in infrastructure investment          distribution infrastructure that provides elec-
for the productivity of industries, national            tricity to our nation’s homes and businesses.
competitiveness, and the costs for households.          Most elements of electricity infrastructure are
The Failure to Act series analyzes two types            privately owned and publicly regulated utilities.
of infrastructure needs:                                   This is the third report in ASCE’s Failure
                                                        to Act series. The first report, Failure to Act:
1. Building new infrastructure to service               The Economic Impact of Current Investment
   increasing populations and expanded                  Trends in Surface Transportation Infrastructure,
   economic activity; and                               encompasses highways, bridges, rail, and
2. Maintaining or rebuilding existing infra-            transit. The second report, Failure to Act: The
   structure that needs repair or replacement.          Economic Impact of Current Investment Trends in
                                                        Water and Wastewater Treatment Infrastructure,
Every four years, the American Society of Civil         addresses the delivery of potable water and
Engineers (ASCE) publishes The Report Card              wastewater treatment. The next report will
for America’s Infrastructure, which grades the          address airports and marine ports.
current state of 15 national infrastructure
categories on a scale of A through F. ASCE’s
2009 Report Card gave the nation’s energy
infrastructure a D+. The present report answers
the question of how the condition of the U.S.
infrastructure system affects our nation’s
economic performance. In other words, how
does a D+ affect America’s economic future?

4&$05#"(+*( %+6(78"(1%*'*!$%(9!:&%+(*-(.5##"'+(9'/"3+!"'+(7#"';3($'(10"%+#$%$+,(9'-#&3+#5%+5#"              3
EXECUTIVE SUMMARY
This report illustrates the importance of electric The aging of equipment explains some of
power generation, transmission and distribution the equipment failures that lead to intermittent
systems to the national economy. The analysis failures in power quality and availability. The
performed focuses on a trend scenario that capacity of equipment explains why there are
presumes the mix of electricity generation some bottlenecks in the grid that can also lead
technologies (e.g. electricity generation from to brownouts and occasional blackouts. These
oil, natural gas, coal, nuclear, hydro, wind, solar) concerns make it critical to understand what
continues to evolve as reflected in recent trends, investments may be needed to keep the system in
including a long-term evolution towards smart a state of good repair, and what implications any
grid technologies.1 shortfall could have on the nation’s economy.
During the past decade, electric energy infra-
Context structure has improved through an upturn in
Electricity relies on an interconnected system investment, and the negative economic impacts
that is composed of three distinct elements, noted in studies of 10 and 20 years ago have been
as described below and illustrated by Figure 1: partially mitigated. However, more investment is
needed to further reduce the incidence of service
1. Generation facilities—including approximately disruptions to households and businesses. The
5,800 major power plants and numerous needs to maintain and update existing electric
other smaller generation facilities;2 energy infrastructure, to adopt new technologies,
2. High-voltage transmission lines—a network of and to meet the demands of a growing population
over 450,000 miles that connects generation and evolving economy over the next 30 years will
facilities with major population centers;3 and impose significant requirements for new energy
3. Local distribution systems that bring electric infrastructure investment.
power into homes and businesses via over-
head lines or underground cables. The first Projected Demand for Electricity
two elements are usually referred to as the In the near term, there is close to adequate
bulk power system. capacity to meet demand. Over the short term
from 2011 through 2020, national growth in
The United States’ system of generation, trans- generation is expected to be 8% and demand
mission and distribution facilities was built over for electricity in all regions is expected to
the course of a century. Centralized electric average 8% or 9% based on projections from
generating plants with local distribution net- the U.S. Energy Information Agency. Divergence
works were started in the 1880s and the grid of across different areas in the United States is
interconnected transmission lines was started in not expected until the 2021-2040 period. Over
the 1920s. Today, we have a complex patchwork the long-term there is expected to be significant
system of regional and local power plants, power regional differences as use is expected to
lines and transformers that have widely varying increase by 39% in Florida, 34% in Western
ages, conditions, and capacities. states and 20% in the Mid-Atlantic area.
4 !"#$%&'()*%$"+,(*-(.$/$0(1'2$'""#3FIGURE 1★ Elements of Generation, Transmission, and Distribution Systems
RED Generation
BLUE Transmission Substation Step
Down Transformer
PINK Distribution Subtransmission
Transmission Lines Customer 26kV
765, 500, 345, 230, and 138kV and 69kV
Generating Station
Primary Customer
13kV and 4kV
Secondary
Generating Step Transmission Customer Customer 120V
Up Transformer 138kV or 230kV and 240V
SOURCE Federal Energy Regulatory Commission, 2006.
Recent Investment Trends generation facilities varied from $18 billion to
Investment in electricity infrastructure has $72 billion, while transmission and distribution
increased in the past decade. From 2001 through investments varied from $6 billion to $10 billion
2010, annual capital investment averaged $62.9 and $17 billion to $22 billion, respectively
billion, including $35.4 billion in generation, (all dollars adjusted to 2010 value).
$7.7 billion in transmission, and $19.8 billion
in local distribution systems (in 2010 dollars). The Potential Investment Gap
The average rate of this investment is used for Electric Infrastructure
as the basis for calculating the gap between Nationally, extending current trends leads to
investment rates and expected future increases funding gaps in electric generation, transmis-
in investment needs. However, it is important to sion, and distribution that are projected to
note the widely varying annual investment levels grow over time to a level of $107 billion by
from 2001 to 2010, which ranged from $44 billion 2020, about $11 billion per year, and almost
to $101 billion. Spending for generation showed $732 billion by 2040, as shown in Table 2, and
the widest range, while distribution was the the flow of annual expenditures through 2040
most narrow in range. Over the recent ten is illustrated by Figure 2.
year period, estimated investment in electric
4&$05#"(+*( %+6(78"(1%*'*!$%(9!:&%+(*-(.5##"'+(9'/"3+!"'+(7#"';3($'(10"%+#$%$+,(9'-#&3+#5%+5#" 5Today, we have a complex patchwork system
of regional and local power plants, power lines
and transformers that have widely varying
ages, conditions, and capacities.
TABLE 1 ★ Annual Average Construction Expenditures for Generation,
Transmission, and Distribution: 2001–10 (in billions of 2010 dollars)
TYPE OF EXPENDITURES AVERAGE ANNUAL LOW ANNUAL HIGH ANNUAL
Generation 35.4 17.7 71.6
Transmission 7.7 5.6 10.2
Distribution 19.8 16.9 22.3
Average TOTAL 62.9 44.2 101.0
NOTE Low and high annual “total” expenditures represent the average total spending from 2001 to 2010, and are not sums of the annual
average expenditures of the three components of the electric infrastructure system.
SOURCES Transmission and distribution numbers from Edison Electric Institute, 2012 Report, table 9–1; generation investment
was estimated from reporting forms of the EIA and Federal Energy Regulatory Commission, with averages applied for investment
cost per kWh for applicable generating technologies.
TABLE 2 ★ National Electricity Infrastructure Gap:
Estimated at $732 Billion by 2040 (in billions of 2010 dollars)
TYPE OF INFRASTRUCTURE CUMULATIVE NEED
2020 2040
Generation 12.3 401.1
Transmission 37.3 111.8
Distribution 57.4 219.0
U.S. TOTAL 107.0 731.8
SOURCES EIA, NERC, Eastern Interconnection Planning Collaborative, Phase I Report, December 2011, Renewable Energy Transmission
Initiative Electric Power Research Institute and Federal Energy Regulatory Commission. Calculations by La Capra Associates and EDR Group.
6 !"#$%&'()*%$"+,(*-(.$/$0(1'2$'""#3Projected Needs and Gap by Year Compared with
FIGURE 2★ 2001–10 Average Investment Levels (in billions of 2010 dollars)
120
100
80
60
40
20
0
2012
2013
2014
2015
2016
2017
2018
2019
2020
2021
2022
2023
2024
2025
2027
2028
2029
2030
2031
2032
2033
2034
2035
2036
2037
2038
2039
2040
2026
■ Additional Need ■ Base
SOURCE EIA Annual Energy Outlook 2011 (years 2008-2035) and NERC 2011 Long-term Reliability Report, Eastern Interconnection
Planning Collaborative, Phase I Report, December 2011, Renewable Energy Transmission Initiative Electric Power Research
Institute and Federal Energy Regulatory Commission. Calculations by La Capra Associates and EDR Group
TABLE 3 ★ Regional Breakdown of Electric Distribution Investment Gap,
2020 and 2040 (billions of 2010 dollars)
REGION CUMULATIVE GAP ESTIMATE BY REGION
2011–2020 2011–2040
Texas 14.6 56.0
Florida 4.2 18.2
Midwest 4.4 45.3
Northeast 8.0 51.2
Mid-Atlantic 18.2 130.3
Southeast 29.7 225.6
Southwest 2.4 9.2
West 25.5 196.0
U.S. Total 107.0 731.8
NOTE Regional descriptions are approximations of NERC Regions.
SOURCE EIA Annual Energy Outlook 2011 (years 2008-2035) and NERC 2011 Long-term Reliability Report.
4&$05#"(+*( %+6(78"(1%*'*!$%(9!:&%+(*-(.5##"'+(9'/"3+!"'+(7#"';3($'(10"%+#$%$+,(9'-#&3+#5%+5#" 7In 2020, distribution and transmission infra- and the Mid-Atlantic area, and lowest in the
structure are expected to account for more than Southwest and Florida. Growth alone does not
88% of the investment gap while generation appear to be driving the gap, but rather a combi-
infrastructure represent roughly 11.5%. By 2040, nation of supply, technologies, and demand.
however, generation infrastructure is potentially
the most costly element of the gap, accounting Estimate of Future Costs Incurred
for 55% of the total, with transmission account- A projected investment gap will be some
ing for 15%, and distribution accounting for 30%. combination of aging equipment and capacity
This is a reversal from 2020, when generation bottlenecks that lead to the same general
is expected to be the best funded element of outcome—a greater incidence of electricity
electricity infrastructure. interruptions. The interruptions may occur
The cumulative total investment gap adds the in the form of equipment failures, intermittent
generation, transmission, and distribution infra- voltage surges and power quality irregularities
structure gaps. Those results are shown by region due to equipment insufficiency, and/or blackouts
in Table 3, and indicate that the investment fund- or brownouts as demand exceeds capacity
ing gap will be highest in the Southeast, the West, for periods of time. The periods of time can
be unpredictable in terms of frequency and
length, but the end result is a loss of reliability
in electricity supply which imposes direct costs
to households and businesses.
TABLE 4 ★ Cumulative Impacts by Region, 2012, 2012–20, and 2012–40
(in billions of 2010 dollars)
REGION 2012 CUMULATIVE, 2012–20 CUMULATIVE, 2012–40
Florida 0.7 8 32
Midwest 0.8 9 59
Northeast 2.0 17 79
Mid-Atlantic 3.0 36 194
Southeast 5.0 59 297
Southwest 0.5 6 18
Texas 0.5 18 80
West 4.0 44 239
TOTAL 17 197 998
SOURCES Calculations by La Capra and EDR Group based on data from EIA and Electric Power Research Institute.
8 American Society of Civil EngineersTABLE 5 ★ Effects on U.S. GDP and Jobs, 2011–40
ANNUAL IMPACTS 2020 2040
GDP -$70 billion -$79 billion
Jobs -529,000 -366,000
Business Sales -$119 billion -$159 billion
Disposable Personal Income -$91 billion -$86 billion
AVERAGE YEAR 2012–2020 2021–2040
GDP -$55 billion -461,000
Jobs -461,000 -588,000
Business Sales -$94 billion -$180 billion
Disposable Personal Income -$73 billion -$115 billion
CUMULATIVE LOSSES 2012–2020 2021–2040
GDP -$496 billion -1.95 trillion
Jobs NA NA
Business Sales -$847 billion -$3.6 trillion
Disposable Personal Income -$656 billion -$2.3 trillion
NOTE Losses in business sales and GDP reflect impacts in a given year against total national business sales and
GDP in that year. These measures do not indicate declines from 2010 levels.
SOURCES EDR Group and LIFT model, University of Maryland, INFORUM Group, 2012.
A failure to meet the projected gap will cost These costs incurred by failing to close the
households $6 billion in 2012, $71 billion by 2020, investment gap are higher than the investment
and $354 billion by 2040. It will cost businesses itself. This means that it is economically ineffi-
$10 billion in 2012, $126 billion by 2020, and $641 cient for households and businesses to allow this
billion by 2040. Annual costs to the economy will higher cost scenario to occur. Even if sufficient
average $20 billion through 2020 and $33 billion investment is made to close the investment gap,
through 2040. It is notable that these estimated the result will not be a perfect network for elec-
impacts are significantly lower than the impacts tricity generation and delivery, but rather one that
estimated from studies conducted in the 1990s has dramatically reduced, though not eliminated,
and 2000s. power quality and availability interruptions.
4&$05#"(+*( %+6(78"(1%*'*!$%(9!:&%+(*-(.5##"'+(9'/"3+!"'+(7#"';3($'(10"%+#$%$+,(9'-#&3+#5%+5#" 9income from other uses and a reduction in the
competitiveness of U.S. businesses in world
economic markets.
As costs to households and businesses asso-
ciated with service interruptions rise, GDP will
fall by a total of $496 billion by 2020. The U.S.
economy will end up with an average of 529,000
fewer jobs than it would otherwise have by
A projected investment gap will be some 2020. As shown in Table 5, even with economic
combination of aging equipment and adjustments occurring later on, with catch-up
capacity bottlenecks that lead to the same investments, the result would still be 366,000
general outcome—a greater incidence of fewer jobs in 2040. In addition, personal income
electricity interruptions. in the U.S. will fall by a total of $656 billion from
expected levels by 2020.
Conclusion
The cumulative need, based on anticipated
investment levels and the estimated investment
gap, will be $673 billion by 2020, an average of
about $75 billion per year. Based on investment
over the past decade, closing the gap is within
reach: the average annual need projected from
Table 4 breaks down the estimated impact 2012 through 2020 falls within the range of
by region. These costs are not felt equally across annual investment totals in the last decade, and
the United States. Cumulative cost increases in there is not a single year through 2020 that is
the Southeast will be 30% of the total and costs projected to be outside that range.
in the West will be 22% of the total. Reliable electricity is essential for the func-
tioning of many aspects of household and
Future Impact on Economy economic activity today. As the nation moves
If future investment needs are not addressed to towards increasingly sophisticated use of infor-
upgrade our nation’s electric generation, trans- mation technology, computerized controls and
mission, and distribution systems, the economy sensitive electronics, the need for electricity
will suffer. Costs may occur in the form of reliability becomes even greater. For the entire
higher costs for electric power, or costs incurred system to function, generation facilities need
because of power unreliability, or costs associ- to meet load demand, transmission lines must
ated with adopting more expensive industrial be able to transport electricity from generation
processes. Ultimately, these costs all lead to the plants to local distribution equipment, and
same economic impact: diversion of household the decentralized distribution networks must
be kept in good repair to ensure reliable final
delivery. Deficiencies or shortfalls in any one
of these three elements of electricity infrastruc-
ture can affect our nation’s future economic
growth and standard of living.
10 !"#$%&'()*%$"+,(*-(.$/$0(1'2$'""#31 INTRODUCTION
Our nation’s system of electricity generation, transmission and dis-
tribution facilities was built over the course of a century. Centralized
electric generating plants with local distribution networks were
first built in the 1880s, and the grid of interconnected transmission
lines began to be built in the 1920s. Today, we have a complex
network of regional and local power plants, power lines and trans-
formers that have widely varying ages, conditions and capacities.
The analysis presented in this report illus- standards, which can impose costs on house-
trates the continuing importance of electric holds and businesses. This report highlights
power generation, transmission and distribu- the nature of the potential investment gap,
tion systems to the national economy. This and the ways that it can affect the productiv-
infrastructure is needed in good working ity and competitiveness of industries along
order to assure that supply of electricity can with the prosperity of households.
meet demand, and that the electricity can This report’s economic analysis is based on
be delivered reliably to households and busi- documentation of electricity system conditions
nesses. Both deficiencies in the performance from 2011, data on recent investment trends in
of aging equipment and insufficiencies in electricity infrastructure, and projections of
electric system capacity can lead to difficulty the probable implications of emerging trends
meeting projected demand and reliability extending out to 2040. The needs to maintain
4&$05#"(+*( %+6(78"(1%*'*!$%(9!:&%+(*-(.5##"'+(9'/"3+!"'+(7#"';3($'(10"%+#$%$+,(9'-#&3+#5%+5#" 11and update existing electric energy infrastruc- The final sections include a discussion of long-
ture, to adopt new technologies, and to meet the term uncertainties, conclusions, the sources and
demands of a growing population and evolving methodology used, and acknowledgments.
economy in the next 30 years will impose signifi- The primary basis for the economic analysis
cant requirements for new energy infrastructure is documentation provided by the U.S. Depart-
investment. During the past decade, electric ment of Energy, the North American Electric
energy infrastructure has been improved Reliability Corporation, the Edison Electric
through an upturn in investment, and the nega- Institute, and the Electric Power Research
tive economic impacts noted in studies of 10 and Institute. Each year the U.S. Energy Informa-
20 years ago have been partially mitigated. More tion Administration (EIA) releases an Annual
investment is needed, however, to further reduce Energy Outlook that projects long-term energy
the incidence of service disruptions borne by supply, demand and prices based on results
households and businesses. from EIA’s National Energy Modeling System
The extent of the effort that is made to (NEMS). Annual Energy Outlook 2011, published
respond to these needs and enhance investment in April 2011, presents actual and projected
in this infrastructure can have major conse- total electric sales broken down by generation
quences for industries’ competitiveness and technology for 2008–2035. For this study we
performance, along with impacts on the presume the EIA projections represent “trends
standard of living for American households. extended” or “business as usual” to 2040.
The analysis presented in this report illus-
trates how deficiencies in electric generation, Regional Approach
transmission, and distribution affect the U.S. Electricity data are reported by various regional
economy and will continue to do so in the future structures. This report uses the North American
without a change in investment patterns. The Electric Reliability Corporation (NERC) regions,
report thus seeks to highlight how deficient which divides the contiguous United States into
electric energy delivery systems impose costs on eight regions for reliability planning (Figure 3).
households and businesses, and how these costs Note that the NERC regions covering the West,
affect the productivity and competitiveness of Midwest and Northeast include Canada. Data
industries, along with the well-being of house- in this report has been filtered to include only
holds. This report includes the following topics: the United States, except for generation plants
and transmission lines that originate in Canada
★ An overview of electricity infrastructure, to serve U.S. markets.
★ Electricity demand by region and the seg- The U.S. Energy Information Administration
mentation of consumers, (EIA) sometimes reports data broken down into
★ The current and projected shortfall (gap) 22 Electricity Market Module (EMM) regions.
in electric energy infrastructure investment, In cases where data were reported using other
★ The national and regional implications of regional structures, such as in EMM regions,
this shortfall, estimates were developed to place these data in
★ An overview of the methodology employed consistent NERC regions.
to assess economic performance, and
★ Implications of the shortfall in infrastructure
investment for national economic performance.
12 !"#$%&'()*%$"+,(*-(.$/$0(1'2$'""#3FIGURE 3★ NERC Regional Entities
MRO NPCC
WECC RFC
SPP SERC
TRE
FRCC
FRCC (Florida) Florida Reliability Coordinating Council
MRO (Midwest) Midwest Coordinating Organization
NPCC (Northeast) Northeast Power Coordinating Council
RFC (Mid-Atlantic) Reliability First Corporation
SERC (Southeast) Southeast Reliability Corporation
SPP (Southwest) Southwest Power Pool Regional Entity
TRE (Texas) Texas Reliability Approach
WECC (West) Western Electricity Coordinating Council
SOURCE www.nerc.com
4&$05#"(+*( %+6(78"(1%*'*!$%(9!:&%+(*-(.5##"'+(9'/"3+!"'+(7#"';3($'(10"%+#$%$+,(9'-#&3+#5%+5#" 13grid technologies.1 Future investment in electric
energy infrastructure will likely vary from year to
year, reflecting variation over time in the average
age and consequent need for replacement of vari-
The capital gap is the difference between ous elements of equipment, facilities, and power
the level of dollars invested in infrastructure lines. In addition, capital spending will tend to rise
under the trend scenario (extending to meet the requirements of new laws and regula-
current investment trends) and the level tions, the pace of conversion to renewable energy
of investment required to replace, expand, sources, the costs of connecting new energy
sources to the existing energy grid, and conver-
or improve infrastructure as demand grows
sion to more reliable smart grid technologies.
and existing equipment ages. The capital gap is the difference between
the level of dollars invested in infrastructure
under the trend scenario (extending current
investment trends) and the level of invest-
ment required to replace, expand, or improve
infrastructure as demand grows and existing
equipment ages. Regardless of the reason, fail-
ure to carry out needed investments can result
Objectives and Limitations of This Study in shortages—not necessarily in resources,
The purpose of this study is to survey the eco- but in the ability to deliver reliable electricity
nomic effects of current investment trends in to customers due to inefficient or insufficient
America’s energy infrastructure. This report generation, transmission, and distribution
does not address the availability or shortages or infrastructure systems that ultimately compro-
changing prices of energy resources, the desir- mise the ability of customers to receive reliable
ability or costs of exploration and extraction, and electricity. Any such shortages will result in
it is not intended to propose or imply prescriptive the price of electricity being raised so that
policy changes. In addition, the report does not the supply can meet the demand. (This is in
address which fuels, or combination of fuels, are addition to the costs of the fuels themselves.)
best for the nation’s energy future, or the costs Thus, the unmet costs of meeting energy infra-
and benefits of energy fuel security. This study structure requirements can be seen as adding
is limited to the infrastructure systems that future costs for households and for business
generate electricity and convey it to businesses, operations in the U.S.
institutions, and households. As part of the Failure to Act series, this
It is difficult to predict future levels of capital report focuses on the economic consequences
spending because a wide range of factors will of not making needed investments in electricity
exert an influence during the coming decades. infrastructure, because these investments
The analysis focuses on a trend scenario that fundamentally affect the productivity and
presumes that the mix of electricity generation global competitiveness of the U.S. economy
technologies (electricity generation from oil, and hence long-term job and income growth.
natural gas, coal, nuclear, hydro, wind, solar, etc.) This analysis does not consider the short-term
continues to evolve as reflected in EIA data, with impacts of money flows associated with spend-
a continued long-term evolution toward smart ing on construction, installation and operation
of additional infrastructure.
14 !"#$%&'()*%$"+,(*-(.$/$0(1'2$'""#32 OVERVIEW OF THE
ELECTRICITY INFRASTRUCTURE
America’s electricity energy infrastructure is composed
of three distinct elements:
1. Electricity generation facilities—including approximately
5,800 major power plants and numerous other smaller
generation facilities;2
2. High-voltage transmission lines—a network of over
450,000 miles that connects generation facilities with
major population centers;3 and
3. Local distribution systems that bring electric power into
homes and businesses via overhead lines or underground
cables. The first two elements are usually referred to as
the bulk power system. The interconnectivity of electricity
infrastructure elements is illustrated by Figure 1.
Common Elements of Infrastructure transportation infrastructure in that both
All forms of infrastructure have features in involve a network of cross-border and inter-
common. In general, infrastructure involves state connections, as well as state or regional
built facilities located across the country transmission networks and local distribution
that are used by households and businesses, systems. Energy infrastructure is also similar
or are used by service providers for house- to water infrastructure in that both com-
holds and business. Infrastructure is also monly utilize centralized facilities to generate
a “public good,” meaning that much of the or process a product that is distributed to
population and economy either directly or homes and business locations, though in
indirectly benefit from its existence. The elec- both cases, a small subset of households and
tricity infrastructure is similar to surface businesses instead provide for themselves.
4&$05#"(+*( %+6(78"(1%*'*!$%(9!:&%+(*-(.5##"'+(9'/"3+!"'+(7#"';3($'(10"%+#$%$+,(9'-#&3+#5%+5#" 15Key Differences from Other 2. The breadth of technologies for electricity
Infrastructure Types generation. A second distinguishing feature
It is important to note that the electric energy of America’s electric energy infrastructure
infrastructure is different from transportation is the wide variation in technologies being
and water and wastewater infrastructure, which employed. The wide range of technologies is
were analyzed in previous Failure to Act reports, most evident for generating facilities, which
in four ways: can employ nuclear power, the combustion
1. Private ownership. One distinguishing feature of carbon-based “fossil fuels” (including coal,
of the electric energy infrastructure (including oil, diesel, and natural gas), or renewable
both bulk power and local distribution) is power (including hydro, wind, solar, geo-
that most of it is privately owned. A portion thermal, or biomass) as shown in Figure 4.
of the infrastructure is owned by federal Central power plants may employ any of
agencies, municipal governments, and rural these technologies, and the mix varies across
cooperatives. But the vast majority is owned regions of the U.S. In addition, some large
by for-profit, investor-owned utilities. There businesses operate distributed generation
are also privately owned “independent power facilities, which are either “cogeneration”
producers.” Yet even with private ownership power plants that employ steam, heat, or
and operation, the rates that local utilities biomass refuse generated from industrial
charge is generally regulated by state agencies, processes, or “self-generation” facilities using
and there is also federal and state regulatory combustion, wind, or solar power for either
oversight of the operation of generating facili- primary or backup power.
ties and transmission systems.
FIGURE 1★ Elements of Generation, Transmission, and Distribution Systems
RED Generation
BLUE Transmission Substation Step
Down Transformer
PINK Distribution Subtransmission
Transmission Lines Customer 26kV
765, 500, 345, 230, and 138kV and 69kV
Generating Station
Primary Customer
13kV and 4kV
Secondary
Generating Step Transmission Customer Customer 120V
Up Transformer 138kV or 230kV and 240V
SOURCE Federal Energy Regulatory Commission, 2006.
16 !"#$%&'()*%$"+,(*-(.$/$0(1'2$'""#3FIGURE 4★ Fuel Source of U.S. Electricity Generation, 2009
OTHER RENEWABLE
PETROLEUM
HYDROELECTRIC
CONVENTIONAL
Petroleum 1%
Other Renewables 4%
NUCLEAR Hydroelectric Conventional 7%
Nuclear 20%
Natural Gas 23%
Coal 45%
COAL
NATURAL GAS
SOURCE U.S. Energy Information Administration, 2009.
3. The rate of change. A third distinguishing technologies also add uncertainty about what
aspect of electric energy infrastructure is future infrastructure system will look like.4
the complex combination of ownership 4. Deregulation of system elements. A fourth
arrangements and operating systems that distinguishing aspect of electric energy infra-
are constantly evolving, in addition to the structure is deregulation, which has resulted
variation of technologies described above. in the three elements (generation, trans-
This has important implications. On one mission, and distribution) being operated
hand, the diversification of fuel and technol- by different parties, facilitating the growth
ogy reliance provides a degree of protection of independent power production and dis-
against unforeseen future issues with any tributed generation.5 Today, households and
one type of generation. On the other hand, businesses typically receive itemized electric
uncertainty about future prices of fossil bills that charge separately for each of the
fuels, regulations controlling greenhouse three elements. However, a small but growing
gas emissions, and rate of adoption for more number of businesses and households now
renewable power portfolios options can have their own generation equipment that
all make it more difficult to forecast the minimizes or eliminates their reliance
future technology mix and its cost implica- on central power generation and transmission
tions. Anticipated future changes regarding systems at least part of the time, and some
the feasibility and implementation of of them also sell power back to utilities.6
distributed generation and smart grid
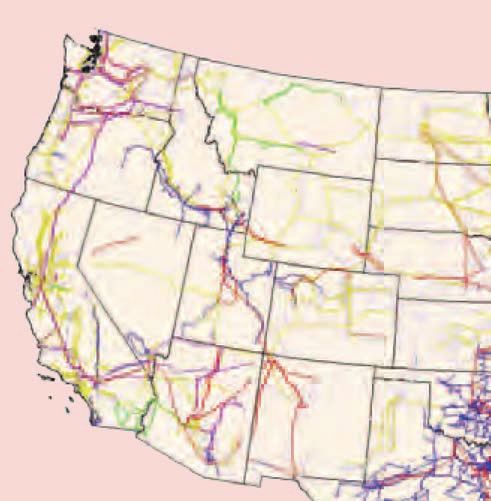
4&$05#"(+*( %+6(78"(1%*'*!$%(9!:&%+(*-(.5##"'+(9'/"3+!"'+(7#"';3($'(10"%+#$%$+,(9'-#&3+#5%+5#" 17FIGURE 5★ The U.S. Electricity Transmission Grid
115kV 230kV
138kV 345kV
161kV 500kV
SOURCE U.S. Federal Emergency Management Agency.
Key Issues served by a wide variety of different transformer
Power plants use a variety of different tech- types, of different ages and capacities, which
nologies with widely different fuel needs and progressively step down power from higher to
operating costs that lead them to serve base lower voltages to serve local utility customers.
load, peak load, or backup functions. These fuel Altogether, our nation’s electric energy
mixes vary widely across regions of the U.S. infrastructure is a patchwork system that
The transmission lines have a variety of differ- has evolved over a long period of time, with
ent voltage (power) and capacity (electricity) equipment of widely differing ages and capaci-
characteristics that lead them to serve different ties. For example, about 51% of the generating
functions in the movement of electricity from capacity of the U.S. is in plants that were at
generation plants to local load (distribution) least 30 years old at the end of 2010. Most gas-
centers. Moreover, local utility customers are fired capacity is less than 10 years old, while
18 !"#$%&'()*%$"+,(*-(.$/$0(1'2$'""#3FIGURE 6★ Map of Congested Paths in Electric Transmission Systems
Western Interconnection Interconnection
Eastern Interconnectio
ion
Seattle
Boston
Portland
Detroit New York
Cleveland
Pittsburgh Philadelphia
Baltimore
Cincinnati Washington DC
Sacramento
San Francisco
San Jose Denver
Atlanta
Los Angeles
Riverside
San Diego Phoenix
Tucson Orlando
Tampa
Miami
Critical
Cri Congestion Area
Congestion
Con Area of Concern
SOURCE U.S. Department of Energy, National Electric Transmission Congestion Study, December 2009.
NOTE These maps are available because Congress directed the U.S. Department of Energy to conduct a study every three years on
electric transmission congestion and constraints within the Eastern and Western Interconnections in the Energy Policy Act of 2005.
73% of all coal-fired capacity is 30 years or grid that can also lead to brownouts and occa-
older.7 Moreover, nationally, 70% of transmis- sional blackouts. These concerns make it critical
sion lines and power transformers are 25 years to understand the nature of the current and
or older, while 60% of circuit breakers are projected future shortfall, or gap, between
more than 30 years old.8 system supply and demand. The spatial pattern
The aging of equipment explains some of of congestion is shown through Figure 5 that
the equipment failures that lead to intermittent illustrates the U.S. transmission grid, and Fig-
failures in power quality and availability. ure 6, which shows critically congested areas on
The limited capacity of older equipment also the electric grid of the Eastern Interconnection
explains why there are congestion points in the and the Western Interconnection.
4&$05#"(+*( %+6(78"(1%*'*!$%(9!:&%+(*-(.5##"'+(9'/"3+!"'+(7#"';3($'(10"%+#$%$+,(9'-#&3+#5%+5#" 193 SUPPLY AND DEMAND
Electricity Demand
Demand for electricity generation has two key metrics:
“peak demand,” representing the kilowatts (kW) of capacity
needed on the system to meet the greatest hour of demand,
and “load,” representing the total kilowatt-hours (kWh)
of electric energy demanded.
On the basis of projections made by the U.S. Energy
Information Agency (EIA), electricity use is expected to
increase nationally by 26% from 2011 to 2040 (see Table 6).9
Over the long term, significant regional differences are
expected as use increases by 39% in Florida, 34% in the
Western states, and 20% in the Mid-Atlantic area. It is
important to note that, over the short term, from 2011
through 2020, national growth of electricity demand
is expected to be 8% and the increased demand in all
regions is expected to average 8% or 9%. Divergence
across different geographical areas in the United States
is not expected until the 2021–40 period.
20 !"#$%&'()*%$"+,(*-(.$/$0(1'2$'""#3TABLE 6 ★ U.S. Demand for Electric Energy is Expected
to Increase 8% between 2011 and 2020
DEMAND 2011 2020 2040
U.S. demand In terawatt-hours 3,692 3,976 4,658
Percent residential 37% 35% 36%
Percent nonresidential 63% 65% 64%
OVERALL PERCENT GROWTH
2011–20 8%
2021–40 17%
2011–40 26%
SOURCES EIA, Annual Energy Outlook 2011 (for 2008–35); calculations by La Capra Associates to extend the analysis to 2040.
Comparison of Complete NERC and EIA Projections
FIGURE 7★ for U.S. Summer Capacity, extended through 2040 (gigawatts)
1200.0
1137.5
1075.0
1012.5
950.0
2010 2015 2020 2025 2030 2035 2040
■ EIA ■ NERC Anticipated ■ NERC Prospective ■ NERC Adjusted Potential
■ extended ■ extended ■ extended ■ extended
SOURCE NERC, 2011 Long-Term Reliability Report.
NOTE “Anticipated” refers to the most conservative supply estimate from NERC, based on existing resources plus future
planned capacity resources.
4&$05#"(+*( %+6(78"(1%*'*!$%(9!:&%+(*-(.5##"'+(9'/"3+!"'+(7#"';3($'(10"%+#$%$+,(9'-#&3+#5%+5#" 21Electricity Supply
The primary sources for data on existing and
projected power generation, also called supply
capacity, are EIA and NERC. Both provide esti-
mates of existing and projected power generation
during the next 25 and 10 years, respectively.
Their estimates of U.S. total summer capacity
are compared in Figure 7. Note that faded lines
indicate the trends extended to the year 2040.
Over the recent ten year period, estimated Recent Investment Trends
investment in electric generation facilities From 2001 through 2010, annual capital
varied from $18 billion to $72 billion, investment in transmission and distribution
while transmission and distribution infrastructure averaged $62.9 billion, including
investments varied from $6 to $10 billion $35.4 billion in generation, $7.7 billion in trans-
mission, and $19.8 billion in local distribution
and $17 billion to $22 billion.
(in 2010 dollars).
As seen in Table 7, investment for transmis-
sion has been growing annually since 2001 at
nearly a 7% annual growth rate. For generation,
investment levels have varied widely from year
to year, with the lowest levels in the 2004–06
time period. For local distribution, however,
national-level investment peaked in 2006
and has since declined to less than the level
observed in 1991.
The average rates of these investments
The bulk power system is designed and are used in the next chapter as a basis for
planned to meet seasonal peak demand in calculating the gap between investment rates
addition to a certain reserve margin. Annual and expected future increases in investment
peaks tend to occur in the summer in most needs. However, it is important to note the
parts of the U.S., due to cooling loads, and the widely varying annual investment levels from
electric system needs to be sized to meet these 2001 to 2010, as shown in Table 1, which ranged
loads. However, in some locations, peak demand from $44 billion to $101 billion. Spending for
occurs in the winter.10 NERC has an alternative generation showed the widest range, while
and higher forecast of growth in peak demand, distribution was the most narrow in range.
which indicates a rise of 13% from 2011 to 2020, Over the recent ten year period, estimated
compared with the EIA’s projection of 8% for investment in electric generation facilities
the same years.11 varied from $18 billion to $72 billion, while
transmission and distribution investments
varied from $6 billion to $10 billion and $17
billion to $22 billion, respectively (all dollars
adjusted to 2010 value).
22 !"#$%&'()*%$"+,(*-(.$/$0(1'2$'""#3TABLE 7 ★ Construction Expenditures for Generation, Transmission,
and Distribution: 2001–10 (in billions of 2010 dollars)
EXPENDITURES 2010 2009 2008 2007 2006 2005 2004 2003 2002 2001
Generation 28.9 38.9 71.6 49.5 18.1 24.4 17.7 25.0 37.0 43.0
Transmission 10.2 9.9 9.0 8.5 8.2 7.5 6.3 6.2 5.7 5.6
Distribution 16.9 17.7 20.3 20.8 22.3 21.1 20.2 19.3 19.9 19.7
Total 56.0 66.4 101.0 78.8 48.6 53.0 44.2 50.5 62.6 68.2
SOURCES Electric Power Annual 2011, U.S. Energy Information Administration; and 2012 Statistical Yearbook of the Electric Power Industry,
Edison Electric Institute.
NOTE Numbers may not add due to rounding.
TABLE 1 ★ Annual Average Construction Expenditures for Generation,
Transmission, and Distribution: 2001–10 (in billions of 2010 dollars)
TYPE OF EXPENDITURES AVERAGE ANNUAL LOW ANNUAL HIGH ANNUAL
Generation 35.4 17.7 71.6
Transmission 7.7 5.6 10.2
Distribution 19.8 16.9 22.3
Average TOTAL 62.9 44.2 101.0
NOTE Low and high annual “total” expenditures represent the average total spending from 2001 to 2010, and are not sums of the annual
average expenditures of the three components of the electric infrastructure system. Numbers may not add due to rounding.
SOURCES Transmission and distribution numbers from Edison Electric Institute, 2012 Report, table 9–1; generation investment
was estimated from reporting forms of the EIA and Federal Energy Regulatory Commission, with averages applied for investment
cost per kWh for applicable generating technologies.
4&$05#"(+*( %+6(78"(1%*'*!$%(9!:&%+(*-(.5##"'+(9'/"3+!"'+(7#"';3($'(10"%+#$%$+,(9'-#&3+#5%+5#" 234 THE POTENTIAL INVESTMENT GAP
This chapter summarizes the data, assumptions, and method-
ology underlying the difference between the investment levels
expected annually through 2040 and the investment levels that
will be needed to assure the reliable delivery of electricity to
businesses, households, and other users. The analysis of this
potential investment gap that follows considers recent investment
trends, projected future investment rates, and the extent of the
shortfall between expected investment rates and forecasted future
investment requirements. It is conducted separately for each of
the three elements of generation, transmission, and distribution
systems. The tables present the results for a trend scenario
that is based on EIA projections and assumes a continuing
shift in the mix of generation technologies, and further
implementation of smart grid technologies.
From 2011 through 2040, the averages of expenditures, although $61 billion is about
2001–10 investments are assumed and the $25 billion above the average seen during the
gap represents annual expenditures above last decade.
the averages for generation, transmission, and
distribution (see Table 1). It is important to Overview of Key Findings
note that in any given year, the total need may Nationally, extending current trends leads
be within the ranges of 2001–10 investments to funding gaps in electric generation, trans-
but exceed the average annual expenditures. mission, and distribution that are projected
For example, needed generation investments to grow over time to a level of $107 billion
from 2011 to 2040 will range from $35 bil- by 2020 and almost $732 billion by 2040,
lion to $61 billion. For every year, the total as shown in Table 2. These are totals above
is within the 2001–10 range of generation the averages for past expenditures. In 2020,
24 !"#$%&'()*%$"+,(*-(.$/$0(1'2$'""#3TABLE 2 ★ National Electricity Infrastructure Gap:
Estimated at $107 Billion by 2020 (in billions of 2010 dollars)
TYPE OF INFRASTRUCTURE CUMULATIVE GAP
2020 2040
Generation 12.3 401.1
Transmission 37.3 111.8
Distribution 57.4 219.0
U.S. TOTAL 107.0 731.8
SOURCES EIA, NERC, Eastern Interconnection Planning Collaborative, Phase I Report, December 2011, Renewable Energy Transmission
Initiative Electric Power Research Institute and Federal Energy Regulatory Commission. Calculations by La Capra Associates and EDR Group.
NOTE Numbers may not add due to rounding.
distribution and transmission infrastructure of natural gas, while the Midwest uses the least.
are expected to account for more than 88% Nuclear power is spread out among all regions, and
of the investment gap, while generation infra- it is relied on most in the Northeast and least in the
structure will represent roughly 11.5%. By 2040, Southwest. Note also that renewable sources are
however, generation infrastructure is seen as most prominent in the Western states and are also
potentially the most costly element of the gap, employed in the Northeast and Midwest, though
accounting for 55% of the total, with trans- they are insignificant in other regions. Conversely,
mission accounting for 15%, and distribution oil generation is minimal as a proportion of current
accounting for 30%. This is a reversal from power usage.
2020, when generation is expected to be the Table 10 shows the increase in each region of
best-funded element of electricity infrastructure. the plant additions that are expected through
By itself, this funding does not necessarily mean 2040. As displayed, most regions are anticipated
that there will be a future shortage of electricity to build significant capacity in gas plants (and
available. Rather, it indicates that future invest- limited coal plants). Note the prominence of gas
ment needs will be greater. in every region, but especially Florida, the North-
The gap is calculated as total estimated needs east, and the Mid-Atlantic region. Conversely,
per year minus the 2001–10 average annual new renewable sources are prominent in four
investment levels and summed to aggregate regions and minimal in the other four, and nuclear
levels in 2020 and 2040. Table 8 illustrates the power is prominent in the Southeast.
calculations for five specified years.
Investment Need
Generation Electricity infrastructure at the wholesale level
Generation Technologies is regulated by the Federal Energy Regulatory
Table 9 shows the reliance of each NERC region Commission (FERC) and NERC. FERC regu-
on various power-producing technologies as of lates markets and incentives for infrastructure
2011. Note the prominence of coal in every region, investment, while NERC (as authorized by
especially in the Midwest. The Texas, Florida, FERC) monitors reliability levels. Systems are
and Northeast regions use the highest proportion maintained to a “1 day in 10 years” loss-of-load
4&$05#"(+*( %+6(78"(1%*'*!$%(9!:&%+(*-(.5##"'+(9'/"3+!"'+(7#"';3($'(10"%+#$%$+,(9'-#&3+#5%+5#" 25expectation. The history or origin of this expectation. As such, reliability at the level of
standard is not well documented, but is believed the bulk power system is usually good (and bet-
to have originated with academic papers ter than at the level of the distribution system),
written in the 1940s.12 As utilities began to study so major outages at the levels of the generation
the use of this standard and find it acceptable, and transmission system are now relatively rare.
more and more utilities began to incorporate it For this analysis, a simplified reliability analy-
into their planning departments. It was even- sis based on planning reserve margins was used,
tually accepted by NERC as the standard that which represents the percentage of additional
should be followed throughout the country. resources beyond peak demand levels that are
Utilities and independent system operators needed to meet the loss-of-load expectation.
plan to have resources available to meet this
TABLE 8 ★ Projected Needs and Gap by Year Compared with 2001–10
Average Investment Levels (in billions of 2010 dollars)
ASPECT OF NEEDS 2012 2015 2020 2030 2040
Projected national needs
Generation 35.4 38.3 37.8 54.1 61.0
Transmission 11.4 11.4 11.4 11.4 11.4
Distribution 24.6 25.4 26.8 30.2 28.9
TOTAL 71.5 75.1 76.0 95.8 101.3
Baseline 2001–10 averages
Generation 35.4 35.4 35.4 35.4 35.4
Transmission 7.7 7.7 7.7 7.7 7.7
Distribution 19.8 19.8 19.8 19.8 19.8
TOTAL 62.9 62.9 62.9 62.9 62.9
Calculated gap by year*
Generation 0 2.9 2.3 18.7 25.6
Transmission 3.7 3.7 3.7 3.7 3.7
Distribution 4.8 5.6 7.0 10.4 9.1
TOTAL 8.5 12.2 13.1 32.8 38.4
* Calculated as the difference between projected national needs and baseline 2001-10 averages.
NOTE The generation portion of “projected national needs” is based on each region generating 115% of expected electricity demand
(see Figures 8 & 9). The 15% reserve margin is included to ensure reliability. Numbers may not add due to rounding.
SOURCE EIA Annual Energy Outlook 2011 (years 2008-2035) and NERC 2011 Long-term Reliability Report, Eastern Interconnection
Planning Collaborative, Phase I Report, December 2011, Renewable Energy Transmission Initiative Electric Power Research
Institute and Federal Energy Regulatory Commission. Calculations by La Capra Associates and EDR Group
26 !"#$%&'()*%$"+,(*-(.$/$0(1'2$'""#3TABLE 9 ★ Proportion of Reliance on Electricity Generation
Technologies by Region (percent)
TECHNOLOGY REGION
NORTH- MID- SOUTH- SOUTH-
TEXAS FLORIDA MIDWEST EAST ATLANTIC EAST WEST WEST
Coal 37 31 70 10 59 52 57 29
Petroleum 0 6 0 2 1 0 0 0
Natural Gas 42 44 3 41 12 16 32 26
Nuclear 12 16 13 31 27 27 5 11
Pumped Storage/Other 0 1 0 1 0 0 0 0
Renewables 8 1 14 14 2 5 6 34
Distributed Generation 0 0 0 0 0 0 0 0
Total by Region 100% 100% 100% 100% 100% 100% 100% 100%
SOURCE EIA, Annual Energy Outlook, 2011.
Additions of New Capacity Expected by Region
TABLE 10 ★ for Electricity Generation Technologies (percent)
TECHNOLOGY REGION
NORTH- MID- SOUTH- SOUTH-
TEXAS FLORIDA MIDWEST EAST ATLANTIC EAST WEST WEST
Coal 14 0 16 0 0 8 0 2
Oil and natural gas steam 0 0 0 0 0 14 0 0
Combined-cycle gas 32 99 19 60 70 18 28 35
Combustion turbine/diesel 44 0 40 9 23 52 25 15
Nuclear power 0 0 0 0 0 16 0 0
Renewable sources 5 0 21 31 4 6 46 44
Distributed generation 5 0 3 0 3 15 0 4
Total new capacity by region 100% 100% 100% 100% 100% 100% 100% 100%
NOTE Projections by the EIA are through 2035 and are assumed for 2040. Additions are in terms of megawatts expected to be added.
SOURCE EIA, Annual Energy Outlook, 2011.
4&$05#"(+*( %+6(78"(1%*'*!$%(9!:&%+(*-(.5##"'+(9'/"3+!"'+(7#"';3($'(10"%+#$%$+,(9'-#&3+#5%+5#" 27Nevertheless, there are outages at the distribu- higher than the EIA’s demand forecast (which
tion level, which usually are not built to meet is based on generation supply). For data consis-
varying state and local standards. tency purposes and to account for the current
Forecasts of future electric demand are pro- generation oversupply that is reflected in the EIA
vided by the EIA. Its forecasts, shown in Table forecasts, the 2016–21 NERC growth rates were
11, portray future demand for electric power used rather than the growth rate for the entire
given expected changes in population, economic 2010–21 period to project demand to 2040. This
activity, and energy-efficient technologies. The results in a lower forecasted “need” figure, but
data shows that the EIA expects continued mod- one that is likely more plausible than the value
est growth in future demand for electricity for the entire 2010–21 period.
(an 8% increase by 2040). During the 2011–40
period, demand in all regions is expected to grow Forecasted Supply
at 1.0% or less per year and only 0.7% per year For electricity generation, the supply forecast
for the U.S. as a whole. Much of this low demand was developed by examining recent trends in
growth is expected to be due to energy efficiency supply and continuing these trends into the
and an overall decline in energy intensity per future by applying the NERC supply forecast
dollar of gross domestic product. Though it is to the NERC demand forecast of internal peak
useful to analyze energy demand, electric sys- loads. Three supply forecasts categorize the
tems are planned to meet peak loads. However, it likelihood of supply into “anticipated,” “pro-
is noteworthy that the electric energy demanded spective,” and “conceptual,” with “anticipated”
by businesses and institutions is expected to providing the lowest, most conservative out-
increase compared with sales to households. look. This analysis uses the more conservative
In 2010, 61% of electric energy purchases were estimate of “anticipated” supply stream, though
made by nonresidential customers, and in 2020 the other forecasts can also be used. To main-
and 2040, this proportion is expected to grow to tain consistency with projected demand trends,
65% and then fall slightly to 64%. the averaged 2016–21 growth rate was applied to
Table 12 shows two concepts of peak demand. determine the supply forecast to 2040.
The top rows of the table show EIA’s supply fore- A reliable electricity generation system must
cast, which essentially represents a forecast of have more capacity resources than anticipated
generation investment need, because the EIA peak demand, to account for unanticipated out-
assumes that NERC planning standards are met. ages and higher-than-anticipated peak demand.
The bottom rows of the table give a forecast from The amount that capacity resources exceed peak
NERC. The first important point is the differ- demand is known as the planning reserve mar-
ence between the two national totals. The top gin. NERC is primarily responsible for ensuring
set of data is based on historical, existing genera- that planning reserve margins are maintained
tion and how demand levels and other market at a level sufficient to ensure system reliabil-
or policy factors affect generation build-out, and ity. Although it can vary by locality, NERC’s
includes any generation capacity that is used to reference margin level is 15%, meaning that
meet the reserve margins. generation of 115% of expected peak demand
The bottom set of data represents actual inter- is needed to ensure reliability of supply. Due to
nal regional peak demand forecasts (by NERC) capacity surpluses, most regions and the country
without reserve margins. One drawback of the as a whole are currently projected to exceed the
NERC forecast is that data are only available 115% margin through 2020, with the exception
through 2021, compared with 2035 for EIA data. of Texas.13
Moreover, the NERC forecast of demand is much
28 !"#$%&'()*%$"+,(*-(.$/$0(1'2$'""#3You can also read


