Network
Development
Plan 2013
←
→
Page content transcription
If your browser does not render page correctly, please read the page content below
Network Development Plan 2013
0.
Contents
heading
(continued)
1 Foreword 2 5 The Gas Network Infrastructure 23
5.1 Overview of the BGÉ Gas Network 23
2 Executive Summary 3 5.2 Network Assets & Information 24
2.1 Historic Demand 3 5.2.1 Compressor Stations 24
2.2 Demand & Supply Forecast 4 5.2.2 Pressure Regulating Stations 25
2.3 Security of Supply 4 5.2.3 Meters 25
2.4 Capital Investment 5 5.2.3.1 Meter Replacement & Maintenance Programme 25
2.5 Future & Innovative Investment 5 5.2.3.2 Smart Meters 26
2.6 Gas Nomination(s) Behaviour 6 5.2.4 Communications & Instrumentation 26
2.7 Gas Market 6 5.2.5 Remote Terminal Equipment 26
2.8 Adequacy of the Gas Network 7 5.2.6 Instrumentation 26
5.2.7 Cathodic Protection Monitoring 26
3 Introduction 9 5.2.8 Pipelines 27
3.1 Investment Infrastructure Completed 10 5.2.9 Asset Integrity - Pipeline Encroachment 27
3.2 Historic Demand & Supply 10 5.2.10 Asset Information 27
3.2.1 ROI Annual Primary Energy Requirement 10
3.2.2 Historic Annual Gas Demand 11 6 System Operation 29
3.2.3 Historic Peak Day Gas Demand 12 6.1 Challenges 29
3.2.4 Ireland’s Weather 12 6.1.1 Supply Flow Variations 29
3.2.5 Wind Powered Generation 12 6.1.2 Demand Variation 30
3.2.6 Electricity Interconnectors 12 6.1.3 Asset Life Cycle 31
3.2.7 Historic Gas Supply 13
7 Security of Gas Supply 33
4 Gas Demand & Supply Forecast 15 7.1 Emergency Preparedness 35
4.1 Gas Demands 15 7.1.1 Emergency Operations Arrangements 35
4.1.1 Assumptions 15 7.1.2 Emergency Planning Arrangements 36
4.1.1.1 Power Sector 15 7.1.3 Operations Emergency Readiness 36
4.1.1.2 Industrial and Commercial 16 7.1.4 Physical Reverse Flow Market Test 37
4.1.1.3 Residential 16
4.1.1.4 Energy Efficiency 17 8 Commercial Market Arrangements 39
4.1.2 Forecast 17 8.1 Republic of Ireland Gas Market 39
4.2 Gas Supply 19 8.1.1 Infringements 39
4.2.1 Moffat 20 8.2 European Developments 40
4.2.2 Celtic Sea Gas Storage 20 8.3 Virtual Reverse Flow 41
4.2.3 Corrib Gas 21
4.2.4 Shannon LNG 21 9 Adequacy of the Gas Network 43
4.2.5 Other Supply Developments 21 9.1 The ROI Transmission System 44
9.2 South West Scotland Onshore System 44
9.3 Strategic Reinforcement 46
9.4 Summer Minimum Days 47
9.5 Midleton Compressor Station 47
Disclaimer - Gaslink has followed accepted industry practice in the collection and analysis of data available. However, prior to taking business decisions, interested parties are advised to
seek separate and independent opinion in relation to the matters covered by the present Network Development Plan and should not rely solely upon data and information contained therein.
Information in this document does not purport to contain all the information that a prospective investor or participant in the Republic of Ireland’s gas market may need.
Data Freeze and Rounding - In order to complete the detailed analysis and modelling required to produce this document, the demand and supply scenarios were defined in March 2013,
based on the most up to date information at the time.
In presenting the data obtained for publication in the Network Development Plan, energy values have been rounded to one decimal place, and aggregated growth/contraction rates are
expressed as whole numbers to aid clarity. In certain cases, rounding may lead to slight variance in sum totals.
Copyright Notice - All rights reserved. This entire publication is subject to the laws of copyright. This publication may not be reproduced or transmitted in any form or by any means,
electronic or manual, including photocoping without the prior written permission of Gaslink.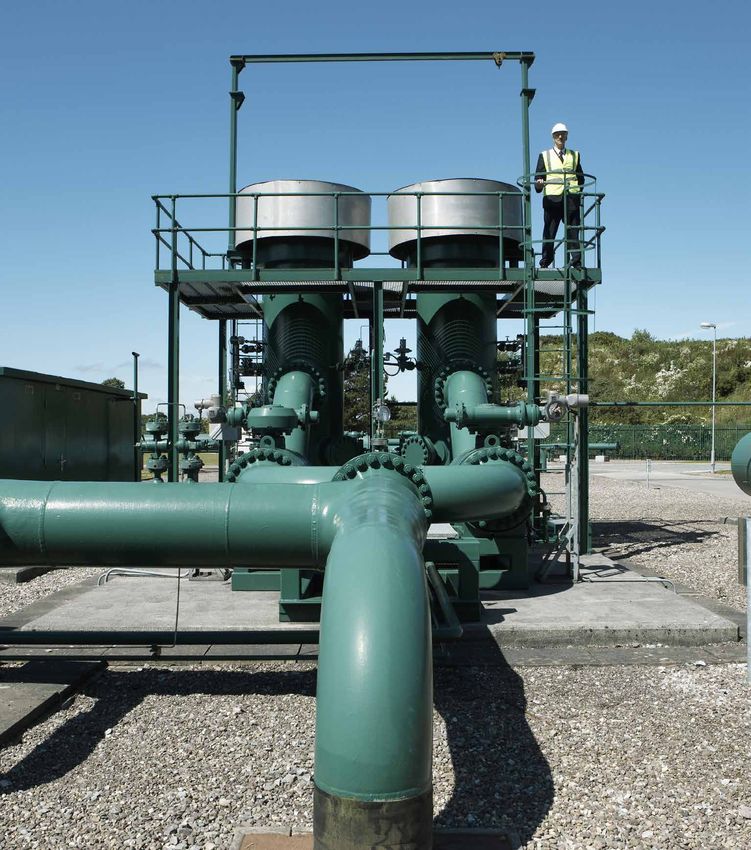
Network Development Plan 2013

0.
heading
(continued)

10            Capital Investment                             49   Figures:
10.1          Overview                                       49   Figure 3.1: ROI TPER Analysis by Fuel (2010-2011)                  10
10.2          Regulatory Capital Allowance                   49   Figure 3.2: Historic Annual Gas Demand                             11
10.3          Planned Capital Programmes                     50   Figure 3.3: Historic BGÉ System Gas Demand                         11
10.3.1        Pipelines                                      50   Figure 3.4: Historic ROI Peak Day Gas Demand                       12
10.3.2        Pressure Regulating Station Refurbishment      50   Figure 3.5: 	Historic Annual Indigenous Gas Production
10.3.3        Communications & Instrumentation               51                 and Great Britain (GB) Imports                       13
10.3.4        Meters                                         51   Figure 3.6: BGÉ System Peak Day Gas Supplies                       13
10.3.5        Compressors                                    51   Figure 4.1: ROI Forecast Electricity Demand                        15
10.4          Future Investment                              51   Figure 4.2: Single Electricity Market (SEM) Thermal Generation Mix 16
10.4.1        SWSOS Reinforcement                            51   Figure 4.3: GDP Assumptions                                        16
10.4.2        Goatisland to Curraleigh West Reinforcement    52   Figure 4.4: Residential Connection Numbers                         17
10.4.3        Midleton Compressor Station                    52   Figure 4.5: 1 in 50 Peak Day and Annual ROI Gas Demand Forecast 17
10.4.4        Longer Term Projects – local area (regional)        Figure 4.6: Annual ROI Gas Demand Forecast                         18
              reinforcement                                  52   Figure 4.7: 1 in 50 Peak Day ROI Gas Demand Forecast               19
10.5          Innovation Investment                          53   Figure 4.8: Annual BGÉ System Gas Supply Forecast                  19
10.5.1        Economic Role                                  53   Figure 4.9: 1 in 50 Peak Day Gas Supply Forecast                   20
10.5.2        Environmental Role                             53   Figure 5.1: Overview of the BGÉ Transmission System                24
10.5.3        Leading by Example                             53   Figure 5.2: Meter Replacement Programme Installations              25
10.6          Renewable Gas                                  53   Figure 6.1: Overview of Nomination Behaviour                       30
                                                                  Figure 6.2: Power Generation Fuel Supply Mix February 2013         30
11            CER Commentary                                 55   Figure 7.1: ROI Gas Supply                                         33
                                                                  Figure 7.2: Natural Gas Emergency Structure                        35
                                                                  Figure 9.1: SWSOS Pipeline Pressure Losses                         45
                                                                  Figure 9.2: Cappagh South to Midleton Pressure Profile             46
Appendices		                                                 56   Figure 10.1: P C3 Capital Allowance excluding non-pipe
Appendix 1: Historic Demand                                  56                 and work in progress                                 49
            Historic Daily Demand by Metering Type           56   Figure 10.2: Baunlusk AGI                                          50
                                                                  Figure 10 3: CNG Vehicle                                           53
Appendix 2: Demand Forecasts                                 60   Figure A1.1: Historic Daily Demand of Transmission Connected Sites 57
            Assumptions                                      60   Figure A1.2: Historic Daily Demand of Distribution Connected Sites 58
            Forecast                                         61

Appendix 3: Energy Efficiency Assumptions                    64   Tables:
            National Energy Efficiency Action Plan (NEEAP)   64   Table 4.1: Annual and Peak Day ROI Gas Demands                    17
            Impact on Residential Gas Demand                 65   Table 4.2: Corrib Forecast Maximum Daily Supply                   21
            Impact on I/C Gas Demand                         65   Table A1.1 Historic BGÉ Annual Gas Demands (Actual)               56
                                                                  Table A1.2 Historic BGÉ Peak Day Gas Demands (Actual)             56
Appendix 4: Transmission Network Modelling                   66   Table A1.3 Historic ROI Annual Gas Demands (Actual)               57
            Entry Point Assumptions                          66   Table A1.4 Historic ROI Peak Day Gas Demands (Actual)             57
                                                                  Table A1.5 Historic Annual Gas Supplies through Moffat and Inch 58
                                                                  Table A1.6 Historic Peak Day Gas Supplies through Moffat and Inch 58
                                                                  Table A1.7: Historic Coincident Peak Day and Annual ROI Demands 59
Glossary		                                                   67   Table A1.8: Historic Non-coincident Peak ROI Demand by Sector     59
                                                                  Table A2.1 New and Retired Power Station Assumptions              60
                                                                  Table A2.2: Future GDP Assumptions                                60
                                                                  Table A2.3: Residential Connections                               60
                                                                  Table A2.4: Peak Day Demand (1 in 50) & Base Supply (GWh/d)       62
                                                                  Table A2.5: Peak Day Demand (Average Year) & Base Supply (GWh/d) 62
                                                                  Table A2.6: 	Annual Demand (Average Year) & Base
                                                                                Supply Scenario (TWh/y)                             63
                                                                  Table A2.7: Maximum Daily Supply Volumes                          63
                                                                  Table A3.1: NEEAP Energy Efficiency Savings Targets               64
                                                                  Table A4.1: Entry Point Assumptions                               66

                                                                                                                                         1
0.
1.
heading
Foreword
(continued)

                           Welcome to the 2013 Gas Network Development Plan (NDP)
                           produced for the Republic of Ireland. The NDP covers the ten
                           year period up to 2021/22 and gives an overview on how the
                           Irish gas network will operate during this period.

                           The purpose of the NDP is to set out our assessment of the
                           future demand and supply position for the natural gas industry
                           in Ireland. The Plan also examines system operation and
                           subsequent capital investment requirements.

We hope that you find this an informative and useful document. In order to continually
improve our Network Development Plan, and to ensure that we continue to add value to
the information we provide on the status and future of natural gas, we welcome feedback
at info@gaslink.ie

We would like to acknowledge the contribution of the stakeholders in the process of
preparing this document.

Aidan O’Sullivan
General Manager, Gaslink

2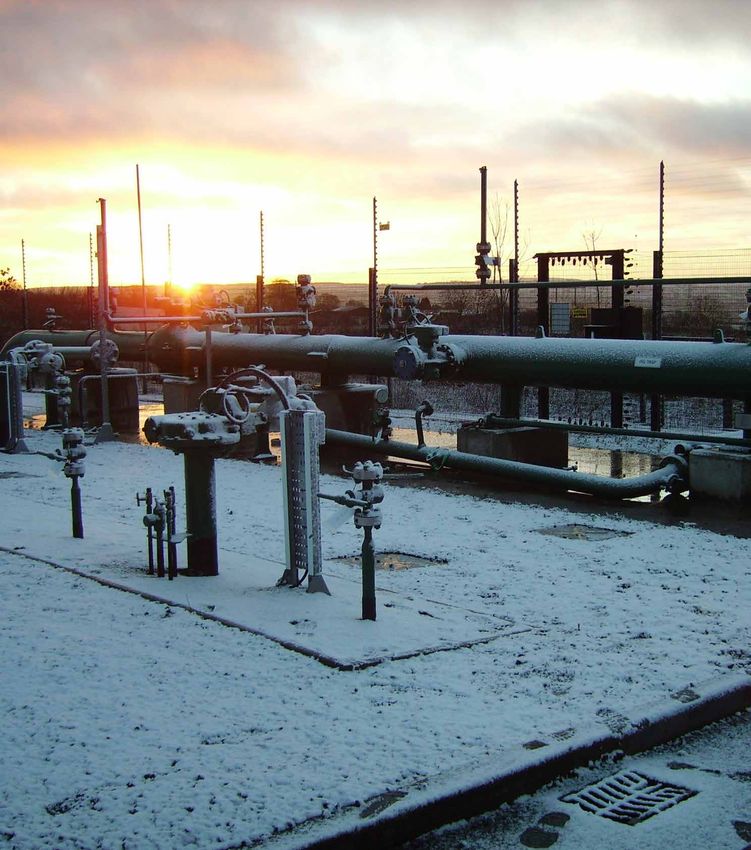
Network Development Plan 2013

0.
2.
heading Summary
Executive
(continued)

In order to facilitate the development and planning of the gas network, which can involve long lead times in the delivery of gas
infrastructure projects, the Network Development Plan (NDP) covers the ten year period up to 2021/22. This document provides a
view of how the gas network will develop over this period. Gas continues to play an important role in maintaining Ireland’s energy
security.

Weather patterns have demonstrated the requirement for Ireland to have a robust gas infrastructure to ensure energy is
guaranteed. Annual Bord Gáis Éireann1 (BGÉ) system gas demand is forecast to rise by 12% over the period to 2021/22, with
peak day gas demands increasing by 8% over the period. The Moffat Entry Point, which is the interconnection point between
the BGÉ transmission system and the United Kingdom (UK) National Grid gas transmission system, together with the two subsea
interconnectors will continue to play a pivotal role in meeting Ireland’s gas demands over the forecast period. Bord Gáis Networks2
will continue to develop the gas infrastructure to ensure reliability in meeting customer demands and to safe guard security of
supply. Challenges exist in providing the system flexibility required by the electricity generation system, such as catering for cycling
of renewable energy and supporting thermal generation, while continuing to operate an efficient gas network. The NDP is
published by Gaslink3 (the Independent Gas System Operator) with assistance from Bord Gáis Networks.

2.1 Historic Demand
Annual Republic of Ireland (ROI) gas demands for 2012/13 are anticipated to be 1.8% below 2011/12 demands, following a
9.5% decrease the previous year. A reduction of 7.5% in power sector gas demands was offset by increases in Industrial and
Commercial (I/C) and residential demands of 3.2% and 12.1%, respectively.

In 2012/13 peak day gas demand was 1.3% higher than the 2011/12 peak day gas demand, and was equivalent to 2007/08
peak day. The increase in the gas demand was driven primarily by a 5% increrase in the power generation sector combined
with a 2% increase in I/C gas demand. Residential gas demand was 8.3% below 2011/12 peak.

The Moffat Entry Point4 is anticipated to meet 94% of annual Bord Gáis Éireann (BGÉ) system5 demands and 92% of ROI
demands for 2012/13, with Inch6 satisfying the remaining gas demands. In 2012/13, 90% of peak day BGÉ System gas
demands were met through the Moffat Entry Point, with the remaining 10% supplied through the Inch Entry Point.

Despite a 4.5% increase in renewable (wind) generation capacity in 2012, the wind capacity factors published by EirGrid and
SONI indicate total all island renewable generation was down 2% on 2011.

Both of the electrical interconnectors which serve the island of Ireland experienced outages in 2012/13. These outages most
likely resulted in higher levels of thermal electricity generation in Ireland than might otherwise have occurred.

1
    Bord Gáis Éireann, as System Owner, holds a licence relating to the ownership of the transportation system.
2
    Bord Gáis Networks carry out the day-to-day work in respect of the development, operation and maintenance of the transportation system on Gaslink’s behalf.
3
    Gaslink is the gas Transmission System Operator (TSO) and Distribution System Operator (DSO) in Ireland.
4
    The Moffat Entry Point is an off take from the UK National Grid gas transmission system, located in south west Scotland.
5
    BGÉ System includes for gas supplies to ROI, Northern Ireland & Isle of Man.
6
    The point of entry to the BGÉ system from the Kinsale gas storage and production field off the south coast of Ireland.

                                                                                                                                                                                    3
2.
Executive Summary
(continued)

2.2 Demand & Supply Forecast
As per EirGrid’s All-Island Generation Capacity Statement 2013-2022, power sector electrical demands are assumed to grow
in line with the Low Electricity Demand Forecast and wind powered generation is assumed to increase from 1,642 MW in
2012 to 4,335 MW by 2022.

Both annual and peak day gas demands are forecast to continue to increase over the period to 2021/22. The BGÉ system
annual gas demands are forecast to increase by 12% over the period, with peak day demands increasing by 8%. Annual
ROI gas demands are anticipated to increase by 15% above current demands by 2021/22, with peak day ROI gas demands
increasing by 9% over the period.

Growth in the period to 2021/22 is driven by an increase in power generation gas demands combined with an increase in I/C
demand. The residential demand is forecast to decline in response to energy efficiency savings.

The Moffat Entry Point continues to supply over 94% of the annual BGÉ system gas demands to 2014/15. First supplies
from the Corrib gas field, Bellanaboy Co. Mayo, are expected to commence in 2014/15 and are anticipated to meet 47% of
annual system demands in its first full year of commercial production, with the Inch Entry Point providing 6% and the Moffat
Entry Point supplying the balance. The remainder of the forecast period sees Corrib gas supplies decline, combined with
gradual decline in Inch gas, which re-establishes the Moffat Entry Point as the dominant supply point in 2021/22, supplying
73% of annual system demands.

2.3 Security of Supply
As Ireland’s designated Competent Authority under the European Union (EU) Regulation No. 994/2010 (Security of Gas Supply),
the Commission for Energy Regulation (CER) will implement a regional approach with the UK in order to meet Ireland’s obligations
under Article 6 (Infrastructure Standard) of this Regulation. This regional approach will be progressed during 2013/14.

During 2012, Gaslink submitted expressions of significance to the European Commission for Projects of Common Interest
(PCI). The PCIs submitted were:
•   Twinning of the South West Scotland Onshore System;
•   Physical Reverse Flow at Moffat Interconnection Point; and
•   Physical Reverse Flow from Northern Ireland to Ireland via Gormanston Entry Point.

In addition a number of other projects have been submitted by project promoters for PCI consideration. These include the
Shannon LNG terminal being proposed at Ballylongford Co.Kerry and Southwest Kinsale storage expansion project.

It is expected that the evaluation of the potential PCIs will be finalised in Q3 2013, where it is anticipated that 50 gas related
projects in the European Union will be granted PCI status.

In September 2012, Exercise Titan was conducted between the Transmission System Operators (TSOs), regulatory authorities
and Government Departments in Ireland and the UK. The exercise tested the formation of the Gas Emergency Response
Team, the compilation of Situation Reports on the state of the emergency, and the development of Action Plans for the
management of the gas supply emergency. The exercise was deemed successful.

4

Network Development Plan 2013

2.4 Capital Investment
Bord Gáis Networks is currently in its third Price Control period (“PC3”). This is a five year period and runs from October 2012 to
September 2017. The CER has given a capital allowance of €387m for investment on the transmission and distribution network.

Separately from the price control, Bord Gáis Networks has been granted approval by the Commission for Energy Regulation to extend
the natural gas network to Wexford Town, County Wexford and Nenagh Town, County Tipperary. Both of these projects will progress
over the next 18 to 24 months, these timelines are subject to necessary anchor load connections and statutory approvals.

Some of the significant programmes to be commissioned over next 36 months include;
•      Santry to Eastwall transmission pipeline refurbishment, Co. Dublin;
•      Waterford transmission pipeline refurbishment, Co. Waterford;
•      Ballymun Transmission pipeline refurbishment, Co. Dublin;
•      Mungret to Inchmore transmission pipeline refurbishment, Co. Limerick;
•      Baunlusk to Great Island transmission pipeline, Co. Wexford7;
•      Spur off Baunlusk to Great Island transmission pipeline to Belview Co. Kilkenny7;
•      Transmission pipeline marker refurbishment (national programme); and
•      Extension of the gas network to Tuam Co. Galway and Cootehill Co. Cavan.

The following are other significant programmes which overlap the 36 month period discussed above and run to the end of
the price control period;
•      Boiler & Waterbath refurbishment at pressure regulating stations;
•      Compressors station refurbishment;
•      Meter replacement;
•      Pressure regulating stations refurbishment; and
•      Communication & Instrumentation refurbishment.

2.5 Future & Innovative Investment
Bord Gáis Networks and Gaslink continue to recommend the reinforcement of the single 50 km section of transmission
pipeline in South West Scotland, in order to meet future capacity requirements and to guarantee the secure supply of gas to
the island of Ireland. A detailed study will be undertaken regarding the long term requirements for the compression facilities
at Beattock and Brighouse Bay in South West Scotland, as part of the planning strategy for the future development of the
Moffat Entry Point in Scotland.

In the ROI the transmission and distribution system in the north east region has been (and continues to be) identified as a
reinforcement priority for both capacity and strategic reasons and Bord Gáis Networks continue to recommend that this
reinforcement should proceed.

Bord Gáis Networks are undertaking a strategic reinforcement study to identify any necessary system modifications required
to safeguard customers against system failure, such as loss of strategic pipeline(s) or pressure regulating installation(s).

Bord Gáis Neworks is committed to the development of Compressed Natural Gas (CNG) as a substitute for diesel in the
transport sector. CNG has numerous advantages, the most prominent among them being that it is:
•      Cheaper – on average 30-60% cheaper than regular diesel8;
•      Cleaner – significant reductions in emissions including substantially reducing carbon dioxide, particulate matter and
        nitrogen oxide; and
•      A proven technology – there are over 14 million Natural Gas Vehicles in service throughout the globe.
7
    Third party funding provided.
8
    Subject to the government tax / excise duties.

                                                                                                                                        5
2.
Executive Summary
(continued)

2.6 Gas Nomination(s) Behaviour
Gaslink and Bord Gáis Networks have conducted analysis of nomination and re-nomination behaviour in the Power
Generation sector. Gaslink and Bord Gáis Networks depend on information provided by Shippers to manage the transmission
network. Gaslink may, in accordance with the Code of Operations restrict gas flows where timely nomination information
is not received from a Shipper. These provisions however have not been enforced under the Code. As the dependence on
the Moffat Interconnectors has increased the lack of timely nomination information, coupled with the changing energy
generation profile, will have a significant negative effect on the operational flexibility of the Gas Network. This is a cause for
concern for Gaslink and Bord Gáis Networks.

Gaslink and Bord Gáis Networks, in conjunction with the CER and EirGrid, carried out an analysis of the Power Generation
Shippers nomination patterns due to increasing concerns regarding Shipper behaviour. Results of this analysis were submitted
to the CER on the 1st of July 2013 and presented by Bord Gáis Networks at the Gas and Electricity Workshop on July 3rd 2013.
These concerns include:
• Lack of action from power generation shippers;
• Unnecessary constraint management;
• Increased cost of gas;
• Increasing flexibility requirement; and
• Change in power generation plant profile.

Bord Gáis Networks and Gaslink are working with industry to address these concerns and have compiled recommendations
to protect the link between the energy sectors in this changing environment and to ensure the future flexibility of the gas
network and protect all gas users from avoidable increased energy costs.

In response to increased variation, amongst other things, Bord Gáis Networks are presently expanding the network modelling
capability particularly in relation to a short time horizon. This will assist the operation of the network in response to varying
flow profiles and re-nominations.

2.7 Gas Market
In 2012, the CER and Gaslink worked to address infringement notices issued by the European Commission to both the
Republic of Ireland and the United Kingdom as Member States, with respect to violations of European Commission
Regulation EC No. 1775/20059 (2nd Energy Directive). In early 2012 the Regulatory Authorities declared Gormanston as the
Relevant Point on the South-North Pipeline. Following this declaration the Gaslink Code of Operations was modified to
introduce transportation arrangements on the South-North Pipeline, these included physical forward flow from the second
subsea interconnector (IC2) into Northern Ireland and virtual reverse flow from Northern Ireland into IC2.

In addition, Gaslink developed a virtual reverse flow product at the Moffat Entry Point in response to EC infringement
proceedings for the facility to virtually flow gas into Great Britain from Ireland. This service became available at the end of 2011.

Regulation No. 715/2009 also requires the establishment and implementation of a number of EU Network Codes. Article
8 of the Regulation requires Network Codes to be developed in 12 separate areas, including congestion management
rules, capacity allocation, interoperability rules, balancing rules and transmission tariffs. These Codes are to be applied at
Interconnection Points across Europe.

Congestion Management Procedures (CMP) were established first as a result of a revision to Annex 1 of EC Regulation No.
715/2009 as per European Commission Decision of 24th August 2012. The CMP Guidelines address the issue of contractual

9
    Regulation (EC) No. 1775/2005 of the European Parliament and of the Council of 28th September 2005 on conditions for access to the natural gas transmission networks.

6
Network Development Plan 2013

congestion at Interconnection Points between adjacent gas transmission systems, where Shippers cannot gain access to
capacity in spite of the physical availability of such capacity. These rules will be implemented by 1st October 2013.
The first Code, Capacity Allocation Mechanism (CAM), concerns how transmission capacity is allocated to network users. The code
also specifies how adjacent transmission system operators shall cooperate to facilitate the sale and usage of bundled capacity. This
Regulation will come into force in August/September 2013 and is required to be fully implemented by 1st November 2015.

Other Network Codes that are being progressed in Europe relate to balancing, and interoperability. The Balancing Network
Code is expected to be finalised in September 2013, and the Interoperability Code, which aims to harmonise the rules for the
operation of transmission systems at interconnection points in order to eliminate barriers to cross-border trade and so promote
efficient gas trading and transport across gas transmission systems within the EU is expected to be finalised in 2014.

Work is also nearing completion on Framework Guidelines on Harmonised Tariff Structures. It is expected that a finalised
Framework Guidelines will be complete by November 2013. Once approved, European Network of Transmission System Operators
for Gas (ENTSOG) will commence work on the Network Code.

2.8 Adequacy of the Gas Network
The results of the network analysis indicate that the high pressure sections of the ROI transmission system have sufficient
capacity to meet forecasted gas flow requirements in the short to medium term. However, some of the lower pressure local area
(regional) transmission networks are likely to require capital investment to meet future capacity needs.

In the medium to long term, the southern region of the ROI transmission system is anticipated to require reinforcement, which
would involve reinforcing the 400 mm transmission pipeline between Goatisland, Co. Limerick and Curraleigh West, Co.
Tipperary.

Bord Gáis Networks are undertaking a strategic reinforcement study to identify any necessary system modifications required to
safeguard customers against system failure, such as loss of strategic pipeline(s) or pressure regulating installation(s).

The outlook for the Moffat Entry Point and the associated infrastructure (the Interconnector system) is similar to previous
development statements; capacity limits at the Moffat Entry Point will be approached in winters 2013/14 and 2014/15 and any
subsequent years Corrib is delayed. This situation is anticipated to reoccur towards the end of the ten year forecast period.

The reinforcement of the 50 km single section of transmission pipeline in South West Scotland Onshore System (SWSOS)
remains a priority. The EU authorities have also recognised the importance of this reinforcement, identifying this project as a
potential Project of Common Interest (PCI), under the guidelines for Trans-European Energy Infrastructure.

The Moffat Entry Point and Interconnector system are pivotal in facilitating the current level (and future levels) of renewable
generation in Ireland. Midleton Compressor Station is important to the ROI system and in particular the southern region.

The NDP demand and supply forecasts indicate, there may be a number of days when indigenous ROI supplies would meet all
(or most) of the ROI demand and the Moffat Entry Point would be required to meet NI and Isle of Man (IOM) demand only.
On such days, there may be a requirement to flow gas at the Moffat Entry Point in excess of the total NI and IOM demand.
This excess flow may be required in order to maintain flows above the minimum operating limits of the Interconnector
system. This would ensure system integrity, meet downstream pressure commitments and ensure adequate security of supply
for the ROI. Bord Gáis Networks are currently investigating a range of options that could meet this requirement.

                                                                                                                                            7
3.
Introduction

               Caption
Network Development Plan 2013
0.
heading
(continued)
Key Messages:
•2 012/13 gas demand is anticipated to be 1.8% below 2011/12
demands following a 9.5% decrease the previous year;
• Moffat Entry Point accounts for 94% of BGÉ system annual gas demand
and 90% of system peak day gas demand in 2012/13; and
• Moyle and East West Electrical Interconnectors were forced to operate
at reduced capacity during winter 2012/13.
The role of Gaslink, as the transmission and distribution system licence holder in Ireland, is to promote an open and competitive
market. It is an independent subsidiary of Bord Gáis Éireann (BGÉ) in its organisation and decision making processes. Gaslink
identifies all work necessary for the operation, maintenance and development of the transportation system, and instructs Bord Gáis
Networks accordingly.
The NDP covers the 10 year period from 2012/13 to 2021/22. It is published by Gaslink, with the assistance of Bord Gáis Networks.
The NDP satisfies the requirements of both Condition 11 of Gaslink’s Transmission System Operator licence and Article 22 of
Directive 2009/73/EC of the European Parliament to produce a long term development plan.
The publication of the NDP also satisfies the requirements of Article 19 of the Gas (Interim Regulations) Act 2002, as amended by
the European Communities (Security of Natural Gas Supply) Regulations 2007 (S.I. No. 697 of 2007). This requires the CER to publish
a report outlining supply and demand in Ireland over the next seven years.
Gaslink holds two licences from the Commission for Energy Regulation (CER) for the operation of the ROI transmission and
distribution systems, which cover the following areas:
• Connection to the transmission and distribution systems;
• Transmission and distribution system standards;
• Operating security standards;
• Provision of metering and data services; and
• Provision of services pursuant to the Code of Operation (the “Code”).
90.
3.
heading
Introduction
(continued)
3.1 Investment Infrastructure Completed
There is a continuous programme of works to ensure that the network compiles with relevant legislation, technical standards
and codes. Equally, capacity limitations identified on the network and capital investment programmes are implemented to
ensure continuity of supply to all customers.
The following are some of the significant programmes commissioned during the past twelve months, in addition to
maintaining a rolling planned maintenance programme.
Pressure regulating stations capacity investment:
• Brinny, Co. Cork;
• Suir Road, Co. Dublin;
• Blakestown, Co. Dublin; and
• Newtownstalaban, Co. Dublin.
The following are rolling capital investment programmes:
• Aerial Marker Post Replacement; and
• Meter Replacement (Domestic and Industrial Commercial).
The town of Macroom was connected to the natural gas network, supplied from Brinny, County Cork. The connection involved
the construction of a medium and low pressure gas network to facilitate the connection of Macroom to the gas network.
3.2 Historic Demand & Supply
3.2.1 ROI Annual Primary Energy Requirement
The Sustainable Energy Authority of Ireland (SEAI) report that Ireland’s Total Primary Energy Requirement (TPER) for 2011
fell by 7% compared to 2010.
Oil continued to dominate the 2011 TPER accounting for 50% of total energy demands, as shown in Figure 3.1. Gas
accounted for 29% of 2011 energy demands, reflecting its role in electricity generation, process and heating use.
Renewable generation increased its share of TPER to 6%.
Figure 3.1: ROI TPER Analysis by Fuel (2010-2011)
51% 50%
5% 6%
8% 9%
(2010) (2011)
0.3% 0.3%
5% 6%
31% 30%
Oil Peat Coal E. Import REN Gas
Source: SEAI 2013
10Network Development Plan 2013
0.
heading
(continued)
3.2.2 Historic Annual Gas Demand
Annual ROI gas demands for 2012/13 are anticipated to be 1.8% below 2011/12 demands following a 9.5% decrease the
previous year, as shown in Figure 3.2. A reduction of 7.5% in power sector gas demands was somewhat offset by increases
in I/C and residential demands of 3.2% and 12.1%, respectively. The reduction in power sector gas demands is largely due
to a decrease in overall electricity demand and a more dominant position for coal fired generation.
Figure 3.2: Historic Annual Gas Demand
80,000.0
70,000.0
Annual Demand (GWh/yr)
60,000.0
50,000.0
40,000.0
30,000.0
20,000.0
10,000.0
0.0
2010/11
2011/12
2007/08
2008/09
2009/10
2012/13
RES I/C Power Total ROI Total BGE System
Total annual system gas demands for 2012/13 are estimated to be 0.6% below the previous year’s gas demands. A 1.8%
decrease in ROI gas demand is somewhat offset by a 3.4% increase in Northern Ireland (NI) and Isle of Man (IOM) gas
demands. The historic gas demand is presented in Figure 3.3.
Figure 3.3: Historic BGÉ System Gas Demand
80,000.0
70,000.0
Annual Demand (GWh/yr)
60,000.0
50,000.0
40,000.0
30,000.0
20,000.0
10,000.0
0.0
2010/11
2011/12
2007/08
2008/09
2009/10
2012/13
ROI NI+IOM Total BGE
110.
3.
heading
Introduction
(continued)
3.2.3 Historic Peak Day Gas Demand
In 2012/13 peak day gas demand was 1.3% higher than the 2011/12 peak day gas demand, and was equivalent to
2007/08 peak day demand. The increase in the gas demand was driven primarily by a 5% increase in the power generation
sector combined with a 2% increase in I/C gas demand. Residential gas demand was 8.3% below 2011/12 peak. Figure 3.4
presents the historic trend in peak day gas demands.
Figure 3.4: Historic ROI Peak Day Gas Demand
350.0
300.0
Peak Demand (GWh/d)
250.0
200.0
150.0
100.0
50.0
0.0
2010/11
2011/12
2007/08
2008/09
2009/10
2012/13
RES I/C Power Total ROI Total BGE System
The BGÉ system 2012/13 peak day gas demand was 3.5% below 2011/12 levels. The decrease was driven primarily by a
15.4% reduction in NI and IOM peak day gas demands.
3.2.4 Ireland’s Weather
Based on a Degree Day (DD) comparison, 2012 calendar year was almost 10% colder than 2011 and was more reflective of
long run norms.
A DD comparison shows that gas year 2012/13 has been 34% colder than 2011/12 and 13% colder than the long run average.
3.2.5 Wind Powered Generation
Despite a 4.5% increase in renewable (wind) generation capacity in 2012, the wind capacity factors published by EirGrid
and SONI indicate total all island renewable generation was down 2% on 2011. This is primarily due to less favourable
wind conditions for renewable generation than those experienced in 2011. At its peak in winter 2012/13, wind powered
generation accounted for 55% of ROI electricity demand.10
3.2.6 Electricity Interconnectors
Both of the electrical interconnectors which serve the island of Ireland experienced outages in 2012/13.
The commercial operation of the East West Interconnector (EWIC) was temporarily deferred in October 2012, following reports
of possible telecoms interference in the vicinity of the land route of the cable. This saw a temporary reduction in available
capacity to 250 MW from its operational capacity of 500 MW. The EWIC commenced full operation in March 2013.
A fault occurred on the north cable of the Moyle Interconnector in June 2012, causing it to cease operation. The Moyle
Interconnector continues to operate at 250 MW transfer capacity (half the full capacity of the interconnector).
The reduction in the import capacity of the electrical interconnectors most likely resulted in higher levels of thermal
electricity generation in Ireland than might otherwise have occurred.
10
Calculations carried out by BGÉ employed wind generation data and corresponsing system demand data from Eirgrid. http://www.eirgrid.com/operations/systemperformancedata/
12Network Development Plan 2013
0.
heading
(continued)
3.2.7 Historic Gas Supply
The Moffat Entry Point is anticipated to meet 94% of annual BGÉ system demands and 92% of ROI demands for 2012/13,
with Inch satisfying the remaining gas demands. During 2011/12 the Moffat Entry Point accounted for 94% of system
demands and 93% of ROI demands. The change in the percentage of ROI demand met through Moffat is attributed to the
reduction in gas demand combined with only a slight reduction in the gas supply through the Inch Entry Point. Figure 3.5
shows historic ROI gas supplies.
Figure 3.5: Historic Annual Indigenous Gas Production and Great Britain (GB) Imports
5,000
4,500
4,000
3,500
Supplies (kTOE/year)
3,000
2,500
2,000
1,500
1,000
500
0
1990
1992
1994
1996
1998
2000
2002
2004
2006
2008
2010
2012
IND GB
In 2012/13 90% of peak day BGÉ System gas demands were met through the Moffat Entry Point, with the remaining
10% supplied through the Inch Entry Point. The Moffat Entry Point met 89% of peak system gas demands in 2011/12.
The Moffat Entry Point met 88% of ROI peak day gas demands in 2012/13, an increase from 85% in 2011/12.
Figure 3.6 shows the sources of BGÉ system peak day gas supplies.
Figure 3.6: BGÉ System Peak Day Gas Supplies
400.0
350.0
300.0
Supplies (GWh/d)
250.0
200.0
150.0
100.0
50.0
0.0
2004/05
2006/07
2008/09
2010/11
2012/13
Moffat Inch
134.
Gas Demand & Supply Forecast
Kinsale Energy Gas PlatformNetwork Development Plan 2013
Key Messages:
•A nnual ROI gas demands are anticipated to increase by 15% by 2021/22;
• Peak day ROI gas demands are anticipated to increase by 9% over the
period;
• Moffat Entry Point continues to supply over 94% of the annual BGÉ
system gas demands to 2014/15; and
• Corrib gas field meets 25% of peak day system demands in 2015/16.
4.1 Gas Demands
This chapter presents the forecast gas demand and corresponding supply for the period 2013/14 to 2021/22. The NDP
forecasts future gas demands by examining the development of individual power, I/C and residential sector gas demands.
4.1.1 Assumptions
A number of external data sources are referenced when generating future gas demands along with additional sector specific
assumptions. A brief outline of assumptions is presented here, with further detail presented in Appendix 2.
4.1.1.1 Power Sector
Power sector electrical demands are assumed to grow in line with EirGrid’s Low Electricity Demand Forecast, as outlined in
the 2013 All-Island Generation Capacity Statement, as shown in Figure 4.1. It is assumed that 627 MW of thermal generation
will be commissioned over the period to 2021/22, with 885 MW of plant decommissioning. The deployment of renewable
energy generation is assumed to be in line with EirGrid’s current forecasts, which anticipates an increase in wind powered
generation from 1,642 MW in 2012 to 4,335 MW by 202211. Figure 4.2 presents the thermal generation plant mix over the
forecast time horizon.
Figure 4.1: ROI Forecast Electricity Demand
$)#+###$$
30,000 5500
29,500
5400
29,000
Annual Demand (Gwh)
5300
Peak Demand (MWh)
28,500
5200
28,000
5100
27,500
5000
27,000
26,500 4900
26,000 4800
2013/14 2014/15 2015/16 2016/17 2017/18 2018/19 2019/2020 2020/21 2021/22
Annual Electricity Demand Peak electricity Demand
11
All-Island Generation Capacity Statement, 2013-2022. http://www.eirgrid.com/aboutus/publications/
154.
Gas Demand & Supply Forecast
(continued)
Figure 4.2: Single Electricity Market (SEM) Thermal Generation Mix
12,000.0
10,000.0
Generation Capacity (MW)
8,000.0
6,000.0
4,000.0
2,000.0
0.0
2013/14
2014/15
2015/16
2016/17
2017/18
2018/19
2019/20
2020/21
2021/22
Peat LSFO GB Import GasOil Gas Coal
4.1.1.2 Industrial and Commercial
Industrial and commercial gas demand is assumed to continue to increase in line with anticipated connection numbers
and forecast Gross Domestic Product (GDP) as appropriate. Figure 4.3 presents the GDP growth rate assumptions over the
forecast period. GDP forecasts take account of the latest Economic and Social Research Institute (ESRI) Quarterly Economic
Commentary, Central Bank Bulletin and the Organisation for Economic Co-operation and Development (OECD) Economic
Outlook combined with further long range economic forecasts. Strong growth is also expected in the export led sector
increasing I/C gas demand in later years.
Figure 4.3: GDP Assumptions
3.5
3.0
2.5
GDP Growth Rate (%)
2.0
1.5
1.0
0.5
0.0
2013/14 2014/15 2015/16 2016/17 2017/18 2018/19 2019/2020 2020/21 2021/22
GDP
4.1.1.3 Residential
The forecast of new residential customer numbers is shown in Figure 4.4. It is assumed that residential numbers will grow
slowly over the initial period, increasing to over 7,500 additional connections each year from 2017/18.
16Network Development Plan 2013
Figure 4.4: Residential Connection Numbers
12,000.0
10,000.0
8,000.0
Connection Numbers
6,000.0
4,000.0
2,000.0
0.0
-2,000.0
-4,000.0
2013 /14
2014 /15
2015 /16
2016 /17
2017 /18
2018 /19
2019 /20
2020 /21
2021 /22
Disconnections One-off New
4.1.1.4 Energy Efficiency
Energy efficiency savings impacting on I/C and residential gas demands are derived from the National Energy Efficiency Action
Plan (NEEAP)12. Energy efficiency savings for the I/C and residential sectors have been estimated to equate to 66 GWh/yr and
26.6 GWh/yr respectively. Based on consultation with a variety of sources, it is assumed that 50% of energy savings will be
achieved. This equates to an annual saving of 33 GWh/yr in the I/C sector and 13.3 MWh/house/yr in the residential sector.
Assumptions relating to energy efficiency savings are further outlined in Appendix 3.
4.1.2 Forecast
Both annual and peak day gas demands are forecast to continue to increase over the period to 2021/22, as shown in Table
4.1. The BGÉ system annual gas demands are forecast to increase by 12% over the period with peak day demands increasing
by 8%. Annual ROI gas demands are anticipated to increase by 15% by 2021/22, with peak day ROI gas demands increasing
by 9% over the period, as shown in Figure 4.5.
Table 4.1: Annual and Peak Day ROI Gas Demands
2013 /14 2014 /15 2015 /16 2016 /17 2017 /18 2018 /19 2019 /20 2020 /21 2021 /22
Annual (TWh/yr) 48.4 51.0 51.4 51.8 52.2 52.5 53.2 53.9 55.7
1 in 50 Peak (GWh/d) 282.1 287.4 292.0 296.0 296.3 299.4 302.9 303.0 307.7
Figure 4.5: 1 in 50 Peak Day and Annual ROI Gas Demand Forecast
310.0 58.00
305.0
56.00
Peak Demand (GWh/d)
Annual Demand (TWh/yr)
300.0
54.00
295.0
290.0 52.00
285.0 50.00
280.0
48.00
275.0
46.00
270.0
265.0 44.00
2013/14
2014/15
2015/16
2016/17
2017/18
2018/19
2019/20
2020/21
2021/22
Peak Day Annual Demand
12
NEEAP targets relate to the first action plan published in 2009. NEEAP 2 was launched in February 2013 after the data freeze deadline for NDP 2013 and so could not be incorporated.
174.
Gas Demand & Supply Forecast
(continued)
The growth in annual ROI gas demand is presented in Figure 4.6. Growth in the period to 2021/22 is driven by a 21%
increase in power generation gas demands combined with a 17% increase in I/C demand. Residential gas demand is
anticipated to decline by 6% over the period, despite additional connections on the system. This is due primarily to the
impact of energy efficiency savings and revised building regulations.
The power generation sector is expected to account for the majority of the annual growth. Power generation demand
growth can be attributed to the assumptions of increasing electricity demand, increasing carbon prices (impacting coal
generation) and the phasing out of the peat Public Service Obligation (PSO) levy (impacting peat generation).
The industrial commercial demand growth can be attributed to the assumption of economic recovery and new connections.
Figure 4.6: Annual ROI Gas Demand Forecast
50.0
40.0
Annual Demand (TWh/yr)
30.0
20.0
10.0
0.0
2013/14
2014/15
2015/16
2016/17
2017/18
2018/19
2019/20
2020/21
2021/22
RES I/C Power Annual Demand
The growth of 1 in 50 year peak day ROI gas demands is presented in Figure 4.7. Power generation gas demand is estimated
to increase by 14% over the period to 2021/22, followed by a 14% increase in I/C gas demand. This is due primarily to a
growth in peak day electricity demand, combined with an increase in the level of gas fired generation dispatched onto the
electrical system. The residential peak is anticipated to decline by 6%, again in response to energy efficiency savings.
Forecasted peak day gas demand growth will be primarily driven by the anticipated increase in power generation gas
demand. The forecasted growth in peak day gas demand is expected to be less than annual demand, as the factors impacting
annual power generation gas demand have less of an impact on peak day gas demand; in particular, increasing carbon prices
and the phasing out of the peat PSO levy.
Renewable generation is assumed to play a negligible role on the peak days and consequently thermal plants meet nearly all
of the electricity demand requirements, on a day when electricity demands are at their highest. On such days nearly all of the
thermal plants are fully despatched, regardless of high carbon prices and the phased out peat PSO.
18Network Development Plan 2013
Figure 4.7: 1 in 50 Peak Day ROI Gas Demand Forecast
300.0
250.0
200.0
Peak Demand (GWh/d)
150.0
100.0
50.0
0.0
2013/14
2014/15
2015/16
2016/17
2017/18
2018/19
2019/20
2020/21
2021/22
RES I/C Power Peak Day
4.2 Gas Supply
Figure 4.8 presents the forecast BGÉ system annual gas supply for the period to 2021/22. The Moffat Entry Point continues
to supply over 94% of the annual BGÉ system gas demands to 2014/15. The commissioning of the Corrib gas field in
2014/15 is expected to meet 47% of annual system demands in its first full year of commercial production, with Inch Entry
Point supplying 6% and the Moffat Entry Point providing the balance. The remainder of the forecast sees Corrib gas supplies
decline, combined with gradual decline in Inch gas, which re-establishes the Moffat Entry Point as the dominant supply point
in 2021/22, supplying 73% of annual system demands.
Figure 4.8: Annual BGÉ System Gas Supply Forecast
Annual Gas Supply Forecast
80.0
70.0
60.0
Annual Supply (TWh/yr)
50.0
40.0
30.0
20.0
10.0
0.0
2013/14
2014/15
2015/16
2016/17
2017/18
2018/19
2019/20
2020/21
2021/22
Corrib Inch Moffat
194.
Gas Demand & Supply Forecast
(continued)
The 1 in 50 year BGÉ system peak day gas supply profile is presented in Figure 4.9. The Moffat Entry Point continues to
provide over 90% of system gas demands to 2015/16. The Corrib gas field supplies 25% of peak day demands in 2015/16,
with Inch providing 10% and the Moffat Entry Point continuing to meet the remaining 65% of demands. Entry through the
Moffat Entry Point increases beyond 2015/16 to return to 85% of peak day supply by 2021/22. This forecast highlights the
continued critical role of the Moffat Entry Point throughout the forecast period.
Figure 4.9: 1 in 50 Peak Day Gas Supply Forecast
1 in 50 Peak Day Gas Supply Forecast
450.0
400.0
Peak Day Supply (GWh/d)
350.0
300.0
250.0
200.0
150.0
100.0
50.0
0.0
2013/14
2014/15
2015/16
2016/17
2017/18
2018/19
2019/20
2020/21
2021/22
Corrib Inch Moffat
4.2.1 Moffat
The Moffat Entry Point continues to function as the largest source of gas supply to the BGÉ transmission system and is forecast
to maintain this position into the future. It has a current technical capacity of 31 mscm/d (342 GWh/d) and supplies gas to ROI,
NI and IOM. It has reliably met the systems energy demand requirements and ensured security of supply for Ireland since the
construction and commissioning of IC1 in 1993. This connection to the GB National Transmission System (NTS) provides access
to the global energy markets and facilitates Ireland’s participation in an integrated European energy market.
4.2.2 Celtic Sea Gas Storage
The Kinsale storage facility is operated by PSE Kinsale Energy Limited using the depleted Southwest Kinsale gas field. It
currently has a working volume of c. 230 mscm (2,472 GWh), which is equivalent to approximately 5% of Ireland’s annual
gas consumption in 2012/13. It has a maximum withdrawal rate of 2.7 mscm/d (29.3 GWh/d) and a maximum injection rate
of 2.55 mscm/d (27.6 GWh/d). It mainly operates as a seasonal storage facility, but can also accommodate within-day gas
withdrawals and injections. It is proposed to increase gas storage capacity to 290 mscm from summer 2014, together with an
increase in the maximum withdrawal rate, increasing it to 3.97 mscm/d.
PSE Kinsale Energy Limited is presently determining the commercial feasibility of additional future development. It has
been noted that the economic viability of the existing storage facility is linked to that of its gas production operations.
The company has informed the CER that, as gas production gradually declines, the existing storage operations will not be
economic on a standalone basis without further development. PSE has indicated that existing storage operations may cease
in 2017/18, thereafter a blowdown period will begin, during which injection operations will cease and the cushion gas will
be drawn down from the wells in the years from 2018/19 to 2021/22. It is anticipated that in such a scenario gas will be
supplied from the Inch Entry Point during both winter and summer periods. PSE Kinsale Energy have also advised that storage
activities may continue subject to market conditions.
20Network Development Plan 2013
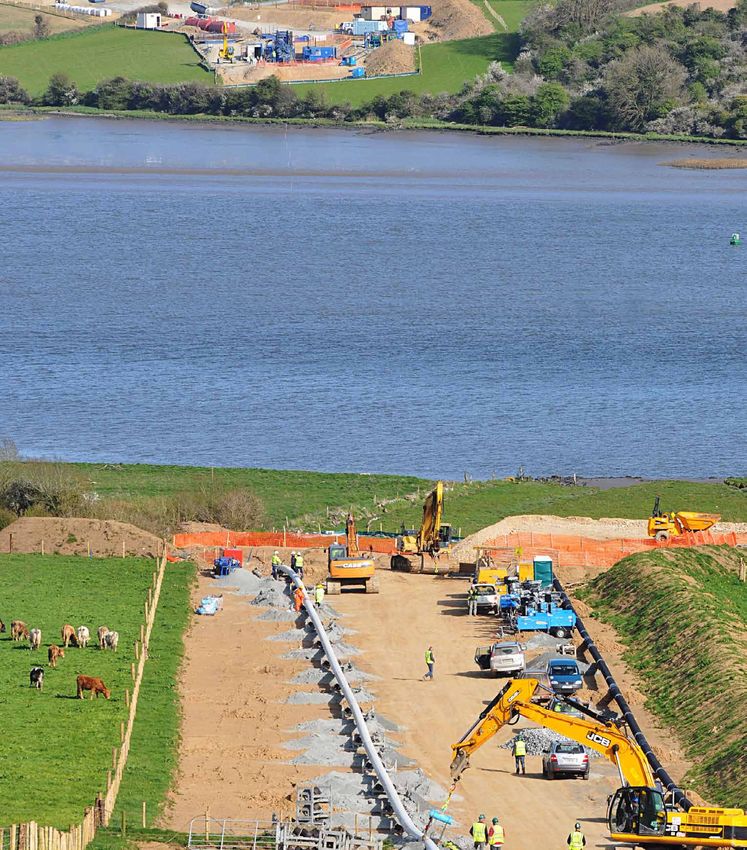
4.2.3 Corrib Gas
Construction of the onshore phase of the Corrib gas pipeline, which includes a 4.9 km tunnel to carry the gas pipeline under
Sruwaddacon Bay, is the final key phase of the project. Following 18 months of preparatory works, tunnelling commenced
in December 2012. Construction of the onshore terminal is virtually complete and the facility is currently being maintained
while it awaits gas from the Corrib field.
First gas from Corrib is expected to flow at the end of 2014/early 2015. Table 4.2 shows the forecast maximum daily supply
from Corrib.
For planning purposes, the NDP forecast assumes that the facility may not be operational during the peak winter period of
2014/15, which may occur during the facilities commissioning period and hence assumes first commercial production from
October 2015. The impact of one year sensitivity is also assessed, where the facility is assumed to commence full operation in
October 2014 or is delayed until October 2016.
Table 4.2: Corrib Forecast Maximum Daily Supply
Year 1 Year 2 Year 3 Year 4 Year 5 Year 6 Year 7 Year 8 Year 9
Daily Supply (mscm/d) 8.9 8.1 7.0 7.0 6.7 5.9 5.0 5.03 4.44
Daily Supply (GWh/d) 92.7 84.4 72.9 72.9 69.8 61.5 52.1 52.4 46.3
4.2.4 Shannon LNG
Shannon LNG have indicated the earliest possible start date of 2018 for commercial operation, assuming a resolution to a
number of uncertainties and delays. Shannon LNG has received planning permission for both its proposed liquefied natural
gas (LNG) terminal near Ballylongford in Co. Kerry, and for the associated transmission pipeline that will deliver the gas into
the ROI transmission system. It is indicated that the terminal would be developed on a phased basis:
• T he initial phase will involve the construction of an LNG storage tank(s), and re-gasification facilities with a maximum
export capacity of up to 191.1 GWh/d (17.0 mscm/d); and
• Subsequent phases with an ultimate capacity of up to 314.7 GWh/d (28.3 mscm/d).
4.2.5 Other Supply Developments
Gaslink and Bord Gáis Networks welcome new sources of gas supply and are willing to fully engage with both prospective
onshore and offshore sources. Bord Gáis Networks has an excellent track record in delivering infrastructure projects.
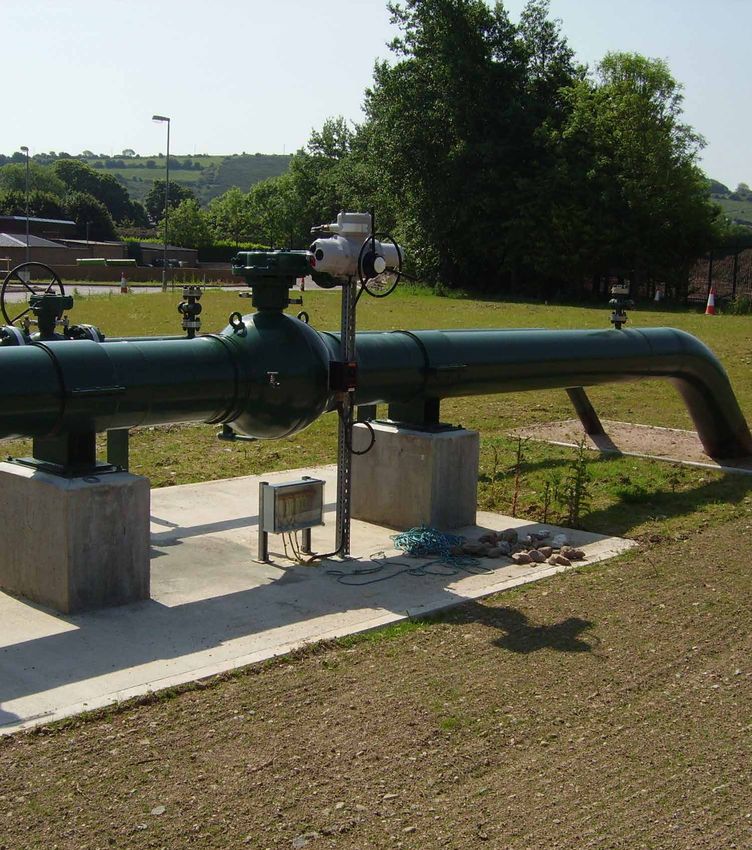
215. The Gas Network Infrastructure Midleton Compressor Station filters
Network Development Plan 2013

Key Messages:

• Linear gas infrastructure grew by 1% for distribution;
• Operation of the network remains challenging given fluctuations in
  demand profiles;
• Reduction in transmission pipeline encroachments by 7%; and
• July 2012, the CER announced its decision to proceed to Phase 2 of the
  national rollout programme for electricity and gas smart metering.

5.1 Overview of the BGÉ Gas Network
The BGÉ13 transmission system includes onshore Scotland, interconnectors and the ROI system. The interconnector system
comprises of two subsea Interconnectors between ROI and Scotland; compressor stations at Beattock and Brighouse Bay, and
110 km of onshore pipeline between Brighouse Bay and Moffat in Scotland. The Interconnector (IC) system connects to the
GB NTS at Moffat in Scotland. It also supplies gas to the NI market at Twynholm and the IOM market via the second subsea
Interconnector (IC2). The IC system is also used to provide a gas inventory service to ROI shippers.

The BGÉ ROI gas network is 13,309 km in length, consisting of 2,149 km of high pressure steel transmission pipelines
and 11,160 km lower pressure polyethylene distribution pipelines, Above Ground Installations (AGIs), District Regulating
Installations (DRIs) and compressor stations at entry points in ROI and Scotland. AGIs and DRIs are used to control and reduce
pressures on the network.

The ROI system consists primarily of a ring-main system with spur lines serving various network configurations and a
compressor station located in Midleton Co. Cork.

The gas infrastructure is differentiated by the following pressure regimes:
•       High pressure transmission infrastructure which operates above 16 barg; and
•       Distribution infrastructure which operates below 16 barg.

The distribution infrastructure is typically operated at 4 barg and less than 100 mbarg for inner city networks.
Figure 5.1 shows an overview of the BGÉ Transmission system.

13
     The BGÉ System includes infrastructure in ROI, NI & South West Scotland, this network development plan only assesses the ROI and South West Scotland infrastructure.

                                                                                                                                                                                    23
5.
The Gas Network Infrastructure
(continued)
Figure 5.1: Overview of the BGÉ Transmission System
Scotland
Moffat
Entry Point
Beattock Compressor
Coleraine
DerryCity
Derry City
Ballymone .
Limavady .I.P
S.N Twynholm AGI
Pwr Station
Ballymena
Antrim
Brighouse
Lurgan
Bay Compressor
Craigavon
Corrib Gas Field Portadown Belfast
Armagh
Banbridge Pwr Station
Ballin a Lough Egish Newry
Crossmolina Cootehill
r2 Isle of Man
Carrickmacross to
Castlebar Dundalk ec
nn
Bailieborough Kingscourt erco r1
Int
to
ec
Westport Virginia
nn
co
Ballinrobe Claremorris Kells Navan
er
Drogheda
Int
Headford Tuam Mullingar Trim Gormanston
Athlone Loughshinny
Abbotstown
Enfield Kilcock Dublin
Galway Ballinasloe Tullamore Prosperous 5 Pwr Stations Existing Pipelines
Naas
Tynagh Portarlington Kildare Blessington Brownsbarn
Craughwel l Pwr Station
Monasterevin
Bray Planned/Under Construction
Loughrea
Gort Portlaoise Ballymore Eustace
Nenagh Kilcullen Wicklow
Ennis Sixmilebridge Athy Pipelines Owned by Others
Ballina Ballyragget
Carlow
Shannon Arklow
Tarbert Limerick Cashel
Askeaton
Tipperary town Kilkenny City
Aughinish
Pwr Station Cahir
Carrick-on-Suir Great Island Town
Charleville
Mitchelstown Wexford
Waterford Town (proposed)
Ardfinnan
Mallow
Fe rmoy Entry Points
Tramore
Macroom Cork Midleton Compressor
Bandon
Landfall Station
2 Pwr Stations
Ballineen
Power Station
Kinsale Inch Entry Point
Lehenaghmore
Kinsale Head Gas Field
Seven Heads Gas Field
5.2 Network Assets & Information
For Bord Gáis Networks to maintain a safe, secure and efficient network and to meet its primary responsibility to transport
gas from entry to exit points, the integrity and safety of the infrastructure system must be assured. This section discusses
some of the key infrastructure in place on the network.
5.2.1 Compressor Stations
Gas compressors boost pressures at the periphery of the system in order to meet pressure requirements and system demand.
Bord Gáis Networks operates three compressor stations in its transmission network, two located at Beattock and Brighouse
Bay in Scotland and one in Midleton in the ROI.
24Network Development Plan 2013
Bord Gáis Networks operate mechanical compressors and continue to explore new technologies, to meet its obligation to
ensure system integrity to meet system demand. Compressor sites are designed with redundancy for standby purposes to
ensure security of supply. Where challenges arise in the operation of the network, such as low flow demands, additional
solutions may be required to ensure operational efficiency and flexibility of the network.
Bord Gáis Networks are using enhanced network modelling capability in order to improve modelling of the compressor outputs.
5.2.2 Pressure Regulating Stations
The network includes a number of pressure regulating stations to control pressure and flow to operate the transmission
system. The pressure of the gas in the system is controlled and delivered to large consumers, such as power stations or
reduced for supply to the distribution system for delivery to domestic end users. On the distribution system, further pressure
reduction occurs to supply high density locations such as those found within city and town centres.
5.2.3 Meters
5.2.3.1 Meter Replacement & Maintenance Programme
There are currently a number of meter replacement programmes ongoing, which are briefly outlined below:
Domestic Meter Replacement
This programme involves the replacement of the oldest meters on the gas network with ultrasonic meters. Figure 5.2 shows
the volume of ultrasonic meters fitted to date under the meter replacement programme.
Figure 5.2: Meter Replacement Programme Installations
Meter Replacement Programme Installation Details
90000
79349
80000
70000
60000
Quantity
50000
40000 36112
33764
30000
20000
9473
10000
0
2010 2011 2012 Total
Year
Industrial/Commercial Meter Replacement
This programme involves replacing older meters at low and medium pressure non-daily metered (NDM) distribution sites in
the industrial/commercial sector.
Meter Maintenance
Bord Gáis Networks are actively carrying out a battery replacement programme, together with on-going general
maintenance, as part of a larger preventative maintenance programme.
25You can also read