2020 PJM Reserve Requirement Study - October 6, 2020 11-year Planning Horizon: June 1st 2020 - May 31st 2031 - PJM.com
←
→
Page content transcription
If your browser does not render page correctly, please read the page content below

2020 PJM Reserve Requirement Study

                       11-year Planning Horizon:
                     June 1st 2020 - May 31st 2031
                 Analysis Performed by PJM Staff
                Reviewed by Resource Adequacy Analysis Subcommittee

                                     October 6, 2020
This page is intentionally left blank.

PJM © 2020                               www.pjm.com   2|Pa g e
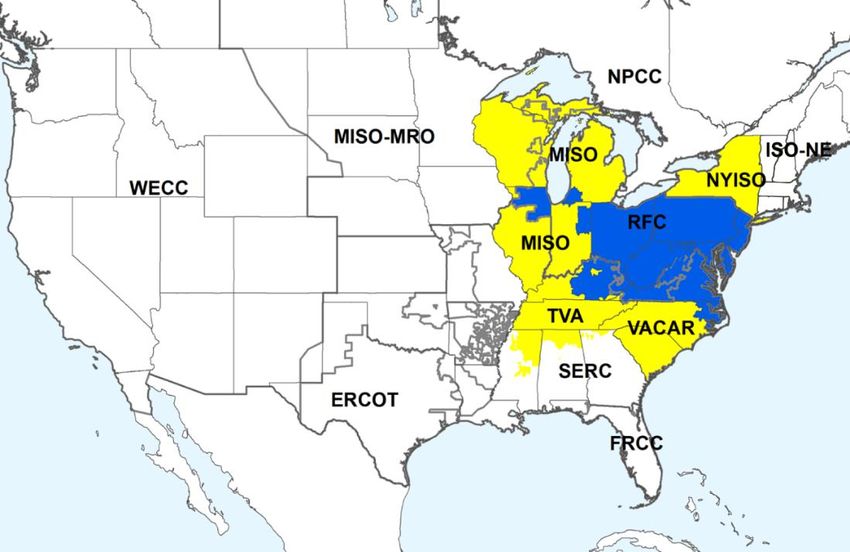
Table of Contents
I.           Results and Recommendations .................................................................................................................................. 7
PJM RRS Executive Summary ................................................................................................................................................. 8

Introduction ............................................................................................................................................................................. 13

                           Purpose ...................................................................................................................................................... 13

                           Regional Modeling ...................................................................................................................................... 13

Summary of RRS Results ....................................................................................................................................................... 15

                           Eleven-Year RRS Results .......................................................................................................................... 15

Recommendations .................................................................................................................................................................. 21

II.          Modeling and Analysis .............................................................................................................................................. 22
Load Forecasting .................................................................................................................................................................... 23

                           PJM Load Forecast – January 2020 Load Report ...................................................................................... 23

                           Monthly Forecasted Unrestricted Peak Demand and Demand Resources ................................................ 23

                           Forecast Error Factor (FEF) ....................................................................................................................... 24

                           21 point Standard Normal Distribution, for daily peaks............................................................................... 24

                           Week Peak Frequency (WKPKFQ) Parameters ......................................................................................... 24

                           PJM-World Diversity ................................................................................................................................... 25

Generation Forecasting........................................................................................................................................................... 27

                           GADS, eGADS and PJM Fleet Class Average Values ............................................................................... 27

                           Generating Unit Owner Review of Detailed Model ..................................................................................... 28

                           Forced Outage Rates: EFORd and EEFORd ............................................................................................. 28

                           Fleet-based Performance by Primary Fuel Category ................................................................................. 31

                           Modeling of Generating Units’ Ambient Deratings ...................................................................................... 32

                           Generation Interconnection Forecast ......................................................................................................... 32

Transmission System Considerations ..................................................................................................................................... 33

          PJM © 2020                                                                      www.pjm.com                                                                        3|Pa g e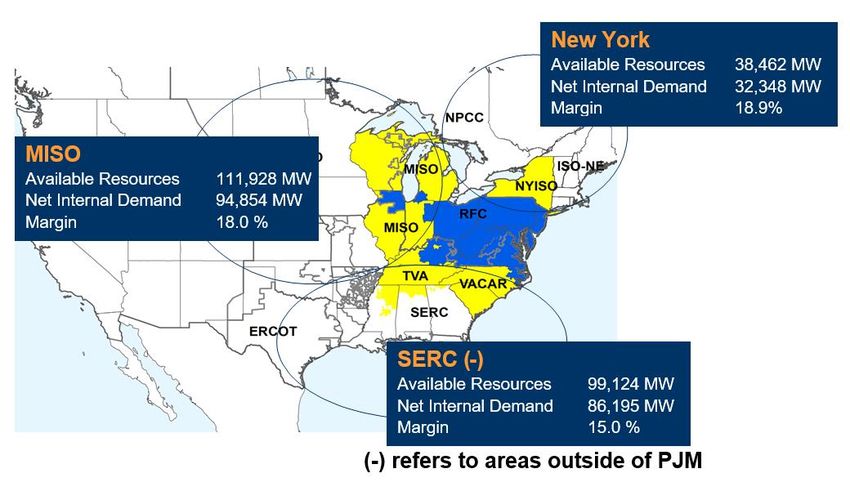
PJM Transmission Planning (TP) Evaluation of Import Capability.............................................................. 33

                         Capacity Benefit Margin (CBM) .................................................................................................................. 33

                         Capacity Benefit of Ties (CBOT) ................................................................................................................ 33

                         OASIS postings .......................................................................................................................................... 34

Modeling and Analysis Considerations ................................................................................................................................... 34

                         Generating Unit Additions / Retirements .................................................................................................... 34

                         World Modeling........................................................................................................................................... 35

                         Expected Weekly Maximum (EWM), LOLE Weekly Values, Convolution Solution, IRM Audience ............ 36

                         Standard BAL-502-RFC-03 clarification items ............................................................................................ 39

                         Standard MOD - 004 - 01, requirement 6, clarification items...................................................................... 40

                         RPM Market ............................................................................................................................................... 41

                         IRM and FPR .............................................................................................................................................. 41

                         RRS and Effective Load Carrying Capability (ELCC) ................................................................................. 42

Operations Related Assessments ........................................................................................................................................... 44

                         Winter Weekly Reserve Target Analysis .................................................................................................... 44

III.        Glossary.................................................................................................................................................................... 46
IV.         Appendices ............................................................................................................................................................... 61
Appendix A Base Case Modeling Assumptions for 2020 PJM RRS ....................................................................................... 62

                         Load Forecast ............................................................................................................................................ 62

                         Capacity Forecast....................................................................................................................................... 62

                         Unit Operational Factors............................................................................................................................. 64

                         Load Management and Energy Efficiency .................................................................................................. 65

                         Transmission System ................................................................................................................................. 65

                         Modeling Systems ...................................................................................................................................... 66

Appendix B Description and Explanation of 2020 Study Sensitivity Cases ............................................................................. 67

          PJM © 2020                                                                    www.pjm.com                                                                        4|Pa g e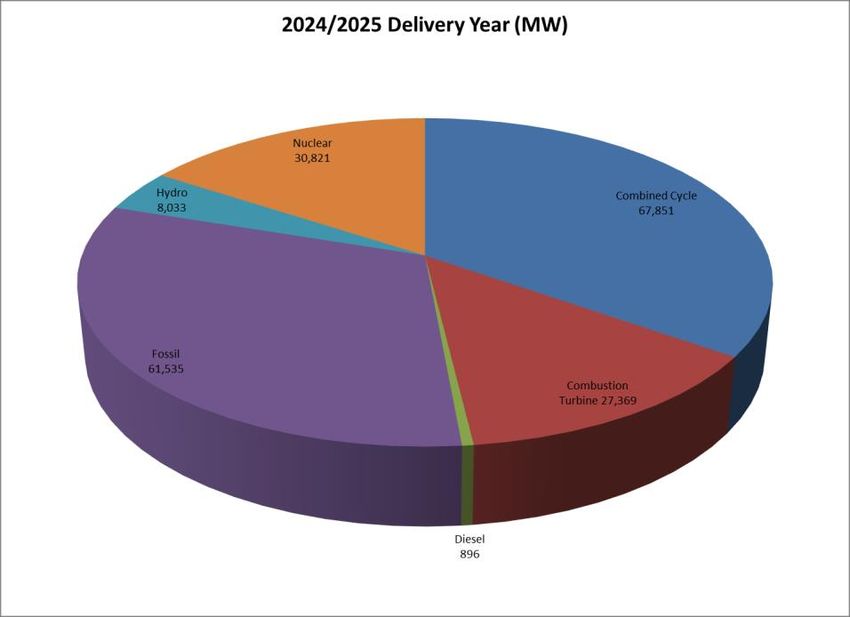
Appendix C Resource Adequacy Analysis Subcommittee (RAAS) ......................................................................................... 72

                        RAAS Main Deliverables and Schedule ..................................................................................................... 72

                        Timeline for 2020 Reserve Requirement Study .......................................................................................... 73

Appendix D RAAS Review of Study - Transmittal Letter to PC ............................................................................................... 74

Appendix F Discussion of Assumptions .................................................................................................................................. 76

Tables

Table I-1: 2020 Reserve Requirement Study Summary Table....................................................................................... 10

Table I-2: 2019 Reserve Requirement Study Summary Table....................................................................................... 10

Table I-3: Historical RRS Parameters ......................................................................................................................... 12

Table I-4: Eleven-Year Reserve Requirement Study .................................................................................................... 15

Table I-5: World Reserve Level, Valid Range to Consider ............................................................................................ 18

Table II-1: Load Forecast for 2024 / 2025 Delivery Years ............................................................................................. 23

Table II-2: PJM RTO Load Model Parameters (PJM LM 52224).................................................................................... 25

Table II-3: Intra-World Load Diversity ......................................................................................................................... 26

Table II-4: PJM RTO Fleet Class Average Generation Performance Statistics (2015-2019) ............................................. 29

Table II-5: Comparison of Class Average Values - 2019 RRS vs. 2020 RRS ................................................................. 30

Table II-6: PJM RTO Fleet-based Unit Performance .................................................................................................... 31

Table II-7: Summary of PJM RTO Existing Wind and Solar resources ........................................................................... 32

Table II-8: Average Commercial Probabilities for Expected Interconnection Additions ..................................................... 33

Table II-9: New and Retiring Generation within PJM RTO ............................................................................................ 34

Table II-10: Winter Weekly Reserve Target ................................................................................................................ 44

Table II-11: Weekly Available Reserves in WWRT Analysis ......................................................................................... 44

Figures

Figure I-1: 2020 Forecast Pool Requirement Waterfall Chart .......................................................................................... 9

         PJM © 2020                                                              www.pjm.com                                                               5|Pa g e
Figure I-2: 2020 Installed Reserve Margin Waterfall Chart.............................................................................................. 9
Figure I-3: Combined PJM Region Modeled................................................................................................................ 14
Figure I-4: PJM RTO, World and Non-Modeled Regions (PJM Region in blue) ............................................................... 14
Figure I-5: Historical Weighted-Average Forced Outage Rates (Five-Year Period) ......................................................... 17
Figure I-6: IRM and FPR vs World Reserves .............................................................................................................. 19
Figure I-7: IRM and FPR vs CBM .............................................................................................................................. 20
Figure II-1: PJM RTO Capacity .................................................................................................................................. 31
Figure II-2: PJM and Outside World Regions - Summer Capacity Outlook ..................................................................... 35
Figure II-3: Expected Weekly Maximum Comparison – 2019 RRS vs. 2020 RRS ........................................................... 36
Figure II-4: PJMRTO LOLE Comparison 2019 RRS vs. 2020 RRS ............................................................................... 37
Figure II-5: Installed Reserve Margin (IRM) vs. RI (Years/Day) and Forecast Pool Requirement (FPR) vs RI (Years/Day).. 38
Figure IV-1: Timeline for 2020 RRS ........................................................................................................................... 73
Equations
Equation II-1: Calculation of Effective Equivalent Demand Forced Outage Rate (EEFORd) ............................................. 28
Equation II-2: Expected Weekly Maximum .................................................................................................................. 36
Equation II-3: Calculation of Forecast Pool Requirement (FPR) .................................................................................... 41
PJM © 2020 www.pjm.com 6|Pa g eI. Results and Recommendations PJM © 2020 www.pjm.com 7|Pa g e
PJM RRS Executive Summary
The PJM Reserve Requirement Study’s (RRS) purpose is to determine the Forecast Pool Requirement (FPR) for
future Delivery Years (DY). Based on the study assumptions, Installed Reserve Margin (IRM) values for future DY
are also derived. In accordance with the Reliability Pricing Model (RPM) auction schedule, results from this study
will re-establish the FPR for the 2021/2022, 2022/2023, and 2023/2024 Delivery Years (DY) and establish the FPR
for the 2024/25 Delivery Year.
Due to the delay in the Reliability Pricing Model (RPM) auction schedule, the results from this study will likely be
used in the Base Residual Auction (BRA) for 2022/2023 and 2023/2024 DYs, in addition to the BRA for 2024/2025,
which corresponds to the regular (not delayed) schedule.
PJM uses this Study to satisfy the North America Electric Reliability Corporation (NERC) / ReliabilityFirst (RF)
Adequacy Standard BAL-502-RFC-03, Planning Resource Adequacy Analysis, Assessment and Documentation.
This Standard requires that the Planning Coordinator performs and documents a resource adequacy analysis that
applies a Loss of Load Expectation (LOLE) of one occurrence in ten years. Per the October 2019 audit, PJM was
found to be fully compliant with Standard BAL-502-RFC-03.
Based on results from this Study, PJM Staff recommends a 1.0871 FPR for the 2021/2022 Delivery Year, a
1.0868 FPR for the 2022/2023 Delivery Year, a 1.0863 FPR for the 2023/2024 Delivery Year, and a 1.0865 FPR
for the 2024/2025 Delivery Year. These FPR values are the key parameters for the Reliabiity Requirement
calculation in RPM.
The IRM values associated with the above recommended FPR values are 14.7% for 2021/2022, 14.5% for
2022/2023, 14.4% for 2023/2024 and 14.4% for 2024/2025.
The resource mix considered in the study’s capacity model has a negligible impact on the FPR values. IRM values,
on the other hand, are highly dependent on the resource mix. The 2020 RRS capacity model excludes wind, solar
and Demand Resources (DR). Including these resources would not have meaningfully changed the recommended
FPR values; however, it would have changed the IRM values.
The 1.0865 (8.65%) FPR for 2024/2025 calculated in this year’s study represents a slight increase of 0.05
percentage points with respect to the FPR computed for 2023/2024 in last year’s study (1.0860 or 8.60%). The
increase can be attributed to the factors and their estimated corresponding quantitative impacts depicted in Figure
I-1 below.
The slight increase in the FPR is driven by a slightly lower Capacity Benefit of Ties (CBOT) in this year’s study
relative to last year’s study. The CBOT represents the emergency imports available from the World into PJM.
PJM © 2020 www.pjm.com 8|Pa g eFigure I-1: 2020 Forecast Pool Requirement Waterfall Chart
The 14.4% IRM for 2024/2025 calculated in this year’s study represents a decrease of 0.4 percentage points with
respect to the IRM computed for 2023/2024 in last year’s study. The decrease can be attributed to the factors and
their estimated corresponding quantitative impacts depicted in Figure I-2: 2020 Installed Reserve Margin Waterfall
Chart.
The IRM decrease is driven by a lower average EEFORd in the 2020 PJM Capacity Model (5.78%) relative to the
average EEFORd in the 2019 PJM Capacity Model (6.03%). The impact of this lower PJM average EEFORd is
large enough to counter the upward pressure put on the IRM by the slightly lower CBOT.
Figure I-2: 2020 Installed Reserve Margin Waterfall Chart
PJM © 2020 www.pjm.com 9|Pa g e The results of the 2020 RRS are summarized below in Table I-1. PJM Staff recommends the values shown in bold
in the following table.
Table I-1: 2020 Reserve Requirement Study Summary Table
For comparison purposes, the results from the 2019 RRS Study are below in Table I-2:
Table I-2: 2019 Reserve Requirement Study Summary Table
The mathematical formula that describes the relationship between IRM and FPR, FPR = (1 + IRM) x (1 – Average
EFORd), depends on the EFORd concept which is not directly applicable to resources such as wind, solar and DR.
This is the main reason such resources are excluded from the study.
The Winter Weekly Reserve Target (WWRT) for the 2020/2021 winter period is recommended to be 23% for
December 2020, 27% for January 2021, and 23% for February 2021. The analysis supporting this
recommendation is detailed in the “Operations Related Assessments” section of this report.
The winter peak week capacity model changes approved by the Markets and Reliability Committee (MRC) in June
2018 and first implemented in the 2018 RRS were also used in the 2020 RRS. These changes had no practical
impact on the recommended IRM and FPR values. The recommended WWRT value for January described in the
bullet point above, however, is impacted by these changes due to the fact that the winter peak week is modeled to
occur in January.
The IRM and FPR recommended in Table I-1 are reviewed and considered for endorsement by the following
succession of groups.
o Resource Adequacy Analysis Subcommittee (RAAS)
o Planning Committee (PC)
o Markets and Reliability Committee (MRC)
o PJM Members Committee (MC)
PJM © 2020 www.pjm.com 10 | P a g eo PJM Board of Managers (for final approval)
PJM’s Probabilistic Reliability Index Study Model (PRISM) program is the primary reliability modeling tool used in
the RRS. PRISM utilizes a two-area Loss of Load Probability (LOLP) modeling approach consisting of: Area 1 - the
PJM RTO and Area 2 - the neighboring World.
The PJM RTO includes the PJM Mid-Atlantic Region, Allegheny Energy (APS), American Electric Power (AEP),
Commonwealth Edison (ComEd), Dayton Power and Light (Dayton), Dominion Virginia Power (Dom), Duquesne
Light Co. (DLCO), American Transmission System Inc. (ATSI), Duke Energy Ohio and Kentucky (DEOK), East
Kentucky Power Cooperative (EKPC), and Ohio Valley Electric Corporation (OVEC).
The Outside World (or World) area consists of the North American Electric Reliability Corporation (NERC) regions
adjacent to PJM. These regions include New York ISO (NYISO) from the Northeast Power Coordinating Council
(NPCC), TVA and VACAR from the South Eastern Reliability Corporation (SERC), and the Midcontinent
Independent System Operator (MISO) (excluding MISO-South).
Modeling of the World region assumes a Capacity Benefit Margin (CBM) of 3,500 MW into PJM, which serves as a
maximum limit on the amount of external assistance. The CBM is set to 3,500 MW per Schedule 4 of the PJM
Reliability Assurance Agreement. Figure I-7 shows the benefit of this interconnection at various values of CBM.
Compared to the 2019 RRS (and also to previous versions of the study), the 2020 RRS includes a change in the
study assumptions: wind and solar resources are now excluded from the capacity model (instead, their capacity
values are calculated in a separate study, the Effective Load Carrying Capability, ELCC, study). This change has a
negligible impact on the FPR which is the parameter used to calculate the Reliability Requirement for the RTO in
RPM. The 2020 RRS assumptions were endorsed at the June 2, 2020 Planning Committee meeting.
There is a net addition of approximately 12,700 MW of generation within the PJM RTO in the period 2020-2024.
This reflects approximately 16,600 MW of new generation and 3,900 MW of retired generation. The RRS study
does not include Demand Resources, wind resources and solar resources.
For the first time, the load model time period 2002-2014 was used in the RRS study. This load model time period
was endorsed at the July 7, 2020 Planning Committee meeting.
Consistent with the requirements of ReliabilityFirst (RF) Standard BAL-502-RFC-03 - Resource Planning Reserve
Requirements, the 2020 RRS provides an eleven-year resource adequacy projection for the planning horizon that
begins June 1, 2020 and extends through May 31, 2031. (See Table I-4)
PJM © 2020 www.pjm.com 11 | P a g eResults from the last ten RRS Reports are summarized below in Table I-3:
Table I-3: Historical RRS Parameters
PJM © 2020 www.pjm.com 12 | P a g eIntroduction
Purpose
The annual PJM Reserve Requirement Study (RRS) calculates the installed reserve margin that is required to comply with
the Reliability Principles and Standards as defined in the PJM Reliability Assurance Agreement (RAA) and ReliabilityFirst
(RF) Standard BAL-502-RFC-03. This study is conducted each year in accordance with PJM Manual 20 (M-20), PJM
Resource Adequacy Analysis. M-20 focuses on the process and procedure for establishing the resource adequacy
(capacity) required to reliably serve customer load in the PJM RTO.
Also, the RRS results are key inputs to the PJM Reliability Pricing Model (RPM). More specifically, the FPR is used to
calculate the Reliability Requirement for the PJM Regional Transmission Organization (RTO) in RPM Auctions.
Finally, the results of the RRS are also incorporated into PJM’s Regional Transmission Expansion Plan (RTEP) process for
the enhancement and expansion of the transmission system in order to meet the demands for firm transmission service in
the PJM Region.
The timetable for calculating and approving the IRM and FPR values is shown in the June 2020 study assumptions letter to
the PC, reviewed as agenda item 5 at the June 2, 2020 PC meeting.
Regional Modeling
This study examines the combined PJM footprint area (
Figure I-3) that consists of the PJM Mid-Atlantic Region plus Allegheny Energy (APS), American Electric Power (AEP),
Commonwealth Edison (ComEd), Dayton Power and Light (Dayton), Dominion Virginia Power (DOMVP), Duquesne Light
Co. (DLCO), American Transmission System Inc. (ATSI), Duke Energy Ohio and Kentucky (DEOK), East Kentucky Power
Cooperative (EKPC) and Ohio Valley Electric Corporation (OVEC).
Areas adjacent to the PJM Region are referred to as the World (Figure I-4) and consist of MISO (excluding MISO-South),
TVA and VACAR (both in SERC), and NYISO from the Northeast Power Coordinating Council (NPCC). Areas outside of
PJM and the World are not modeled in this study.
PJM © 2020 www.pjm.com 13 | P a g eFigure I-3: Combined PJM Region Modeled
Figure I-4: PJM RTO, World and Non-Modeled Regions (PJM Region in blue)
PJM © 2020 www.pjm.com 14 | P a g eSummary of RRS Results
Eleven-Year RRS Results
Table I-4 shows an eleven-year forward projection from the study for informational purposes. The Delivery Years for which
the parameters must be reported are highlighted in yellow. These results do not reflect any previous modeling or approved
values. Note that the projected reserves in column H exceed the IRM in column A for each of the next eleven Delivery
Years. The study, therefore, indicates there are no gaps between the needed amount of planning reserves and the projected
planning reserves over the eleven-year study period.
Table I-4: Eleven-Year Reserve Requirement Study
Calculated IRM/FPR Columns (PRISM Run # 57499)
Column A and Column E are at an LOLE criterion of 1 day in 10 years (if the emergency imports from neighboring
regions into PJM, i.e. the CBOT, are included as reserves)
Column A and Column E are based on the PRISM solved load, not the January 2020 load forecast values issued
by PJM.
Column B is the World IRM at an LOLE criterion of 1 day in 10 years which is within the valid range shown in Table
I-5 (15.92% to 20.93%). The exact World reserve value depends on World load management actions at the time of
the PJM RTO’s need for assistance. The World reserve levels in Column B that yield a PJM Reliability Index (RI)
equal to an LOLE of 1 day in 10 years are within the valid range.
Results reflect calculated (to the nearest decimal) reserve requirements for the PJM RTO (column A) and the
Outside World (column B).
Calculated IRM results are determined using a 3,500 MW Capacity Benefit Margin (CBM).
The Average Effective Equivalent Demand Forced outage rate (EEFORd) (column C) is a pool-wide average
effective equivalent demand forced outage rate for all units included in the study. These are not the forced outage
PJM © 2020 www.pjm.com 15 | P a g erates used in the RAA Obligation formula (as mentioned earlier in the document, EFORd values are used in the
FPR formula). The EEFORd of each unit is based on a five-year period (2015-2019, for this year’s study).
The average weekly maintenance (column D) is the percentage of the average annual total capacity in the model
out on weekly planned maintenance.
Forecast Reserve Columns
The capacity values in Column F include external firm capacity purchases and sales. They exclude wind resources,
solar resources and DR.
2,500 MW of unit deratings were modeled to reflect generator performance impacts during extreme hot and humid
summer conditions. These 2,500 MW are included in the Column F value.
The Restricted Load in Column G corresponds to Total Internal Demand (at peak time) minus load management
(i.e. DR) as per the 2020 PJM Load Forecast.
The PJM forecast reserves are above the calculated requirement (see Column H vs. Column A for years in yellow).
Reserves in Column H (as well as the capacity value in Column F) include about 16,600 MW of new generation
projects identified through the Regional Transmission Expansion Plan (RTEP). Generation projects in the PJM
interconnection queue with a signed Interconnection Service Agreement (ISA) are included in the study at their
capacity MW value.
The RTEP is dynamic and actual PJM reserve levels may differ significantly from those forecasted in Column H.
An additional factor contributing to future reserve margin uncertainty is the fact that PJM allows units to retire with
as little as 90 days’ notice as per PJM’s Manual 14D.
PJM Reliability Index without World Assistance
The values in Column J are for informational purposes only. PJM Reliability Index (RI) is expressed in years per
day (the inverse of the days per year LOLE). This column indicates reliability when all external ties into PJM are
cut (“zero import capability” scenario) for the corresponding PJM IRM in Column A.
In other words, the values in Column J represent the frequency of loss of load occurrences if the PJM RTO were
not part of the Eastern Interconnection. Compared to the 1 in 10 criteria (RI = 10), the values in Column J are
much lower. This comparison provides a sense of the value of PJM being strongly interconnected. More
specifically, if PJM were not interconnected, it could experience loss of load events roughly twice as often (at a
reserve margin level equal to the IRM).
Other Expected Resources
The values in Column K are the existing and expected MW amount of nameplate wind and solar resources in each
of the next 11 years based on projects that had a signed Interconnection Service Agreement (ISA) or a Wholesale
Market Participation Agreement (WMPA) as of June 2020. As mentioned earlier in this report, wind and solar
resources are not included in the RRS capacity model. The capacity value of wind and solar resources will be
calculated via the ELCC study at the end of 2020. The current capacity values for wind and solar are available at
https://www.pjm.com/-/media/planning/res-adeq/class-average-wind-capacity-factors.ashx
PJM © 2020 www.pjm.com 16 | P a g eKey Observations
General Trends and Observations
o Pool wide average forced outage rate values (EFORd) for the target Delivery Year, in each of the annual
RRS capacity models, are shown in Figure I-5. The forced outage rates of each unit are based on the
historical five-year period used in a given study. It is important to note that the collection of generators
included in each year’s case varies greatly over time as new generators are brought in-service, some
generators retire or mothball, and new generators are added due to PJM market expansion.
o As shown in Figure I-5, average unit performance in the 2020 study model is significantly better than the
unit performance in the 2019 study model (the capacity-weighted average EFORd in the 2020 RRS is
5.03% while in the 2019 RRS it was 5.40%). As a result, there is downward pressure on the IRM
(estimated at 0.5 percentage points).
o This decrease in weighted average EFORd is due to a lower average EFORd of the generation classes
more heavily represented in the study i.e., combined cycle and gas turbines.
Figure I-5: Historical Weighted-Average Forced Outage Rates (Five-Year Period)
PJM © 2020 www.pjm.com 17 | P a g e The World reserves were assessed and modeled in a similar manner as performed in previous RRS studies.
Among the regions modeled as part of the World, the New York and MISO regions have firm reserve requirements,
while the TVA and VACAR regions have soft targets. The soft targets chosen are consistent with general
statements of the NERC targets for these regions. Table I-5 summarizes the values used to determine a valid
range for a World reserve level of 15.92% to 20.93%. The reserve requirements considered for each region are
shown in the IRM column. The diversity values shown are from an assessment of historical data, using the
average of the values observed over the summer season. See Table II-3 for further details. Please reference
Appendix F which presents a discussion of the modeling assumptions. It was agreed upon by the RAAS in previous
years that the appropriate choice for World reserves is the one that satisfies the 1 in 10 reliability criterion for the
World as long as it is within the valid range. This value in the 2020 study is 16.2% and it is within the valid range
shown in Table I-5.
Wind and solar resources are included in the capacity model of the World region by assuming that their ICAP is
equal to their UCAP which is in turn equal to their capacity value. This assumption implies that the modeled
EEFORd of wind and solar resources in the World region is 0%.
Table I-5: World Reserve Level, Valid Range to Consider
Load diversity between PJM and the World is addressed by two modeling assumptions. First, the historical period
used to construct the hourly load model is the same for PJM and the World. Second, the world load model
corresponds to coincident peaks from the four individual sub-regions.
Figure I-6 shows the impact of the World reserves on the PJM RTO IRM and FPR. This figure assumes a CBM
value of 3,500 MW at all World reserve levels. The green horizontal line labeled “valid range” shows the range of
World generation installed reserve levels depending on the amount of World load management assumed to be
PJM © 2020 www.pjm.com 18 | P a g ecurtailed or to have voluntarily reduced consumption in response to economic incentives, at the time of a PJM
capacity emergency. The lower end of the range (at 15.92%) represents the World reserve level if no World load
management were implemented. The higher end (at 20.93%) is the reserve level assuming all World load
management is implemented or customers have reduced their loads at the time of a PJM emergency. Figure I-6
indicates that the impact of additional World Reserves on PJM’s IRM and FPR tends to decrease as World
Reserves are outside of the valid range (above 19%).
The PJM IRM and FPR for Delivery Year 2024/2025 at this “1 in 10” World reserve level are 14.4% and 1.0865,
respectively
Figure I-6: IRM and FPR vs World Reserves
Figure I-7 shows how the PJM IRM and FPR vary as the CBM is varied. As indicated by the red line, the official
CBM value of 3,500 MW results in a PJM IRM of 14.4%. Thus, the PJM IRM is reduced by 1.5% due to the CBM
(from 15.9%, the intercept with the y-axis, to 14.4%). Based on the forecasted load for 2024/2025, this 1.5% IRM
reduction eliminates the need for about 152,443 MW x 1.5% = 2,287 MW of installed capacity. Therefore, the
PJM © 2020 www.pjm.com 19 | P a g eCapacity Benefit of Ties (CBOT) in this year’s study is 2,287 MW. Similarly, the PJM FPR is reduced by 0.0142
(from 1.1007 to 1.0865) due to the CBM.
Figure I-7: IRM and FPR vs CBM
The underlying modeling characteristics of load, generation, and neighboring regions’ reserves / tie size are the
primary drivers for the results of the study. Although consideration of the amount in MW of either load or
generation can be a factor, it is not as significant due to the method employed to adjust an area’s load until its
LOLE meets the 1 day in 10 years reliability criterion. Small changes to the parameters that capture uncertainties
associated with load and generation can impact the assessment results.
PJM © 2020 www.pjm.com 20 | P a g eRecommendations
Installed Reserve Margin (IRM) — based on the study results and the additional considerations mentioned above,
PJM recommends endorsement of an IRM value of 14.7% for the 2021/2022 Delivery Year, 14.5% for the
2022/2023 Delivery Year, 14.4% for the 2023/2024 Delivery Year, and 14.4% for the 2024/2025 Delivery Year.
Forecast Pool Requirement (FPR) — the IRM is converted to the FPR for use in determining capacity obligations.
The FPR expresses the reserve requirement in unforced capacity terms. The FPR is defined by the following
equation:
o FPR = (1 + IRM) * (1 – PJM Avg. EFORd)
The above equation depends on the EFORd concept which is not directly applicable to resources such as wind,
solar and DR. This is the main reason such resources are excluded from the study.
Based on the recommended IRM values, the resulting FPRs are:
2021 / 2022 Delivery Year FPR = (1.147) * (1 – 0.0522) = 1.0871
2022 / 2023 Delivery Year FPR = (1.145) * (1 – 0.0508) = 1.0868
2023 / 2024 Delivery Year FPR = (1.144) * (1 – 0.0504) = 1.0863
2024 / 2025 Delivery Year FPR = (1.144) * (1 – 0.0503) = 1.0865
The FPR is applied to the official 50/50 PJM Summer Peak Forecast which corresponds to the Expected Weekly
Maximum (EWM) of the peak summer week in PRISM.
Winter Weekly Reserve Target — the recommended 2020 / 2021 Winter Weekly Reserve Target is 23% for
December 2020, 27% for January 2021, and 23% for February 2021. This recommendation is discussed later in
the report.
PJM © 2020 www.pjm.com 21 | P a g eII. Modeling and Analysis PJM © 2020 www.pjm.com 22 | P a g e
Load Forecasting

PJM Load Forecast – January 2020 Load Report
The January 2020 PJM Load Forecast is used in the 2020 RRS. The load report is available on the PJM web site at:
https://www.pjm.com/-/media/library/reports-notices/load-forecast/2020-load-report.ashx?la=en. The methods and
techniques used in the load forecasting process are documented in Manual 19 (Load Forecasting and Analysis).

Monthly Forecasted Unrestricted Peak Demand and Demand Resources
The monthly loads used in the RRS are based on forecasted monthly unrestricted peak loads. PJM monthly loads are from
the 2020 PJM Load Forecast report. World monthly loads are derived through an examination of data from NERC’s Electric
Supply and Demand (ES&D) dataset. These values are in Table II-1 on a per-unit basis relative to the annual peak.

                                Table II-1: Load Forecast for 2024 / 2025 Delivery Years

      PJM © 2020                                         www.pjm.com                                        23 | P a g e
Forecast Error Factor (FEF)
The Forecast Error Factor (FEF) represents the increased uncertainty associated with forecasts covering a longer time
horizon. The FEF is 1.0% for all future delivery years. See PJM Manual 20 and the “PJM Generation Adequacy Analysis –
Technical methods” (at http://www.pjm.com/planning/resource-adequacy-planning/reserve-requirement-dev-process.aspx )
and the Modeling and Analysis Section for discussion of how the FEF is used in the determination of the Expected Weekly
Maximum (EWM).
With the implementation of the RPM capacity market in 2006, the FEF used in the RRS was changed to 1.0% for all future
delivery years, based on a stakeholder consensus. This is due to the ability for PJM to acquire additional resources in
incremental auctions close to the delivery year. This mitigates the uncertainty of the load forecast as RPM mimics a one-
year-ahead forecast. Sensitivity number 8 in Appendix B shows the impact of different FEF values on the IRM.
21 point Standard Normal Distribution, for daily peaks
PRISM’s load model is a daily peak load model aggregated by week (1-52). The uncertainty in the daily peak load model is
modeled via a standard normal distribution. The standard normal distribution is represented using 21 points with a range of
+/- 4.2 sigma away from the mean. The modeling used is based on work by C.J. Baldwin, as presented in the Westinghouse
Engineer journal titled “Probability Calculation of Generation Reserves”, dated March 1969. See PJM Manual 20 for further
details.
Week Peak Frequency (WKPKFQ) Parameters
The load model used in PRISM is developed with an application called WKPKFQ. The application’s primary input is hourly
data, determining the daily peak’s mean and standard deviation for each week. Each week within each season for a year of
historical data is magnitude ordered (highest to lowest) and those weeks are averaged across years to replicate peak load
experience. The annual peak and the adjusted WKPKFQ mean and standard deviation are used to develop daily peak
standard normal distributions for each week of the study period. The definition of the load model, per the input parameters
necessary to submit a WKPKFQ run, define the modeling region and basis for all adequacy studies. WKPKFQ required input
parameters include:
Historic time period of the model.
Sub-zones or geographic regions that define the model.
Vintage of Load forecast report (year of report).
Start and end year of the forecast study period.
5 or 7 days to use in the load model. All RRS studies use a 5 day model, excluding weekends.
Holidays to exclude from hourly data include: Labor Day, Independence Day, Memorial Day, Good Friday, New
Year’s Day, Thanksgiving, the Friday after Thanksgiving, and Christmas Day.
The Peak Load Ordered Time Series (PLOTS) load model is the result of performing the WKPKFQ calculations. The
resulting output is 52 weekly means and standard deviations that represent parameters for the daily normal distribution. The
beginning of Week 1 corresponds to May 15th. Table II-2 shows these results of PJM RTO WKPKFQ run 52224 used in this
study, which uses 13 years of historical data from 2002 to 2014. This was reviewed and endorsed by both the Resource
PJM © 2020 www.pjm.com 24 | P a g eAdequacy Analysis Subcommittee1 and Planning Committee2.
Table II-2: PJM RTO Load Model Parameters (PJM LM 52224)
PJM-World Diversity
PJM-World diversity reflects the timing of when the World area peaks compared to when the PJM RTO area peaks. The
greater the diversity, the more capacity assistance the World can give at the time when PJM needs it and, therefore, the
lower the PJM IRM. Diversity is a modeling characteristic assessed in the selection of the most appropriate load model time
period for use in the RRS. A comprehensive method to evaluate and choose load models, with diversity as one of the
considerations, was approved by the Planning Committee and used for the 2020 RRS.
Historic hourly data was examined to determine the annual monthly peak shape of the composite World region. Monthly
World coincident peaks are magnitude ordered (highest to lowest) and averaged across years to replicate peak load
experience. Magnitude-ordered months are assigned to calendar months according to average historical placement. These
results are highlighted in yellow below in Table II-3.
1 https://www.pjm.com/-/media/committees-groups/subcommittees/raas/2020/20200730/20200730-pjm-load-model-selection-for-2020-
rrs.ashx
2 https://www.pjm.com/-/media/committees-groups/committees/pc/2020/20200804/20200804-item-04-pjm-load-model-selection-for-2020-
rrs.ashx
PJM © 2020 www.pjm.com 25 | P a g eTo examine seasonal diversity, an average of all historic years was used. The upper portion of Table II-3 summarizes the
underlying historic data that led to a modeling choice of the values highlighted in yellow. Seasonal diversity is used in the
determination of World sub-region coincident peaks in evaluating the range of permissible World reserve margins seen in
Table I-5.
Table II-3: Intra-World Load Diversity
PJM © 2020 www.pjm.com 26 | P a g eGeneration Forecasting
GADS, eGADS and PJM Fleet Class Average Values
The Generator Availability Data System (GADS) is a NERC-based program and database used for entering, storing, and
reporting generating unit data concerning generator outages and unit performance. GADS data is used by PJM and other
RTOs in characterizing and evaluating unit performance.
The PJM Generator Availability Data System (eGADS) is an Internet based application which supports the submission and
processing of generator outage and performance data as required by PJM and the NERC reporting standards. The principal
resource-related modeling parameters in the RRS are those that define the generator unit characteristics. All generation
units’ performance characteristics, for resources included in the RRS, are derived from PJM’s eGADS web based system.
For detailed information on the PJM Generation Availability Data System (GADS), see the eGADS’ help selection available
through the PJM site at: https://www.pjm.com/markets-and-operations/etools/egads.aspx.
The eGADS system is based on the IEEE Standard 762-2006. IEEE Standard 762-2006 is available at
http://standards.ieee.org/findstds/standard/762-2006.html
The PJM Reliability Assurance Agreement (RAA), Schedule 4 and Schedule 5 are related to the concepts used in
generation forecasting.
For units with missing or insufficient GADS data, PJM utilizes class average data developed from PJM’s fleet-based
historical unit performance statistics. This process is called blending. Blending is therefore used for future units, neighboring
system units, and for those PJM units with less than five years of GADS events. The term blending is used when a given
generating unit does not have actual reported outage events for the full five-year period being evaluated.
The actual generator unit outage events are blended with the class average values according to the generator class
category for that unit. For example, a unit that has three years’ worth of its own reported outage history will have two years’
worth of class average values used in blending. The statistics, based on the actual reported outage history, will be weighted
by a factor of 3/5 and the class average statistics will be weighted by a factor of 2/5. The values are added together to get a
statistical value for each unit that represents the entire five-year time period.
The class average categories are from NERC's Brochure while the statistics’ values are determined from PJM’s fleet of
units. A five-year period is used for the statistics, with 73 unique generator class keys. The five-year period is based on the
data available in the NERC Brochure or in PJM's eGADS, using the latest time period (2015-2019 for 2020 RRS). A
generator class category is given for each unit type, primary fuel and size of unit. Furthermore, this five-year period is used
to calculate the various statistics, including (but not limited to):
Equivalent Demand Forced Outage Rate (EFORd)
Effective Equivalent Demand Forced Outage Rate (EEFORd)
Equivalent Maintenance Outage Factor (EMOF)
Planned Outage Factor (POF)
PJM © 2020 www.pjm.com 27 | P a g eThe class average statistical values used in the reserve requirement study for the blending process are shown in Table II-4.
In Appendix B, Sensitivity number 15 shows that a 1% increase in the pool-wide EEFORd causes a 1.36% increase in the
IRM – indicating a direct, positive correlation between unit performance and the IRM.
Generating Unit Owner Review of Detailed Model
The generation owner representatives are solicited to provide review and submit changes to the preliminary generation unit
model. This review provides valuable feedback and increases confidence that the model parameters are the best possible
for use in the RRS. This review improves the data integrity of the most significant modeling parameters in the RRS.
Forced Outage Rates: EFORd and EEFORd
All forced outages are based on eGADS reported events. These concepts are applicable to all resources except wind, solar
and DR.
Effective Equivalent Demand Forced Outage Rate (EEFORd) – This forced outage rate, determined for
demand periods, is used for reliability and reserve margin calculations. There are traditionally three categories
for GADS reported events: forced outage (FO), maintenance outage (MO) and planned outage (PO). The
PRISM program can only model the FO and PO categories. A portion of the MO outages is placed within the
FO category, while the other portion is placed with the PO category. In this way, all reported GADS events are
modeled. For a more complete discussion of these equations see Manual 22 at https://www.pjm.com/-
/media/documents/manuals/m22.ashx.
The equation for the EEFORd is as follows:
Equation II-1: Calculation of Effective Equivalent Demand Forced Outage Rate (EEFORd)
The statistic used for MO is the equivalent maintenance outage factor (EMOF).
Equivalent Demand Forced Outage Rate (EFORd) – This forced outage rate, determined for demand periods,
is used in reliability and reserve margin calculations. See Manual M-22 and RAA Schedule 4 and Schedule 5
for more specific information about defining and using this statistic. The EFORd forms the basis for the
EEFORd and is the statistic used to calculate the Unforced Capacity (UCAP) value of generators in the
marketplace.
The Unforced Capacity (UCAP) concept described above does not apply to wind, solar and Demand Response
resources. However, an equivalent concept is needed for marketplace use for these resources. That concept is
Accredited UCAP. For wind and solar resources, the Accredited UCAP is currently calculated using the
procedure described in Manual 21 – Appendix B also known as the 368-hour rule. This procedure is expected
to be replaced with Effective Load Carrying Capability (ELCC) by the end of 2020. For DR resources, the
Accredited UCAP is given by the product of the Nominated DR amount and the Forecast Pool Requirement
(FPR).
PJM © 2020 www.pjm.com 28 | P a g eTable II-4: PJM RTO Fleet Class Average Generation Performance Statistics (2015-2019)
Gen Class POF
Start Date End Date Unit Type & Primary Fuel Category Key EFORd EEFORd XEFORd Weeks/Year EMOF Variance
1/1/2015 12/31/2019 FOSSIL All Fuel Types All Sizes 1 11.398% 12.159% 10.996% 2 2.428 21878
1/1/2015 12/31/2019 FOSSIL All Fuel Types 001-099 2 12.107% 12.642% 11.548% 2 1.854 4116
1/1/2015 12/31/2019 FOSSIL All Fuel Types 100-199 3 12.107% 12.642% 11.548% 2 1.854 4116
1/1/2015 12/31/2019 FOSSIL All Fuel Types 200-299 4 10.442% 11.341% 10.188% 3 3.068 28754
1/1/2015 12/31/2019 FOSSIL All Fuel Types 300-399 5 10.442% 11.341% 10.188% 3 3.068 28754
1/1/2015 12/31/2019 FOSSIL All Fuel Types 400-599 6 10.442% 11.341% 10.188% 3 3.068 28754
1/1/2015 12/31/2019 FOSSIL All Fuel Types 600-799 7 10.442% 11.341% 10.188% 3 3.068 28754
1/1/2015 12/31/2019 FOSSIL All Fuel Types 800-999 8 11.285% 11.341% 11.194% 3 3.068 28754
1/1/2015 12/31/2019 FOSSIL All Fuel Types 1000 Plus 9 11.285% 11.341% 11.194% 3 3.068 28754
1/1/2015 12/31/2019 FOSSIL Coal Primary All Sizes 10 11.398% 12.159% 10.996% 2 2.428 21878
1/1/2015 12/31/2019 FOSSIL Coal Primary 001-099 11 12.107% 12.642% 11.548% 2 1.854 4116
1/1/2015 12/31/2019 FOSSIL Coal Primary 100-199 12 12.107% 12.642% 11.548% 2 1.854 4116
1/1/2015 12/31/2019 FOSSIL Coal Primary 200-299 13 10.442% 11.341% 10.188% 3 3.068 28754
1/1/2015 12/31/2019 FOSSIL Coal Primary 300-399 14 10.442% 11.341% 10.188% 3 3.068 28754
1/1/2015 12/31/2019 FOSSIL Coal Primary 400-599 15 10.442% 11.341% 10.188% 3 3.068 28754
1/1/2015 12/31/2019 FOSSIL Coal Primary 600-799 16 10.442% 11.341% 10.188% 3 3.068 28754
1/1/2015 12/31/2019 FOSSIL Coal Primary 800-999 17 11.285% 11.341% 11.194% 3 3.068 28754
1/1/2015 12/31/2019 FOSSIL Coal Primary 1000 Plus 18 11.285% 11.341% 11.194% 3 3.068 28754
1/1/2015 12/31/2019 FOSSIL Oil Primary All Sizes 19 11.398% 12.159% 10.996% 2 2.428 21878
1/1/2015 12/31/2019 FOSSIL Oil Primary 001-099 20 12.107% 12.642% 11.548% 2 1.854 4116
1/1/2015 12/31/2019 FOSSIL Oil Primary 100-199 21 12.107% 12.642% 11.548% 2 1.854 4116
1/1/2015 12/31/2019 FOSSIL Oil Primary 200-299 22 10.442% 11.341% 10.188% 3 3.068 28754
1/1/2015 12/31/2019 FOSSIL Oil Primary 300-399 23 10.442% 11.341% 10.188% 3 3.068 28754
1/1/2015 12/31/2019 FOSSIL Oil Primary 400-599 24 10.442% 11.341% 10.188% 3 3.068 28754
1/1/2015 12/31/2019 FOSSIL Oil Primary 600-799 25 10.442% 11.341% 10.188% 3 3.068 28754
1/1/2015 12/31/2019 FOSSIL Oil Primary 800-999 26 11.285% 11.341% 11.194% 3 3.068 28754
1/1/2015 12/31/2019 FOSSIL Gas Primary All Sizes 28 11.398% 12.159% 10.996% 2 2.428 21878
1/1/2015 12/31/2019 FOSSIL Gas Primary 001-099 29 12.107% 12.642% 11.548% 2 1.854 4116
1/1/2015 12/31/2019 FOSSIL Gas Primary 100-199 30 12.107% 12.642% 11.548% 2 1.854 4116
1/1/2015 12/31/2019 FOSSIL Gas Primary 200-299 31 10.442% 11.341% 10.188% 3 3.068 28754
1/1/2015 12/31/2019 FOSSIL Gas Primary 300-399 32 10.442% 11.341% 10.188% 3 3.068 28754
1/1/2015 12/31/2019 FOSSIL Gas Primary 400-599 33 10.442% 11.341% 10.188% 3 3.068 28754
1/1/2015 12/31/2019 FOSSIL Gas Primary 600-799 34 10.442% 11.341% 10.188% 3 3.068 28754
1/1/2015 12/31/2019 FOSSIL Gas Primary 800-999 35 11.285% 11.341% 11.194% 3 3.068 28754
1/1/2015 12/31/2019 FOSSIL Lignite Primary All Sizes 37 11.398% 12.159% 10.996% 2 2.428 21878
1/1/2015 12/31/2019 NUCLEAR All Types All Sizes 38 1.110% 1.325% 1.084% 0 0.452 14224
1/1/2015 12/31/2019 NUCLEAR All Types 400-799 39 1.110% 1.325% 1.084% 0 0.452 14224
1/1/2015 12/31/2019 NUCLEAR All Types 800-999 40 1.110% 1.325% 1.084% 0 0.452 14224
1/1/2015 12/31/2019 NUCLEAR All Types 1000 Plus 41 1.110% 1.325% 1.084% 0 0.452 14224
1/1/2015 12/31/2019 NUCLEAR PWR All Sizes 42 1.110% 1.325% 1.084% 0 0.452 14224
1/1/2015 12/31/2019 NUCLEAR PWR 400-799 43 1.110% 1.325% 1.084% 0 0.452 14224
1/1/2015 12/31/2019 NUCLEAR PWR 800-999 44 1.110% 1.325% 1.084% 0 0.452 14224
1/1/2015 12/31/2019 NUCLEAR PWR 1000 Plus 45 1.110% 1.325% 1.084% 0 0.452 14224
1/1/2015 12/31/2019 NUCLEAR BWR All Sizes 46 1.110% 1.325% 1.084% 0 0.452 14224
1/1/2015 12/31/2019 NUCLEAR BWR 400-799 47 1.110% 1.325% 1.084% 0 0.452 14224
1/1/2015 12/31/2019 NUCLEAR BWR 800-999 48 1.110% 1.325% 1.084% 0 0.452 14224
1/1/2015 12/31/2019 NUCLEAR BWR 1000 Plus 49 1.110% 1.325% 1.084% 0 0.452 14224
1/1/2015 12/31/2019 NUCLEAR CANDU All Sizes 50 1.110% 1.325% 1.084% 0 0.452 14224
1/1/2015 12/31/2019 JET ENGINE All Sizes 51 10.891% 10.933% 9.922% 1 1.215 311
1/1/2015 12/31/2019 JET ENGINE 001-019 52 19.180% 19.279% 17.606% 1 1.309 26
1/1/2015 12/31/2019 JET ENGINE 20 Plus 53 10.433% 10.372% 9.434% 1 1.374 130
1/1/2015 12/31/2019 GAS TURBINE All Sizes 54 10.891% 10.933% 9.922% 1 1.215 311
1/1/2015 12/31/2019 GAS TURBINE 001-019 55 19.180% 19.279% 17.606% 1 1.309 26
1/1/2015 12/31/2019 GAS TURBINE 020-049 56 10.433% 10.372% 9.434% 1 1.374 130
1/1/2015 12/31/2019 GAS TURBINE 50 Plus 57 6.215% 6.282% 5.624% 1 1.069 582
1/1/2015 12/31/2019 COMBINED CYCLE All Sizes 58 3.919% 4.161% 3.153% 1 0.855 2492
1/1/2015 12/31/2019 HYDRO All Sizes 59 15.905% 15.987% 14.935% 3 3.126 44
1/1/2015 12/31/2019 HYDRO 001-029 60 15.905% 15.987% 14.935% 3 3.126 44
1/1/2015 12/31/2019 HYDRO 30 Plus 61 15.905% 15.987% 14.935% 3 3.126 44
1/1/2015 12/31/2019 PUMPED STORAGE All Sizes 62 1.976% 2.445% 1.805% 1 1.055 2271
1/1/2015 12/31/2019 MULTIBOILER/MULTI-TURBINE All Sizes 63 10.891% 10.933% 9.922% 1 1.215 311
1/1/2015 12/31/2019 DIESEL Landfill 64 19.536% 17.944% 19.138% 0 0.452 1
1/1/2015 12/31/2019 DIESEL All Sizes 65 6.551% 6.972% 5.559% 1 1.369 2
1/1/2015 12/31/2019 FOSSIL Oil/Gas Primary All Sizes 66 11.398% 12.159% 10.996% 2 2.428 21878
1/1/2015 12/31/2019 FOSSIL Oil/Gas Primary 001-099 67 12.107% 12.642% 11.548% 2 1.854 4116
1/1/2015 12/31/2019 FOSSIL Oil/Gas Primary 100-199 68 12.107% 12.642% 11.548% 2 1.854 4116
1/1/2015 12/31/2019 FOSSIL Oil/Gas Primary 200-299 69 10.442% 11.341% 10.188% 3 3.068 28754
1/1/2015 12/31/2019 FOSSIL Oil/Gas Primary 300-399 70 10.442% 11.341% 10.188% 3 3.068 28754
1/1/2015 12/31/2019 FOSSIL Oil/Gas Primary 400-599 71 10.442% 11.341% 10.188% 3 3.068 28754
1/1/2015 12/31/2019 FOSSIL Oil/Gas Primary 600-799 72 10.442% 11.341% 10.188% 3 3.068 28754
1/1/2015 12/31/2019 FOSSIL Oil/Gas Primary 800-999 73 11.285% 11.341% 11.194% 3 3.068 28754
PJM © 2020 www.pjm.com 29 | P a g eTable II-5: Comparison of Class Average Values - 2019 RRS vs. 2020 RRS
Unit Type & Primary Fuel POF Change
Gen Class Key EFORd Change EEFORd Change XEFORd Change EMOF Change Variance Change
Category Weeks/Year
FOSSIL All Fuel Types All Sizes 1 -0.75% -0.17% -0.76% -0.06 0.19 1700
FOSSIL All Fuel Types 001-099 2 -0.62% -0.07% -0.62% -0.27 0.06 21
FOSSIL All Fuel Types 100-199 3 -0.62% -0.07% -0.62% -0.27 0.06 21
FOSSIL All Fuel Types 200-299 4 -1.10% -0.45% -1.16% 0.02 0.29 1466
FOSSIL All Fuel Types 300-399 5 -1.10% -0.45% -1.16% 0.02 0.29 1466
FOSSIL All Fuel Types 400-599 6 -1.10% -0.45% -1.16% 0.02 0.29 1466
FOSSIL All Fuel Types 600-799 7 -1.10% -0.45% -1.16% 0.02 0.29 1466
FOSSIL All Fuel Types 800-999 8 0.42% -0.45% 0.40% 0.02 0.29 1466
FOSSIL All Fuel Types 1000 Plus 9 0.42% -0.45% 0.40% 0.02 0.29 1466
FOSSIL Coal Primary All Sizes 10 -0.75% -0.17% -0.76% -0.06 0.19 1700
FOSSIL Coal Primary 001-099 11 -0.62% -0.07% -0.62% -0.27 0.06 21
FOSSIL Coal Primary 100-199 12 -0.62% -0.07% -0.62% -0.27 0.06 21
FOSSIL Coal Primary 200-299 13 -1.10% -0.45% -1.16% 0.02 0.29 1466
FOSSIL Coal Primary 300-399 14 -1.10% -0.45% -1.16% 0.02 0.29 1466
FOSSIL Coal Primary 400-599 15 -1.10% -0.45% -1.16% 0.02 0.29 1466
FOSSIL Coal Primary 600-799 16 -1.10% -0.45% -1.16% 0.02 0.29 1466
FOSSIL Coal Primary 800-999 17 0.42% -0.45% 0.40% 0.02 0.29 1466
FOSSIL Coal Primary 1000 Plus 18 0.42% -0.45% 0.40% 0.02 0.29 1466
FOSSIL Oil Primary All Sizes 19 -0.75% -0.17% -0.76% -0.06 0.19 1700
FOSSIL Oil Primary 001-099 20 -0.62% -0.07% -0.62% -0.27 0.06 21
FOSSIL Oil Primary 100-199 21 -0.62% -0.07% -0.62% -0.27 0.06 21
FOSSIL Oil Primary 200-299 22 -1.10% -0.45% -1.16% 0.02 0.29 1466
FOSSIL Oil Primary 300-399 23 -1.10% -0.45% -1.16% 0.02 0.29 1466
FOSSIL Oil Primary 400-599 24 -1.10% -0.45% -1.16% 0.02 0.29 1466
FOSSIL Oil Primary 600-799 25 -1.10% -0.45% -1.16% 0.02 0.29 1466
FOSSIL Oil Primary 800-999 26 0.42% -0.45% 0.40% 0.02 0.29 1466
FOSSIL Gas Primary All Sizes 28 -0.75% -0.17% -0.76% -0.06 0.19 1700
FOSSIL Gas Primary 001-099 29 -0.62% -0.07% -0.62% -0.27 0.06 21
FOSSIL Gas Primary 100-199 30 -0.62% -0.07% -0.62% -0.27 0.06 21
FOSSIL Gas Primary 200-299 31 -1.10% -0.45% -1.16% 0.02 0.29 1466
FOSSIL Gas Primary 300-399 32 -1.10% -0.45% -1.16% 0.02 0.29 1466
FOSSIL Gas Primary 400-599 33 -1.10% -0.45% -1.16% 0.02 0.29 1466
FOSSIL Gas Primary 600-799 34 -1.10% -0.45% -1.16% 0.02 0.29 1466
FOSSIL Gas Primary 800-999 35 0.42% -0.45% 0.40% 0.02 0.29 1466
FOSSIL Lignite Primary All Sizes 37 -0.75% -0.17% -0.76% -0.06 0.19 1700
NUCLEAR All Types 38 -0.19% -0.17% -0.18% -0.10 -0.02 -2223
NUCLEAR All Types 39 -0.19% -0.17% -0.18% -0.10 -0.02 -2223
NUCLEAR All Types 40 -0.19% -0.17% -0.18% -0.10 -0.02 -2223
NUCLEAR All Types 41 -0.19% -0.17% -0.18% -0.10 -0.02 -2223
NUCLEAR PWR All Sizes 42 -0.19% -0.17% -0.18% -0.10 -0.02 -2223
NUCLEAR PWR 400-799 43 -0.19% -0.17% -0.18% -0.10 -0.02 -2223
NUCLEAR PWR 800-999 44 -0.19% -0.17% -0.18% -0.10 -0.02 -2223
NUCLEAR PWR 1000 Plus 45 -0.19% -0.17% -0.18% -0.10 -0.02 -2223
NUCLEAR BWR All Sizes 46 -0.19% -0.17% -0.18% -0.10 -0.02 -2223
NUCLEAR BWR 400-799 47 -0.19% -0.17% -0.18% -0.10 -0.02 -2223
NUCLEAR BWR 800-999 48 -0.19% -0.17% -0.18% -0.10 -0.02 -2223
NUCLEAR BWR 1000 Plus 49 -0.19% -0.17% -0.18% -0.10 -0.02 -2223
NUCLEAR CANDU All Sizes 50 -0.19% -0.17% -0.18% -0.10 -0.02 -2223
JET ENGINE All Sizes 51 -1.55% -1.84% -1.14% 0.16 -0.01 -94
JET ENGINE 001-019 52 -0.47% -0.67% -0.72% 0.01 -0.04 -1
JET ENGINE 20 Plus 53 -1.90% -2.27% -1.25% 0.18 -0.03 -25
GAS TURBINE All Sizes 54 -1.55% -1.84% -1.14% 0.16 -0.01 -94
GAS TURBINE 001-019 55 -0.47% -0.67% -0.72% 0.01 -0.04 -1
GAS TURBINE 020-049 56 -1.90% -2.27% -1.25% 0.18 -0.03 -25
GAS TURBINE 50 Plus 57 -1.98% -2.29% -1.33% 0.22 0.02 -199
COMBINED CYCLE All Sizes 58 -0.47% -0.60% -0.45% -0.24 -0.06 78
HYDRO All Sizes 59 1.20% 2.06% 1.36% -0.27 0.66 -1
HYDRO 001-029 60 1.20% 2.06% 1.36% -0.27 0.66 -1
HYDRO 30 Plus 61 1.20% 2.06% 1.36% -0.27 0.66 -1
PUMPED STORAGE All Sizes 62 -0.09% -0.08% 0.08% 0.30 0.03 -541
MULTIBOILER/MULTI-TURBINE All Sizes 63 -1.55% -1.84% -1.14% 0.16 -0.01 -94
DIESEL Landfill 64 0.35% -0.34% 0.37% 0.03 0.04 0
DIESEL All Sizes 65 -1.88% -0.03% -2.09% 0.20 -0.29 0
FOSSIL Oil/Gas Primary All Sizes 66 -0.75% -0.17% -0.76% -0.06 0.19 1700
FOSSIL Oil/Gas Primary 001-099 67 -0.62% -0.07% -0.62% -0.27 0.06 21
FOSSIL Oil/Gas Primary 100-199 68 -0.62% -0.07% -0.62% -0.27 0.06 21
FOSSIL Oil/Gas Primary 200-299 69 -1.10% -0.45% -1.16% 0.02 0.29 1466
FOSSIL Oil/Gas Primary 300-399 70 -1.10% -0.45% -1.16% 0.02 0.29 1466
FOSSIL Oil/Gas Primary 400-599 71 -1.10% -0.45% -1.16% 0.02 0.29 1466
FOSSIL Oil/Gas Primary 600-799 72 -1.10% -0.45% -1.16% 0.02 0.29 1466
FOSSIL Oil/Gas Primary 800-999 73 0.42% -0.45% 0.40% 0.02 0.29 1466
PJM © 2020 www.pjm.com 30 | P a g eYou can also read