Measuring Women and Men's Work - Main Findings from a Joint ILO and World Bank Study in Sri Lanka
←
→
Page content transcription
If your browser does not render page correctly, please read the page content below

Measuring
Women
and
Men’s Work
Main Findings from a
Joint ILO and World Bank
Study in Sri Lanka
Measuring
Women
and
Men’s Work
Main Findings from a
Joint ILO and World Bank
Study in Sri Lanka

Prepared by:
The International Labor Organization and the World Bank

Main authors:
Antonio Rinaldo Discenza, International Labour Organization
Isis Gaddis, World Bank
Amparo Palacios-Lopez, World Bank
Kieran Walsh, International Labour Organization
Copyright © 2021 The World Bank.

Rights and Permissions
This work is available under the Creative Commons Attribution 3.0 IGO license (CC BY 3.0 IGO)
http://creativecommons.org/licenses/ by/3.0/igo. Under the Creative Commons Attribution
license, you are free to copy, distribute, transmit, and adapt this work, including for commercial
purposes, under the following condition:

Attribution—Please cite the work as follows:
Discenza, A., Gaddis, I., Palacios-Lopez, A., Walsh, K. (2021). Measuring Women and Men’s Work:
Main Findings from a Joint ILO and World Bank Study in Sri Lanka. Washington DC: World Bank.

Disclaimer
The findings, interpretations, and conclusions expressed in this Guidebook are entirely those
of the authors. They do not necessarily represent the views of the International Bank for
Reconstruction and Development/World Bank and its affiliated organizations, or those of the
Executive Directors of the World Bank or the governments they represent or the International
Labour Organization.

Cover image: ©Lakshman Nadaraja / World Bank
Table
of
Contents
Acknowledgements.................................................................................................. v
1. Background and Summary.................................................................................. 1
1.1 Background.........................................................................................................................1
1.2 Measuring Women and Men’s Work: THE 19th ICLS........................................... 3
1.2.1 Summary of findings: identification of employment................................................................................... 4
1.2.2 Summary of findings: the identification of other unpaid activities............................................... 5
2. Main Findings........................................................................................................ 8
2.1 Achieving the Comprehensive Measurement of Employment.................. 12
2.2 The Measurement Of Unpaid Working Activities.............................................. 17
2.2.1 Own-use production of goods......................................................................................................................................... 18
2.2.2 Own-use provision of services......................................................................................................................................... 22
2.3 Concurrent Work Activities and the Total Burden of Work..........................27
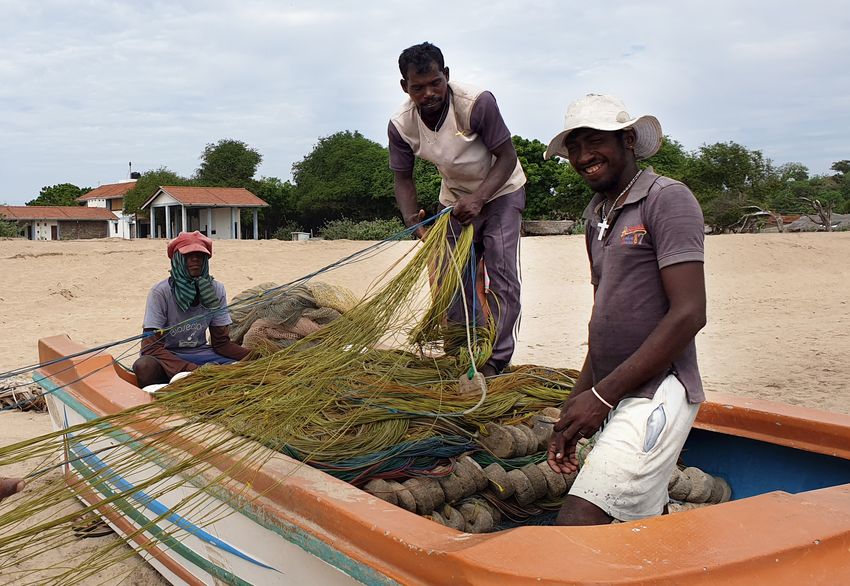
2.4 Work in Agriculture and Fishing...............................................................................32
2.5 Labour Underutilization.............................................................................................. 33
2.6 Other Issues of Note..................................................................................................... 34
3. Summary Conclusions...................................................................................... 36
References................................................................................................................ 40
Annex 1.
19th ICLS Statistical Standards.............................................................................. 42
Annex 2.
Methodology of the Pilot Study............................................................................. 45
Annex 3.
Identifying Employment in the LFS and MLSS Questionnaires......................... 51
Measuring Women and Men’s Work | Main Findings from a Joint ILO and World Bank Study in Sri Lanka

iv
Measuring Women and Men’s Work | Main Findings from a Joint ILO and World Bank Study in Sri Lanka

Acknowledgements

This report is a co-publication of the International Labour Organization and The World Bank based
on a methodological study that was conducted in partnership with the Sri Lanka Department of
Census and Statistics (DCS). This work was made possible by generous funding and support from
the William and Flora Hewlett Foundation and Data2X under the Women’s Work and Employment
Partnership. Akuffo Amankwah, Theophiline Bose-Duker and Peter Buwembo were members of
the core team conducting the methodological study.

The authors wish to thank Kathleen Beegle, Peter Betts, Michael Frosch, Yeon Soo Kim, Gayatri
Koolwal, Michael Weber, and, Alberto Zezza for comments and guidance over the course of the
study. Special thanks go to Indu Bandara, Gero Carletto, Rafael Diez de Medina, Caren Grown, K.A.
Sajeewa Kodikara, Idah Pswarayi-Riddihough, Ritash Sarna, Asitha Seneviratne, and Simrin Singh
for supporting the study and to all the dedicated staff at the DCS, especially Dhanushka Nanayakkara
and Chandani Wijebandara, without whom this work would not have been possible. This report was
proofread by Robert Zimmermann, and layout design was by studio Pietro Bartoleschi.

                                                                                                    v
1
Background
and
Summary
1. Background and Summary

1.1   Background                                 supplement the unemployment rate. Enabling
                                                 more meaningful gender analysis was a key
                                                 objective of these various updates but this
Between 2017 and 2019, the International         can only be achieved when the standards and
Labour Organization (ILO) and the World          good measurement practices are applied
Bank, in collaboration with the Department       through household surveys.
of Census and Statistics (DCS) of Sri Lanka,
completed a pilot study in Sri Lanka with the    It is important to highlight from the outset
goal of developing guidance on good practice     that the two household survey types that
in the measurement of women and men’s            are the focus of this study fulfil different
work through household surveys. The study        primary objectives. LFSs are the primary
was designed to enable a comparison of the       data source for the computation of labour
outcomes of two types of household surveys,      market indicators, while MLSSs are designed
namely, the labour force survey (LFS) and the    to allow broader measurement and analysis
multitopic living standards survey (MLSS). It    of living standards and poverty. While the
was completed under the Women’s Work and         absolute comparability of the results of the
Employment Partnership hosted by Data2X          two types of surveys should not be expected
with the support of the William and Flora        given the different primary objectives
Hewlett Foundation. The motivation for the       and methodologies, the classification of
study was the 19th International Conference      respondents, their working activities and
of Labour Statisticians (ICLS) in October        their engagement with the labour market
2013, which introduced major changes to the      should be as consistent as possible. This is
framework of definitions used to produce         all the more important in developing country
statistics on work and the labour market         contexts, where surveys are often conducted
(ILO 2013, see also Annex 1). Relative to the    infrequently and many analytic studies (for
standards of 1982, it reduced the scope of the   example, to understand drivers of changes in
statistical definition of employment to work     poverty and living standards) often draw on
done for pay or profit and applied a wider       various types of surveys on the assumption
definition of work, along with the forms of      that they are each generating coherent and
work framework, to support the analysis of       consistent information.
participation in paid and unpaid productive
activities. This new framework recognizes        The sensitivity of statistics to survey design,
that people may engaged in multiple              particularly statistics on labour, is well
working activities within the same period,       documented, often with a focus on the impacts
thereby enabling a complete accounting all       observed if the content of a survey is altered
work performed. An additional important          (for example, see Bardasi et al. 2011). Studies
development was the adoption of an extended      have also been undertaken on the effects of
set of labour underutilization indicators to     different survey types on measurement that

                                                                                                   1
Measuring Women and Men’s Work | Main Findings from a Joint ILO and World Bank Study in Sri Lanka
focus on the ex post comparison of results, in estimates of work and the labour market
such as a study in Egypt showing a substantial between the MLSS and the LFS.
impact of the survey type on estimates of
women’s work (Langsten and Salen 2008). To isolate the effect of survey type and
Similarly, Floro and Komatsu (2011) show that differences in survey content on measures
household surveys can easily miss temporary of work and employment, this study was
or casual forms of employment. Among the conducted as a split-sample randomized
concerns is that, especially in countries with experiment whereby the only differences
strong social norms and/or culturally assigned between the two groups of households
gender roles, women working in family randomly assigned to one of two treatment
businesses may not consider the activity as arms were the questionnaire content and
employment (or work) and therefore not report implementation. This study design permits
the activity in response to standard questions conclusions to be drawn on the scale of
about labour market engagement (Müller and differences, if any, and the possible cause of
Sousa 2020). While these studies demonstrate these differences. This allows guidance to be
the sensitivity of measurement to survey developed on good measurement practices.
design, they do not provide specific solutions
for any given survey beyond those they cover. This pilot study builds on previous rounds
This requires more direct investigation of studies completed by the ILO (Benes and
specific to the surveys under review, namely, Walsh 2018b) and the World Bank (Gaddis
the LFS and MLSS. et al. 2020b), as well as a range of related
research papers (Desiere and Costa 2019;
To address these issues, the ILO and World Koolwal 2019). In addition to extending
Bank conducted a joint pilot study in Sri Lanka, the scope of the available guidance,
in collaboration with the Sri Lanka Department the experiences will be used to update
of Census and Statistics (DCS). The study had published ILO model LFS questionnaires
four broad objectives, i.e. to (i) support the and a World Bank model labour module
operationalization of the 19th ICLS standards for MLSS questionnaires, and inform the
in LFS and MLSS type surveys, (ii) assess and, upcoming guidelines on the measurement of
if identified, reduce the undermeasurement employment and work on MLSSs.
of women’s employment and work (as
documented by the previous academic This report presents a first summary set of
literature mentioned above and earlier ILO the findings of the pilot study. The findings
pilot studies) in these surveys, (iii) gain a better are being used to generate guidance on the
understanding of the comparability of labour measurement of labour across different
market indicators obtained from LFS vs MLSS types of household surveys. While the
type surveys, and (iv) pilot changes in either primary target audience of the guidance
questionnaire that could narrow differences will be those individuals tasked with the
21. Background and Summary
completion of household surveys that These updates took the form of Resolution
measure labour, the findings should also I of the 19th ICLS: Resolution concerning
attract a wider audience, including data statistics of work, employment, and labour
users who are interested in the measurement underutilization.
practices behind the statistics or, more
generally, in the improvement of the data The 19th ICLS standards revised
available on women and men’s work. While the definitions of employment and
highlighting issues of measurement, the unemployment and also established a much
report also emphasizes the valuable data wider framework for statistics on paid and
that can be generated if the guidelines and unpaid work and on labour underutilization.
standards are implemented, such as the This has created a basis for a much wider
more comprehensive measurement of all the range of analyses of the working lives of
working contributions of men and women. individuals. A key motivation of the changes
was a desire to explain differences in the
working contributions and experiences
1.2 Measuring Women of women and men and to achieve a
related understanding of labour market
and Men’s Work: engagement. The objective is to achieve the
THE 19th ICLS mainstreaming of the measurement of all
working activities in order to enable deeper
The background of the study is related to the insights into the relationship between the
international statistical standards adopted performance of work and interactions with
by the international community at the 19th the labour market.
ICLS in October 2013. The revised standards
represent a framework for work and labour The survey questionnaires covered a mix
market statistics and replace the standards of paid and unpaid working activities,
adopted at the 13th ICLS in 1982. The latter namely, employment, the production of
standards had been in use in many countries goods for own-use and the provision of
for decades and had become synonymous services for own-use, as defined in the
with labour statistics on a worldwide standards. The LFS questionnaire used
basis, providing, for instance, definitions for the study was developed by the ILO
of key concepts, such as employment, by building on the published model LFS
unemployment and labour force participation. questionnaires. The MLSS questionnaire
was developed by the World Bank using the
The 1982 standards have been vital, but there multitopic household surveys with a focus
had been a growing realization – as occurs in on poverty measurements, such as the ones
many statistical domains – that updates were supported by the World Bank through the
needed to meet user needs more effectively. Living Standards Measurement Study, as a
3Measuring Women and Men’s Work | Main Findings from a Joint ILO and World Bank Study in Sri Lanka
reference.1 The questionnaires both included The study in Sri Lanka sits within the context
similar numbers of questions to identify the of ongoing efforts to provide support to
labour force status of individuals, but the countries in the implementation of the 19th
LFS questionnaire contained more detailed ICLS standards through household surveys
questions on supplementary labour–related that measure labour. The data have been
factors, such as detailed characteristics of analysed following the completion of the
jobs, while the MLSS questionnaire contained first and second waves of data collection,
questions on a range of other topics related which took place in March to April 2019 and
to living standards. September to October 2019, respectively.
The main findings are summarized below and
A message of this report is that the detailed in the main body of the report.
measurement of diverse forms of work
adds immense value and provides a clearer
perspective on gender differences than 1.2.1 Summary of findings:
statistics on employment alone. For identification of
example, three quarters of the total working employment
time among employed male respondents
across the three forms of work activities The measurement of employment,
– employment, the own-use production of particularly employment among women, is
goods and the own-use provision of services sensitive to survey design and content. This
– was accounted for by employment. Among finding is consistent with the conclusions
employed women, the corresponding share of many earlier studies and repeated across
was less than half, and women spent more many settings (see Anker and Anker 1989;
than half their average reported working time Boserup 1970; Comblon and Robilliard
in unpaid household services, regardless of 2017; Mahmud and Tasneem 2011). While
their status as employed. As a result, a gap the contexts of the studies referenced
of ten hours working time per week in favour varied substantially and even though these
of men if only employment is considered studies generally pre-date the adoption of
becomes a gap of over ten hours in favour of the 19th ICLS standards, a similar pattern of
women if the three forms of work activities undercounting women’s work was identified.
are considered together, irrespective of the
survey used to measure work. The results of the Sri Lanka study
demonstrate that a clear risk continues
to exist of undercounting various types of
working activities, or of misclassification
between paid and unpaid activities when the
1 The MLSS questionnaire is not based on the Sri Lanka Household
Income and Expenditure Survey, because the latter does not 19th ICLS standards are applied. In the first
include a dedicated module on household members’ labour market
engagement. wave of data collection, the LFS identified
41. Background and Summary
22 percent more employed women than women than among men. These conclusions
the MLSS (equivalent to an 8.1 percentage support the development of guidance on good
point difference in measured employment measurement practices to avoid the risks,
to population ratios). It also identified such as the need for recovery questions,
approximately 3 percent more employed men careful wording and translations into local
(a 2.4-percentage point difference in the language, to ensure that people with “small”
employment-to-population ratios), leading jobs or helping in family businesses or farms
to a gap of 10 percent overall between the are identified in the survey. These revisions to
surveys (a 5.5 percentage point difference in the MLSS instrument, while important for the
employment-to-population ratios). In-depth measurement of employment, also improve
analysis of the data led to a conclusion that the measurement of own-use production
the gap emanated from the fact that the work in agriculture (described below).3
MLSS, which, unlike the LFS, initially did not
include any recovery questions, identified
fewer people engaged in employment in three 1.2.2 Summary of findings:
particular groups, namely (1) those with more the identification of
casual, low-hours jobs, (2) helpers in family other unpaid activities
businesses and farms and (3) others involved
in informal working activities, with all of The Sri Lanka study also included questions
these groups being primarily women. 2
on unpaid working activities. Specifically,
work done to produce goods for own-
Changes to address these issues were consumption (called the own-use production
successful in partially closing the gap in the of goods in the standards), which covers,
second wave of data collection (6 percent but is not limited to subsistence farming,
gap for both men and women, equivalent and unpaid work to provide services to the
to a 3.5-percentage point difference in household (called the own-use provision
employment to population ratios). of services in the standards), such as
housework, childcare and other activities
This finding that risks of misclassification of predominantly carried out by women. In
work are most concentrated among certain combination, the standards refer to these
types or groups of workers corroborates two types of activity as own-use production
earlier findings of the ILO (Benes and Walsh
2018b), that these risks are greater among
3 In the MLSS, a common set of questions is used to identify
employment in agriculture (that is, agricultural work for pay or profit)
and own-use production in agriculture (that is, for own or family
consumption). The distinction between these two concepts is fleshed
out in subsequent questions, which seek information on the intended
2 Recovery questions are here defined as questions whose purpose is use of the agricultural outputs (for pay or profit or for own or family
to “recover” persons who were not classified as employed during the consumption). Any revisions that improve the ability of the MLSS to
core questioning designed to capture employment, even though they capture employment in agriculture will thus also enhance the ability
were engaged in activities that count as employment. of the survey to measure own-use production in agriculture.
5Measuring Women and Men’s Work | Main Findings from a Joint ILO and World Bank Study in Sri Lanka
work. The other forms of work covered by wording mentioned above were successful
the standards, namely, unpaid trainee work in narrowing the gap between the MLSS and
and volunteer work, were not examined in the the LFS.
Sri Lanka pilot study.
Even more notable was the sensitivity of the
In the first wave of data collection, relative data on hours worked in own-use provision
to the MLSS, the LFS recorded a greater of services. While the MLSS identified fewer
prevalence of both forms of unpaid work. people engaged in these activities in wave
The difference was concentrated in crop- 1, it showed a substantially higher average
farming, while there was relatively less number of hours worked (34.2 versus 24.8 in
difference across other types of activities. the LFS). Analysis narrowed this down to care
This reflects the fact that – as described work (care of children or dependent adults),
above – the MLSS identified fewer family and a review of practices identified the source
helpers and other marginal workers in as a difference in implementation between
farming. The updates undertaken after the two surveys. While the two surveys used
wave 1 caused a reduction in the recorded similar questions to identify individuals
gap. The difference observed in wave 2 engaged in care work for adults and children,
was relatively minimal, suggesting that the LFS emphasized active caregiving (and
the additional questions and updates in included a descriptive text to be read by
61. Background and Summary
LFS interviewers). In contrast, there was no approach leads to an overestimation relative
explicit emphasis on active caregiving in the to the single question. However, while the
MLSS. As a consequence, the MLSS estimate direction and scale of the impact is quite
for caring activities in wave 1 was nearly three consistent, which of the two sets of results is
times the LFS estimate (43.8 versus 16.1). more valid is not certain.
During the wave 2 training, both sets of The study covered many other issues,
interviewers were instructed to read the the analysis of which enhances the
additional text. The impact on results was understanding of good practices in the
clear. The LFS result was relatively consistent measurement of work, employment and
with wave 1, while the MLSS estimate fell by labour underutilization, as framed by the
half, leaving a much smaller gap and resulting 19th ICLS standards. Perhaps a general
in a minimal gap in the overall estimate of summary should highlight, as above, that
the time spent in the own-use provision of the measurement of work can be sensitive
services in wave 2 (26.1 hours per week in the to questionnaire design, implementation
MLSS and 25.3 hours in the LFS). and context, and the study has allowed
an identification of the areas in which the
The study also shows that measured weekly misclassification risks appear greatest.
hours spent on the own-use provision
of services are significantly lower if the Another general point is the need for good
survey relies on only one question (seeking questionnaire development and testing
information on the hours worked during the practices to establish a solid survey footing.
previous week) rather than two questions This is true at the international level in the
(on the days worked during the previous activities of international agencies and at
week and the average hours worked per the national level among national statistical
day). In wave 2, both the LFS and the MLSS compilers. In the absence of appropriate
administered to half the samples the one- testing, the degree of sensitivity of
question approach and to the other half the measurement may never truly become visible,
two-question approach. The results in both leaving open the possibility that the statistics
surveys were highly consistent. The two- generated may not capture reality in the way
question approach yielded weekly hours desired, for example the differences between
spent on own-use production of services that women and men’s working lives. Activities
were approximately 30 percent higher than at the international level can provide a major
weekly hours based on only one question. support to countries, but not entirely replace
This pattern was repeated among both men the need for sound translation and the
and women albeit with slightly different gaps. adaptation of questionnaires to the national
A possible explanation is that the rounding context, a process that needs to be supported
of the daily averages in the two-question by testing at the national level.
72 Main Findings
2. Main Findings

The measurement of employment and                 those adopted at the 19th ICLS. A primary
other working activities is sensitive to          objective of the revised standards was to
survey design; this is particularly true in       address gender biases in the basic concepts
the case of women. A clear risk exists of         used to measure employment and economic
undercounting the various types of working        activity, as well as to promote a much wider
activities or misclassifying paid and unpaid      range of statistics on paid and unpaid work
activities. This risk can be reduced by           and engagement with the labour market,
careful survey design, testing and training.      relative to previous standards. (See Annex 1
Misclassifications, if they occur, can            for a description of the 19th ICLS standards.)
seriously limit the analysis of the variations
across the experiences and contributions of       The implementation of the revised
women and men to productive activities, as        standards needs to be accompanied by
well as the barriers and constraints they face    good measurement practices to achieve
to changing their situation. This hampers the     an improvement in the data on women and
identification or evaluation of appropriate       men’s engagement in employment and other
policies, including those seeking to promote      forms of work. The Sri Lanka study is part
women’s economic empowerment.                     of a longer-term series of studies designed
                                                  to provide comprehensive guidance to
This is one of a number of key findings of        countries on the implementation of the
a pilot study completed in Sri Lanka in a         standards. In the ILO case, this builds on an
cooperative effort of the DCS of Sri Lanka,       earlier round of pilot studies that focused on
the ILO, and the World Bank. The pilot study      the implementation of key elements of the
was completed through the Women’s Work            standards through the LFS (Benes and Walsh
and Employment Partnership hosted by              2018a). This work had been used to develop
Data2X with the support of the William and        model LFS questionnaires that were the
Flora Hewlett Foundation.                         starting point for the LFS questionnaire used
                                                  in the Sri Lanka study.4 For the World Bank,
The findings of the pilot study will advance      the study builds on previous methodological
the cause of the proper measurement and           studies conducted under the umbrella of
reporting of paid and unpaid work across          the Living Standards Measurement Study
household surveys (particularly the LFS and       Program to improve labour measurement in
the MLSS) focused on measuring welfare by         household surveys. While this study reiterated
identifying measurement difficulties in the       some of the findings of the earlier rounds of
domain of work and the related solutions
and good practices. This endeavour has
been carried out in the context of the need       4   See Labour Force Survey (LFS) Resources (dashboard), ILOSTAT,
for support in implementing the latest                International Labour Organization, Geneva, https://ilostat.ilo.org/
                                                      resources/lfs-resources/.ttps://ilostat.ilo.org/resources/lfs-
international statistical standards, especially       resources/.

                                                                                                                        9
Measuring Women and Men’s Work | Main Findings from a Joint ILO and World Bank Study in Sri Lanka
studies, it is unique because it was explicitly operandi of the quantitative test was to
designed to allow a comparison of the labour administer a “typical” LFS questionnaire and
indicators generated by two different survey a “typical” MLSS questionnaire to a similar
instruments (the LFS and the MLSS). In sample of households through a split-
addition, the study added substantially to the sample randomized design. Within each
understanding of some topics, such as the PSU, 10 households were randomly assigned
measurement of agricultural work and of the to the LFS, and 10 to the MLSS treatment
time spent on unpaid household service work. arms.5 (See Annex 2 for a description of the
It also highlighted areas where more study methodology of the pilot study.) 6
would be beneficial.
As proposed by Presser et al. (2004), such
The lessons learned will inform more rounds a split-sample approach can be used if
of questionnaire development and testing on the objective is to compare the outcomes
key related issues, such as the use of time- of different survey questionnaires and if
use approaches to improve the measurement all aspects of the sampling, methodology
of unpaid household service work. The and implementation, other than the
ultimate objective will be a comprehensive questionnaires, are the same. In line with
guidance covering the full range of issues approaches proposed by Fowler (2004)
touched on by the 19th ICLS standards, statistics are generated and compared
namely, the performance of paid and unpaid for the concepts covered by both
work and labour market engagement. questionnaires. If differences were observed,
for example, in the proportion of working-
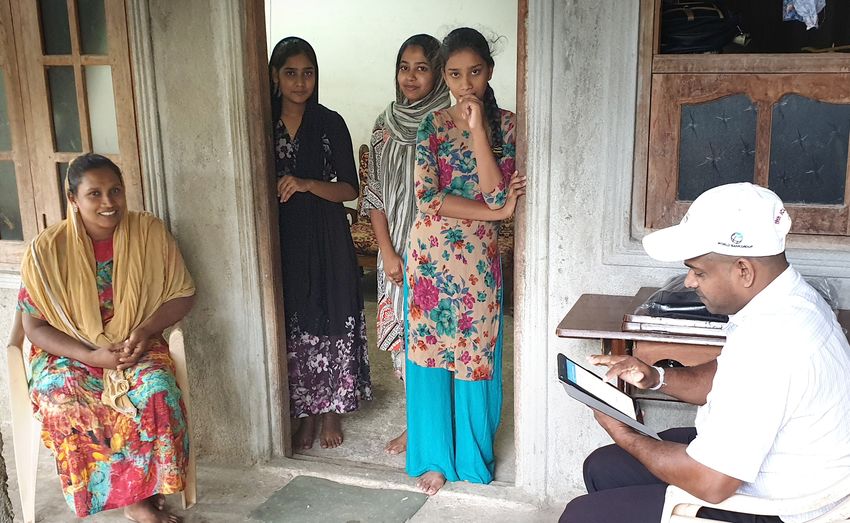
The Sri Lanka pilot study involved multiple age respondents identified as employed, a
rounds of data collection, allowing more in-depth analysis was undertaken to
comparisons across the outcomes at try to isolate the source of the differences.
different times. The first round of testing This type of experimental approach is being
involved cognitive interviews among increasingly used and has been found to
20 respondents for each questionnaire. be valuable in generating improvements
This was followed by a quantitative test in questionnaire design (for instance, see
based on a representative sample of Beaman and Dillon 2012; Beegle et al. 2012;
households in three districts of Sri Lanka, Benes and Walsh 2018b; Gaddis et al. 2020a;
namely, Anuradhapura, Galle and Kurunegala. Heath et al. 2020; Kilic and Sohnesen 2017).
The quantitative test was based on a total
sample of 980 households per survey type
and per wave across 98 primary sampling
5 This implies that, within each household, all individuals were
units (PSUs). The households were selected administered the same questionnaire.
from the census blocks of the continuous 6 All estimates of labour market indicators reported in this document
use post-stratification weights to benchmark the MLSS and LFS
LFS in the selected districts. The modus samples to a common reference population.
102. Main Findings
For example, when a difference was the impact of the solutions identified. The
identified in the proportion of working- order of the report broadly follows the study
age respondents in employment in wave 1, design. Thus, the findings of wave 1 are
a detailed analysis took place of the generally described initially for any given
characteristics of employment and working issue. This is followed by a description of the
time of respondents to each questionnaire, changes made to the survey instrument in
as well as the contribution of the various wave 2 and the results of wave 2, along with
questions to the total measured level of the conclusions drawn.
employment. This analysis then supported
a conclusion that the difference emanated Despite the above, achieving absolute
from a greater emphasis in the LFS consistency between the LFS and MLSS,
questionnaire on the recovery of small jobs or any other household survey, in the
and helpers in family businesses and farms, measurement of work and labour is not a
as revealed by differences in working time, realistic goal. Absolute consistency will be
industry, occupation, and so on. An analysis unlikely because of differences in the primary
across the three districts showed that a objectives and many aspects of the design
similar scale of variation was observed in of various household surveys. For instance,
each district, further supporting a conclusion the LFS will typically be administered to a
that the difference could be related to larger sample of households and be focused
questionnaire content given that it appeared primarily on the labour market and work-
to be systematic. related issues to generate a wide range of
indicators on these topics. The MLSS may
In the absence of a split-sample randomized involve smaller samples and will cover a
study design, it would have been difficult wide range of topics relevant to the analysis
to rigorously isolate the effects of the of poverty and living standards. While
questionnaire used on the outcomes of information on the engagement of each
interest, detect the sources of differences household member in different forms of
with any degree of specificity, and identify paid and unpaid work is key to the analysis of
ways to close measurement gaps. The poverty and living standards, MLSSs inevitably
multiple wave approach also performed include fewer questions on labour and capture
an important function, insofar as it gave less detail on the topic than a dedicated LFS.
the study team the opportunity to make The outputs of the two surveys will therefore
changes to the questionnaires before a vary substantially in scope, focus, the type of
second wave of field data collection with the disaggregations, and so on. Nonetheless,
the same households, and to assess the improving the consistency in measurement,
impact of these changes on labour indicators to the extent possible, will be valuable.
generated by both survey types during the Regardless of the survey, it is desirable that
second wave. This enabled an analysis of a person who is employed (as defined by the
11Measuring Women and Men’s Work | Main Findings from a Joint ILO and World Bank Study in Sri Lanka
standards) be classified as employed, likewise Deeper analysis of this result suggested
for unemployment or other key concepts. that the greatest gap centred on people
Differences in classification have implications helping in family businesses or farms,
for coherence across surveys. This is people with more casual jobs or jobs with
especially important in developing countries, lower average working hours. These findings
where surveys may be conducted infrequently are consistent with the results of several
and labour market information systems may previous studies. Müller and Sousa (2020)
have to draw on various types of surveys on note, in particular, the tendency of women
the assumption they are each generating working in family businesses to self-identify
coherent and consistent information. as housewives, which was often seen by
the respondents as mutually exclusive
with employment. Consequently, these
2.1 Achieving the respondents did not report their activities
when they were asked about their jobs or
Comprehensive businesses. Benes and Walsh (2018b) find
Measurement of that dedicated recovery questions were
Employment required to target more casual jobs or the
work of those helping in family businesses.
A similar conclusion was reached by
In the first wave of field collection, the Sudarshan and Bhattacharya (2008), who
LFS questionnaire identified one tenth show that these types of undercounts can
more employed respondents than the be addressed by intensive probing.
MLSS questionnaire. The two surveys
generated employment to population The types of working activities at greatest
ratios of 57.0 percent and 51.5 percent, risk of undercount are predominantly
respectively (see Figure 1). This difference performed by women. In the case of the
was particularly acute and statistically Sri Lanka study, this was confirmed by an
significant among female respondents. The assessment of the differences between the
LFS identified 22.5 percent more employed surveys in the distribution of jobs by status
women (a ratio of employment to population in employment, sector and average hours
of 44.1 percent versus 36.0 percent), while a worked. More specifically, the LFS identified
small difference was also recorded among larger numbers of contributing family
men (72.4 percent versus 70.0 percent).7 workers, own-account workers and persons
with low-hours jobs. Changes were made to
the MLSS questionnaire used during wave 2
of the field data collection to reflect these
7 The indicators of work and the labour market shown in this report
refer to the working-age population (WAP). In line with para. 65 of the conclusions. In particular, the wordings
19th ICLS resolution (ILO 2013) this includes all persons aged 15 years
and above. of some questions were changed, and
122. Main Findings
Figure 1
Employment to population ratio (% of working-age population (WAP)), by sex,
wave of data collection and survey
57.0
Wave 1
TOTAL
51.5
57.4
Wave 2
53.9
72.4
Wave 1
70.0
MALES
73.5
Wave 2
68.9
44.1
Wave 1
36.0
FEMALES
43.8
Wave 2
41.3
0 10 20 30 40 50 60 70 80
LFS MLSS
Source: Joint DCS, ILO, and World Bank pilot study in Sri Lanka, Wave 1 and Wave 2, March–October 2019.
recovery questions were added to target This meant that, in wave 2, the LFS was
people engaged in the types of activities identifying 6.5 percent more employed than
apparently missed by wave 1 (see Annex 3 the MLSS (or an employment to population
for details). Further in-depth analysis of the ratio that was 3.5 percentage points higher).
MLSS wave 2 data, presented in Annex 3, This suggests the changes made were at
Figure 3.1, shows that without the recovery least partially successful and were especially
questions, 9 percent of employed women important for women, reducing the gap
would not have been captured as employed. from 22.5 percent to 6.0 percent. It is worth
For men, all four recovery questions noting that, while the difference in estimates
combined identified only slightly more than of total employment remained statistically
2 percent of total employment. significant the difference for women was
no longer statistically significant in wave 2.
In wave 2, the gap between surveys was The remaining gaps observed in wave 2, as
reduced among women (43.8 percent in wave 1, were repeated across the three
in the LFS versus 41.3 percent in the districts covered by the pilot study and nearly
MLSS), while it slightly increased among all age groups, supporting the conclusion
men (73.5 percent versus 68.9 percent). that the difference was relatively systematic.
13Measuring Women and Men’s Work | Main Findings from a Joint ILO and World Bank Study in Sri Lanka
The fact that the LFS identified more Annex 3.) This approach is consistent with
employed respondents in this context than guidance provided by Grosh and Glewwe
the MLSS may be attributed to the fact that (2000). It also reflects long-standing practice
the LFS design is centred on a comprehensive in MLSSs and helps maintain a degree of
identification and description of employment comparability over time.
and labour market engagement, while the
MLSS has a primary focus on poverty, thus These variations in approach reflect the
dedicating fewer questions to the overall important differences in the objectives
topic of labour. This may be seen in the of the surveys, and it is unsurprising that
questionnaires presented in Annex 3. the results are not completely consistent.
Nonetheless, the finding of the pilot
The LFS questionnaire used for the study that relatively minor adjustments to
study dedicated early questions to the questionnaires can reduce, if not eliminate,
comprehensive identification of employment, gaps is useful for any household survey
without seeking to categorize employment covering labour-related issues.8
by industry, occupation, and so on. This
additional detail was captured through the The differences observed in wave 2, while
later sections of the questionnaire. The smaller in magnitude, were concentrated,
answer to a single question might identify a as follows:
respondent as employed, or several might be
needed. Benes and Walsh (2018b) show that, if The differences in wave 2 were
well designed and implemented, this approach concentrated among the self-employed
can be efficient in minimizing the survey (17.5 percent higher in the LFS), largely, but
burden on most employed respondents, while not exclusively in the agriculture sector.
capturing more difficult cases (for instance,
casual jobs) through additional questions. The LFS also recorded a larger number of
employees in wave 2, but the difference
By contrast, the MLSS questionnaire was less substantial than the gap for the
combined the objective of identification self-employed.
and a certain level of classification of the
employment though the initial questions on
8 Because the LFS is dedicated to the measurement of employment
labour, reflecting the fact that it dedicates and work and has been extensively tested in previous rounds of
methodological investigation, the analysis generally considers the
fewer questions to the topic overall. Also, LFS estimates as a benchmark against which the MLSS is evaluated.
respondents to the MLSS tended to answer Of course, there is still also the possibility of some degree of under-
or overcounting or of mismeasurement more broadly in the LFS
all the initial questions and thus provided that the study was not designed to assess comprehensively, even if
some misclassification issues could have been observed. Moreover,
a categorization of all the employment and we assume that seasonality, as captured by differences in labour
market indicators between waves 1 and 2, would affect the two
own-use production of foodstuffs undertaken survey instruments proportionately (and this is one of the reasons
this report emphasizes relative, rather than absolute gaps, between
by the respondent. (See the questionnaire in the two instruments).
142. Main Findings
In wave 2, the MLSS identified a slightly because they cover the dimensions that
higher number of respondents who, as typically distinguish women and men’s
a main job, were working without pay in experiences in the labour market.
family businesses and farms (that is, they
were contributing family workers). Another implication of the differences in the
identification of employment is evident in
The implications of these differences the analysis of the data on working time. The
are important because they have an MLSS picked up fewer jobs with low working
obvious and direct impact on many of the hours than the LFS in wave 1 (see Figure 2),
indicators describing the prevalence and leading to higher average working time (41.4
characteristics of paid work and on any versus 38.3). By wave 2, this gap had narrowed
analysis that builds upon such indicators. because of the improved recovery of people
This includes analysis of economic sectors, with casual or low-hours jobs, but a gap still
status in employment, occupation, remained (39.8 versus 37.9), supporting the
informality, working time, and so on. These conclusion that the changes made in the
aspects exhibit high gender relevance surveys may not have fully closed the gap.
Figure 2
Average hours actually worked per week in employment (in all jobs) and the gender gap,
by sex, wave of data collection and survey
38.3
Wave 1
TOTAL
41.4
37.9
Wave 2
39.8
42.5
Wave 1
45.5
MALES
42.2
Wave 2
44.2
10.1 32.4
Wave 1
10.8 34.7
FEMALES
10.4 31.8
Wave 2
10.4 33.8
0 10 20 30 40 50
LFS MLSS GENDER GAP
Source: Joint DCS, ILO, and World Bank pilot study in Sri Lanka, Wave 1 and Wave 2, March–October 2019.
Note: The red diamond indicates the gender gap in working time in the activities covered. The diamond is included on the bar of
the gender with less working time. If it is included on the bar for women, this thus shows the amount by which the average working
time of women in the activity was less than among males and vice versa if it shown on the bar for men.
15Measuring Women and Men’s Work | Main Findings from a Joint ILO and World Bank Study in Sri Lanka
Figure 3 illustrates this additionally, wave 1, the LFS identified 23 percent more
showing how respondents in each survey respondents who had worked between
were distributed by hours worked in the two 10 and 30 hours in the reference week
waves. In both wave 1 and wave 2, almost (314 compared with 256 in the MLSS). By
identical numbers of respondents had wave 2, there was still a gap, but it had
actual working time in all jobs of 40 hours or decreased to 13 percent (334 compared
more in the reference week. This suggests 9
with 296).
that both surveys were able to capture full-
time employment. The differences were One area of consistency between the two
observed in the lower bands of working time surveys was the gap in average actual
in both wave 1 and wave 2. However, the working time between male and female
gaps between the two surveys were smaller respondents (see Figure 2). Across both
in wave 2 than in wave 1. For example, in waves and in both surveys the average
Figure 3
Distribution of employed respondents, by bands of hours actually worked per week
(in all jobs) and by wave of data collection and survey
1600 1508 1518
1423
1400 1363
1200
1000 800 804 797 799
800
600 191 181
156
164
400
314 334
296
256
200
118 78 140 118
74 51 64 52
0
LFS MLSS LFS MLSS
Wave 1 Wave 1 Wave 2 Wave 2
Missing/Don’t know Temporarily absent 1 to < 10 10 to < 30 30 to < 40 40 or more
Source: Joint DCS, ILO, and World Bank pilot study in Sri Lanka, Wave 1 and Wave 2, March–October 2019.
Note: The LFS had 10 and the MLSS 11 missing/don’t know values for the hours worked in wave 1.
9 The actual number of respondents to each questionnaire was slightly
different; so, the results were reweighted to impose a common
total number of respondents for each survey and wave. This allows a
direct comparison of the number of respondents in different groups
across the two surveys and the two waves.
162. Main Findings
working time in employment was be related to paid work and labour market
approximately 10 hours greater among men engagement. Another advancement is the
than among women with an identical gap recognition of the reality that people can be
of 10.4 hours in wave 2 in both surveys. One engaged in multiple forms of work in a single
possible conclusion from this finding is that, reference period, for instance, employed,
even if some difference in estimates existed but also engaged in the production of goods
across the surveys, the difference was not for family consumption, and so on. This is a
particularly sex differentiated, at least not in contrast relative to the 1982 standards, which
the case of working time in employment, that excluded unpaid services within households
is, it was as likely to influence the reporting from the concept of economic activity and,
of working time in employment among both at the same time, assigned people to one
men and women. category only (employed, unemployed, or not
economically active).
The gender gap in working time is shown
by the red diamonds in Figure 2 (and other The new framework promotes the
figures containing information on working measurement of the different forms of work
time). The diamonds are presented on the to enable indicators to be generated on the
bar of the gender with lower average working prevalence of participation and the time spent
time in the activity. For example, in Figure 2, in each of them, as well as the interaction
the diamond for wave 2 in both surveys is between the various forms of work, the total
on the bar for women with the number 10.4, work burden and how these activities are
indicating that the average working time distributed across household members.
of female respondents in employment was
10.4 hours less than the average among men. The pilot study included different sets
of questions and flows to identify people
carrying out unpaid working activities
2.2 The Measurement and the time spent on these activities. As
with employment, the intention is to draw
Of Unpaid Working conclusions on good measurement practices
Activities for household surveys. Specifically, the
questionnaires both covered the own-
An important development associated with use production of goods and the own-use
the adoption of the 19th ICLS standards is the provision of services. (See Annex 1 for a
creation of a coherent framework identifying description of the 19th ICLS standards.)
different forms of unpaid work, alongside
employment. One goal is to mainstream the
measurement of unpaid working activities,
and in a way that allows the activities to
17Measuring Women and Men’s Work | Main Findings from a Joint ILO and World Bank Study in Sri Lanka
2.2.1 Own-use production (especially contributing family workers) also
of goods improved the survey’s ability to measure
own-use production in agriculture.
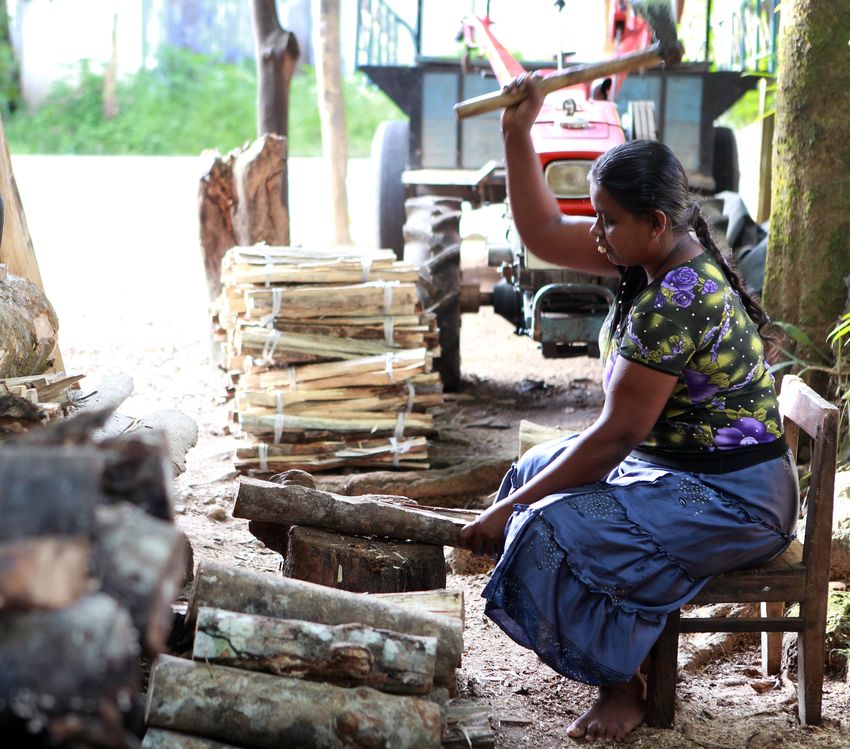
Own-use production of goods covers a diverse
range of activities performed by people Both surveys identified a high proportion
to produce goods for their own household of respondents engaged in the own-use
or family consumption. This includes production of goods. The comparison
subsistence farming or fishing activities, but between the two surveys was impacted by
also activities such as gathering firewood, the same issues identified in the case of
fetching water, hunting, gathering wild employment, namely, in the MLSS in wave 1,
foodstuffs, manufacturing clothing or other a relative undercount of people engaged in
household goods, construction and major family farming activities and a reduction of
renovation, or the preservation of foodstuffs the gap by wave 2, as follows:
for consumption later. Thus, it covers many
activities that are especially prevalent in In wave 1, the LFS revealed that
developing countries and, in some cases, 45.0 percent of respondents had
subject to important gender asymmetries, engaged in own-use production of goods
including the fact that those activities in the reference week, compared with
predominantly carried out by women are less 37.7 percent in the MLSS (see Figure 4).
frequently captured in the statistics. This cross-survey gap was relatively
similar among both male and female
The LFS and MLSS questionnaires both respondents with the LFS recording 8
included questions on the various activities percentage points higher participation
covered by own-use production, albeit with for men and 7 percentage points for
different structures, flows, and wording. In women. Both surveys indicated that the
the MLSS, a common set of questions is used rate of participation was higher among
to distinguish employment in agriculture women than among men and by similar
(that is, agricultural work for pay or profit) margins. For example, in wave 1, the LFS
and own-use production work in agriculture showed a gap between the participation
(that is, for own or family consumption). The of men and women of 12.6 percentage
distinction between these two concepts points, compared with 13.5 percentage
is illuminated in subsequent questions, points in the MLSS. By wave 2, these
which ask about the intended use of the gaps were 13.5 percentage points and
agricultural outputs (for pay or profit 15.0 percentage points, respectively.
versus for own or family consumption). The
revisions highlighted in the previous section By wave 2, the gap between the surveys
that improved the MLSS’s ability to capture had nearly disappeared (38.7 percent in
employment in the agricultural sector the LFS, compared with 39.8 percent in
182. Main Findings
the MLSS). In addition, the differences The average hours worked in own-use
between survey instruments are for production of goods (see Figure 5) by those
the most part no longer statistically engaged in that form of work were quite
significant. The rate found by the LFS similar between the surveys in both waves,
fell substantially between wave 1 and for example 6.3 hours per week in wave 2
wave 2, which can be linked to the timing of the LFS, compared with 6.2 hours in the
of the surveys; wave 2 took place during a MLSS. This highlights that, while own-
period of higher rainfall and thus greater use production of goods was a common
restriction on movement and outdoor activity, it was a low intensity activity
work. However, the participation levels relative to employment in this setting.
reported in the MLSS rose moderately,
illustrating the success of the updates
made to the MLSS questionnaire.10
Figure 4
Participation rate (% of WAP) in own-use production of goods, by sex, wave of data
collection and survey
45.0
Wave 1
TOTAL
37.7
38.7
Wave 2
39.8
38.2
Wave 1
30.4
MALES
33.1
Wave 2
31.6
50.8
Wave 1
43.9
FEMALES
43.5
Wave 2
46.6
0 10 20 30 40 50 60
LFS MLSS
Source: Joint DCS, ILO, and World Bank pilot study in Sri Lanka, Wave 1 and Wave 2, March–October 2019.
10 As mentioned earlier, we assume that seasonal changes affected the
LFS and MLSS proportionately, and therefore did not have a strong
influence on the gap (in relative terms) between the two surveys.
However, it remains a possibility that seasonality affected one
survey instrument more than the other and thus contributed to the
narrowing of the gap between the two surveys.
19Measuring Women and Men’s Work | Main Findings from a Joint ILO and World Bank Study in Sri Lanka
Figure 5
Average hours actually worked per week in own-use production of goods, by sex,
wave of data collection and survey
6.6
Wave 1
6.3
TOTAL
6.3
Wave 2
6.2
7.6
Wave 1
6.9
MALES
6.7
Wave 2
7.5
1.6 6.0
Wave 1
1.0 5.9
FEMALES
0.6 6.1
Wave 2
2.1 5.5
0 1.0 2.0 3.0 4.0 5.0 6.0 7.0 8.0
LFS MLSS GENDER GAP
Source: Joint DCS, ILO, and World Bank pilot study in Sri Lanka, Wave 1 and Wave 2, March–October 2019.
Note: The red diamond indicates the gender gap in working time in the activities covered. The diamond is included on the bar of
the gender with lower working time. If it is included on the bar for women, this shows the amount by which the average working
time of women in the activity was lower than among men and vice versa if it shown on the bar for men.
In both the LFS and the MLSS, there were The LFS identified more respondents who
gender gaps in both waves. The average were engaged in crop farming to produce
hours worked were higher among male foodstuffs for family or household use
respondents, though the size of the gap compared with the MLSS (10.2 percent
was somewhat different across the two versus 7.2 percent). This may be
survey types. This suggests there is some linked to the structural differences in
volatility or sensitivity in the reporting the questionnaires, particularly the
on hours related to differences in the additional sets of questions in the LFS
questionnaire content, but, on balance, this to ensure the complete coverage of
was not substantial. this group. Evidently, this becomes
important in the analysis of total labour
In wave 2, splitting own-use production of input to agriculture, the identification
goods into the various activities covered, one of agricultural households, or various
may note interesting patterns (see Table 1). other analyses relying on measures of
agricultural work (see below).
202. Main Findings
In some of the other activities covered, In both these activities, the number
variations were observed despite the fact of men participating was essentially
the surveys included identical questions. identical. No obvious explanation for these
For example, the LFS identified more inconsistencies is available, indicating
respondents engaged in the gathering of that the measurement of some own-use
wild fruits. The difference was entirely production activities may be sensitive to
among women (15.3 percent versus issues other than the wording of survey
11.4 percent). This situation was reversed questions, such as interviewer effects,
in the engagement in the collection question placement and order, the context
of firewood, a common activity in the effect, and so on. However, this is not
survey areas. The MLSS identified more universal. There is a fairly high degree of
respondents who were engaged in this consistency in the case of fetching water
activity, all women (33.4 percent versus and other activities covered by own-use
27.2 percent). production of goods.
Table 1
Shares of respondents of working age engaged in own-use production of goods in
wave 2, by sex, type of activity and survey
TOTAL MALES FEMALES
MLSS (pps)
MLSS (pps)
MLSS (pps)
Sign. Level
Sign. Level
Sign. Level
Shares of
Shares of
Shares of
Diff LFS-
Diff LFS-
Diff LFS-
Coeff. of
Coeff. of
Coeff. of
WAP (%)
WAP (%)
WAP (%)
Std. Err.
Std. Err.
Std. Err.
var. (%)
var. (%)
var. (%)
Crop LFS 10.2 1.0 10.2 12.0 1.2 10.2 8.8 1.1 12.6
3.0 ** 4.2 *** 2.0 *
farming MLSS 7.2 0.7 9.1 7.7 0.9 12.2 6.7 0.6 9.6
Rearing of LFS 1.1 0.3 25.9 1.1 0.4 31.3 1.1 0.4 32.3
-0.7 -0.5 -0.8 **
livestock MLSS 1.8 0.4 20.0 1.6 0.4 25.8 1.9 0.4 21.9
LFS 0.2 0.1 62.6 0.3 0.2 62.6 0.0 0.0
Fishing 0.2 0.3 0.0
MLSS 0.0 0.0 0.0 0.0 0.0 0.0
LFS 11.3 1.1 9.5 6.6 1.0 14.6 15.3 1.5 9.6
Hunting and Gathering 2.1 0.0 3.9 **
MLSS 9.2 0.8 8.9 6.6 0.8 11.7 11.4 1.1 9.7
Preserving LFS 1.7 0.3 16.1 1.1 0.3 29.9 2.2 0.4 18.1
0.4 0.5 0.3
food MLSS 1.3 0.2 18.7 0.6 0.2 36.6 1.9 0.4 20.6
Fetching LFS 10.3 1.0 9.7 9.9 1.1 11.1 10.5 1.2 11.6
-0.5 -1.4 0.2
water MLSS 10.8 0.9 7.9 11.3 1.1 9.6 10.3 1.0 9.3
Collecting LFS 21.6 1.3 5.9 14.9 1.3 8.6 27.2 1.7 6.2
-3.4 ** -0.2 -6.1 ***
firewood MLSS 25.0 1.2 4.9 15.1 1.2 8.2 33.3 1.6 4.9
Manufacturing of LFS 2.8 0.4 15.6 1.2 0.5 41.7 4.1 0.6 15.4
other household 0.4 0.5 0.4
goods MLSS 2.3 0.3 12.8 0.7 0.3 41.3 3.7 0.5 13.5
Building and major LFS 2.1 0.4 17.2 2.6 0.4 17.3 1.6 0.4 25.2
-0.5 -0.3 0.7
renovations MLSS 2.6 0.5 19.5 2.8 0.6 22.4 2.3 0.5 20.3
Source: Joint DCS, ILO, and World Bank pilot study in Sri Lanka, Wave 1 and Wave 2, March–October 2019.
Significance levels: * = 10 percent ** = 5 percent *** = 1 percent
21You can also read