Blood Pressure Distribution in the German Population
←
→
Page content transcription
If your browser does not render page correctly, please read the page content below
Medizinische Fakultät
                        der
             Universität Duisburg-Essen

                Aus dem Institut für
Medizinische Informatik, Biometrie und Epidemiologie

   Blood Pressure Distribution
     in the German Population

           INAUGURAL-DISSERTATION

                        Zur

          Erlangung des Doktorgrades der
        Naturwissenschaften in der Medizin
          durch die Medizinische Fakultät
          der Universität Duisburg-Essen

                   Vorgelegt von
               Chakrapani Balijepalli
               aus Gollapudi, Indien
                       2012
Dekan: Herr Univ. -Prof. Dr. med. M. Forsting
1. Gutachter: Frau Prof. Dr. rer. nat. S. Moebus
2. Gutachter: Herr Prof. Dr. med. A. Schmermund
Tag der mündlichen Prüfung: 26. April 2012
2Previous conference presentations and manuscripts from this work
Manuscripts
Balijepalli C, Lösch C, Bramlage P, Erbel R, Jöckel. K-H, Moebus S. Percentile
distribution of blood pressure readings in 35,683 men and women aged 18 to 99
years. Submitted to “Clinical Research in Cardiology” April. 2012.
Conference abstracts
C Balijepalli, S Moebus, C Lösch, A Scherag, KH Jöckel. Blood pressure
distribution according to age and sex in the German Metabolic and Cardiovascular
Risk Study with 35869 participants. German Society for Medical Informatics,
Biometry and Epidemiology 55th annual conference , 5-9 September 2010,
Mannheim, Germany. Abstract number: 114
C Balijepalli, S Moebus, C Lösch, A Scherag, KH Jöckel. Blood pressure
distribution according to age in a study population of 35,869 participants aging 18
to 99 years. German society for Epidemiology 5th annual conference, 21-25
September 2010, Berlin, Germany. Abstract number: 216
C Balijepalli, C Lösch, S Moebus. In Germany fifty percent of male primary care
patients aged 18 to 99 years presented with elevated blood pressures in the
prehypertensive state: The German Metabolic and Cardiovascular Risk Study
(GEMCAS). International Conference on Prehypertension and Cardiometabolic
Syndrome , 24-27 February 2011, Vienna, Austria.
C Balijepalli, C Lösch, S Moebus. Prevalences of Elevated Blood Pressure and
the Age Related Shift of Blood Pressure in German Adult Primary Care Patients:
The German Metabolic and Cardiovascular Risk Study. Nutrition, Physical Activity
and Metabolism / Cardiovascular Disease Epidemiology and Prevention 2011
Scientific Sessions, March 22-25, 2011, Atlanta, USA. Abstract number: P340
3Contents
1 Introduction
1.1 Physiology of blood pressure 6
1.2 Blood pressure and age 9
1.3 Impact of systolic and diastolic blood pressure on CVD 11
1.4 Blood pressure level and risk for cardiovascular disease 13
1.5 Risk of progression to hypertension 15
1.6 Measurement of blood pressure 16
1.7 Blood pressure secular trends
1.7.1 Global trends 18
1.7.2 Trends in Germany 19
2 Aim and Study Questions 21
3 Material and Methods
3.1 GEMCAS
3.1.1 Study design and participant recruitment 24
3.1.2 Data collection 24
3.1.3 Blood pressure measurements 25
3.1.4 Data Quality assurance 25
3.2 Heinz Nixdorf Recall Study
3.2.1 Study design and aims 26
3.2.2 Participant recruitment 27
3.2.3 Blood pressure measurements 28
3.2.4 Risk factor assessment 28
3.3 Diagnostic conventions 29
3.4 Statistical Analyses 30
44 Results
4.1 Study characteristics of the GEMCAS subjects 35
4.2 Frequency distribution and mean blood pressure 35
4.3 Percentile blood pressure distribution
4.3.1 Percentile distribution of systolic blood pressure 45
4.3.2 Percentile distribution of diastolic blood pressure 47
4.3.3 Sensitivity analyses 50
4.4 Validation of the observed age effects
4.4.1 Study characteristics of GEMCAS and Heinz Nixdorf Recall 56
study subjects
4.4.2 Linear regression analyses 59
4.4.3 Five year differences of blood pressure values in Heinz Nixdorf 62
Recall subjects
4.4.4 Expected versus observed blood pressure readings in the Heinz 62
Nixdorf Recall Study
5 Discussion
5.1 Key findings 66
5.2 Age related changes in blood pressure 68
5.3 Percentile distribution of blood pressure 69
5.4 Sensitivity analyses 71
5.5 Validation of the effects of age 72
5.6 Strengths and limitations of the work 74
5.7 Conclusions 77
6 Summary 78
7 Literature 79
A Abbreviations 88
B Appendix: Tables 89
5Chapter 1
Introduction
1.1 Physiology of blood pressure
The cardiac events that occur from the beginning of one heartbeat to the
next one are called as cardiac cycle. It consists of systole, a phase in which heart
contracts to eject the blood. The systole is followed by a phase called as diastole
during which the heart tends to relax and fills itself up (Guyton and Hall 2006).
The circulatory system is categorised into „systemic circulation‟ which is
otherwise called as peripheral or greater circulation, it supplies to all the tissues of
the body except the lungs, which are supplied by the pulmonary circulation.
Arteries are the vessels that carry the blood away from the heart under high
pressure and therefore arterial walls are stronger, where the blood flow will be
rapid (Guyton and Hall 2006).
Blood pressure - definition
Blood pressure “means the force exerted by blood against any unit area of
the vessel wall” (Guyton & Hall 2006, p. 166), it is generally measured in
millimetres of mercury (mmHg) for example a 100 mmHg of blood pressure
means, the force exerted by this blood would be sufficient to push a column of
mercury up to a level of 100 mm. As the heart pumps the blood directly into the
aorta in a pulsatile manner, the arterial pressure in the aorta varies between 120
mmHg during the systole and 80 mmHg during a diastole. During the systemic
6Chapter 1. Introduction
circulation, the pressure of blood falls progressively, before the blood enters the
heart through venae cavae its pressure is 0 mmHg. In general the arterial pressure
is controlled by either local tissue perfusion control or control of cardiac output
(Guyton and Hall 2006).
Each blood vessel, be it an artery or a vein has the capability to distend, but
as the walls of arteries are stronger and less elastic, they distend less, and the
veins distend almost 8 times as much as the arteries. The distensibility of the
vessels serves as an important function, in which it allows the blood to flow
through the tissues in both cardiac systole and diastole (Guyton and Hall 2006).
Systolic and diastolic blood pressures
The blood pressure at the height of each pulse is called as the systolic
blood pressure (SBP). In a normal young adult its value is usually 120 mmHg. The
blood pressure at the lowest point of the pulse is called as diastolic blood pressure
(DBP) and in normal young adults it is about 80 mmHg. The difference between
SBP and DBP is called as pulse pressure (PP) (Guyton and Hall 2006,).
Regulation of Blood pressure
The flow of blood through the system is represented by the blood pressure,
and hence when the rate of blood flow is regulated, blood pressure will also be
regulated. The blood flow control to any tissue could happen in two ways,
a) acute control and b) long term control. Acute control is achieved as a
quick response to constriction of the arterioles and metarterioles. Long term
control occurs due to slow changes in the flow over a period of time due to the
tissue needs (Guyton and Hall 2006).
The autonomic nervous system (CNS) plays a crucial role in the regulation
of blood flow and thus helps in the short term regulation the blood pressure. The
7Chapter 1. Introduction
baroreceptors are extremely quick in buffering blood pressure changes (Hall JE.
1999). The most important nervous mechanisms by which arterial pressure is
controlled is the barorecptor reflex, this reflex is elicited by the baroreceptors
present on the walls of large arteries. In case of sudden increased pressure, the
baroreceptors are stretched and they transmit the signals to the central nervous
system, which replies through a „feedback‟ signal through the autonomous
nervous system leading to a fall in the arterial pressure (Guyton and Hall 2006).
Although nervous control of arterial pressure is one important mechanism to
control ischemia due to decreased blood flow, the CNS response to decreased
arterial pressure can only be observed in pressures that are below 60 mmHg, and
maximum CNS response can be elicited if the pressure falls to as low as 15-20
mmHg, during which perfusion to the brain might be minimal and close to being
lethal. If cerebral ischemia persists due to a low blood pressure, the neuronal cells
will suffer metabolically and within 3 to 10 minutes they might as well become
inactive, and when the ischemia still continues at the same rate, the neuronal cells
might die within 20 to 60 minutes (Guyton and Hall 2006).
Long term control of blood pressure is maintained using different
physiological mechanisms like the Renal-Body fluid feedback: The balance
between the intake and output of fluids in the body determines the extracellular
fluid volume and the extracellular fluid volume in turn maintains the blood
pressure. The renin-angiotensin-aldosterone system and the pressure natriuresis
mechanisms help in regulating the renal excretion of salt and water (Hall JE.
1999).
8Chapter 1. Introduction
Humoral regulation of the circulation is an important mechanism to regulate
blood flow with the help of substances released into the body, either from glands
or from local tissues. These substances are classified into
1. Vasoconstrictors – substances that constrict the blood vessels thereby
increase the blood pressure. Examples: Norepinephrine, epinephrine,
vasopressin, angiotensin and endothelin.
2. Vasodilators – substances that dilate the blood vessels, there by
decrease the blood pressure. Examples: Bradykinin, serotonin,
histamine and prostaglandins.
The central nervous system (CNS) also plays a crucial role in the regulation
of blood flow and thus regulates the blood pressure. The capabilities of the
nervous system for the control of arterial pressure are rapid and usually short
term. The most important nervous mechanisms by which arterial pressure is
controlled is the barorecptor reflex, this reflex is elicited by the baroreceptors
present on the walls of large arteries. In case of sudden increased pressure, the
baroreceptors are stretched and they transmit the signals to the central nervous
system, which replies through a „feedback‟ signal through the autonomous
nervous system leading to a fall in the arterial pressure (Guyton and Hall 2006).
1.2 Blood pressure and age
Changes in the cardiovascular function with aging was studied from as
early as 1809 and various theories have been put forward to explain the
physiological responses of cardiovascular system with aging (Nichols et al. 1985).
Increase in the systolic and diastolic blood pressure with age has been
consistently demonstrated by the results obtained from the well-known
9Chapter 1. Introduction
Framingham Heart Study and other studies (Rodriguez et al. 1994, Kannel 2000,
Vasan et al. 2001). The age-related rise of blood pressure has primarily been
studied and discussed with respect to hypertension and risk for cardiovascular
diseases (CVD). In a report by Franklin and Weber (1994) the „vascular overload‟
concept to assess the hypertensive cardiovascular risk was discussed. They
argued that hypertensive cardiovascular risk is related to three circulatory
abnormalities, increased arteriolar resistance, increased large artery stiffness, and
early reflection of pulse waves. These three mechanisms together were referred
as „vascular overload‟. Increased arteriolar resistance is associated with increased
systolic, diastolic and mean arterial pressures, even in the younger subjects.
According to Franklin and Weber (1994) with advancing age a rise in the arterial
stiffness occurs. Increased large artery stiffness is associated with increased
systolic pressure and also a simultaneous decrease in the diastolic pressure. An
inelastic or stiff aorta due to aging leads to a diminished reservoir effect at the end
of the cardiac systole, thereby it contributes to diminished diastolic pressure.
Young to middle aged hypertensive subjects have a combination of increased
arteriolar resistance and increased arterial stiffness which contributes to more rise
in systolic pressure compared to diastole with age. As the age advances there is a
large rise in the arterial stiffness and a varied arteriolar resistance, this contributes
to the isolated systolic or systolic and diastolic hypertension. Also aging and
hypertension lead to increase pulse wave velocity which in turn leads to early
pulse wave reflection. This increased arterial stiffness combined with early wave
reflection result in an increased systolic blood pressure and a decrease in diastolic
blood pressure, especially in the elderly subjects (Franklin and Weber 1994).
10Chapter 1. Introduction
Whelton (1994) found in most surveys, that SBP tends to rise progressively
throughout childhood, adolescence and adulthood to reach an average value of
140 mmHg. Although the DBP also rises with age, the rate is not as steep as for
the SBP. This leads to widening of pulse pressure and more common isolated
systolic pressure (Whelton 1994).
1.3 Impact of systolic and diastolic blood pressure on CVD
With regard to the prognostic and therapeutic importance of the SBP and
DBP for CVD a debate over many centuries has been carried out. For example,
researchers in the eighteenth and the early nineteenth centuries associated the
„increased arterial pulse tension‟ with hypertensive cardiac and renal sequelae like
„dropsy‟ and „nephritis‟. In 1874 Fred Mahomed noticed that in subjects with
albuminuria, high tension in the arterial system coexisted. In the 10 th edition of
Osler‟s classic medical textbook in 1925, normal BP was considered to be 120-
130 mmHg and 130-150 mmHg if the age is over 50 years. In 1927 Cecil‟s classic
American textbook of medicine stated that systolic pressures of over 250 mmHg
are quite common and emphasised the importance of diastolic pressure increases
for the diagnostic as well as prognostic purposes. The same text book in the sixth
edition in 1943 emphasised on the importance of mean arterial pressure along
with the diastolic pressure (Rutan et al. 1989).
Historically, elevated systolic blood pressure was always considered to be
an inevitable outcome that occurs due to arterial stiffening especially in the elderly.
When it comes to hypertension, its severity was defined previously with the level of
diastolic blood pressure until the Framingham Heart study that started in 1948.
The results of Framingham study repeatedly showed that systolic blood pressure
11Chapter 1. Introduction
was a better marker for cardiovascular disease than diastolic blood pressure
especially middle and older age subjects (Kannel 1999).
Prospective studies like the Chicago stroke study (Shekelle et al. 1974),
and a study by Rabkin and coworkers. (1978) also showed that a stronger
association of SBP than DBP was found for the risk of stroke (Shekelle et al. 1974,
Rabkin et al. 1978). Studies like the Western Collaborative Group Study and a
Canadian study showed that SBP was found to be a stronger predictor of CHD
than mean arterial pressure (MAP) and DBP especially in the subjects who were
under 50 years of age (Rosenman et al. 1976, Rabkin et al. 1978). Other
prospective studies like the Honolulu Heart Program and the Whitehall Study
showed that SBP was more strongly related to the CHD mortality than DBP (Yano
et al. 1983, Lichtenstein et al. 1985). A meta-analysis by Staessen et al. (2000)
found that a 10 mmHg rise in systolic hypertension is correlated with a 10%
increase in all fatal and nonfatal cardiovascular complications (Staessen et al.
2000). Another meta-analysis by He and Whelton (1999) showed that the
association between SBP and CHD, stroke and end-stage renal disease was
continuous, graded and independent. It also showed that the association of SBP
with these outcomes is stronger than that of DBP (He and Whelton 1999).
Interestingly a study that was conducted by Franklin et al. (2001), using the
Framingham data with the subjects free of CHD and aged between 20 and 79
years showed that, with increasing age, there was a gradual shift from DBP to
SBP and then to PP as predictors of CHD risk. In patients who were younger than
50 years of age, DBP was the strongest predictor for CHD. In the age group of 50
to 59 years all the three BP components (SBP, DBP and PP) were comparable
predictors of CHD and in subjects aged above 60 years, DBP was negatively
12Chapter 1. Introduction
related to CHD risk and PP became superior to SBP in CHD risk prediction
(Franklin et al. 2001).
Domanski et al. (2002) analysed the data from the Multiple Risk Factor
Intervention Trial (MRFIT) and compared the relationships of SBP, DBP and PP
separately and jointly, with cardiovascular disease related mortality in men. They
reported that CVD risk assessment was improved by considering both SBP and
DBP not SBP, DBP or PP independently (Domanski et al. 2002).
Franklin and co-workers (2009) showed from the Framingham data that,
combining PP with MAP and SBP with DBP produced models that were superior
to single blood pressure components for predicting CVD. They also concluded
that, combined SBP + DBP, and combined MAP + PP were equally predictive of
CVD risk (Franklin et al. 2009)
Although a great amount of research was carried out on blood pressure and
CVD risk, uncertainty still exists regarding the relative importance of various
components of blood pressure in predicting the CVD risk and controversy still
persists about which blood pressure component plays a superior role in predicting
CVD.
1.4 Blood pressure level and risk for cardiovascular disease
It is undisputedly established that hypertension is associated with CHD and
CVD. The nature of this relationship is well studied. As early as 1969 Kannel et al.
from the Framingham Heart Study assessed the relationship between blood
pressure and clinical manifestations of CHD with respect to age. They concluded
that risk of manifestations of CHD is related to both antecedent systolic and
diastolic blood pressure. The risk was also proportional to the level of blood
13Chapter 1. Introduction
pressure even at non hypertensive blood pressures levels. Elevated SBP even
after the age of 50 years showed a substantial increase in risk of CHD (Kannel et
al. 2009).
The relation between blood pressure and CHD manifestations has been
consistently proven in studies conducted on both sexes and in people with diverse
geographic, cultural and ethnic backgrounds (Whelton 1994). It was also well
proven that high blood pressure is a cardiovascular disease risk factor
independent of the other risk factors that are associated with CVD (Whelton 1994,
Kannel et al. 2009).
Although it is known that the risk of CVD increases with increasing blood
pressure there has always been a question about the threshold level of blood
pressure above which it is considered as abnormal for the individual. Thus there
has been always a need to classify the blood pressure with respect to the level of
risk so as to enable the physicians to set up therapeutic goals.
Vasan et al. (2001) investigated from the Framingham cohort study, the
association between blood pressure categories at baseline and incidence of
cardiovascular disease in Framingham study participants. They concluded that
high normal blood pressure (SBP of 130 to 139 mmHg or a DBP of 85 to 89
mmHg) is also associated with an increased risk of cardiovascular disease. Thus,
questioning the need to see, if lower high-normal pressure can reduce the risk of
CVD (Vasan et al. 2001). The Prospective Studies Collaboration, which had done
a meta-analysis with one million adults using 61 prospective studies, concluded
that, throughout the middle and old age blood pressure is strongly and directly
related to vascular mortality and without any evidence of a threshold down to at
least 115/75 mmHg (Lewington et al. 2002). Port et al. (2000) using the
14Chapter 1. Introduction
Framingham data challenged the concept that lower blood pressures imply lower
risk and using a cut off value of 140 mmHg for all adults. They concluded that,
there is an age-dependent and sex-dependent threshold for hypertension (Port et
al. 2000).
However, Kannel et al. (2003) in a review stated that, “there is an
overwhelming evidence of a continuous, graded influence of SBP on CVD
morbidity and mortality at all ages in both sexes. An optimal BP for avoiding CVD
isChapter 1. Introduction developing hypertension, when compared to the individuals with normal blood pressure (DBP
Chapter 1. Introduction

the arterial pressure, which is indicated by the obliteration of the arterial pulse. As

the pressure in the cuff is released gradually by deflating the cuff, the pressure at

which the arterial pulse waves produces sounds (Korotkoff sounds) that can be

heard using a stethoscope is noted this is the systolic blood pressure. As the

pressure in the artery drops down further the pulse wave sounds disappear, this

pressure is the diastolic blood pressure (Perloff et al. 1993).

       The size and dimensions of the bladder and cuff of the sphygmomanometer

are important in determining the correct values of blood pressure. The length and

width of the bladder and their ratio are important. Acceptable standards of the

width of the bladder are 40% of the arm circumference, and for the length of the

bladder are 80% of the arm circumference in adults.

       Automatic devices measure the blood pressure using oscillometric and

auscultatory techniques. The oscillomteric method detects the blood pressure

based on the oscillations on the lateral walls of the occluded artery. The

oscillations begin at the systolic blood pressure and reach the greatest amplitude

at the mean arterial pressure. The diastolic blood pressure is a derivative of SBP

and mean arterial pressure (Perloff et al. 1993).

       The auscultatory method does not yield exact results, but gives values

within 10% of those determined by direct measurement from the arteries (Guyton

and Hall 2006). The auscultatory technique using Korotkoff sounds gives slightly

lower systolic and slightly higher diastolic blood pressure values when compared

to intra-aterial measurements of blood pressure (Jones et al. 2003). The

oscillometric method is based on detecting the oscillations on the lateral walls of

an occluded artery as the pressure is deflated in the cuff. SBP measurement by

these devices is accurate but the DBP may not be. (Perloff et al. 1993)

                                                                                    17
Chapter 1. Introduction
Although practical, the indirect measurement of blood pressure has its own
problems of accuracy. According to Jones and co-workers (Jones et al. 2003) the
indirect measurement has accuracy problems for at least 3 reasons:
1. Inherent biological variability
2. The white coat effect
3. Inaccuracies due to suboptimal technique.
1.7 Secular trends of blood pressure
1.7.1 Global trends
Blood pressure as risk factor for CVD was always well studied. However the
lion's share of research considers blood pressure in terms of hypertension,
assessing prevalence, treatment and control of hypertension in diverse
populations.
Studies from different parts of the world examined trends of high blood
pressure prevalences. Most studies from the U.S. used data from the different
National Health and Nutrition Examination Surveys (NHANES) to examine the
trends in the prevalence of hypertension. Burt et al. (1995) described the secular
trends of the distribution of blood pressure and prevalence of hypertension in the
US adults, using NHANES data from 1960 to 1991. They concluded that
“hypertension prevalence in the United States has declined progressively since
1971 and the distributions of systolic and diastolic pressures have shifted
downward during the approximately 30-year period between 1960-1962 and 1988-
1991” (Burt et al. 1995, p. 60). Hajjar and Kotchen (2003) also using the NHANES
data described the trends of hypertension prevalence in the US between 1988 and
2000. Contrary to the previous findings, they observed that hypertension
18Chapter 1. Introduction
prevalence has increased in the US between 1988 and 2000 (Hajjar and Kotchen
2003).
Hypertension prevalence and secular trends have been extensively studied
in the European populations, too. Banegas et al. (1998) studied the distribution of
blood pressure among the Spanish population and found that 50% of Spaniards
aged between 35 and 64 years were hypertensive and 10% had either isolated
systolic or isolated diastolic hypertension (Banegas et al. 1998). Asmar et al.
(2001) assessed the prevalences of high blood pressure by using the data of
61,108 French subjects and found that more than a third of men and nearly a
quarter of women had high blood pressure (Asmar et al. 2001).
1.7.2 Trends in Germany
There are a number of studies determining the blood pressure in the
German population. All of them examined blood pressure readings as a risk factor
for CVD, focussing their work on the assessment of the prevalence, treatment and
control of hypertension in the German population. None of the German studies
reported the distribution of the blood pressure readings.
Hense (2000) examined the trends in the prevalence of hypertension in
KORA, a population based study conducted in Augsburg in southern Germany. He
concluded that between 1984 and 1994 the prevalence of hypertension in the
Augsburg population was relatively constant (Hense 2000). Gasse et al. (2001)
analysed blood pressure data from the same study and concluded that the age
adjusted prevalence of hypertension between 25 and 64 year old subjects did not
change significantly, with 39% of men and 25% of women found to be
hypertensive (Gasse et al. 2001).
19Chapter 1. Introduction
The German National Health Interview and Examination survey 1998 (BGS)
reported that hypertension was prevalent in nearly 30% men and 27% women.
The prevalence of hypertension was higher in eastern Germany when compared
to the West. When compared to the health surveys conducted in 1991, the
hypertension prevalence increased in western Germany, where as it decreased in
the east. Just like the findings from other studies in the world, the blood pressure
data in the BGS also showed that there is a continuous increase in the SBP with
age in both sexes (Thamm 1999).
20Chapter 2
Aim and Study Questions
As blood pressure is a continuously distributed feature, prevalence
estimates are mostly presented as arithmetic means and dispersion around the
mean (range, standard deviation). Only a few single estimates are thus necessary
to obtain an overview of the central location of the data and to achieve good
predictors of the frequency with which a population will be detected as
hypertensive.
Nevertheless, epidemiological information throughout the full range of a
distribution within populations (i.e. percentiles and subgroups age groups) may
prove helpful in obtaining a more detailed picture of blood pressure distributions.
For example, it would be interesting to know whether the full range of the blood
pressure distribution differs between the age classes, i.e. with greater differences
in the blood pressure range in older age groups compared to the younger ones.
Furthermore, it would be interesting to know whether the age-related increase in
blood pressure occurs in each part of the distribution, i.e. even in the lowest
percentile.
As discussed above, even though there were some studies focussing on
the blood pressure in the populations, only few studies worldwide and none in
Germany examined the percentile distribution of the blood pressure population-
wide. Even more, as to my knowledge, there is no publication evaluating blood
pressure readings taking into account age, sex and coexisting cardiovascular risk
factors.
21Chapter 2. Aim and Study Questions
Main aim of this thesis was to examine the distribution of blood pressure
readings in the German population using data from a large cross sectional study
sample of 35,869 women and men aged 18-99 years. In a first analysis step
following research questions will be addressed
Part 1:
How are the percentiles of the systolic and diastolic blood pressure
distributed in the German population?
How are the blood pressure percentiles distributed with respect to age-
classes and sex?
Do the percentile distributions of the systolic and diastolic blood
pressure observed in the whole study sample differ in a subpopulation
without known cardiovascular risk factors?
Part 2:
In a second step, the observed age effects on blood pressure readings in
the cross sectional and patient-based GEMCAS study will be reproduced in an
independent study sample, the prospective and population-based Heinz Nixdorf
Recall study to answer following question:
Is the magnitude of the age related effects on blood pressure observed
in the cross-sectional GECMAS study sample, comparable to that of an
independent study sample of a prospective cohort study?
To answer the study questions, data from the German Metabolic and
Cardiovascular Risk Study (GEMCAS) and Heinz Nixdorf Recall study were used.
GEMCAS offers an excellent data set including a broad age range of 18 to 99
years and a very large sample size that provides sufficient precision even when
stratifying the sample into small age groups, sex or presence or absence of CVD
22Chapter 2. Aim and Study Questions
risk factors. The Heinz Nixdorf Recall study as a prospective, population-based
cohort study offers an excellent data base to enable verification of the age effects
observed in GEMCAS.
23Chapter 3
Material and Methods
3.1 GEMCAS
3.1.1 Study design and participant recruitment
GEMCAS is a cross sectional study conducted in October 2005 for two
weeks at 1,511 randomly selected primary care physicians from all over Germany.
General practitioners and internists with focus on primary health care were
selected by a stratified, randomized sampling method to receive a random
distribution across all German regions. Physicians specialized in cardiology and/or
diabetes were excluded from the study.
All the subjects who were aged 18 years and above visiting the selected
primary care physicians during the days on which the study was conducted,
irrespective of the reason for their visit were included in the study. The only
reasons for exclusion were conditions that made it impossible or highly
problematic for the patient to participate (such as poor German language skills,
serious disabilities or diseases), acute emergencies, or pregnancies and breast-
feeding within the previous three months.
Ethical approval was granted from the ethics committee of the University
Hospital, University Duisburg-Essen, Essen, Germany (Moebus et al. 2006).
3.1.2 Data collection
Data were collected through two types of questionnaires. The medical
questionnaire was completed by the participating physician or his/ her assistant. It
24Chapter 3. Material and Methods
furnished all the details about age, reason for attendance, anthropometric
measurements, pre-existing clinical conditions, medication intake etc. The patient
questionnaire had the relevant information about age, medical history, family
anamnesis, lifestyle related and socio-demographic variables used in the study
Venous blood samples were collected from all the study subjects and shipped to
the central laboratory in Berlin (Labor 28, Berlin, Germany) by an assigned courier
service. The samples were analyzed for blood glucose levels, total cholesterol,
HDL, LDL, and Triglycerides (Moebus et al. 2006).
3.1.3 Blood pressure measurements
Blood pressure was measured using commonly available equipment in the
physician‟s practice. The blood pressure devices used (manual, automatic, brand
name) were reported by the physicians. The readings for blood pressure were
obtained after a five minute rest with the participant in a sitting position. Accepted
epidemiological standards for blood pressure measurements such as a double
measurement with at least two minutes of recovery between measurements (i.e.
Guidelines for the management of arterial hypertension: The Task Force for the
Management of Arterial Hypertension of the European Society of Hypertension
(ESH) and of the European Society of Cardiology (ESC) 2007) were not feasible.
However, reported measurements here represent physician practices procedures.
3.1.4 Data Quality assurance
The study was planned and conducted according to the German guidelines
for Good Epidemiology Practices (GEP) (Hoffmann et al. 2005). The participating
25Chapter 3. Material and Methods
physicians received no other instructions than the information material that was
sent to them. A special monitoring system was designed to minimize systematic
errors. The monitoring was done in two ways, telephonic and random on-site
visits. Telephone monitoring was done at 50% of the enrolled practices prior to the
day of survey to make sure that the participating physicians had correct knowledge
of the operation procedures and also had all the relevant material needed for the
study in the form of questionnaires, other documents and blood sampling
materials. Physicians to be included in the monitoring were selected randomly and
stratified into three groups. The interviewers rated the monitored site based on
standardized interview. Their performance was rated on a scale ranging from one
to six, with six being the worst rating. Furthermore, in about 10% of the
participating medical practices random on-site visits were performed during the
day of survey. These practices were chosen at random prior to the survey.
Additionally, a special emphasis was laid on sites that received a poor rating
during the telephonic monitoring and where ever possible these practices were
included in the list for the on-site monitoring during the survey day (Moebus et al.
2006).
3.2 Heinz Nixdorf Recall study
3.2.1 Study design and aims
The Heinz Nixdorf Recall (Risk Factors, Evaluation of Coronary Calcium
and Lifestyle) study, henceforth abbreviated as HNR, is a German population-
based prospective cohort study that started in 2000 in the metropolitan Ruhr
region including the cities Bochum, Essen and Mülheim/R. Main aims of the HNR
study are to study the extent of subclinical coronary atherosclerosis to predict the
26Chapter 3. Material and Methods
risk of myocardial infarction in the general population and to define appropriate
methods for identifying high-risk subgroups in the general urban population
(Schmermund et al. 2002).
3.2.2 Participant recruitment
A detailed description of the recruitment of the participant was discussed in
detail by Stang et al. (2005). Briefly, for the baseline examination study
participants were randomly selected from the mandatory registries of residence
from the three cities included in the study between December 2000 and August
2003. About 9,484 subjects were invited to participate in the study. A multimode
contact approach including an invitational letter, a maximum of two reminder
letters and phone calls were used for the recruitment of study subjects (Stang et
al. 2005). As the study was aimed at general population very few exclusion criteria
were applied to the study: inability or unwillingness to give an informed consent to
participate in the study, conditions (medical or other) that preclude follow-up for
five years, severe psychiatric disorders or illegal substance abuse and pregnancy
(Schmermund et al. 2002).
Overall 4,814 eligible subjects of both sexes, aging 45-75 years could be
examined, corresponding to a baseline response of 56%. All participants had
provided the informed consent for the study and the study was approved by the
local institutional ethics committees. The study also comprised extended quality
management procedures and was certified according to DIN ISO 9001:2000.
The follow up has been conducted for a median of 5 years (mean 5.1 ± 0.3
years). Participants have been annually contacted by a mailed questionnaire.
Between May 2006 and July 2008 a second medical examination was conducted
27Chapter 3. Material and Methods
in the fifth year of follow up, including 4,157 subjects corresponding to a follow up
response of 90.2% (Erbel et al. 2010).
3.2.3 Blood pressure measurements
Blood pressure was recorded using an automated oscillometric blood
pressure device (AOD) (Omron HEM-705CP; OMRON Corporation, Hoofdorp, the
Netherlands) The AOD displayed blood pressure to the nearest 1 mmHg. Study
personnel were certified and regularly trained in measuring blood pressure
according to the standards of the World Health Organization (WHO) MONICA
blood pressure recording protocol (Stang et al. 2005).
Blood pressure was recorded three times for each subject with a three
minute interval in between the measurements. The blood pressure was recorded
during a computer assisted personal interview that was automatically interrupted
for blood pressure recording. This ensured that subjects had a rest for at least five
minutes before their first blood pressure was measured. The first measurement
was disregarded as it is typically systematically higher than subsequently serial
measurements. Mean SBP and DBP were calculated from the second and third
measurements (Stang et al. 2005).
3.2.4 Risk factor assessment
Behavioural risk factors like smoking, nutrition and physical activity, medical
family history concerning ischemic heart disease, intake of any medications, and
information about socio-demographic variables was obtained using questionnaires
and computer assisted interviews. Laboratory parameters have been conducted
28Chapter 3. Material and Methods
immediately at the central laboratory at the University Hospital of Essen
(Schmermund et al. 2002).
3.3 Diagnostic conventions
Following diagnostic conventions have been used in all analyses of this
thesis.
Body mass index (BMI): The subjects were classified as normal with
a BMI between 18 and 24.99 kg/m2, overweight 25 and 29.99 kg/m2,
obese 30 kg/m2 or more.
Smoking status was defined as never smokers, past smokers (quit of
smoking and time since quitting), and current smokers (actual
smoking of either cigarettes or other forms of tobacco).
CVD in GEMCAS was defined as a history of cardiovascular disease
reported by the physician, including myocardial infarction or acute
coronary syndrome.
CAD in HNR was defined by self-reports of previous myocardial
infarction.
Diabetes In GEMCAS was defined when the subject had any one of
the following: a self-reported history of type 1 or type 2 diabetes or a
reported history of type1 or type 2 diabetes by a physician, intake of
insulin or oral anti-diabetic medications. In the HNR subjects it was
defined when the subjects reported a history of the diagnosis or
intake of glucose lowering drugs.
29Chapter 3. Material and Methods
3.4 Statistical Analyses
Of the 35,869 study participants included in GEMCAS, 186 with missing
data for blood pressure readings were excluded for the present analysis, leaving a
study sample of 35,683 (mean age 51.7±16.1 years, 61.2% women).
Means and their standard deviation and percentiles (5th, 25th, median, 75th
and 95th) of SBP and DBP were computed, each stratified by age-groups and sex.
In sensitivity analyses the percentile distribution of blood pressure in
“healthy” subjects were studied by excluding (n=24,399) subjects with the following
cardiovascular risk factors and diseases: elevated waist circumference (>102 cm
in men, >88 cm in women), elevated triglycerides (≥1.7 mmol/L (150 mg/dl)), low
high density lipoprotein(HDL) (Chapter 3. Material and Methods
Jahrbuch für die Bundesrepublik 2006) has been computed for all variables. For
this purpose, in a first step the GEMCAS sample was stratified into 5 year age
classes (18-30, 31-45, 46-60, 60-75 and >76 years). For all variables means
respective frequencies were computed according to these 5 year age-groups. In a
second step the age specific rates were (1) multiplied with the proportion of people
in the respective age groups in the 2004 standard German population to compute
the expected age specific rates in GEMCAS and (2) summed up to get the directly
standardized rates. Additionally, 95% confidence intervals (95% CI) for the
standardized rates were computed by calculating the variance of the standardized
rate/mean and subsequently using the 97.5% quantile of a standard normal
distribution to determine the lower and upper confidence bound.
The characteristics of the GEMCAS study sample were compared to the
characteristics of the Heinz Nixdorf Recall study population. To make both the
studies comparable with respect to age, this analysis included only the GEMCAS
subjects who were aged between 45-75 years.
Age and sex specific frequency distribution curves were used to present the
blood pressure data for the GEMCAS subjects.
The age effects on blood pressure observed in the cross sectional
GEMCAS sample (restricted to the age group 45 to 75 years) were validated with
the data of the prospective study of HNR by applying the observed age-effect in
GEMCAS (by calculating estimators for the age effect) on baseline blood pressure
data in HNR by computing expected blood pressure readings with the GEMCAS
estimators and comparing these with the measured blood pressure readings in the
5 year follow up. This has been done for men and women separately as follows:
(a) Comparison of the 5 year and yearly changes of blood pressure readings
31Chapter 3. Material and Methods
(1) For the HNR sample the 5 year cumulative changes of blood pressure
readings were calculated by subtracting the individual 5 years follow up
(t1) with the baseline (t0) readings as follows:
ΔSBP = SBPt1– SBPt0
ΔDBP = DBPt1 – DBPt0
Means of ΔSBP and ΔDBP were computed to estimate the cumulative 5
years mean changes in blood pressure (after 5 years of follow-up).
(2) To obtain the mean yearly changes, the means of ΔSBP and ΔDBP were
divided by five.
ΔSBP = SBPt1– SBPt0 / 5
ΔDBP = DBPt1 – DBPt0 / 5
(b) Observed versus expected blood pressure readings in HNR
(1) Effect estimators (ßs) for age on the systolic and diastolic blood pressure
in GEMCAS have been computed by crude and multiple linear regression
analyses, with age as the predictor and SBP or DBP as the outcome
(Table 1). The analysis was done for the whole GEMCAS sample and
separately for the subjects who were aged between 45 and 75 years to
match with the age group of the HNR subjects. In order to perform an
adjusted linear regression analyses following variables have been
preselected as covariates: intake of antihypertensive medication, history
of CVD, diabetes mellitus, intake of anti-diabetic medication, BMI, and
smoking status.
32Chapter 3. Material and Methods
Table 1: Linear regression models
Variable Crude model Adjusted model
Dependent SBP/DBP SBP/DBP (mmHg)
(mmHg)
Independent Age in years Age in years
Covariates CVD history (yes/no)
Antihypertensive intake (yes/no)
Diabetes (yes/no)
Diabetic medication intake (yes/no)
BMI in kg/m2
Smoking (never/past/current smokers)
reference: never smokers
The linear regression model has been computed as follows
Crude model: y = ß0 + ßage + Ɛ
Fully adjusted model:
y= ß0+ ßage+ ßCVD+ ßantihypertensives+ ßdiabetes+ ßanti-diabetic intake+ ßBMI + ßsmoking
+Ɛ
Where y denotes the dependent variable (outcome) SBP respective
DBP, ß0 the regression coefficient of the intercept, ßage the regression
coefficient of the independent variable age (predictor), ßcovariate2-6 the
regression coefficients of the covariates described in table 1 and Ɛ the
error term.
(2) The crude ßage achieved as described in (1) for both men and women,
aged 45-75 years, were subsequently applied in the HNR sample to
estimate expected blood pressure readings after five years. The ßage
values were multiplied by 5 to get an estimated five year increase and
added to the observed SBP or DBP readings at baseline. Observed
33Chapter 3. Material and Methods
blood pressure readings are those measured for each HNR subject at
baseline (t0) and 5 year follow up (t1):
SBPexpected after 5 years = Observed SBPt0 + (5 x ßage)
DBPexpected after 5 years = Observed DBPt0 + (5 x ßage)
As the data were skewed and thus not perfectly normally distributed, the Wilcoxon
signed rank test - a nonparametric test - was performed to assess whether the
median ranks of expected and observed SBP/ DBP differed. The two sided
significance level α has been set at 0.05, assuming differences with a p-value <
0.05 as significant.
However, the significance testing of these differences were the only
statistical significance tests computing p-values in this work. Since it is well known
that significance tests are sample size driven, even in sub-group analysis the tests
of significance will be mostly positive in the GEMCAS study. Instead, 95%
confidence intervals were reported to indicate the reliability of an estimate
wherever appropriate. Additionally, the work was intended to present the
distribution of blood pressure in a purely descriptive form.
Since the effects of age and other covariates differed between men and
women substantially, all analyses were done separately for men and women.
All analyses have been carried out using SAS 9.2 version (SAS Institute,
Cary, NC, USA).
34Chapter 4
Results
4.1 Study characteristics of the GEMCAS subjects
The characteristics of GEMCAS participants according to 10-year age-
classes are presented for men in Table 2 and for women in Table 3. GEMCAS
included 35,869 subjects, 13,942 men (39%). As expected the prevalence of most
risk factors increased with age. However, in both the sexes this increase can be
observed only up to the age of 70 years and thereafter the risk factors showed a
decreasing trend. Exceptions from this observation are the trend of SBP and blood
glucose levels, which showed a continuous increase even up to the oldest age
group (81-99 years) and smoking status, which decreases with increasing age.
More than 60% of men and women aged >60 years were on antihypertensive
therapy. At least 40% of men and women aged >70 years had a history of
cardiovascular disease.
The characteristics of the GEMCAS participants according to the JNC 7
blood pressure classes are presented in Table 1 for men and Table 2 for women
(Appendix B). Overall, the risk factors except current smoking status showed an
increasing prevalence with increasing blood pressure. Age-standardization of the
prevalence data also did not change this observation (Table 1 and 2, Appendix B)
4.2 Frequency distribution and mean blood pressure
Figures 1 and 2 depict the frequency distribution curves of the systolic and
diastolic blood pressure readings stratified by 10-year age groups in men and
35Chapter 4. Results
women respectively. Overall the absolute range of the diastolic readings is smaller
than the range of the systolic readings. With increasing age, the curves of the
systolic blood pressure show a flattening and a shift to the right, equating to higher
blood pressure readings (figure 1). The shift to the right was more pronounced in
women compared to men. In contrast, the diastolic blood pressure curves show
only minimal changes by age in both sexes (figure 2).
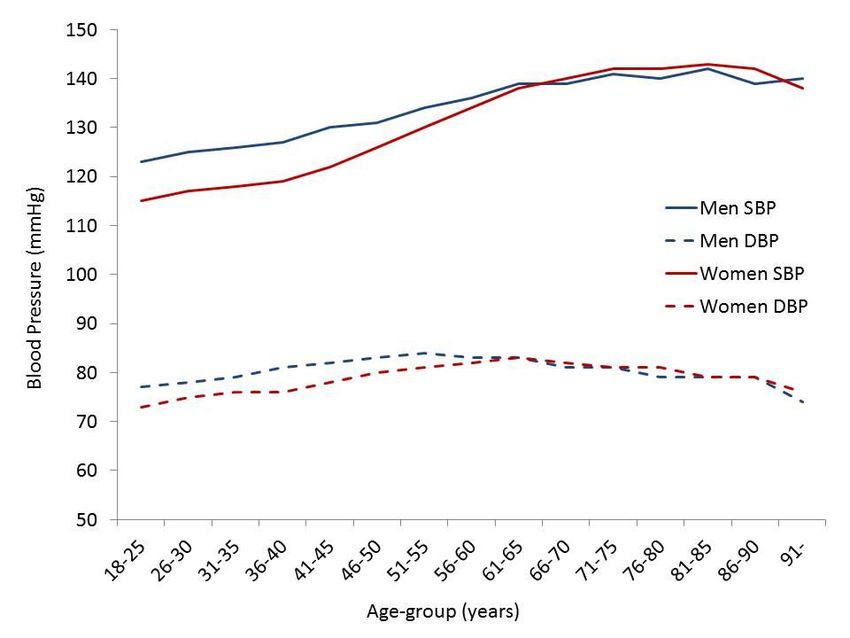
The mean BP across different age groups can be seen in the Figure 3. In
both sexes the mean SBP and DBP showed a gradual increase with age
especially up to 60 years, there after it remained almost constant. Men showed
higher mean SBP values than women in the younger and middle age, however in
the age group of 61-65 years there was a cross over in the mean SBP curves
between men and women. The DBP mean values also showed an increase just
similar to SBP in both men and women, reaching maximum values of 84 mmHg in
men 50-55 years and 83 mmHg in women who were aged n 61-65 years. In
contrast to SBP the mean DBP values showed a sharp decline in the older age
groups in both sexes (figure 3).
36Chapter 4. Results
Table 2: Characteristics of men in GEMCAS according to 10-year age classes
18-30 years 31-40 years 41-50 years 51-60 years 61-70 years 71-80 years 81-99 years
(N=1,354) (N=1,736) (N=2,847) (N=3,249) (N=2,729) (N=1,706) (N=320)
Age (years)
Mean (±SD) 24.4±3.7 36.1±2.8 45.6±2.8 55.5±2.7 65.8±2.7 74.7±2.7 83.7±3.0
Weight (Kg)
Mean (±SD) 80.6±15.1 86.9±15.4 88.4±16.0 88.4±14.9 86.6±13.4 82.8±12.3 77.8±11.6
BMI (%)
2
18-Chapter 4. Results
Table 2 (cont.): Characteristics of men in GEMCAS according to 10 year age classes
Risk Factor 18-30 years 31-40 years 41-50 years 51-60 years 61-70 years 71-80 years 81-99 years
(N=1,354) (N=1,736) (N=2,847) (N=3,249) (N=2,729) (N=1,706) (N=320)
Smoking status (%)
Current Smoker 49.3 39.0 37.8 26.6 13.4 9.3 4.5
Past Smoker 13.0 23.4 32.3 44.7 52.4 56.5 63.1
Never Smoker 37.7 37.6 29.9 28.7 34.2 34.2 32.4
Pharmacotherapy (%)
Anti-diabetic 1.1 2.4 6.4 15.1 20.0 20.1 18.8
Antihypertensive 4.4 11.1 25.1 47.0 65.5 75.0 80.6
Lipid lowering 0.6 3.7 10.2 21.7 31.6 29.3 29.4
Comorbidities (%)
Cardiovascular diseases 1.0 2.2 8.2 21.1 36.0 50.3 63.9
Diabetes (Self reported) 0.8 3.0 8.6 20.3 26.1 27.5 26.2
38Chapter 4. Results
Table 3: Characteristics of women in GEMCAS according to 10 year age classes
Risk Factor 18-30 years 31-40 years 41-50 years 51-60 years 61-70 years 71-80 years 81-99 years
(N=2,641) (N=3,330) (N=4,969) (N=4,677) (N=3,422) (N=2,257) (N=630)
Age (years)
Mean (±SD) 24.1±3.7 36.2±2.8 45.4±2.9 55.3±2.8 65.7±2.8 75.0±2.8 83.9±3.1
Weight (Kg)
Mean (±SD) 66.9±15.6 70.6±16.1 71.6±15.8 74.4±15.6 74.9±13.7 72.7±12.5 70.0±11.4
BMI (%)
2
≤ 25 kg/m 71.9 60.3 52.7 37.2 28.9 27.7 42.5
2
25 - < 30 kg/m 16.7 23.2 27.1 33.7 39.9 41.4 39.6
2
≥ 30 kg/m 11.4 16.5 20.2 29.2 31.2 30.9 17.9
Waist circumference (cm)
Mean (± SD) 77.7±12.7 82.0±13.4 84.9±13.9 89.8±14.3 92.5±13.0 93.1±11.9 89.7±11.3
Lipid Profile
Total Cholesterol (mg/dl)
Mean( ± SD) 182.9±34.1 188.0±33.1 205.4±36.6 222.9±39.9 225.8±41.0 219.7±40.4 218.9±42.2
HDL (mg/dl)
Mean( ± SD) 66.8±16.6 66.7±16.7 67.7±17.3 68.5±18.0 67.3±17.2 65.1±16.6 66.2±17.6
LDL (mg/dl)
Mean (± SD) 105.8±30.4 111.3±29.8 125.1±34.1 138.6±36.7 141.7±36.5 136.9±36.9 136.0±37.0
Triglycerides (mg/dl)
Median (Q1; Q3) 95(70;131) 93(68;133) 104(74;150) 124(89;180) 136(100;192) 139(104;193) 135(102;176)
Blood Pressure (BP)
Systolic BP (mmHg)
Mean (± SD) 115.5±13.2 118.4±14.5 124.2±16.7 131.9±18.1 138.7±18.7 141.6±19.6 142.2±20.3
Diastolic BP (mmHg)
Mean (± SD) 73.6±9.5 76.1±10.0 79.0±10.5 81.3±10.3 82.4±10.1 81.2±10.7 79.2±10.7
Blood glucose (mg/dl)
Mean (± SD) 82.5±13.2 85.7±15.2 90.7±22.7 97.8±30.8 102.6±32.6 107.8±39.1 112.0±41.6
39Chapter 4. Results
Table 3 (cont.): Characteristics of women in GEMCAS according to 10 year age classes
Risk Factor 18-30 years 31-40 years 41-50 years 51-60 years 61-70 years 71-80 years 81-99 years
(N=2,641) (N=3,330) (N=4,969) (N=4,677) (N=3,422) (N=2,257) (N=630)
Smoking status (%)
Current Smoker 41.0 31.2 31.3 21.6 8.7 5.0 2.2
Past Smoker 14.9 20.5 26.4 25.6 22.7 19.2 15.4
Never Smoker 44.1 48.3 42.3 52.8 68.6 75.8 82.4
Pharmacotherapy (%)
Anti-diabetic 0.5 1.2 2.7 7.4 13.6 18.0 19.7
Antihypertensive 3.1 7.5 19.8 40.1 60.7 77.0 79.4
Lipid lowering 0.4 1.0 3.3 11.6 23.0 28.1 20.3
Comorbidities (%)
Cardiovascular diseases 0.7 1.8 3.7 9.1 20.3 39.7 51.9
Diabetes (Self reported) 0.6 2.0 4.2 10.9 18.3 25.9 26.6
40Chapter 4. Results
Figure 1: Frequency distribution of systolic blood pressure by sex
The bars on top of each graph indicate the proportion of subjects of the total sample
41Chapter 4. Results
42Chapter 4. Results
Figure 2: Frequency distribution of diastolic blood pressure by sex
The bars on top of each graph indicate the proportion of subjects of the total sample
43Chapter 4. Results
44Chapter 4. Results
Figure 3: Mean systolic and diastolic blood pressures by age-groups and
sex, whole study sample
4.3 Percentile blood pressure distribution
4.3.1 Percentile distribution of systolic blood pressure
The percentile distribution of SBP is depicted in Figure 4. Since the
distribution differed between women and men, the distribution for women and men
are separately presented here (figure 4). The illustration of the overall distribution
– thus not only the mean – can be viewed from two perspectives: (1) possible
differences of the blood pressure range between age categories, and (2) course of
an age-related increase in blood pressure in each part of the distribution.
45Chapter 4. Results
(1) The range of systolic blood pressure does not proceed in parallel
between the percentile bands; instead, the spread between the 5 th and the 95th
percentile increases with increasing age: the systolic blood pressure of the
youngest women aged 18-25 ranges between 95-136 mmHg (Δ +41 mmHg) and
rises to 110-180 mmHg (Δ +70 mmHg) in the older women (81-85 years). Overall,
the ratio between the lowest 5th and highest 95th percentile ranges between 1.43
and 1.64 (figure 4). A similar observation can be made in men, with blood pressure
readings ranging between 100-150mmHg in the youngest men and 115-180
mmHg in the older age group (figure 4), and ratios ranging between 1.50 in
younger (18-25 years) and 1.57 in older men (81-85 years).
(2) What seems striking is that in all percentiles, even the lowest, a gradual
increase in blood pressure with increasing age was observed (figure 4). It could be
observed from the graph that, all the SBP percentiles showed a shift in their values
as the age advanced especially until the 65th year or so. From the age of 66, the
shifts in the SBP percentiles were minimal in the successive age groups. In
women, the difference in the lowest 5th percentile between younger and older
women was around +15mmHg (95–110mmHg) and between 20-32 mmHg in the
25th and 75th percentile, rising to +40 mmHg in the 95th percentile (136-180
mmHg). A similar observation can be made in men, in this case with a more
constant increase of +20 mmHg in all percentiles with the exception of young men
(+10 mmHg for 5th percentile). Although women had lower SBP values in the
younger ages when compared to men, after the age-class 55-60 years the SBP
percentiles in both sexes were almost similar.
Lastly, half of all the women in our study sample had by the age of 30
already had to be classified according to their systolic blood pressure at least as
46Chapter 4. Results
prehypertensive according to JNC VII classification of blood pressure (Chobanian
2003). In men this situation is even more pronounced, with all men, even the
youngest age group, having to be classified at least as prehypertensive. In men
and women who were over the age class of 66-70 years, half of them had a
systolic blood pressure in the hypertensive range.
4.3.2 Percentile distribution of diastolic blood pressure
The percentile distribution of SBP is depicted in Figure 5. When compared
to the systolic blood pressure, a different picture emerges with regard to the
diastolic blood pressure distribution. Overall, in both women and men a slight
increase in the diastolic blood pressure can be observed, reaching a plateau
between 40 and 60 years and decreasing slightly thereafter (figure 5). However, a
detailed analysis of the age course of the different percentiles reveals some
notable differences. For instance, in women in the lowest 5th percentile of the
blood pressure readings we observed a constant blood pressure of 60 mmHg up
to the age of 50 (figure 5). An increase in this percentile of the diastolic blood
pressure by 10 mmHg only occurred within a 15-year period (51-65 years).
Thereafter, the 5th percentile of diastolic blood pressure decreased again within 10
years to 60 mmHg. A similar course was observed in the 25 th percentile. All other
percentiles differ in their course by an earlier increase, a more prolonged plateau
and a marginal decrease, if any, in the highest age groups. It is striking that the
median changed only up to the age of 41-45 years and remained constant at 80
mmHg after that time. This is even more striking in men, where in any age group
the median blood pressure was 80 mmHg (figure 5).
47You can also read