A review of recent trends in mortality
in England
←
→
Page content transcription
If your browser does not render page correctly, please read the page content below
A review of recent trends in mortality in England
A review of recent trends in mortality in England

About Public Health England
Public Health England exists to protect and improve the nation’s health and wellbeing,
and reduce health inequalities. We do this through world-leading science, research,
knowledge and intelligence, advocacy, partnerships and the delivery of specialist public
health services. We are an executive agency of the Department of Health and Social
Care, and a distinct delivery organisation with operational autonomy. We provide
government, local government, the NHS, Parliament, industry and the public with
evidence-based professional, scientific and delivery expertise and support.

Public Health England
Wellington House
133-155 Waterloo Road
London SE1 8UG
Tel: 020 7654 8000
www.gov.uk/phe
Twitter: @PHE_uk
Facebook: www.facebook.com/PublicHealthEngland

© Crown copyright 2018
You may re-use this information (excluding logos) free of charge in any format or
medium, under the terms of the Open Government Licence v3.0. To view this licence,
visit OGL. Where we have identified any third party copyright information you will need
to obtain permission from the copyright holders concerned.

Published December 2018
PHE publications                                    PHE supports the UN
gateway number: GW-686                              Sustainable Development Goals

                                                    2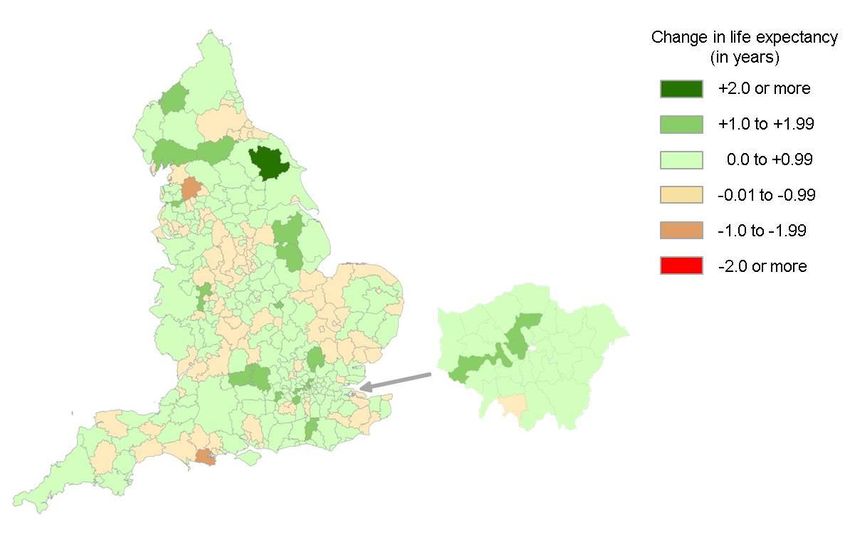
A review of recent trends in mortality in England

Contents
Executive summary                                                                        4
Introduction                                                                             10
Section 1: Trends in the number of deaths                                                12
Section 2: Trends in mortality rates and life expectancy                                 15
Section 3: Detailed breakdowns of mortality rates and life expectancy                    20
Section 4: International comparisons                                                     41
Section 5: Potential explanatory factors                                                 46
Section 6: Summary, conclusions and further work                                         72
Section 7: Definitions                                                                   74
References                                                                               79
Acknowledgements                                                                         86

Corrections

A revision was made to this report in August 2019 to correct a statement on p56
regarding the number of people aged 75+ who died in 2014 and 2015, and were
admitted to hospital as an emergency in the week before death, or died in hospital from
an emergency admission.

This represents 45% of all deaths among people aged 75 and over in England and not
just over 75% as reported in the original version of the report.

The titles of Figures 5H and 5I have also been amended to clarify that they are based
on deaths in hospital following an emergency admission.

The title of Figure 5I has also been corrected as the analysis presented is solely for
2015, rather than 2014-15 as originally stated.

                                                    3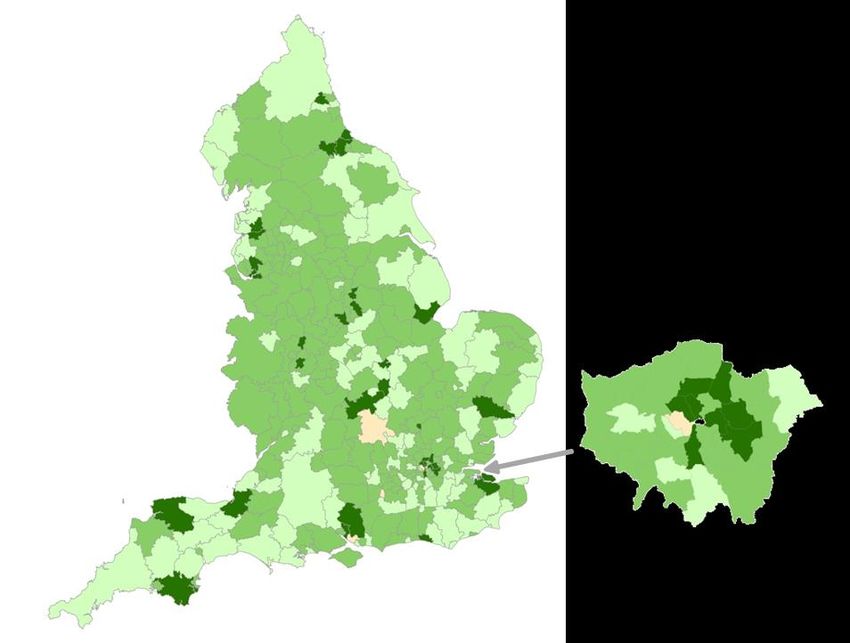
A review of recent trends in mortality in England

Executive summary
Introduction

Public Health England (PHE) was commissioned by the Department of Health and
Social Care (DHSC) to review trends in life expectancy and mortality in England. This
report summarises the findings from the commission and makes suggestions for further
work that could be undertaken, by PHE or others.

The aims were to review official data to develop understanding of the trends in life
expectancy and mortality in England, to provide further detail on specific population
groups and causes of death, and to determine whether this provides insight into
possible explanations for the trends seen. The terms of reference are provided in
Appendix 1.

Main findings

After decades of progress, since 2011 improvement in age-standardised mortality rates
and life expectancy has slowed down considerably, for both males and females. For
some age groups, and for some parts of England, improvement has stopped
altogether.

Inequality in life expectancy has widened, and since 2010-12 improvement in life
expectancy has been slower in the more deprived areas than the less deprived areas
of England. In addition, female life expectancy in the most deprived decile areas has
actually decreased. Therefore, the causes of the slowdown in improvement are having
the greatest impact in the more deprived areas.

This slowdown in improvement has been seen in the other countries of the UK, and in
other large European Union (EU) countries. However, among the large EU countries,
the UK has had the slowest rate of improvement since 2011.

There was a large increase in the number of deaths in the winters of 2014/15, 2016/17
and 2017/18. These increases were also seen across many other European countries
and coincided, over these three seasons, with circulation of influenza A(H3N2) subtype,
known to predominantly affect older people. Analysis of 2015 data also shows that
hospital admissions for influenza (or ‘flu’) increased at the time of the mortality
increase.

There has been a substantial shift in the age structure of the population in recent
decades: the number and proportion of people at older ages has increased. This

                                                    4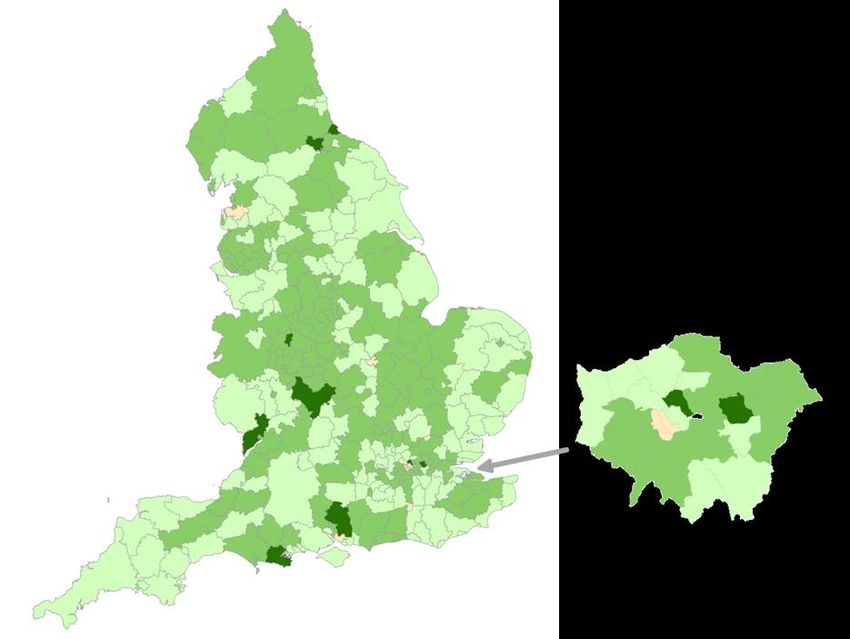
A review of recent trends in mortality in England

indicates that there are likely to be more people living with dementia and other long-
term conditions that may make them particularly vulnerable to the effects of flu and
other winter risk factors, and who may be particularly reliant on health and social care
services.

The size and frequency of recent winter peaks in mortality, determined by the intensity
and dominant type of influenza circulating, flu vaccine uptake and effectiveness, and
which is sometimes exacerbated by cold weather, has contributed to the fluctuations in
the annual age-standardised rates and the slowdown in improvement . However,
improvement in mortality rates for the non-winter months has also slowed in recent
years.

Reductions in mortality from heart disease and stroke, which are leading causes of
death, have historically driven improvements in life expectancy. A slowdown in
improvement in mortality rates from these causes has therefore had a large impact on
the trend in life expectancy. This slowdown has also been seen across many other
countries.

While influenza, heart disease and stroke have determined the trend in mortality rates
in older adults, other causes of death have influenced the trend in younger people.
Mortality rates among younger adults made almost no positive contribution to trends in
life expectancy between 2011 and 2016. The cause of death that had the biggest
negative impact was accidental poisoning, with a large proportion due to drug misuse.

Conclusions and further work

The main findings suggest that the overall slowdown in improvement is due to factors
operating across a wide range of age groups, geographies and causes of death. It has
also been seen, to some extent, in many other countries. This slowdown is unlikely to
be caused by problems with the data or methods of analysis used to monitor the trend.
It is not possible, however, to attribute the recent slowdown in improvement to any
single cause and it is likely that a number of factors, operating simultaneously, need to
be addressed.

The analysis by cause of death shows the importance of stepping up efforts to reduce
the risk of heart disease and stroke by addressing the underlying wider determinants of
health and by reducing risk factors such as smoking, high blood pressure and obesity.
Addressing the increase in deaths due to accidental poisoning in younger age groups is
also important. Further research focused on these specific causes of death, including
further examination of potential cohort factors, could aid understanding of the trends
seen.

                                                    5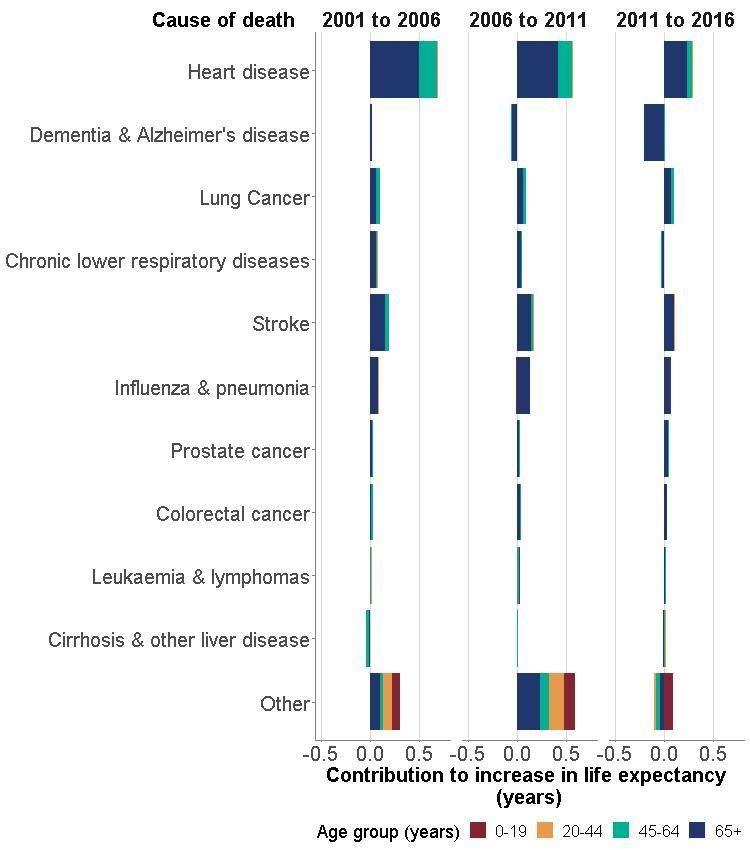
A review of recent trends in mortality in England

Other authors have reported an association between trends in mortality and changes in
public spending, and health and social care provision. Further work would be required
to understand any potential causal mechanisms which may be operating between
changes in health and social care provision and trends in mortality within England and
across different countries.

The increase in numbers of deaths in some winters, and the analysis by deprivation,
highlight the need to support the most vulnerable in society, particularly older people, to
minimise the impact of poverty and extremes of temperature, and diseases such as
dementia and influenza. Recent evidence of reduced flu vaccine effectiveness in older
people has led to changes in the type of vaccine offered to this group. Additional
research could focus on understanding the interactions between these factors and
suggest actions to address widening health inequality.

Key facts

Trends in the number of deaths

The number of deaths in England per year has generally increased since 2011. This
reverses the previous downward trend, but the increase was expected as the
population has also increased and aged. The number of deaths is not, however, a
useful measure of long term trends in the health status of the population as it does not
take into account population size or age structure.

Between the 1970s and 2011 the trend in the number of deaths was downwards, but
fluctuations from year to year did occur. Between 1971 and 2017, the biggest year on
year increase in the number of deaths was between 2014 and 2015.

There was a large increase in the number of deaths in early 2015. This led to the
overall annual increase that year and a large number of excess winter deaths. The
winters of 2016/17 and 2017/18 also had a high number of deaths; excess winter
deaths in 2017/18 were the highest since 1975/76.

The number of deaths in January to March 2018 was higher than the number in each of
the previous five years (including 2015). The peak in deaths in January 2018 was not
quite as high as the peak in January 2015. However, in 2018 there were a series of
additional peaks in late February / early March, a period of particularly cold weather.

Trends in age-standardised mortality rates and life expectancy

Trends in age-standardised mortality rates and age-specific death rates take account of
changes in population size and age structure and are therefore a better measure of

                                                    6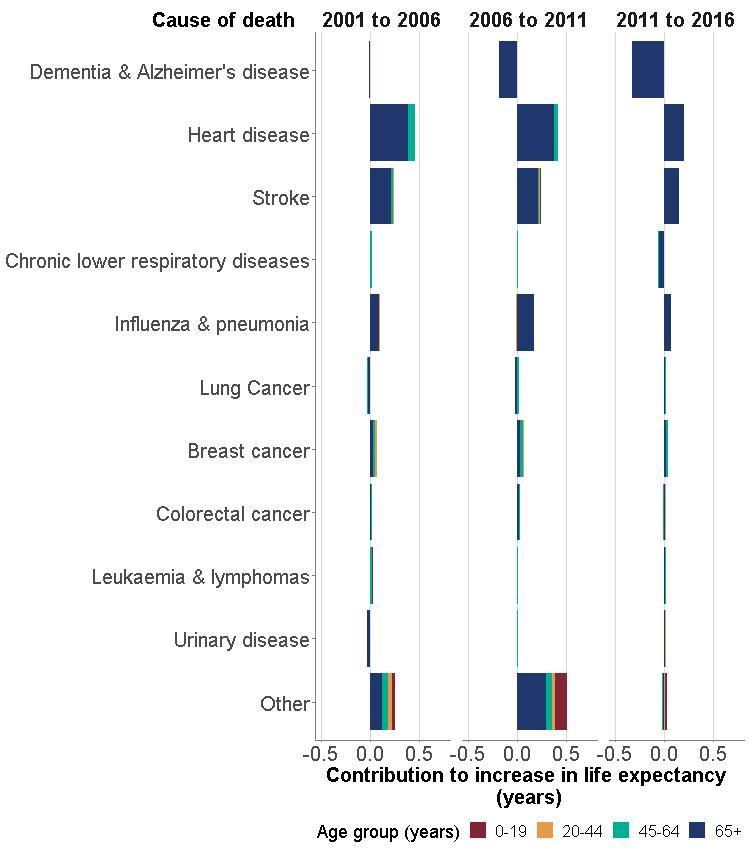
A review of recent trends in mortality in England

mortality than the number of deaths. Period life expectancy at birth is an alternative
summary indicator of mortality.

The overall age-standardised mortality rate in England has generally been declining
(improving) in recent decades for both males and females. However, the rate of
improvement was much smaller between 2011 and 2017 than in earlier periods,
particularly the first decade of the 2000s which had the greatest rate of improvement in
the period examined (1970s onwards).

The provisional age-standardised mortality rate for January to March 2018 was the
highest since the first quarter of 2009. The rate for April to June 2018 was higher than
the same quarter in 2017. Therefore an overall increase in the annual rate between
2017 and 2018 is possible.

Life expectancy at birth in England has generally been increasing (improving) in recent
decades for both males and females. In 2017, life expectancy in England had reached
79.6 years for males and 83.2 years for females. However, as with mortality rates,
improvement in life expectancy, in both males and females, has slowed since 2011.
Between 2006 and 2011, life expectancy increased by 1.6 years in males and 1.3 years
in females, but between 2011 and 2016 this reduced to 0.4 and 0.1 years for males and
females respectively.

Trends by age group

Between 2011 and 2016, mortality rates for the five year age groups between 10-34
and 40-49 years, and people aged 90+, increased. Mortality rates decreased in all
other age groups, but, with the exception of those aged 5-9 years, there has been a
slowdown in improvement since 2011.

These trends in mortality rates at different ages determine the trend in life expectancy.
As a result of the increase in their mortality rates, most age groups between 10 and 49
years made no positive contribution to changes in life expectancy between 2011 and
2016, in contrast to making small positive contributions in earlier periods.

Between 2006 and 2011, mortality improvements in those aged 90+ years made a
small positive contribution of 0.06 years to changes in male life expectancy and 0.12
years to female life expectancy. However, between 2011 and 2016, as mortality rates
in this age group increased, they made a negative contribution to changes in life
expectancy of -0.02 years in males and -0.06 years in females.

Between 2006 and 2011, mortality improvements in those aged 50-89 years made a
positive contribution of 1.2 years to changes in male life expectancy and 0.9 years in
females. However, although mortality rates in these ages continued to decline, between

                                                    7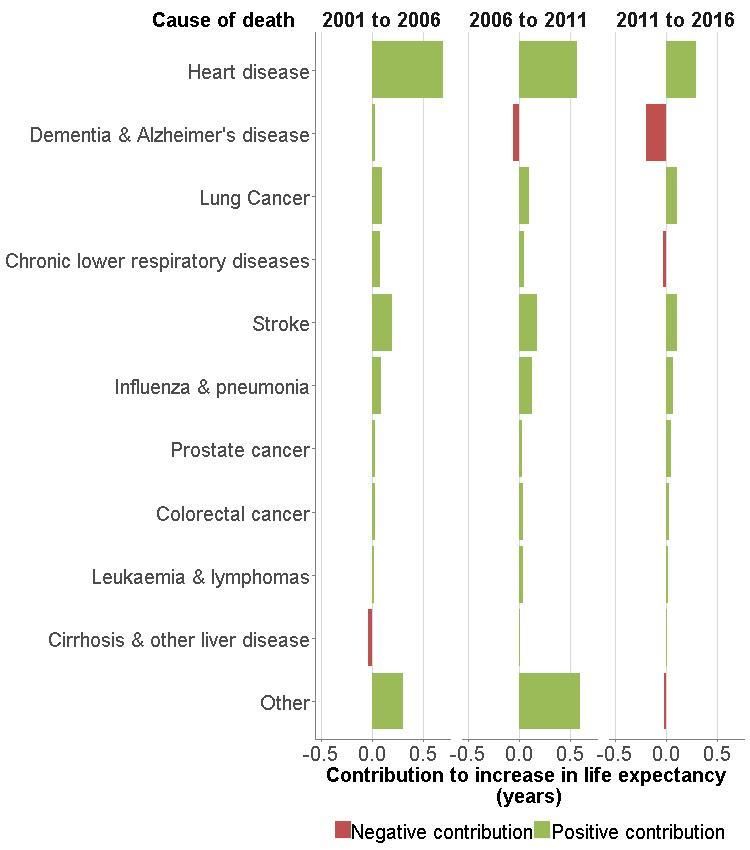
A review of recent trends in mortality in England

2011 and 2016 this contribution reduced to 0.4 in males and 0.2 in females. Therefore,
the positive contribution to life expectancy was much reduced in this later period and
this has had a big effect on the slowdown in improvement in life expectancy.

Geographical variations

All regions of England, the majority of local authorities and all deprivation decile areas
in England (based on small area deprivation scores) had either a slowdown in
improvement or a decrease in life expectancy since 2011 (or 2010-12).

Between 2006-08 and 2010-12, only 4 local authorities had a fall in male life
expectancy and 7 had a fall for females. Between 2010-12 and 2014-16, 72 local
authorities had a fall in male life expectancy and 87 had a fall for females.

Between 2010-12 and 2014-16, life expectancy in the more deprived areas in England
increased more slowly than in the least deprived areas. In addition, female life
expectancy in the most deprived decile areas has actually decreased since 2010-12.
Inequality in female life expectancy has been increasing since 2001-03, while inequality
for males has fluctuated over time, but increased since 2011-13.

International comparisons

The large increase in deaths in the winters of 2014/15, 2016/17 and 2017/18 was also
seen in a number of other European countries.

All other countries of the UK have also experienced a slowdown in improvement in life
expectancy between 2011 and 2016. In addition, most of the largest EU countries also
had a slowdown in this time period, however, improvement in life expectancy in the UK
between 2011 and 2016 was smaller than in the other largest EU countries for both
sexes.

In 2006, the UK had the joint 6th highest male life expectancy out of the 28 EU
countries. Its relative position reduced in 2016 to 10th highest. The picture is worse for
UK female life expectancy, however, the UK rank position was the same in 2006 and
2016, 17th out of the 28 EU states.

Contribution of the leading causes of death

Mortality rates from many of the leading causes of death, such as heart disease and
stroke, have continued to improve but there has been a slowdown in improvement
between 2011 and 2016. Alongside this, there has been a small increase in the
mortality rates from chronic lower respiratory disease in males and females, and ‘other’
causes in males. In addition, largely due to changes in diagnostic and death
                                                    8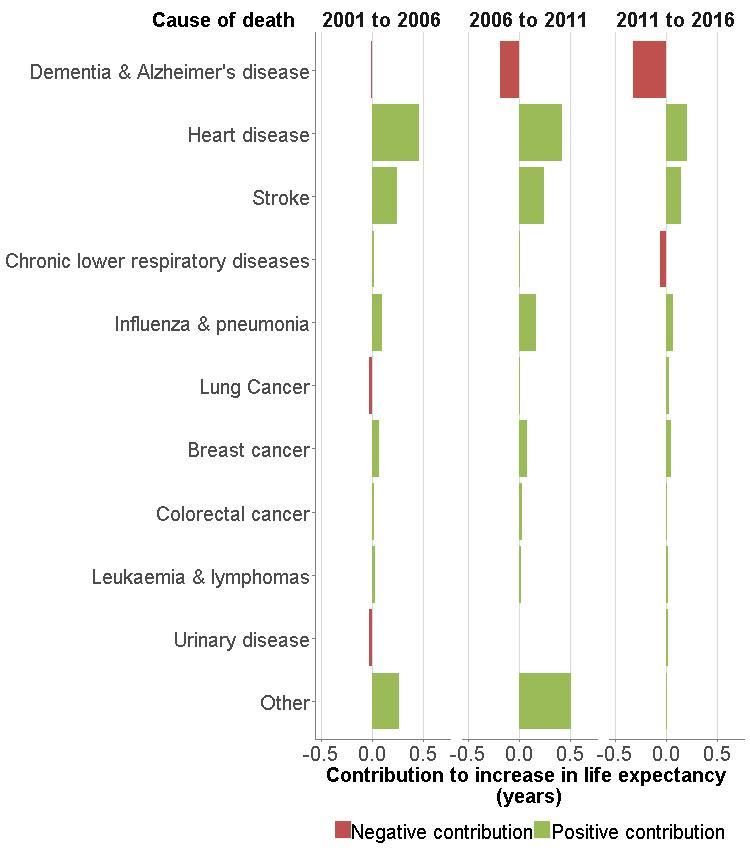
A review of recent trends in mortality in England

certification practices, there has also been an increase in the mortality rates from
dementia and Alzheimer’s disease since around 2006.

Between 2006 and 2011, the decrease in mortality rates from heart disease and stroke
made a positive contribution to changes in life expectancy of 0.7 years in males and
females. However, between 2011 and 2016 this reduced to a positive contribution of
only 0.4 years in males and 0.3 years in females. The increase in mortality rates from
dementia made a negative contribution to changes in life expectancy of -0.2 years in
males and -0.3 years in females between 2011 and 2016.

Among people aged 20-44, mortality rates from accidental poisoning have increased
since 2011 which has made a negative contribution to changes in life expectancy of
-0.06 years in males and -0.11 years in females.

                                                    9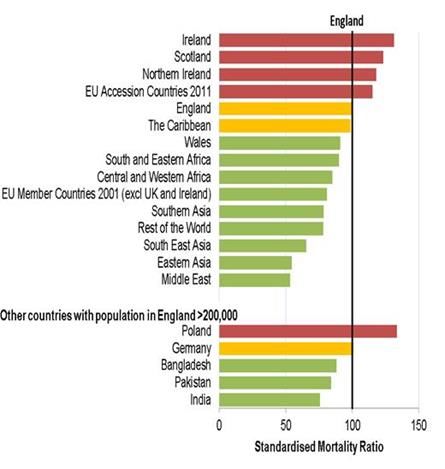
A review of recent trends in mortality in England

Introduction
Until recently the trend in mortality over the last 100 years in England had been
relatively clear: since World War 1 every decade has seen people living longer than
before.[1]

Earlier this decade, however, concern was raised about an increase in mortality in older
people.[2] Following this, Public Health England (PHE) reported on the fall in life
expectancy at older ages in England in 2012, a phenomenon which also occurred in
many other European countries.[3]

More recently, some authors have drawn attention to the fact that the number of deaths
in some winters has been exceptionally high.[4, 5] The Office for National Statistics
(ONS), with support from PHE, examined a spike in deaths at the start of 2015, which
led to a fall in life expectancy at birth that year.[6]

ONS is now issuing quarterly mortality reports providing more up to date information on
trends in mortality.[7] In June this year, for example, ONS reported that in the first three
months of 2018 the number of deaths and the provisional age-standardised mortality
rate was higher than in the first three months in each of the last five years.[8]

In addition to this, it has been highlighted that life expectancy and age-standardised
mortality rates may no longer be improving at the same rate as in earlier years, and
may even be worsening in some population groups.[9-13] PHE reported in 2017 that
there was a slowdown in improvement in mortality rates since 2011.[14] Further
evidence has recently been provided by ONS, who reported a statistically significant
slowdown in the long-term improvement in age-standardised mortality rates from
around the early 2010s.[15]

To further understand what is happening, the Department of Health and Social Care
(DHSC) commissioned PHE to undertake a review of trends in mortality in England,
with a particular focus on the number of deaths in some recent winters and the
slowdown in mortality improvement. This report summarises the findings from the
commission and makes suggestions for further work that could be undertaken.

The aims of this report

The aims of this work are to provide a review of official data to advance understanding
of the trends, to provide further detail on specific population groups and specific causes
of death, and to determine whether this provides insight into possible explanations for
the trends seen. The terms of reference are provided in Appendix 1.

                                                    10
A review of recent trends in mortality in England
In particular, 2 important concerns are examined:
• a recent increase in the number of deaths in England, particularly in some winter
periods from 2014/15 through to 2017/18
• a reduction in the rate of improvement (slowdown in improvement) in life expectancy
and age-standardised mortality rates in recent years, particularly since 2011
Section 1 of this report examines the trend in the number of deaths.
Section 2 sets out recent trends in age-standardised mortality rates and life expectancy
in England, to provide evidence of change in trend.
Section 3 breaks down trends in mortality and life expectancy by sex, age group,
geography, level of deprivation and leading causes of death, to determine whether the
findings are confined to particular population groups or causes of death.
Section 4 compares mortality trends in England with the other countries of the UK, and
makes international comparisons, to see if other countries have had similar trends in
recent years.
Section 5 considers some possible explanations for the findings that can be
investigated using routine data, including a review of available literature.
11A review of recent trends in mortality in England
Section 1: Trends in the number of deaths
Long-term trends
Since 2011 the number of deaths in England has been generally increasing. This
follows a general downward trend in the annual number of deaths since the 1970s,
although the number of deaths fluctuates from year to year (Figure 1A).
Figure 1A: numbers of deaths in England, 1971 to 2017
Source: PHE analysis of ONS mortality data, 1971-2016 and 2017
The number of deaths reached its lowest point since 1971 in 2011 (453,000 deaths) but
numbers have increased since then and in 2017 there were 499,000 deaths (Figure
1A).
This reduction in the number of deaths up to 2011 happened despite a population
which was both growing in size and ageing.[16] However, given this, it was inevitable
that the downward trend in the number of deaths could not continue indefinitely.
As the number of people aged 85 and over has increased over recent decades, there
has also been a continued increase in the percentage of deaths that are among people
in this age group. In 1971, deaths among those aged 85 and over made up just 15% of
all deaths in England and Wales, but by 2016 they accounted for 39% of the total.[16]
12A review of recent trends in mortality in England
Short-term fluctuations
Despite this clear long-term trend in the number of deaths, over the last 50 years there
has been some fluctuation in the number of deaths from year to year. Between 1971
and 2017, the biggest year on year increase in number of deaths in England was
between 2014 and 2015.1
The number of deaths fell between 2015 and 2016, and increased again in 2017, which
had the highest number since 2003.
The increase in deaths in 2015 largely resulted from a spike at the start of the year
which has been well documented (Figure 1B).[6] Most of the increase in deaths in
2015 were of people aged 75 and over, with an underlying cause of respiratory illness
or dementia.[6]
Figure 1B: number of deaths occurring each day in England from 1 July 2014
to 30 June 2015, with five-year average and daily range2
Number of deaths
2500
2000
1500
1000
500
0
21-Jan
11-Sep
23-Sep
10-Nov
22-Nov
04-Dec
16-Dec
28-Dec
09-Jan
02-Feb
14-Feb
26-Feb
06-Aug
18-Aug
30-Aug
02-Apr
14-Apr
26-Apr
01-Jul
09-Mar
21-Mar
08-May
20-May
13-Jul
25-Jul
05-Oct
17-Oct
29-Oct
01-Jun
13-Jun
25-Jun
Range (July 2009 - June 2014) 2014/2015 Five-year average (July 2009 - June 2014)
Source: PHE analysis of mortality data from ONS
In some years the number of winter deaths is much higher than in other years, and this can
often determine the large variation in annual number of deaths. Trends in winter deaths, and
their influence on recent annual mortality trends, are considered further in Section 5.
1 Annual number of deaths for England are available from ONS back to 1940. There were three years before 1971
which had a bigger year on year increase in the number of deaths than that between 2014 and 2015: 1949, 1951
and 1968. Trend in Figure 1A is only shown from 1971 onwards for consistency with age-standardised mortality
rates in Section 2, which are only available from ONS from 1971 onwards for England.
2 The vertical grey bars show the maximum and minimum number of deaths occurring on each day in the 5 year
period July 2009 to June 2014. The break in the red line for 2015 is for 29 February.
13A review of recent trends in mortality in England
Latest data for 2018
Almost 154,000 deaths were registered in England in the first three months of this year.
This was higher than the number registered in this period in each of the previous five
years (including 2015, which itself had a high number of deaths) and 18,000 more than
the average of the previous five years.[8]
The peak in deaths in January 2018 was not quite as high as the spike in January
2015, but in 2018 there was a series of additional peaks in late February / early March,
a period of particularly cold weather (Figure 1C).
Figure 1C: number of deaths occurring in England on each day from 1 January to 30
June 2018, with five-year average and daily range3
Source: PHE analysis of ONS data
The number of deaths in England in the three months from April to June 2018 was much
closer to the five-year average than in the first three months of the year. There was
however a peak in mid-April during a period of unseasonably hot weather (Figure 1C).
A high number of deaths also occurred at the end of June, a period when high
temperatures triggered a heatwave alert from 25 June. ONS will report in December
2018 on deaths from July to September, in which they will consider the effect of the
2018 heatwave.
3The vertical bars show the maximum and minimum number of deaths occurring on each day in the years 2013 to
2017. The break in the red line for 2018 is for 29 February.
14A review of recent trends in mortality in England
Section 2: Trends in mortality rates and life
expectancy
Introduction
Section 1 demonstrated that the number of deaths in England has generally increased
since 2011, however an increase in the number of deaths was expected as the
population has also increased and aged. Although this trend in the number of deaths is
important to understand potential demand for health and social care services, it is not
useful as a measure of long term trends in the health status of the population.
To account for changes in the size and age structure of the population, and to establish
whether the increase in deaths is more than expected, this section examines trends in
age-standardised mortality rates and life expectancy. These are alternative measures
of mortality that both adjust for population size and ageing. They generally show
consistent trends, but a decrease in mortality rates is an improvement, while an
increase in life expectancy is an improvement.
Trends in age-standardised mortality rates
The overall age-standardised mortality rates (for all causes of death combined) in
England have generally declined for both sexes since 1971 (Figure 2A). In 2017, the
rates for both sexes were at the second lowest recorded levels (they were lowest in
2014).
In 2015, the increase in the number of deaths resulted in a significant increase in the
age-standardised rate for both sexes and all persons.4
Between 2014 and 2015, the rate increased by 3.1% in males and 5.1% in females.
This was the biggest year-on-year percentage increase for females (since 1971) and
the second biggest for males. In 2016 there was a fall in the rate for both sexes.
Between 2016 and 2017, although the number of deaths increased, the age-
standardised rate was stable.
4 There was also a significant year-on-year increase in the directly age-standardised mortality rate for both sexes
in 1993, 1985, 1976 and 1972, and a significant increase for females only in 2012, 2003 and 1995.
15A review of recent trends in mortality in England
Figure 2A: trends in age-standardised mortality rates from all causes of death, by
sex, England, 1971 up to 2017
Source: PHE analysis of ONS mortality data, 1971-2016 and 2017
The provisional age-standardised mortality rate for January to March 2018 was the
highest since the first quarter of 2009 (although not statistically significantly higher than
the first quarter of 2015).[8] The provisional age-standardised mortality rate for April to
June 2018 was higher than the same quarter in 2017 [17], therefore an overall increase
in the annual rate between 2017 and 2018 is possible.
Methods for measuring trends in mortality rates
The rate of improvement in mortality rates can be measured in a number of ways. In
2017, PHE published a blog which considered what's happening with mortality rates in
England.[14]
The blog reported the results of a model which estimated the mortality rates which
would have been expected in 2012 to 2016, had the downward trend from 2002 to
2011 continued.5 The model indicated that for both sexes, mortality rates in England
between 2012 and 2014 were slightly higher than would have been expected if the
5Using 2011 as a ‘breakpoint’ for the change in trend has been confirmed as an appropriate approach following
analysis by ONS of changing mortality trends between 1990 and 2017.
16A review of recent trends in mortality in England
earlier downward trend had continued unchanged. In 2015 and 2016, mortality rates
were around 10% higher than expected.
Change over time can also be measured by estimating the gradients in mortality rates
for different periods. These take account of the mortality rate in every year in the period
(not just the first and last years) and can be used to provide the average annual
absolute change in rates. This method was used to assess change for each decade of
the mortality rates shown in Figure 2A.
The results reported in Table 2A are all negative, showing that mortality rates fell
(improved) in each decade, but the average annual fall varied over time. The largest
falls were in the 2000s for both sexes. Between 2011 and 2017, the average annual
improvement was smaller than in each of the previous four decades.
Table 2A: average annual absolute change in directly age-standardised rates per
100,000 population, England*
Decade Males Females
1971 to 1980 -20.9 -14.3
1981 to 1990 -32.3 -17.3
1991 to 2000 -32.6 -12.9
2001 to 2010 -36.1 -20.5
2011 to 2017 -6.1 -1.6
*A negative value indicates an improvement in mortality rates within the period
Source: PHE analysis of ONS mortality data, 1971-2016 and 2017
As the results for average annual improvement may be sensitive to the years chosen to
start and end each period, a sensitivity analysis was undertaken to test the impact of
changing periods slightly. This resulted in small changes to the figures but did not
change the overall picture.
Further confirmation of the change in trend for mortality rates has been provided in a
recent ONS report which reported a statistically significant slowdown in the long-term
improvement in age-standardised mortality rates from around the early 2010s.[15]
ONS found this to be true for both England and Wales, for both sexes, and for age
groups both above and below age 75, with some variations in the timing and extent of
the change in trend.
17A review of recent trends in mortality in England
Trends in life expectancy
Life expectancy at birth in England has generally increased in recent decades and it
reached 79.6 years for males and 83.2 years for females in 2017 (Figure 2B).6
However, as with mortality rates, there has been a slowdown in improvement in life
expectancy since 2011.7
Figure 2B: trends in life expectancy at birth, by sex, England, 1981 up to 2017
Source: PHE analysis of ONS mortality data, 1971-2016 and 2017
Between 2014 and 2015, life expectancy at birth fell for both sexes (reflecting the
increase in the age-standardised mortality rate in 2015). This was the first time since
1993 that it fell for both sexes.8
As with age-standardised mortality rates, change over time was measured by
estimating the gradients in life expectancies for different decades. Results for average
annual change in life expectancy are shown in Table 2B.
6 The national life expectancy figures included in this report are for single calendar years. ONS also produces
National Life Tables based on 3 years of data. Further detail on the different life expectancy estimates released by
ONS are included in the Definitions section.
7 Directly age-standardised mortality rates and life expectancy estimates are both based on age-specific mortality
rates, and so generally do have very similar trends. Life expectancy estimates for England for single calendar
years are only available from 1981 onwards.
8 There was a fall for both sexes in 1985 and there was a fall for females only in 2012.
18A review of recent trends in mortality in England
Similar to the results for age-standardised mortality rates, absolute improvement in the
current decade was considerably lower than in the preceding three decades. The
2000s was the decade with the greatest improvement.
Table 2B: average annual absolute change in life expectancy at birth (in years
and weeks), England*
Years Weeks
Decade
Males Females Males Females
1981 to 1990 0.22 0.17 11.4 8.8
1991 to 2000 0.24 0.15 12.5 7.8
2001 to 2010 0.31 0.23 16.1 12.0
2011 to 2017 0.07 0.04 3.6 2.1
*A positive value indicates an improvement in life expectancy within the period
Source: PHE analysis of ONS life expectancy data
19A review of recent trends in mortality in England
Section 3: Detailed breakdowns of mortality
rates and life expectancy
Introduction
This section presents trends in mortality rates and/or life expectancy by sex, age group,
geography, level of deprivation and cause of death, to determine whether the slowdown
in improvement has occurred across all population groups, and leading causes of
death.
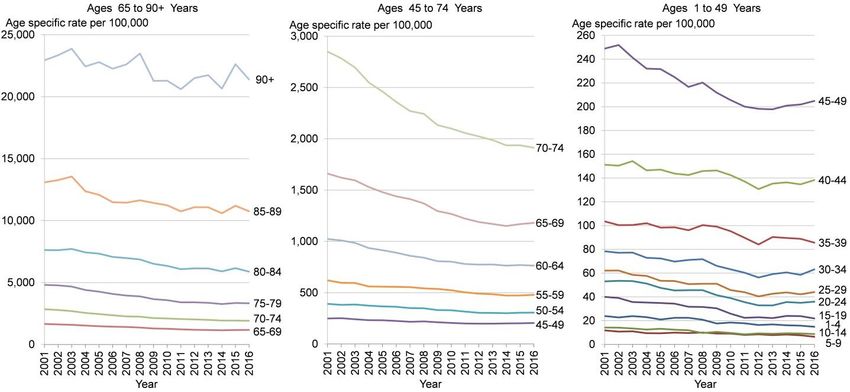
Trends in mortality rates by age group
All-cause age-specific mortality rates declined in all age groups between 2001 and
2016, as shown in Figure 3A.
Figure 3A: trends in age-specific mortality rates, persons, 2001 up to 2016, England9
Source: PHE analysis of ONS mortality data
In almost all age groups, improvements in mortality rates have slowed from around 2011
(Figure 3A).
Add gradients by age group
Source: PHE analysis of ONS mortality data
Average annual absolute change in the mortality rate for each age group is shown in
Table 3A for three time periods: 2001 up to 2006, 2006 up to 2011, and 2011 up to
9Note that each of the three charts is on a different scale to make change over time more clearly visible for
younger age groups.
20A review of recent trends in mortality in England
2016. Table 3A also shows the relative percentage change in the age-specific mortality
rate within each period.
Mortality rates fell (improved) for each age group between 2001 and 2006, and
between 2006 and 2011. In the most recent period between 2011 and 2016, mortality
rates increased (worsened) for those aged 10-34, 40-49 and 90+. For these age groups
the downward trend seen in earlier periods has therefore not continued.
For all other age groups, mortality rates fell in the most recent period, but apart from
those aged 5-9, there was a slowdown in improvement between 2011 and 2016.
Table 3A: average annual absolute change in age-specific rates per 100,000
population, England, 2001 up to 2006, 2006 up to 2011, and 2011 up to 2016*
Average annual absolute change in Average annual percentage change in
Age group mortality rates within each period mortality rates within each period
2001 to 2006 2006 to 2011 2011 to 2016 2001 to 2006 2006 to 2011 2011 to 2016
1-4 -0.4 -1.1 -0.5 -1.7 -5.3 -3.0
5-9 -0.4 -0.3 -0.3 -4.1 -3.7 -3.7
10-14 -0.4 -0.7 0.0 -2.6 -6.7 0.5
15-19 -1.2 -2.2 0.1 -3.1 -7.7 0.2
20-24 -1.7 -2.1 0.3 -3.3 -5.0 0.9
25-29 -2.0 -1.8 0.2 -3.4 -3.6 0.5
30-34 -1.8 -2.2 0.7 -2.4 -3.2 1.1
35-39 -0.8 -1.4 -0.2 -0.8 -1.4 -0.2
40-44 -1.6 -0.9 0.6 -1.1 -0.7 0.4
45-49 -5.4 -4.7 1.1 -2.3 -2.2 0.5
50-54 -5.6 -9.1 -1.4 -1.5 -2.6 -0.5
55-59 -13.3 -10.5 -5.1 -2.2 -1.9 -1.0
60-64 -28.7 -21.6 -2.9 -3.0 -2.6 -0.4
65-69 -45.7 -45.5 -8.2 -2.9 -3.4 -0.7
70-74 -102.1 -61.0 -29.5 -3.8 -2.7 -1.5
75-79 -156.0 -134.5 -18.4 -3.4 -3.5 -0.5
80-84 -111.4 -205.8 -34.4 -1.5 -3.1 -0.6
85-89 -364.6 -130.6 -2.5 -2.9 -1.2 -0.0
90+ -185.1 -412.3 177.8 -0.8 -1.9 0.8
*A negative value indicates an improvement in mortality rates within the period
Source: PHE analysis of ONS mortality data
ONS have also looked at changes in the trend in mortality rates for broad age groups in
the UK.[18] Although they have therefore used a slightly different method, the findings
from both analyses are broadly consistent.
The infant mortality rate is not included in Figure 3A or Table 3A. In England, the
number of infant deaths (under one year) is relatively small and subject to variation
from year to year. As a result, the data are often considered on a three-year rolling
21A review of recent trends in mortality in England
average basis. The infant mortality rate fell from 5.4 per 1,000 live births in 2001-03 to
3.9 in 2013-15. However, there was then no further decline in 2014-16. [16]
Contribution of age groups to trends in life expectancy
The contribution of trends in mortality rates in different age groups to the change in life
expectancy over time can be examined using a method for ‘decomposing’ life
expectancy (see Definitions for more information).[19, 20]10 The impact of any change
in the age-specific rate is determined by how high the rate is to start with and also the
number of potential years of life lost past that age group. A single death at a young age
has more of an impact on life expectancy than the death of an older person, as more
potential years of life have been lost.
In Figure 3B, age groups where the mortality rate has reduced over time made a
positive contribution to changes in life expectancy and have a positive value, while age
groups where the mortality rate has increased over time made a negative contribution
to changes in life expectancy and have a negative value. In Figure 3B, the sum of the
values for all the bars for each sex, will add up to the total change in life expectancy for
that sex in the period presented.
All age groups made a positive contribution to changes in life expectancy between
2001 and 2006, and between 2006 and 2011. The age groups which made the biggest
positive contribution were at older ages, 60 to 89 years (Figure 3B).
The contribution from almost all age groups was smaller between 2011 and 2016. Age
groups between 10 and 49 years made almost no contribution between 2011 and 2016,
either positive or negative.
Between 2006 and 2011, the age group 90+ made a positive contribution to changes in
life expectancy of 0.06 years in males and 0.12 years in females. Between 2011 and
2016 the increase in the mortality rate in this age had a negative effect on life
expectancy of -0.02 years in males and -0.06 years in females. Therefore, although
mortality rates in people aged 90+ years increased, the effect on overall life expectancy
was small.
10 This analysis follows a 2017 report which decomposed life expectancy estimates in Northern Ireland:
https://www.health-ni.gov.uk/publications/health-inequalities-life-expectancy-decomposition-2017
22A review of recent trends in mortality in England
Figure 3B: contribution of age groups to changes in life expectancy at birth, by
sex, England, 2001 up to 2006, 2006 up to 2011 and 2011 up to 2016
Males
Females
Source: PHE analysis of ONS mortality data and population estimates
Between 2006 and 2011, the age groups 50-89 years made a positive contribution of
1.2 years to male life expectancy and 0.9 years to female life expectancy. However,
23A review of recent trends in mortality in England
between 2011 and 2016 this contribution reduced to 0.4 years in males and 0.2 years
in females. Therefore, it is the change in mortality rates at ages 50-89 that has had the
biggest effect on the slowdown in life expectancy improvement between 2011 and
2016.
Trends in age-standardised mortality rates from leading causes of death
Figures 3C and 3D show trends in the age-standardised mortality rates for the 10
leading causes of death, plus ‘Other’, between 2001 and 2016.11 Table 3B shows
average annual absolute change in 3 periods (2001 up to 2006, 2006 up to 2011, and
2011 up to 2016). Unfortunately, it is not possible to analyse trends in mortality rates by
cause before 2001 on a comparable basis.12
Since 2001, for both sexes, there has been a decline in mortality rates from heart
disease and stroke. For both sexes, the level of improvement decreased in each
consecutive period.
Mortality rates from dementia and Alzheimer’s disease (referred to as dementia from
now on) have been steadily increasing in males and females since 2006. This is now
the leading cause of death for females, accounting for 16% of all deaths, and is the
second leading cause of death for males (8% of all deaths).[16] The reasons for this
are not clear, but increased awareness of dementia, making it more likely to be
diagnosed and recorded, is a factor. A more detailed discussion on this can be found in
Section 5.
The mortality rate from influenza and pneumonia has declined for both sexes since
2001, but annual improvement between 2011 and 2016 slowed down.
For both sexes, chronic respiratory disease mortality declined between 2001 and 2011,
but there was an increase between 2011 and 2016. For lung cancer there was a steady
decline for males throughout, and for females there was a small decline between 2011
and 2016, following an increase between 2001 and 2011.
For the other leading cancer sites, there was a clear reduction in mortality rates
throughout 2001 to 2016. However, the reduction in the rate for female breast cancer
was not as great between 2011 and 2016 than in earlier periods.
11 Mortality rates in this section are all based on the underlying cause of death. See Definitions section for further
details. Cause groups are based on the ONS definition of leading causes of death
12 This is due to coding changes in 2001. There were further coding changes in 2011 and 2014, which this
analysis takes into account. See Definitions section for further details.
24A review of recent trends in mortality in England
The ‘Other’ group represents diseases which are not in the top 10 leading causes for
each sex. In 2016 ‘Other’ represented 43% of deaths for males, and 42% for females.
For ‘Other’ causes of death, there was improvement for both sexes between 2001 and
2011. Rates have fluctuated since 2011, but there was no overall annual change for
females between 2011 and 2016, and for males there was actually an increase.
Figure 3C: trends in age standardised mortality rates for three leading causes of
death and ‘other’ diseases outside of the top 10 leading causes, England, 2001
up to 2016
Males
Females
Source: PHE analysis of ONS mortality data and population estimates
25A review of recent trends in mortality in England
Figure 3D: trends in age standardised mortality rates from selected causes of
death, England, 2001 up to 2016
Males
Females
Source: PHE analysis of ONS data and population estimates
26A review of recent trends in mortality in England
Table 3B: average annual absolute change in directly age-standardised mortality
rates per 100,000 population, for leading causes of death, England, 2001 up to
2006, 2006 up to 2011 and 2011 up to 2016*
Males
Cause of death 2001 to 2006 2006 to 2011 2011 to 2016
Heart disease -17.9 -12.5 -5.9
Dementia and Alzheimer's disease -1.1 2.5 6.2
Stroke -6.7 -4.6 -2.4
Prostate cancer -0.8 -0.5 -0.8
Lung cancer -2.2 -1.7 -1.7
Influenza and pneumonia -4.1 -4.7 -1.9
Colorectal cancer -0.6 -0.5 -0.6
Chronic lower respiratory diseases -2.4 -1.2 0.2
Leukaemia and lymphomas -0.3 -0.2 -0.3
Cirrhosis and other liver disease 0.4 -0.1 0.1
Other -4.0 -9.3 1.9
Females
Cause of death 2001 to 2006 2006 to 2011 2011 to 2016
Heart disease -9.4 -7.6 -3.7
Dementia and Alzheimer's disease 0.1 4.1 7.4
Stroke -5.6 -4.4 -2.9
Breast cancer -0.9 -0.9 -0.6
Lung cancer 0.5 0.1 -0.3
Influenza and pneumonia -2.7 -3.7 -1.3
Colorectal cancer -0.3 -0.5 -0.2
Chronic lower respiratory diseases -0.1 -0.1 1.1
Leukaemia and lymphomas -0.3 -0.1 -0.2
Kidney disease / other diseases of urinary system 0.9 0.2 -0.2
Other -3.5 -7.2 0.0
*A negative value indicates an improvement in mortality rates within the period
Source: PHE analysis of ONS mortality data and population estimates
ONS have also reported that mortality rates for cancer, circulatory and respiratory
diseases have generally been decreasing since 2001 across the UK, while mortality
rates for mental and behavioural disorders, such as dementia, have increased sharply
in recent years. [18] This is consistent with the analysis presented here.
Contribution of leading causes to trends in life expectancy
The contribution of the 10 leading causes of death to changes in life expectancy over
three periods between 2001 and 2016 are shown in Figure 3E. The impact of any
change in the rate for a particular cause is determined by how high the rate is to start
with and also the age distribution of the deaths for that cause.
27A review of recent trends in mortality in England
Since 2001, reductions in mortality from heart disease have made the largest positive
contribution to changes in life expectancy, but these contributions were smaller
between 2011 and 2016, as were the contributions due to reductions in mortality from
stroke.
Rising mortality from dementia had a negative effect on life expectancy between 2006
and 2016. Trends in mortality from chronic respiratory disease also had a small
negative effect between 2011 and 2016.
The ‘Other’ group made a substantial positive contribution to changes in life expectancy
in the earlier time periods, but not between 2011 and 2016.
Figure 3F shows the impact of changes in mortality rates by cause and age group.
Much of the impact of the 10 leading causes was focused on people aged 65 and over,
which is expected as the leading causes reflect the most common causes of death at
older ages. To further understand the contribution of the ‘Other’ group it is necessary to
examine deaths at younger ages.
Figure 3E: contribution of 10 leading causes of death to changes in life expectancy,
England, 2001 up to 2006, 2006 up to 2011, and 2011 up to 2016
Male Female
28A review of recent trends in mortality in England
Figure 3F: contribution of 10 leading causes of death to changes in life
expectancy, by broad age group, England, 2001 up to 2006, 2006 up to 2011, and
2011 up to 2016
Male Female
Source: PHE analysis of ONS mortality data and population estimates
Analysis of the impact of trends in the five leading causes of death for each broad age
group is shown in Figures 3G to 3I. Note that the leading causes are different in each
age group, and the overall contribution in each of these age groups is different so each
chart is shown on a different scale. All the charts show the contribution made by each
age group to life expectancy at birth, not the life expectancy for the age group in the
chart.
Among people aged 20-44, an increase in mortality rates from accidental poisoning had
a negative effect on life expectancy between 2011 and 2016 of -0.06 years in males and
-0.11 years in females. Data from ONS indicate that in this age group, over the whole
period from 2011 to 2016, 70% of accidental poisonings were due to drug misuse and
10% were to alcohol. An increase in the female suicide rate in this age group also had
a small negative effect on life expectancy between 2011 and 2016 (-0.02 years).
Improvement in mortality from heart disease among females aged 45-64 made a
positive contribution to changes in life expectancy between 2001 and 2011, but between
2011 and 2016 the contribution was zero (Figure 3H). Among males, heart disease
made a positive contribution in all 3 periods, but between 2011 and 2016 it was much
29A review of recent trends in mortality in England
reduced. For both sexes in this age group, ‘Other’ causes made a small negative
contribution to changes in life expectancy between 2011 and 2016, after having made
positive contributions in the earlier two periods.
ONS also observe that “The slowdown of the decline in mortality rates for diseases of
the circulatory system…from 2011 has also been a large contributor to the changing
trend in mortality for those aged 55 years and over.” For those aged 15-55, ONS found
that increases in external causes of death (which include accidents and suicide) have
influenced the trend at these ages.[18] This is consistent with the analysis presented
here.
Figure 3G: contribution of 5 leading causes of death to changes in life expectancy,
aged 20-44, England, 2001 up to 2006, 2006 up to 2011 and 2011 up to 2016
Male Female
Figure 3H: contribution of 5 leading causes of death to changes in life expectancy,
aged 45-64, England, 2001 up to 2006, 2006 up to 2011 and 2011 up to 2016
Male Female
30A review of recent trends in mortality in England
Figure 3I: contribution of 5 leading causes of death to changes in life expectancy,
aged 65+, England, 2001 up to 2006, 2006 up to 2011 and 2011 up to 2016
Male Female
Source: PHE analysis of ONS mortality data and population estimates
Trends by geography
Regions
Life expectancy in all English regions increased between 2001 and 2016 for both sexes,
but the biggest increases were in London. Of the 9 English regions, London had the fifth
highest male life expectancy in 2001. In 2016, following an increase of 5 years, male life
expectancy in London was higher than all other regions. Similarly for females, its rank
order changed from fourth highest to highest (Figure 3J).13
The South West had the smallest increase over this period, 2.9 years for males, 1.9
years for females. All regions had a fall in life expectancy in 2015 (apart from males in
the North East) but the extent of these decreases varied.
All regions had a slowdown in improvement between 2011 and 2016 (Table 3C). In four
regions (North East, North West, West Midlands, South West) female life expectancy
fluctuated between 2011 and 2016, but they had a negative average annual change.
13ONS publishes annual estimates of life expectancy for the English regions based on three years of data. The
estimates in Figure 3J have been calculated by PHE for single calendar years so that recent trends can be more
easily examined.
31A review of recent trends in mortality in England
Figure 3J: life expectancy at birth by English region, 2001 up to 2016
Source: PHE analysis of ONS mortality data and population estimates
Local authorities
Due to their smaller populations, life expectancy at local authority level is subject to
more fluctuation between years, than for regions or England as a whole. Analysis is
therefore based on rolling three-year averages of data.
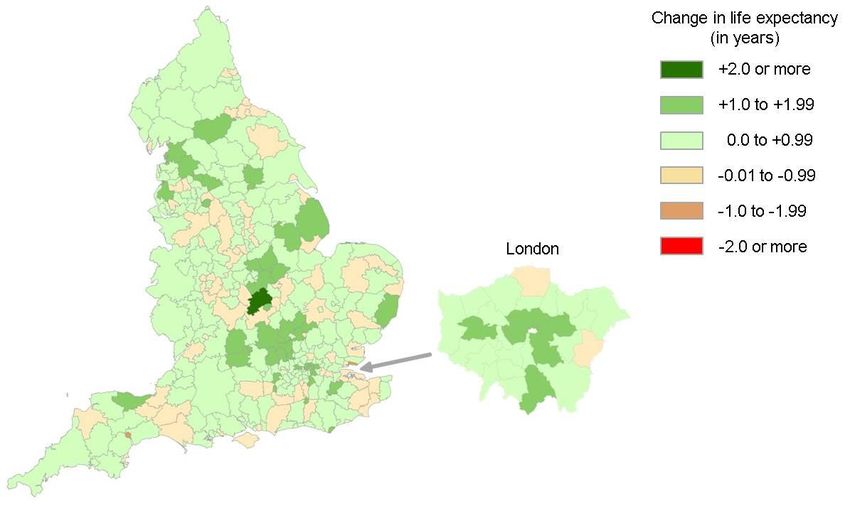
Changes in life expectancy by local authority in England are illustrated in Maps 1 and 2
for the periods between 2006-08 to 2010-12, and 2010-12 to 2014-16. It is evident that
improvement in life expectancy has slowed across many local authorities.
Between 2006-08 and 2010-12, 318 local authorities had an increase in male life
expectancy, 2 had no change and 4 had a fall. For females, 314 had an increase in life
expectancy, 3 had no change and 7 had a fall.
The picture is different between 2010-12 and 2014-16: for males, 237 local authorities
had an increase in male life expectancy, 15 had no change and 72 had a fall. For
females, 207 had an increase in life expectancy, 30 had no change and 87 had a fall.
Of the 231 local authorities which had an increase in male life expectancy in both time
periods, 177 areas had a greater increase between 2006-08 and 2010-12, than
between 2010-12 and 2014-16. Of the 197 local authorities which had an increase in
female life expectancy in both time periods, 146 areas had a greater increase in the
earlier time period.
32A review of recent trends in mortality in England
Table 3C: average annual absolute change in life expectancy at birth (years),
English regions, 2001 up to 2006, 2006 up to 2011 and 2011 up to 2016*
Males
Region 2001 to 2006 2006 to 2011 2011 to 2016
North East 0.34 0.34 0.01
North West 0.30 0.33 0.09
Yorkshire and The Humber 0.29 0.31 0.08
East Midlands 0.28 0.32 0.06
West Midlands 0.27 0.40 0.00
East of England 0.30 0.30 0.05
London 0.40 0.40 0.17
South East 0.34 0.28 0.07
South West 0.31 0.26 0.04
Females
Region 2001 to 2006 2006 to 2011 2011 to 2016
North East 0.19 0.28 -0.02
North West 0.23 0.26 -0.01
Yorkshire and The Humber 0.20 0.21 0.06
East Midlands 0.22 0.29 0.00
West Midlands 0.20 0.30 -0.01
East of England 0.25 0.24 0.01
London 0.32 0.30 0.12
South East 0.21 0.25 0.04
South West 0.25 0.20 -0.02
*A positive value indicates an improvement in life expectancy within the period
Source: PHE analysis of ONS mortality data and population estimates
33A review of recent trends in mortality in England
Map 1a: change in male life expectancy at birth, English local authorities, 2006-08
up to 2010-12
Map 1b: change in male life expectancy at birth, English local authorities, 2010-12
up to 2014-16
34A review of recent trends in mortality in England
Map 2a: change in female life expectancy at birth, English local authorities, 2006-
08 up to 2010-12
Map 2b: change in female life expectancy at birth, English local authorities, 2010-
12 up to 2014-16
Source: PHE analysis of ONS life expectancy data
35A review of recent trends in mortality in England
Trends by level of deprivation
Life expectancy trends by deprivation decile areas are shown in Figure 3K and Table
3D. For males and females all deciles had a slowdown in improvement in the most
recent period.
Between the most and least deprived areas of England, the level of inequality, or gap, in
life expectancy was 9.3 years for males and 7.3 years for females in 2014-16.14 These
figures are a summary measure of inequality between deprivation decile areas.
Inequality in life expectancy between the most and least deprived in England has
fluctuated over recent years for males, but there was a significant widening between
2011-13 and 2014-16, indicating that improvement in the most deprived deciles was
lower than for those in the least deprived deciles.
For females, there has been a statistically significant widening of inequality between
2001-03 and 2014-16, indicating that improvement in the most deprived deciles was
lower than for those in the least deprived deciles throughout the period. In addition
female life expectancy in the most deprived decile actually decreased between 2010-12
and 2014-16.
These findings are consistent with a recent report which examined trends in life
expectancy in England by level of deprivation between 2001 and 2016.[91] This
reported widening inequality in life expectancy for both sexes, and a decline in female
life expectancy in the most deprived two deciles since 2011.
14Figures for 2014-16, as measured by the slope index of inequality, a summary measure of inequality across the
social gradient from most to least deprived. See Definitions section for further details.
36A review of recent trends in mortality in England
Table 3D: average annual absolute change in life expectancy at birth (years),
English deprivation deciles*†
Males Females
Deprivation
2001-2003 to 2005-2007 to 2010-2012 to 2001-2003 to 2005-2007 to 2010-2012 to
decile
2005-2007 2010-2012 2014-2016 2005-2007 2010-2012 2014-2016
Most - 1 0.27 0.40 0.06 0.18 0.27 -0.04
2 0.32 0.34 0.07 0.24 0.22 0.00
3 0.35 0.32 0.08 0.25 0.22 0.08
4 0.29 0.33 0.11 0.24 0.22 0.04
5 0.33 0.29 0.11 0.26 0.22 0.06
6 0.31 0.28 0.13 0.24 0.23 0.06
7 0.34 0.26 0.13 0.25 0.23 0.09
8 0.36 0.30 0.10 0.26 0.25 0.08
9 0.33 0.29 0.12 0.28 0.25 0.09
Least - 10 0.37 0.27 0.12 0.29 0.28 0.10
*A positive value indicates an improvement in life expectancy within the period
†Decile 1 = Most deprived, Decile 10 = Least deprived
Source: PHE analysis of life expectancy by deprivation deciles in the Public Health Outcomes Framework
Figure 3K: trend in life expectancy at birth, for most and least deprived deciles*,
England, 2001-03 to 2014-16
Males
37A review of recent trends in mortality in England
Females
Source: Public Health Outcomes Framework
*Deciles based on groups of Lower Super Output Areas. Deprivation defined using Index of Multiple Deprivation
2010 (2001-03 to 2009-11) and Index of Multiple Deprivation 2015 (2010-12 onwards) from Ministry of Housing,
Communities and Local Government
Mortality by country of birth
In 2011-13 (the latest years for which we have data), among people resident in
England, standardised mortality ratios (SMRs) for men under age 75 born in Ireland,
Scotland, Northern Ireland and those born in countries which joined the EU between
2004 and 2011 (EU accession countries15) were significantly higher than the England
average. The highest SMR was for men born in Poland, their level of premature
mortality was 34% higher than the male average for England (Figure 3L).
15 The EU accession countries are Bulgaria, Cyprus, Czech Republic, Estonia, Hungary, Latvia,
Lithuania, Malta, Poland, Romania, Slovakia and Slovenia. In chart 3L, Poland is reported by itself and as
part of the group of EU accession countries.
38A review of recent trends in mortality in England
Figure 3L: standardised mortality ratios for all cause deaths under age 75, by
country of birth, England, 2011-13
Males Females
Source: PHE Public Health Outcomes Framework: Health Equity report, focus on ethnicity, Figure 1G
The pattern was not quite the same for females. Women born in Scotland, Northern
Ireland and Ireland had significantly high levels of premature mortality, but women born
in the EU accession countries, including Poland, had significantly lower mortality than
the England average.
Studies looking at mortality rates for earlier time periods also found high adult mortality
in people born in Scotland and Ireland for both sexes.[21, 22] Results for 2001-03 for
people born in Eastern Europe are also similar to those shown in Figure 3L for people
born in the EU accession countries. Men born in Eastern Europe had higher mortality
than the average for England and Wales for age groups from 20-69 years. Women
born in Eastern Europe had lower than average mortality, except in the 20-44 age group
(which was higher but not significantly higher than average).[22]
For both males and females, the SMRs for 2011-13 indicate that people born in groups
of countries outside the UK, Ireland and EU accession countries had levels of
premature mortality which were lower or similar to the England average (Figure 3L).
Earlier studies found this was also the case for many country of birth groups, but there
were exceptions with higher mortality found in some cases, including people born in
39A review of recent trends in mortality in England
West Africa[21, 22] and men born in Bangladesh.[22] The results for 2011-13 for people
born in these countries suggest relative improvement over time, but direct comparisons
are not possible because of differences in the age groups and country groupings used
for analysis.
40You can also read