Teaching the "Duck" to Fly - Second Edition Jim Lazar Author - Regulatory ...
←
→
Page content transcription
If your browser does not render page correctly, please read the page content below
Teaching the “Duck” to Fly
          Second Edition

              Author
            Jim Lazar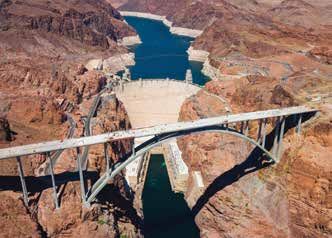
How to Cite This Paper
Lazar, J. (2016). Teaching the “Duck” to Fly, Second Edition. Montpelier, VT: The Regulatory Assistance Project.
                     Available at: http://www.raponline.org/document/download/id/7956

                            Electronic copies of this paper and other RAP publications
                               can be found on our website at www.raponline.org.
                 To be added to our distribution list, please send relevant contact information to
                                               info@raponline.org.

                                                 February 2016

                                            Cover image by Tim Newcomb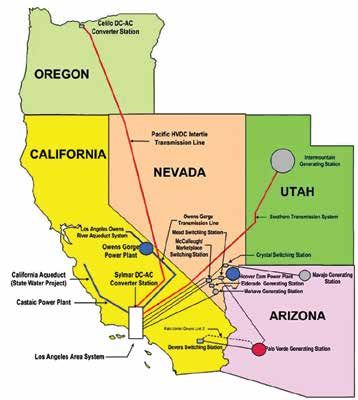
Teaching the “Duck” to Fly • Second Edition

            Teaching the “Duck” to Fly
                                                           Second Edition

                                                        Table of Contents

Acronyms. . . . . . . . . . . . . . . . . . . . . . . . . . . . . . . . . . . . . . . . . . . . . . . . . . . . . . . . . . . . . . . . . . . . 2
List of Figures. . . . . . . . . . . . . . . . . . . . . . . . . . . . . . . . . . . . . . . . . . . . . . . . . . . . . . . . . . . . . . . . . 2
List of Tables . . . . . . . . . . . . . . . . . . . . . . . . . . . . . . . . . . . . . . . . . . . . . . . . . . . . . . . . . . . . . . . . . 2
Foreword to the Second Edition. . . . . . . . . . . . . . . . . . . . . . . . . . . . . . . . . . . . . . . . . . . . . . . . . . . 3
Introduction: Teaching the “Duck” to Fly. . . . . . . . . . . . . . . . . . . . . . . . . . . . . . . . . . . . . . . . . . . . 6
Strategy 1: Target Energy Efficiency to the Hours When Load Ramps Up Sharply. . . . . . . . . . . . 10
Strategy 2: Acquire and Deploy Peak-Oriented Renewable Resources. . . . . . . . . . . . . . . . . . . . . 13
Strategy 3: Manage Water and Wastewater Pumping Loads. . . . . . . . . . . . . . . . . . . . . . . . . . . . . 16
Strategy 4: Control Electric Water Heaters to Reduce Peak Demand and
   Increase Load at Strategic Hours . . . . . . . . . . . . . . . . . . . . . . . . . . . . . . . . . . . . . . . . . . . . . . . 19
Strategy 5: Convert Commercial Air Conditioning to Ice Storage or Chilled-Water Storage. . . . . 24
Strategy 6: Rate Design: Focus Utility Prices on the “Ramping Hours” to
   Enable Price-Induced Changes in Load . . . . . . . . . . . . . . . . . . . . . . . . . . . . . . . . . . . . . . . . . . 28
Strategy 7: Deploy Electrical Energy Storage in Targeted Locations. . . . . . . . . . . . . . . . . . . . . . . 33
Strategy 8: Implement Aggressive Demand-Response Programs. . . . . . . . . . . . . . . . . . . . . . . . . . 37
Strategy 9: Use Inter-Regional Power Exchanges to Take Advantage of
   Diversity in Loads and Resources. . . . . . . . . . . . . . . . . . . . . . . . . . . . . . . . . . . . . . . . . . . . . . . 40
Strategy 10: Retire Inflexible Generating Plants With High Off-Peak
   Must-Run Requirements. . . . . . . . . . . . . . . . . . . . . . . . . . . . . . . . . . . . . . . . . . . . . . . . . . . . . . 43
Conclusions . . . . . . . . . . . . . . . . . . . . . . . . . . . . . . . . . . . . . . . . . . . . . . . . . . . . . . . . . . . . . . . . . 45

                                                                           1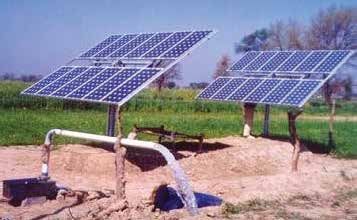
Teaching the “Duck” to Fly • Second Edition

                                                                          Acronyms
  GIWH           Grid-integrated water heating                                          MW               Megawatt
  ISO            Independent system operator                                            PV               Photovoltaic
  ISO-NE         New England Independent System Operator                                TOU              Time-of-use
  kWh            Kilowatt-hour                                                          UPS              Uninterruptible power supplies

                                                                      List of Figures

Figure 1    California Independent System Operator Duck Curve. . . . . . . . . . . . . . . . . . . . . . . . . . . . . . . . . . . . . . . . . . . 6
Figure 2    Illustrative Daily Load in 2020. . . . . . . . . . . . . . . . . . . . . . . . . . . . . . . . . . . . . . . . . . . . . . . . . . . . . . . . . . . . . 7
Figure 3    Duck Sitting in Water. . . . . . . . . . . . . . . . . . . . . . . . . . . . . . . . . . . . . . . . . . . . . . . . . . . . . . . . . . . . . . . . . . . . 7
Figure 4    Duck in Flight . . . . . . . . . . . . . . . . . . . . . . . . . . . . . . . . . . . . . . . . . . . . . . . . . . . . . . . . . . . . . . . . . . . . . . . . . 7
Figure 5    Change in Load Shape From Implementation of the Ten Strategies . . . . . . . . . . . . . . . . . . . . . . . . . . . . . . . . . 8
Figure 6    Duck Curve After Strategy 1. . . . . . . . . . . . . . . . . . . . . . . . . . . . . . . . . . . . . . . . . . . . . . . . . . . . . . . . . . . . . . 10
Figure 7    LED Device Efficacy and Price Are Expected to Continue to Improve Rapidly . . . . . . . . . . . . . . . . . . . . . . . . 11
Figure 8    Duck Curve After Strategies 1 and 2. . . . . . . . . . . . . . . . . . . . . . . . . . . . . . . . . . . . . . . . . . . . . . . . . . . . . . . . 13
Figure 9    Duck Curve After Strategies 1 Through 3. . . . . . . . . . . . . . . . . . . . . . . . . . . . . . . . . . . . . . . . . . . . . . . . . . . . 16
Figure 10   Duck Curve After Strategies 1 Through 4. . . . . . . . . . . . . . . . . . . . . . . . . . . . . . . . . . . . . . . . . . . . . . . . . . . . 19
Figure 11   Residential Electricity Demand by End-Use . . . . . . . . . . . . . . . . . . . . . . . . . . . . . . . . . . . . . . . . . . . . . . . . . . 20
Figure 12   Duck Curve After Strategies 1 Through 5. . . . . . . . . . . . . . . . . . . . . . . . . . . . . . . . . . . . . . . . . . . . . . . . . . . . 24
Figure 13   Duck Curve After Strategies 1 Through 6 . . . . . . . . . . . . . . . . . . . . . . . . . . . . . . . . . . . . . . . . . . . . . . . . . . . 28
Figure 14   Duck Curve After Strategies 1 Through 7 . . . . . . . . . . . . . . . . . . . . . . . . . . . . . . . . . . . . . . . . . . . . . . . . . . . 33
Figure 15   Duck Curve After Strategies 1 Through 8 . . . . . . . . . . . . . . . . . . . . . . . . . . . . . . . . . . . . . . . . . . . . . . . . . . . 37
Figure 16   Duck Curve After Strategies 1 Through 9. . . . . . . . . . . . . . . . . . . . . . . . . . . . . . . . . . . . . . . . . . . . . . . . . . . . 40
Figure 17   Projected US Electric Capacity Additions and Retirements. . . . . . . . . . . . . . . . . . . . . . . . . . . . . . . . . . . . . . . 44
Figure 18   The Duck Curve With All Ten Strategies Implemented. . . . . . . . . . . . . . . . . . . . . . . . . . . . . . . . . . . . . . . . . . 45
Figure 19   Ducks in Flight. . . . . . . . . . . . . . . . . . . . . . . . . . . . . . . . . . . . . . . . . . . . . . . . . . . . . . . . . . . . . . . . . . . . . . . . 45

                                                                       List of Tables

Table 1     Conventional and Recommended Smart Utility Rate Designs for Water Systems and Irrigation Pumps. . . . . .                                                     17
Table 2     US Water Heaters by Region (×1,000) . . . . . . . . . . . . . . . . . . . . . . . . . . . . . . . . . . . . . . . . . . . . . . . . . . . . . .               20
Table 3     Typical and Smart Rate Design Alternative for Commercial Customers . . . . . . . . . . . . . . . . . . . . . . . . . . . . .                                  29
Table 4     Load Factor and Maximum Hourly Ramping Requirements Before And After the Ten Strategies . . . . . . . . . .                                                   46

                                                                                    2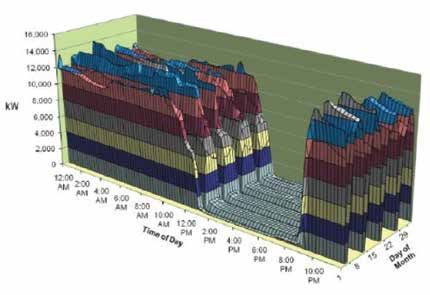
Teaching the “Duck” to Fly • Second Edition

                    Foreword to the Second Edition

T
            he First Edition of Teaching the “Duck” to Fly,          more favorable. Dozens of pilot programs for grid-
            released by The Regulatory Assistance Project            integrated water heating have proven this concept and
            (RAP) in January 2014, posed an integrated               will soon be deployed in many regions. The number of ice
            approach to the way utilities and regulators             storage and chilled-water storage air conditioning systems
examine the challenge of adapting to a power system                  has grown, but still reaches less than two percent of the
with significant variable renewable resources. Prior to              potential market. The Second Edition makes greater use of
that time, the focus of most analysts was simply on the              these highly reliable, low-cost resources to further smooth
strained flexibility of the remaining fossil generation fleet,       the utility load profile.
and the need to add flexible generation and electricity                  A new strategy has been introduced in the Second
storage resources, both of which have high costs. Teaching           Edition: control of water and wastewater pumping.
the “Duck” to Fly changed this, by focusing at least equal           These uses consume about seven percent of total US
attention on the flexibility that customer loads, low-               electricity. Water is very easy to store in tanks, reservoirs,
cost thermal storage, time-varying pricing, and other                and aquifers. In many cases, all that is needed to
simple strategies could provide in adapting to a two-way             stimulate management of these loads is a restructuring
system, relying equally on supply-side and customer load             of the electricity pricing to remove demand charges and
management.                                                          substitute time-varying energy charges. The potential can
   The First Edition was presented at meetings of US                 be even greater if water and wastewater utility planning
regulators, at the Florence (Italy) School of Regulation, and        is conducted interactively within electricity least-cost
to utilities and their regulators in China, India, the Middle        planning, so that, for example, increased water storage
East, Africa, and Australia. It was the subject of a series          capacity can become a substitute for increased electricity
of webinars, attracting a global audience. Feedback from             generation capacity.
these varied audiences was considerable, and the author,                 As in the original edition, the Second Edition starts with
RAP as an organization, and indeed the entire industry have          the load shape of an illustrative California utility, before
learned more in the intervening two years. Here are a few            and after addition of significant solar and wind resources.
lessons we take away from this experience.                           It then incrementally includes each of the strategies to
   Some of the concepts in the First Edition proved to be            produce a gradual change in the load shape. The “bottom
of limited value. For example, concentrated solar power              line” of this Second Edition is a package of measures that,
has not been well received in the market, mostly because             conservatively estimated but aggressively deployed, can
of the dramatic drop in the cost of solar photovoltaic               dramatically reshape the electricity load that must be
(PV) generation. West-facing solar is important where it             served by dispatchable resources. The “ending load factor”
is achievable, but the benefits are modest. In this Second           after the ten strategies is an impressive 86.5 percent, far
Edition, these are consolidated into a strategy for “peak-           higher than what exists today. Simply stated, it should be
oriented renewables,” that include wind sites with favorable         easy to adapt to the “Duck Curve” that emerges as variable
production characteristics and more disciplined use of               renewables are installed on utility grids around the world.
existing hydroelectric resources.                                        Finally, the author wants to thank a few of the many
   However, the First Edition also dramatically understated          people and organizations who helped examine, critique,
the potential of water heating and air conditioning                  and test the concepts proposed in the First Edition. These
storage technologies. These technologies have evolved                people have enhanced those ideas, tested them on real
quickly in recent years, and the economics are becoming              utilities and real utility customers, and helped make the

                                                                 3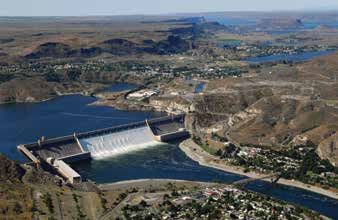
Teaching the “Duck” to Fly • Second Edition

Second Edition a much better product. These include:               • Calmac Corporation and Ice Energy, for assistance
• Burbank Water and Power, and its General Manager Ron               understanding the technology and economics of
  Davis, for quickly putting some of the concepts from               air conditioning storage, the other of the two most
  the First Edition to a reality test in California as that          important emerging strategies;
  utility expands from less than five percent renewables in        • The Northwest Power and Conservation Council, for
  2010 to 50 percent renewables by 2030, including the               a 30-year disciplined approach to evaluating energy
  strategies relating to water pumping, west-facing solar,           efficiency options, including the peak load value of
  air conditioning storage, rate design reform, inter-region         different energy efficiency measures that makes Strategy 1
  power trading, and time-varying pricing for electric               a well-recognized option; and
  vehicle charging loads;                                          • Finally, my many RAP colleagues who contributed
• The Hawaii Public Utilities Commission, Hawaiian                   to the original concept, and have helped expand my
  Electric Company, Kauai Island Utility Cooperative, and            own knowledge to make this Second Edition possible.
  Hawaii Energy, for embracing the concepts of Teaching              Stimulated by our founder, David Moskovitz, to
  the “Duck” to Fly and quickly expanding the state of the           continually challenge skepticism and to hatch and
  science in a very dynamic and challenging electricity              promote “Big Ideas” that can change the world, RAP is
  market;                                                            an incredible group of smart, creative people. It is a joy
• Steffes Corporation, Great River Energy, and the Peak              to work with them. Visit About RAP on the RAP website
  Load Management Association, for advancing the state               to meet all of these amazing people.
  of the science for water heater controls, one of the two
  most important emerging strategies in this paper;                                                                 Jim Lazar
                                                                                                          Olympia, Washington
                                                                                                                January 2016

                                                               4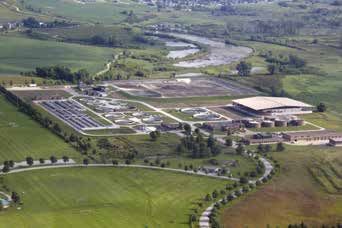
Teaching the “Duck” to Fly • Second Edition

Teaching the “Duck” to Fly:
10 strategies to control generation, manage demand, & flatten the Duck Curve

     Targeted Efficiency                               Rate Design
     Focus energy efficiency measures                  Focus pricing on crucial hours.
     to provide savings in key hours of                Replace flat rates & demand charge
     system stress.                                    rate forms with time-of-use rates.
                                                       Avoid high fixed charges.
     Peak-Oriented Renewables
     Add renewables with favorable hourly              Targeted Electric Storage
     production. Modify the dispatch                   Deploy storage to reduce need for
     protocol for existing hydro with                  transmission & distribution, & to
     multi-hour “pondage.”                             enable intermittent renewables.

     Manage Water Pumping                              Demand Response
     Run pumps during periods of low                   Deploy demand response programs
     load or high solar output, curtailing             that shave load during critical hours
     during ramping hours.                             on severe stress days.

     Control Electric Water Heaters                    Inter-Regional Power Exchange
     Increase usage during night & mid-                Import power from & export power to
     day hours, & decrease during peak                 other regions with different peaking
     demand periods.                                   periods.

     Ice Storage for Commercial AC                     Retire Inflexible Generating Plants
     Convert commercial AC to ice or                   Replace older fossil & nuclear plants
     chilled-water storage operated during             with a mix of renewables, flexible
     non-ramping hours.                                resources, & storage.

                                               5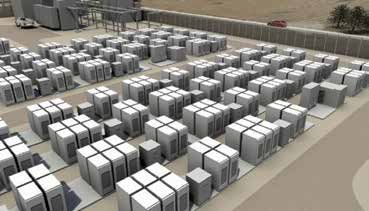
Teaching the “Duck” to Fly • Second Edition

        Introduction: Teaching the “Duck” to Fly

T
           he electric sector      Figure 1
           has become
           very sensitive                        California Independent System Operator Duck Curve1
                                       28,000
           to the load
                                                                          Net load - March 31
shape of emerging utility              26,000
requirements as increasing
                                       24,000
penetration of wind
and solar energy creates               22,000
challenging “ramping” issues
                                  Megawatts

                                                                                            2012
                                       20,000                                              (actual)
for conventional generation                                                                                      Ramp need
                                                                                            2013 (actual)
in the morning and evening,            18,000                                                                    ~13,000 MW
as renewable energy supplies                                                                2014                 in three hours
                                       16,000
                                                                                            2015
wax and wane.                                                                               2016
                                       14,000
   Fundamentally, this                                                         2018         2017
                                                                               2019
issue is no different from             12,000                                               2020
the problem utilities have                                 Overgeneration risk
                                       10,000
addressed for over a century:
adapting the supply of
                                            0
energy to match changing                      12am        3am   6am        9am        12pm          3pm      6pm       9pm
consumer demand. The
difference is that daily
and seasonal usage patterns and the resources that have             What is now being referred to as “the Duck Curve”
historically served that pattern have evolved gradually over (Figure 1) is a depiction of this emerging change that has
the last 125 years, whereas the renewable energy revolution become commonly recognized throughout the electric
is creating new challenges in a much shorter period of time. sector. Over time, as more solar and wind energy are added
   Addressing this problem will require a change in the          to the grid, the “net load” to be serviced from dispatchable
way utility power supply portfolios are formulated, but          resources (the duck’s belly) sags in the middle of the
solutions are at hand. Fortunately, we have technologies         solar day when solar generation is highest, but the load
available to us that our great-grandparents did not.             to be served in the early evening after the sun goes down
   Previously, the utility’s role was to procure a least-cost    continues to grow (the head) and the transition between
mix of baseload, intermediate, and peaking power plants          the two gets more severe (the neck).
to serve a predictable load shape. Today, utilities have            This paper attempts to model the options for a hypothet-
to balance a combination of variable generation power            ical, illustrative electric utility facing its own duck curve.
sources, both central and distributed, together with             Our illustrative utility is expected to add 600 megawatts
dispatchable power sources, to meet a load that will be          (MW) of distributed solar, 1,250 MW of utility-scale solar,
subject to influence and control through a combination           and 725 MW of wind capacity in response to a state
of policies, pricing options, and programmatic offerings.
This now includes the capability to dispatch customer
loads, including water heating, air conditioning, and water      1 California ISO. (2013). What the duck curve tells us about
pumping, strategies at the heart of this paper.                       managing a green grid.

                                                                   6
Teaching the “Duck” to Fly • Second Edition

                  Figure 2

                                                  Illustrative Daily Load in 2020
                         4,000

                         3,500

                         3,000

                         2,500
                    MW

                         2,000

                         1,500

                         1,000
                                          Total Load
                          500
                                          Load Net of Wind and Solar
                            0
                           		 1   2   3   4   5   6    7   8   9 10 11 12 13 14 15 16 17 18 19 20 21 22 23 24
                                                                        Hours

renewable portfolio standard by the year 2020. Figure 2                   the ramping down of conventional supply in the morning
illustrates an hourly demand and net demand (net of solar                 (as solar generation increases) and rapid ramping up in
and wind) analysis for this utility on a sample day, before               the afternoon hours (as loads increase but solar energy
any of the options are considered.2                                       supplies drop off quickly) is even more sharp, creating
    The total load line in Figure 2 shows the utility’s                   operational concerns for the utility. This “net load” to be
projected total load, by hour, during the day. The “load                  served by conventional dispatchable generating resources
net of wind and solar” line shows the load that the utility               must be met with the existing or emerging generation fleet.
will face after expected wind and solar generation serve a                This challenge is causing some utilities to assert that the
portion of the total load. Figure 2 shows that the overall                proportion of energy needs met by variable generation
load has a moderate diurnal shape, but when the wind                      resources needs to be limited. Although some utilities
and solar energy expected by 2020 are added to the mix,                   may argue that variable renewable energy can be relied on

Figure 3                                                                  Figure 4
                  Duck Sitting in Water                                                           Duck in Flight

2   It should be noted that this illustrative day is a light load:            to represent a “normal” or “summer peak” day. It is selected
    a heavy renewable energy generation day such as one that                  to illustrate the opportunities available to meet a particularly
    might be experienced in the spring or fall. It is not intended            challenging situation.

                                                                      7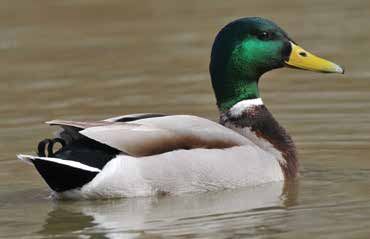
Teaching the “Duck” to Fly • Second Edition
only for a small portion of daily energy requirements, this scope of this paper, will need to be tailored to address
paper discusses strategies that enable high levels of energy local resource capabilities, system constraints, and other
needs to be served, provided that pricing and technology to considerations.
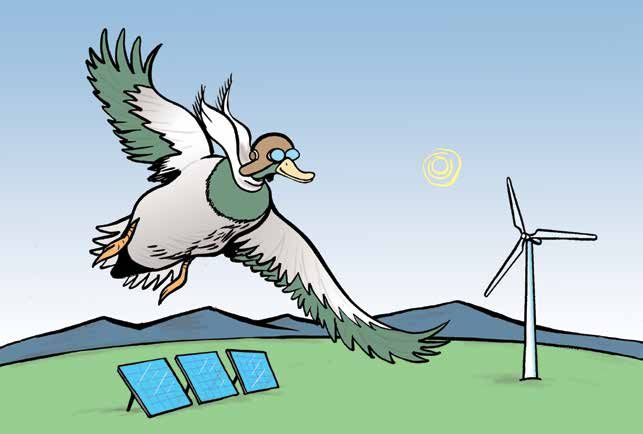
increase the flexibility of loads are employed. Depictions of future load like those in Figure 1 have
This paper identifies a number of low-carbon strategies entered the industry vernacular as “the Duck Curve” for
that can be applied to meet this challenge. These strategies obvious reasons. In actuality, however, ducks vary their
are generally limited to existing commercially available shape depending on different circumstances, and as
technologies, but perhaps deployed in ways that have not explained here, utility load shapes can do the same.
been done on a commercial scale to date. These strategies A duck in water tends to center its weight in the water,
not only enable greater renewable integration, they enhance floating easily. Figure 3 shows the duck shape commonly
system reliability and reduce generation and transmission associated with the graph in Figure 1.
capital and fuel costs by modifying the load profiles and A duck in flight, however, stretches out its profile to
better utilizing existing transmission assets. Not every create lower wind resistance in flight. This is illustrated in
strategy will be applicable to every region or utility around Figure 4.
the country, and every region will have additional strategies Metaphorically, our goal is to teach the “duck” in
that are not among these ten. Figure 2 to fly, by implementing strategies to both flatten
Specific implementation plans, which are beyond the the load and to introduce supply resources that can deliver
Figure 5
Change in Load Shape From Implementation of the Ten Strategies
4,000
Pre Strategies Load
3,500
3,000
2,500
MW
2,000
1,500
1,000
Total Load
500
Load Net of Wind and Solar
0
1 2 3 4 5 6 7 8 9 10 11 12 13 14 15 16 17 18 19 20 21 22 23 24
Hours
4,000
Post Strategies Load
3,500
3,000
2,500
MW
2,000
1,500
Post Strategies Total Load
1,000
Post Strategies Net Load
500
Original Net Load
0
1 2 3 4 5 6 7 8 9 10 11 12 13 14 15 16 17 18 19 20 21 22 23 24
Hours
8Teaching the “Duck” to Fly • Second Edition
more output during the late afternoon high load hours. Strategy 4. Control electric water heaters to reduce peak
Many of these strategies are already used on a modest scale demand and increase load at strategic hours;
in the United States and European Union, whereas others Strategy 5. Convert commercial air conditioning to ice
use technologies that have been proven in pilot programs storage or chilled-water storage (greatly increased in
but are not yet deployed on a commercial scale. None magnitude in the Second Edition);
require new technology and each has a small (or negative) Strategy 6. Rate design: focus utility prices on the
carbon footprint. “ramping hours” to enable price-induced changes in
Figure 5 shows the change in shape of the Duck Curve load;
from the cumulative application of the ten strategies we Strategy 7. Deploy electrical energy storage in targeted
propose below. Like an actual duck, it becomes more locations;
streamlined and better able to “take flight.” Strategy 8. Implement aggressive demand-response
We include the following ten strategies in our analysis: programs;
Strategy 1. Target energy efficiency to the hours when load Strategy 9. Use inter-regional power exchanges to take
ramps up sharply; advantage of diversity in loads and resources;3 and
Strategy 2. Acquire and deploy peak-oriented renewable Strategy 10. Retire inflexible generating plants with high
resources (Strategies 2 and 3 in the original paper); off-peak must-run requirements.
Strategy 3. Manage water and wastewater pumping loads
(new in the Second Edition);
3 For a complete set of regional strategies consistent with Meeting Renewable Energy Targets in the West at Least Cost: The
this step, see: Schwartz, L., Porter, K., Mudd, C., Fink, Integration Challenge. Western Governors’ Association.
S., Rogers, J., Hogan, M., Lamont, D., & Kirby, B. (2012).
9Teaching the “Duck” to Fly • Second Edition
Strategy 1:
Target Energy Efficiency to the Hours
When Load Ramps Up Sharply
Strategy Description:
Acquire energy efficiency measures with a focus on measures
that provide savings in key hours of system stress.
Amount:
11 percent of total system load, with a 4:1 ratio of on-peak to
off-peak consumption (compared to a 3:1 ratio for overall load).
Figure 6
Duck Curve After Strategy 1
4,000
3,500
3,000
2,500
MW
2,000
1,500
1,000
Post Strategy Total Load Original Total Load
500
Post Strategy Net Load Original Net Load
0
1 2 3 4 5 6 7 8 9 10 11 12 13 14 15 16 17 18 19 20 21 22 23 24
Hours
T
he rapid increase in loads to be served from the system load, with contributions to peak load reduction
dispatchable resources between 4 PM and 7 PM about twice as great as the impact during off-peak hours.
that dominates the Duck Curve is made up of But many measures are available that have a higher level
discrete elements of electricity usage primarily of peak-orientation. We address three of these: residential
in the residential and commercial sectors. It is a period lighting, air conditioning, and office building lighting
when office building loads continue, while residential loads controls.
increase as residents return from school and work. People Residential lighting, particularly kitchen-area lighting, is
come home, turn on televisions, start cooking, and, in concentrated around morning and evening peak periods.
the winter, use significant amounts of lighting. This late- Higher-efficiency LED lighting is quickly becoming
afternoon convergence of residential and commercial loads inexpensive, reliable, and of increasing efficacy. By 2020,
causes system peaks on most utility systems. efficacy (light output per watt of energy input) is forecast
Overall, energy efficiency has about the same shape as to be three times that of current CFL lamps. Thus, the
10Teaching the “Duck” to Fly • Second Edition
Figure 7
LED Device Efficacy and Price Are Expected To Continue to Improve Rapidly
300 $20.00
$18.00
250
Efficiancy (lumens/watt)
$16.00
Cost ($1/1,000 lumens)
200 $14.00
$12.00
150 $10.00
$8.00
100
$6.00
50 $4.00
$2.00
0 $0
2010 2012 2015 2020
Cool White Efficacy Warm White Efficacy
Cool White Price Warm White Price
residential lighting load, already cut in half with CFL energy management systems can control lighting so that
programs over the past decade, can be cut in half again smaller zones are controlled, providing adequate light for
with LED retrofits. The reduction in afternoon lighting also remaining workers, and zoned lighting during custodial
brings with it a reduction in residential air conditioning work, without needing to light entire floors. As much as
requirements, because less energy is released as heat. one-half of office lighting loads can be curtailed during the
Figure 7 shows the expected improvement in LED 5 PM to 8 PM ramping hours without significant adverse
lighting efficiency and reduction in LED lighting cost impacts on building users.
over this decade. This suggests that even LED to LED High-efficiency residential air conditioners are an
replacement of early-vintage LED lighting may be cost- exemplary opportunity, because of the great opportunity
effective to reduce late afternoon peak usage. to improve efficiency and the high peak-concentration of
Street lighting is unique in that it is only used during this load. These loads represent approximately ten percent
hours of darkness, beginning with the early-evening of total residential sales, but up to 70 percent of residential
ramping hours. LED street lights can achieve a 30- to peak demands. Simple measures, such as Energy Star®
70-percent reduction in ramping period lighting needs. replacements of window and central air conditioners can
Lighting in the retail sector is another area in which produce 30- to 50-percent reductions in this load. More
efficiency opportunities are considerable, but because that expensive alternatives, including ground-source heat
sector uses light throughout the day and into the evening, pumps, can produce 60- to 80-percent reductions in this
this efficiency will reduce not only peak demands that load. Ice storage and chilled-water storage air conditioning
cause a ramping need, but also mid-day demands that are discussed in Strategy 3, for commercial and institutional
support minimum-level operations for power plants needed buildings, but are not considered commercially available for
during the ramping period. Although the energy savings are residential-scale applications.
significant, the ramping benefits may be small. Strategy 1 assumes that the illustrative utility can reduce
The office lighting sector presents a different its peak load by 16 percent, and off-peak loads by one-half
opportunity. Workers in office buildings generally depart that amount, with efficiency programs that target peak and
the office between 4 PM and 6 PM, depending on their ramping period loads. Figure 6 shows the effect of this
starting time and work load. Often entire floors remain strategy on the loads of the illustrative utility.
lit until the last worker has departed. Modern building
11Teaching the “Duck” to Fly • Second Edition
Updates from the First Edition
The magnitude of the energy efficiency opportunity for
air conditioning is dramatically greater in most areas of the Controls Save Energy
country than was assumed in the First Edition. The previous Lighting Energy Savings Due to Lighting Controls
edition included energy efficiency equal to only five percent Multi-tenant Corporate Hospital Major Sports
Energy Management Office Bldg Office Bldg Admin Bldg Complex
of the total load. In this edition, that has been increased to Strategies 300K ft2 400K ft2 175K ft2 1.3M ft2
11 percent of total load. This is a level of achievement that Adaptive Scheduling 14% 9% 22% 24%
all the top states of the American Council for an Energy- Daylight Harvesting 1% 4% 8% 3%
Efficient Economy ratings4 have achieved. Lighting Limits 9% 11% 13% 5%
Occupancy Control 31% 25% 25% 37%
Efficient kitchen lighting, including LED ceiling Personal Task Control 6% 11% 2% 2%
and task lighting, can reduce the kitchen lighting load Load Shedding 0% 5% 3% 5%
by more than 50 percent. Because kitchen lighting Cumulative Savings Due to
is used primarily during morning and early evening Addressable Lighting Controls 61% 65% 73% 76%
peak periods, this is an ideal target to reduce ramping
requirements resulting from high solar deployment. Commercial building lighting controls can produce
immense overall savings.
Office buildings are a key target for this strategy, because
office occupancy drops off at the time of the late afternoon
ramping period, but office lighting often remains on until
the last workers leave and janitorial tasks are completed.
Zoned lighting controls can preserve lighting for those still
working, while reducing total building usage by up to two-
thirds.
Line losses are highest
during peak hours, because
Ground source heat pumps are up to five times as they increase exponentially with
efficient as other heating and cooling systems, because the demand on the distribution
they rely on a stable underground temperature geothermal system.5 Most of the strategies
resource. in this paper are directed at
These can dramatically reduce afternoon cooling reducing peak loads, and
needs—and winter heating requirements, when replacing energy efficiency is Strategy 1.
conventional electric heat. Reducing peak loads can
sharply reduce line losses.
Source: Flickr, Bob Mullica
4 Massachusetts, Rhode Island, California, Oregon,
Connecticut, Vermont, New York, Washington, Illinois,
Minnesota, and Maryland. Retrieved from http://aceee.org/
state-policy/scorecard.
5 Lazar, J., & Baldwin, X. (2011). Valuing the Contribution of
Energy Efficiency to Avoided Marginal Line Losses and Reserve
Requirements. Montpelier, VT: The Regulatory Assistance
Source: ClimateMaster, Inc. Project.
12Teaching the “Duck” to Fly • Second Edition
Strategy 2:
Acquire and Deploy Peak-Oriented
Renewable Resources
Strategy Description:
Acquire wind, solar, or hydro resources that have favorable hourly
production. Modify the dispatch protocol for existing hydro resources
with multi-hour pondage.
Amount:
Substitution of anticipated renewable portfolio with 100 MW of
solar PV oriented to the west; 100 MW of solar in the form of
solar thermal with 3-hour storage capacity; 100 MW of wind with
late afternoon/early evening concentration of output.
Figure 8
Duck Curve After Strategies 1 and 2
4,000
3,500
3,000
2,500
MW
2,000
1,500
1,000
Post Strategy Total Load Pre Strategy Total Load
500
Post Strategy Net Load Pre Strategy Net Load
0
1 2 3 4 5 6 7 8 9 10 11 12 13 14 15 16 17 18 19 20 21 22 23 24
Hours
M
any utilities have acquired renewable energy These options include:
from wind and solar facilities to comply Storage Hydro Facilities. Most hydro facilities have
with state renewable portfolio standards. lakes or at least “pondage” where the water is stored before
These standards typically apply to an annual flowing through turbines to produce power. These projects
obligation and do not differentiate between times when allow the utility to produce power when it is most valuable,
the renewable energy is produced. We have learned that and, in many cases, utilities have installed additional
timing does matter. Fortunately, there are many renewable turbines on dams to increase their hydro potential. The
resources that produce energy at favorable times of the day, largest example of this is the Third Powerhouse at Grand
or can be controlled or modified to do so. Coulee Dam, which adds 4,500 MW of peaking capacity
13Teaching the “Duck” to Fly • Second Edition
but involves no additional storage, and adds little in most annual kWh. Time-varying prices will induce these
the way of additional annual energy production. There producers to install tracking systems or west-facing panels
are some facilities that are strictly run-of-river or purely to increase generation during the ramping hours when
as-available, and those do not offer any flexibility. In generation may be most valuable.
addition, some hydro projects are subject to fish, irrigation, Solar/Thermal. These power plants gather sunlight and
navigation, flood control, and other operating conditions concentrate it to heat water or another fluid that drives a
that may limit productivity. conventional turbine to produce electricity. Storage of the
Wind Site With Favorable Characteristics. Wind heated fluid allows for production of electricity several
energy sites are normally developed only after extensive hours after the sun has set, producing a more valuable
monitoring of wind conditions. Some locations are most product.
productive in the night-time hours, and others in day- Figure 8 shows the load shape for our illustrative utility
time hours. Seeking sites with favorable late afternoon if 100 MW of solar facilities were west-facing, if 100 MW
production can provide a favorable resource addition to the of solar-thermal with storage were installed instead of PV,
utility system. and if 100 MW of wind energy with favorable afternoon
West-Facing Solar Panels. These produce power production were selected. We have not included any
up to two hours later in the afternoon than south-facing redispatch of hydro resources, as that option is only
panels do, but produce fewer annual kilowatt-hours available to utilities with flexible hydro generation in their
(kWh). Without time-differentiation in compensation, solar fleet.
system owners will choose the easiest installation with the
14Teaching the “Duck” to Fly • Second Edition
Updates from the First Edition
Additional research may identify other projects with
favorable patterns. Additional interconnections between
Texas and other grids may enable higher levels of wind
production in all areas.
Average daily generation profile (kW) from
rooftop PV systems for south and west systems
4
South system 6:00 pm
3
2
1
0
0:00 3:00 6:00 9:00 12:00 15:00 18:00 21:00
4
Hoover Dam and many other hydro facilities, 3
West system
particularly in the western states, typically have only 2
enough water to operate the turbines a few hours per 1
day. By scheduling that operation in the ramping 0
hours, the utilities receiving this power can both 0:00 3:00 6:00 9:00 12:00 15:00 18:00 21:00
receive a carbon-free resource and use that resource to Source: Pecan Street Research Institute. (2013). South-facing solar cut
better integrate variable wind and solar resources. peak demand from grid 54% - west-facing systems 65%.
Some wind projects have favorable afternoon This figure demonstrates that west-facing PV projects
production patterns. This graph compares the expected produce useful output up to two hours longer in the
production from the Gallegos Wind Farm in New Mexico, evening, when the most serious ramping challenges are
where production peaks closer to 7 PM in the evening, experienced.
to the typical wind pattern found in West Texas, where
electricity peak production is closer to 10 PM. Using solar-thermal generators in place of PV systems
provides the opportunity to store solar energy in the form
of superheated fluids or salts, allowing generation to occur
Annual 80-m Diurnal Wind Energy Patterns hours after the solar energy has been gathered.
60 Steam Condenser
Gallegos Ranch Electricity
Mean Net Capacity Factor (%)
50 Thermal Storage
Tanks
Receiver
40 Generator
Turbine
West Texas
30 Parabolic Troughs
Source: EcoMENA. (2015). CSP-Powered Desalination Prospects in MENA
Source: Gallegos Wind Farm, LLC
20
0 1 2 3 4 5 6 7 8 9 10 11 12 13 14 15 16 17 18 19 20 21 22 23
Hour (MST)
15Teaching the “Duck” to Fly • Second Edition
Strategy 3:
Manage Water and Wastewater Pumping Loads
Strategy Description:
Control water and wastewater pumps to operate during periods of
low existing load or high solar output, curtailing pumping load
during ramping hours.
Amount:
100 MW of pumping load (two percent of total system load) controlled to
decrease usage in ramping hours and increase usage in off-peak hours.
Figure 9
Duck Curve After Strategies 1 Through 3
4,000
3,500
3,000
2,500
MW
2,000
1,500
1,000
Post Strategy Total Load Pre Strategy Total Load
500
Post Strategy Net Load Pre Strategy Net Load
0
1 2 3 4 5 6 7 8 9 10 11 12 13 14 15 16 17 18 19 20 21 22 23 24
Hours
T
his is a new strategy in Teaching the “Duck” between two set-points: a minimum level in the reservoir
to Fly. Nationally, water pumping consumes or tank, and a maximum level. The water purveyor is
approximately seven percent of our electricity; relatively indifferent as to when pumps operate within this
in California it is much higher than this, owing constraint, and it is possible to add storage capacity to take
to long-distance transmission of water from northern advantage of lower-cost electricity prices.
California to southern California, and high irrigation In many parts of the world, irrigation systems are now
pumping loads. The category includes electricity used for being operated directly with solar PV power, with the
water well production, water transmission, irrigation, water systems sized to the daily pumping water requirement. This
treatment, water distribution, and wastewater treatment. direct use of solar electricity eliminates the grid and grid
Water pumping is a unique opportunity to shift load, management entirely.
because water is a physical good that can be stored in water Most utilities have demand-charge rate designs that
tanks and reservoirs. Most water system pumps operate impose a significant charge based on the highest level
16Teaching the “Duck” to Fly • Second Edition
Table 1 the use of larger pumps operated off-peak. We discuss rate
design in greater detail in Strategy 7.
Conventional and Recommended Even California utilities that have time-varying energy
Smart Utility Rate Designs for rates generally impose a “distribution demand charge” that
Water Systems and Irrigation Pumps
creates the incentive to run pumps during all hours. By
Conventional Rate Design Smart Rate Design Alternative eliminating demand charges during off-peak periods, and
for Water Pumping for Water Pumping recovering system capacity costs in time-varying energy
Demand $10/kW Demand None rates, electric utilities can replace this incentive with a
reward for installing larger pumps that run only at low-cost
Energy Energy
periods, to provide the same overall level of service.
All Hours $0.10/kW Ramping Hours $0.15/kW This strategy assumes that our illustrative utility has
All Other Hours $0.10/kW approximately 150 MW of pumping load at all hours, and
that two-thirds of this load can be shaped into desired
hours. One-third is assumed to be essential to maintain
of usage during the month. This type of rate design distribution system pressure for reliable water service, and
encourages water and wastewater utilities to install is not controlled.
relatively small pumps, and operate them at a uniform level Figure 9 depicts the change in our illustrative utility load
throughout the day. Table 1 presents a typical utility rate shape after re-dispatch of water and wastewater pumping
design that applies to water system and irrigation pumps, loads.
and a smarter alternative rate design that would encourage
17Teaching the “Duck” to Fly • Second Edition
Updates from the First Edition
Direct use of PV electricity for water pumping in
India.
Water wants to return
to this level
Pumping Pressure
station created
Source: Bright Mags. (undated). How do water towers work?
Municipal water supply pumping normally keeps water
Source: Surya Urza Enterprises in a tank or reservoir from which water flows using gravity;
this eliminates the need for standby generators.
Low-energy precision application irrigation By filling the tank or reservoir when low-cost power
can put the correct amount of water directly onto the is available, and turning off pumps during ramping
crops. periods and high-cost periods, the water pumping load is
Scheduling irrigation pumping to exclude key shifted, with no impact whatsoever on water customers.
peak hours has little effect on crop production, and a
potential significant economic savings for farmers.
Source: Natural Resources Conservation Service
Source: City of Iowa City
The Iowa City wastewater treatment plant has a
maximum capacity of 24 million gallons per day but
normally treats only about 10 million gallons per day.
The onsite storage capacity allows some flexibility as
to when pumping and treatment are scheduled.
18Teaching the “Duck” to Fly • Second Edition
Strategy 4:
Control Electric Water Heaters to Reduce Peak Demand
and Increase Load at Strategic Hours
Strategy Description:
Control electric water heaters to increase electricity usage during
night hours and mid-solar-day hours, and decrease usage during
morning and evening peak demand periods.
Amount:
70 MW (approximately 16,000 units) of electric water heaters
controlled to provide high reliability of hot water service, low draw of
hot water heaters during key morning and evening hours, and increased
draw of water heater loads during off-peak and solar-day hours.
Figure 10
Duck Curve After Strategies 1 Through 4
4,000
3,500
3,000
2,500
MW
2,000
1,500
1,000
Post Strategy Total Load Pre Strategy Total Load
500
Post Strategy Net Load Pre Strategy Net Load
0
1 2 3 4 5 6 7 8 9 10 11 12 13 14 15 16 17 18 19 20 21 22 23 24
Hours
T
he United States has about 45 million electric By their nature, water heater tanks are energy storage
water heaters in service. After space conditioning, devices; each water heater is, in effect, a 15-kWh battery
water heating is one of the largest components of waiting to be used, because the water can be heated when
residential electricity demand (Figure 11). This power is most available, and the hot water used at a later
hot water use is concentrated in the morning and evening time. Although the normal pattern of hot water use (and
hours, when residential consumers are getting up in the water heater electricity use) is concentrated in the morning
morning, and again when they return home at the end of and evening, in a world with high levels of variable
the day, contributing significantly to peak demands. renewables, it may make more sense to charge these water
19Teaching the “Duck” to Fly • Second Edition
Figure 11 Table 2
Residential Electricity Demand by End-Use U.S. Water Heaters by Region (×1,000)
Other Water Heating North- Mid-
12% 9% US east west South West
Computers
3% Total 115,745 21,085 25,896 42,893 25,871
Cooking
4% Electric 48,607 5,149 8,005 28,363 7,090
Wet Cleaning Space
Conditioning Market Share 42% 24% 31% 66% 27%
7%
31%
Electronics heaters, monitoring water heater storage levels and hot
11%
water usage, and feeding each water heater sufficient power
to ensure that shortages are not experienced. Second,
Refrigeration installing larger tanks to ensure a full day’s supply without
9% Lighting
14% active management during the day. Third, substitution of
Source: Department of Energy (2012). Buildings Energy Data Book. heat pump water heaters to also reduce total kWh usage,
Table 2.1.5. operated at controlled times, together with larger tanks to
ensure adequate supplies.
Although electric water heating is dominant in the
heaters at night (wind) or at mid-day (solar). Pacific Northwest and in the South, every region of the
Control of these water heaters could provide the shaping country has millions of electric water heaters (Table 2).8
and storage to integrate up to 100,000 MW of additional Even the investor-owned utilities in California have
variable wind and solar energy in the US grid. The simple about ten-percent electric water heat saturation, or about
arithmetic: a water heater uses about 4,000 kWh/year; each one million installed units. Using these water heaters to
1 kW of wind or solar generation produces about 2,000 help balance the loads and resources of an electric utility
kWh/year. Essentially, each controlled water heater can will require new institutional arrangements with customers,
provide the flexibility needed for about 2 kW of wind or but the controls can easily be installed and managed.
solar generation. Several vendors, including Steffes Corporation, Sequentric,
In 2013, Maui Electric Company curtailed approximately and Integral Analytics, are working with many utilities
18 percent of the wind energy available from local wind already.
farms owing to system flexibility limitations.6 Hawaiian Control of one million electric water heaters means that
Electric estimated in 2014 that control of 6,300 electric up to 4,400 MW of load could be “turned on” as needed
water heaters in Maui would enable them to resolve the to absorb wind or solar energy, and that up to 1,000 MW
frequency excursion issues resulting from a 30-MW wind of water heating load that occurs during periods of high
farm.7 demand could be “turned off” as needed to manage peak
Water heaters are excellent targets for load control, and loads. In addition, up to 10,000 MWh per day of electricity
more than 100 rural electric cooperatives already have consumption could be shifted between time periods as
simple load controls on electric water heaters. By shifting needed.
water heating load from morning and evening to mid-day
(when the solar bulge may appear) and overnight (when
wind and thermal capacity is underutilized), water heat
energy requirements can be served more economically. But 6 Maui Electric. (2013). Understanding Renewable Energy and
water heaters can also be controlled on a minute-to-minute Wind Energy Integration.
basis to provide voltage support and frequency regulation 7 Hawaiian Electric Company. (July 28, 2014). Demand
service to the grid at a much lower cost than generating Response Report. Docket No. 2007-0341, p 64.
units or batteries. 8 KEMA. (2010). 2009 California Residential Appliance
Three different approaches to grid-integrated water Saturation Study. Prepared for the California Energy
heating (GIWH) have promise. First, active control of water Commission.
20Teaching the “Duck” to Fly • Second Edition
For our illustrative utility, with about ten percent of this very important to secure this resource.
statewide total load, full implementation of water heater Implementation of this strategy is best achieved with a
controls on 100,000 electric water heaters would enable it to combination of program elements, including:
add about 400 MW at any single hour, and to shift a total of • A first-cost rebate that covers at least the incremental
about 1,000 MWh of energy between periods of the day. cost of a GIWH unit over a standard unit to make it
To be conservative, we use only one-half of this total the economical choice at the time of purchase;
(a maximum of 200 MW in any hour, and 500 MWh • A monthly bill credit to customers who participate in
cumulative in any 24-hour period) to recognize that some a GIWH program to make it economical for renters
water heat energy use already occurs at times convenient and homeowners;
to a solar/wind influenced power system, and that the • A manufacturer and vendor incentive program to
quality of water heating service must not be impaired. ensure high availability and strong marketing;
This potential storage resource is charged both during • A multi-family housing retrofit program, providing
mid-day solar hours and overnight off-peak hours. This funding and technical support to this easily targeted
is a conservative implementation compared with projects group of customers; and
being advanced in Canada and Hawaii to use electric water • A utility service standard that requires new electric
heating controls to add system flexibility.9 water heaters to enroll in GIWH programs.
Electric water heating is more prevalent in multi-family Figure 10 shows our illustrative utility load after control
housing, manufactured housing, and rental housing than in of 70 MW of electric water heating, equal to about four
the general population. These are lower-income consumers percent of the residential customer base; in regions with
who may benefit greatly from the potential for lower energy higher penetration of electric water heating than is found in
bills, but are less likely to have funds available to invest in California, the potential would be much greater.
capital improvements. For this reason, program design is
9 Integral Analytics (Kallock). (2013). Renewable Integration
Utilizing GIWH Technology. Peak Load Management
Association.
21Teaching the “Duck” to Fly • Second Edition
Updates from the First Edition
Real-World Illustrations of the Value of
Grid-Integrated Water Heating
Option 1. Active Management
Courtesy of Steffes Corporation
The grid operator or demand-response program manager
actively monitors customer hot water levels and usage.
Power flows to each water heater are optimized to ensure
hot water availability, and to provide both diurnal storage
and ancillary services to the utility. Water can be heated to
a higher temperature and blended with cold water at the Ancillary services: The red line shows the PJM frequency
outflow pipe to increase thermal storage capacity. regulation signal; the blue line is the minute-by-minute
Left: GIWH control unit, following of that signal by a GIWH unit. Because they
installed on an electric water can be operated second-by-second, GIWH provides more
heater. accurate voltage support and frequency regulation than
generating units at a fraction of the cost of batteries.
Below: Control panel available to
grid operator showing available Option 2. Larger Tanks
Courtesy of Sequentric
storage and total storage capacity
in a water heater.
A larger tank with three heating elements is installed;
the utility controls the lower element, while customer hot
water usage controls the upper element. The customer has
as much hot water under their own usage-driven control as
a conventional tank.
Variable-Capacity Grid Interactive Water Heater
US Patent 8,571,692
4,500 Watt
Upper Element
Conventional
Water Heater
4,500 Watt
Middle Element
Utility Controlled
Grid-Interactive
Pre-Heater 4,500 Watt
Bottom Element
Illustration of hourly data for two days’ operation of a
group of nine households with GIWH; red illustrates the
water heater “charging” with solar or wind-supplied energy;
blue depicts hourly consumption of hot water. Green shows Above, Sequentric’s patented variable-capacity grid-
the storage of available hot water in each hour. interactive water heater.
22Teaching the “Duck” to Fly • Second Edition
Option 3. Controlled Heat-Pump Water Heater Using Water Heater Controls to
Serving Multiple Apartments Integrate Wind Power
Courtesy of Washington State University Energy Program According to the Hawaiian Electric Company’s10
Integrated Demand Response Portfolio Plan, GIWH can be
A large-capacity split-system heat pump water heater remotely turned on and off rapidly, making them a source
is installed to serve the demands of multiple apartment of regulating reserves with the potential to “counterbalance
units. Sufficient storage is installed to allow control of the the intermittency of a given wind or solar power source.”11
heat pump unit for off-peak hours only. Total kWh usage is Additionally, a “simulation of the results showed that
reduced by two-thirds, and all of this is during controlled approximately 6,300 units would be needed to effectively
usage periods. Hot water metering can also be used to counterbalance the frequency excursions associated with a
assign costs to the individual apartment units. 30-MW wind farm on Maui. Furthermore, results indicate
that customer comfort is not affected by the controlled use
of GIWH, and surveys point to strong customer interest.”12
10 Hawaiian Electric Company, Inc., Hawaii Electric Light 11 Hawaiian Electric Company Inc. (July 28, 2014). p. 64.
Company, Inc., and Maui Electric Company, Ltd, submitted
12 Hawaiian Electric Company Inc. (July 28, 2014).
in No. 2007 0341, in compliance with Hawaii Public
Utilities Commission Decision and Order No. 32054,
April 28, 2014.
23Teaching the “Duck” to Fly • Second Edition
Strategy 5:
Convert Commercial Air Conditioning to
Ice Storage or Chilled-Water Storage
Strategy Description:
20 percent of commercial air conditioning converted to ice storage or
chilled-water storage technologies; compressors and chillers operated
during the solar day and at night, and curtailed during ramping hours.
Amount:
200 MW of chiller and compressor load controlled to
decrease usage in ramping hours and increase usage in off-peak hours;
no net kWh savings assumed
Figure 12
Duck Curve After Strategies 1 Through 5
4,000
3,500
3,000
2,500
MW
2,000
1,500
1,000
Post Strategy Total Load Pre Strategy Total Load
500
Post Strategy Net Load Pre Strategy Net Load
0
1 2 3 4 5 6 7 8 9 10 11 12 13 14 15 16 17 18 19 20 21 22 23 24
Hours
A
ir conditioning (AC) is a huge contributor In the commercial sector, air conditioning units are large
to peak demands for most US utilities. Late enough that it is cost-effective to install ice or chilled-water
afternoon loads can triple between a cool day storage capacity to shift the cooling load. Ice storage is
and a hot day. possible for systems such as those installed on strip malls
Air conditioning takes several forms. In the residential that rely on five-ton rooftop units, as well as the large
sector, there are window air conditioners, central air 1,000-ton central chiller systems installed in high-rise
units, and ductless air conditioners. Reducing the load of buildings. Chilled-water storage is an alternative anywhere
residential air conditioners by 50 percent is achievable with a central chiller unit is used, and the real estate required
structural improvements and equipment retrofits. These are for large tanks is available; university campuses are typical
all considered as part of Strategy 1, targeted energy efficiency. applications. We call all of these “storage AC” in this strategy.
24Teaching the “Duck” to Fly • Second Edition
Storage AC is not a very complex technology, although into making ice or chilled-water storage that can provide all
sophisticated electronic control systems can optimize the of the “cold” during peak hours. A minimum AC load of
use of the investment. Most of us have an ice-maker in our 10 MW continues during peak hours, to operate pumps
home refrigerator that dutifully makes 12 ice cubes per and fans when all of the “cold” is being provided by
hour, allowing us to use 288 ice cubes per day whenever storage. This allows our utility to reduce demand during
we need them. Storage AC uses essentially the same the ramping hours by as much as 190 MW, and augment
principle: making cold when the power is cheap, and using loads in the early part of the solar day and late at night by
that cold when the buildings are warm. up to 90 MW.
Austin Energy’s downtown central cooling system is an Storage AC also may provide energy efficiency savings in
excellent example of this. By offering central cooling, the two different ways. First, because the chiller load is shifted
utility has both created a business opportunity to provide to times when air temperatures are lower (wee hours and
chilled water to dozens of office buildings and hotels, and the early part of the solar day), the chillers actually operate
created a market for off-peak electricity. The utility has also more efficiently, with improved heat rejection. Second,
shaved approximately 15 MW off its summer afternoon because the draw on the electric utility is reduced during
peak demand. peak hours, very high marginal line losses are avoided.
This strategy assumes that our illustrative utility has Together these can reduce the total cooling kWh by up to
200 MW of commercial AC operating at the time of their 20 percent.
afternoon peak demand (approximately five percent of the Figure 12 shows the impact this has for our illustrative
total load), and can shift up to 100 MW of this demand utility, compounded on the effect of Strategies 1 to 4.
25Teaching the “Duck” to Fly • Second Edition
Updates from the First Edition
Real-World Applications of Ice Storage
Both commercial and residential Ice Energy, based in California, is the manufacturer of
loads soar on hot afternoons. the Ice Bear. They have developed storage management
algorithms to work with available solar PV energy and
utility time-varying rates to minimize total consumer
Residential
35,000 MW costs and shape AC loads to meet changing utility supply
profiles.
r
rge
es la
4 tim
Residential
8,600 MW Small Commercial
17,200 MW
larger
1.9 times
Small Commercial
9,000 MW
Large Commercial Ice storage for large and high-rise
Large Commercial and Industrial
and Industrial 1.2 times larger commercial buildings is commercially
16,200 MW
13,700 MW used throughout the world. This Bank
of America building in New York City
64° day in Dallas, 109° day in Dallas, requires ice storage equal in size to about
5 p.m. 5 p.m. 20 automobile parking spaces.
Source: Wattles, P. (2012). Demand Response and
ERCOT Grid Reliability.
This paper treats residential AC as an energy efficiency
opportunity in Strategy 1, whereas commercial AC is partly
a load shifting strategy through the use of ice and chilled-
water storage.
The First Edition assumed a very small amount of
storage AC, as the Ice Bear, a storage rooftop AC unit
of the type used by retail spaces and other single-story
commercial locations, was at that time just beginning to
make inroads into the commercial AC market. Since that
time, we have learned of the extensive deployment of ice
storage and chilled-water storage in the central chiller
market, and the Ice Bear has been field-proven and is more
widely accepted. In this edition, we consider 100 percent of
the central chiller load, and the majority of the retail sector
air conditioning loads to be candidates for storage AC.
26You can also read