Impact of the Increasing Demand for eMobility on Power Consumption in Germany
←
→
Page content transcription
If your browser does not render page correctly, please read the page content below
Chair of Transportation Systems Engineering
Departement of Civil, Geo and Environmental Engineering
Technical University of Munich

Impact of the Increasing Demand for
eMobility on Power Consumption in
Germany
A scenario analysis examining increasing power
demand in relation to projected electricity
production capabilities

A study project presented in part fulfilment of the requirements of the Degree of Master
of Environmental Engineering at the Department of Civil, Geo and Environmental
Engineering, Technical University of Munich.

Supervisor Raoul Rothfeld
 Chair of Transportation Systems Engineering

Submitted by Jonas Schmid-Querg
 Paradiesstraße 3
 80538 München
 Student ID: 03675585

Submitted on München, 08.02.2021
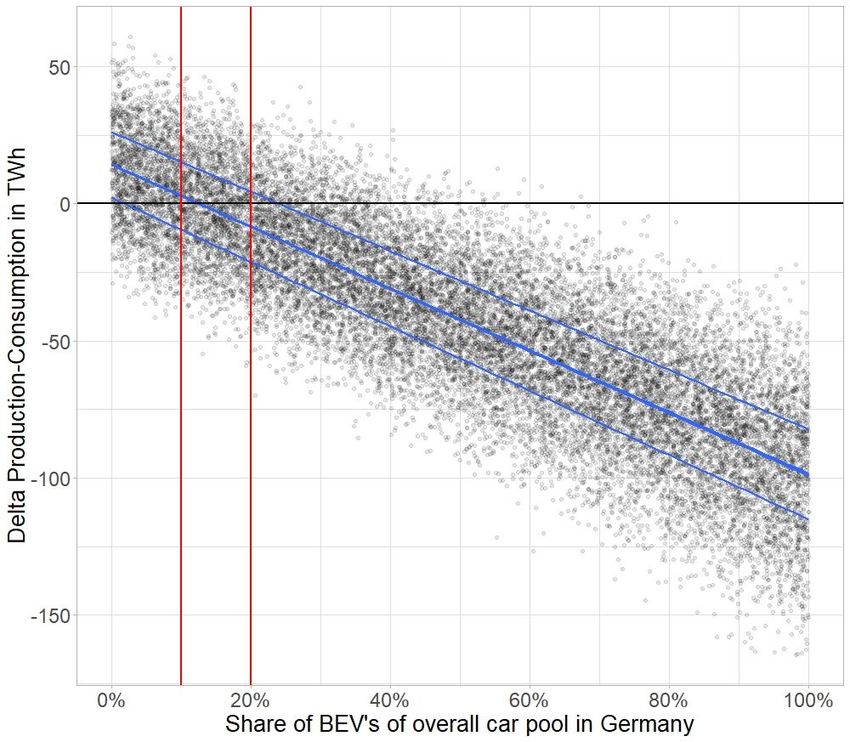
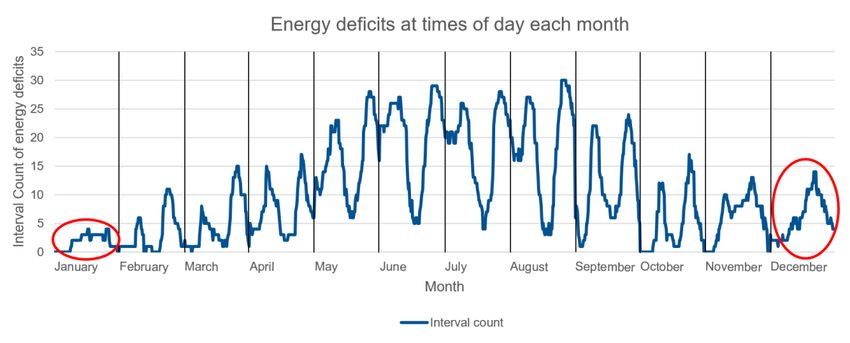
Table of Contents
1. Introduction ........................................................................................................ 1

2. Methodology ....................................................................................................... 3
 2.1. Approach to the Research Question ............................................................. 3
 2.2. Methods of Analysis ...................................................................................... 4

3. Literature Research ............................................................................................ 5
 3.1. Development of Increasing Number of Battery Electric Vehicles in Germany 5
 3.2. Reasons for Augmenting Demand ................................................................ 7
 3.3. Future Trends for EV‘s ................................................................................ 10
 3.4. Power Demand of BEV’s ............................................................................. 11
 3.5. Power Production in Germany – Excursus .................................................. 12
 3.6. Input Data for Production and Consumption in 2030 ................................... 14

4. Scenarios – Compatibility of eMobility Trends with the Future Electricity
 Production ........................................................................................................ 17
 4.1. Simulation Possibilities ................................................................................ 17
 4.2. Chosen Simulation ...................................................................................... 18
 4.2.1. Simulation with R .............................................................................................................18
 4.2.2. Input Data R .....................................................................................................................20
 4.2.3. Excel Analysis of the Timely Variation of the Power Deficits ...........................................21
 4.3. Analysis Results and Discussion ................................................................. 22
 4.3.1. Monte Carlo Simulation....................................................................................................22
 4.3.2. Temporal Power Deficit Analysis .....................................................................................24
 4.4. Discussion of the Model’s Significance........................................................ 31

5. Grid Expansion Plan for the Renewable Energy Development ..................... 32
 5.1. Expansion Measures................................................................................... 32
 5.1.1. Concrete Measures..........................................................................................................33
 5.1.2. Facts and Costs ...............................................................................................................33
 5.2. Technical Grid Codes Regarding BEV’s for Local House Grids ................... 33

6. Solution Approaches ....................................................................................... 35

7. Conclusion........................................................................................................ 39
Declaration ........................................................................................................... 45

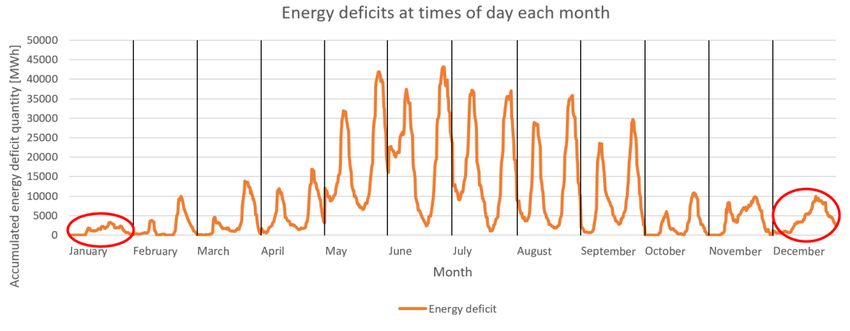
List of Figures
Figure 1 Development of admitted EV’s in Germany ..................................................... 6

Figure 2 Net electricity production from 2015 to 2019 ................................................. 13

Figure 3 Monte Carlo Simulation with a consistent base consumption from 2019 to
2030 ........................................................................................................................... 23

Figure 4 Monte Carlo Simulation from 2019 to 2030 ................................................... 24

Figure 5 Accumulated deficit quantity at times of day ................................................. 26

Figure 6 Deficit interval count at times of day.............................................................. 26

Figure 7 Average yearly market prices at the EEX Stock exchange for Germany in
2019 ........................................................................................................................... 26

Figure 8 Accumulated deficit quantity at times of day according to each month .......... 27

Figure 9 Deficit interval count at times of day according to each month ...................... 27

Figure 10 Deficit interval count at times of day according to each month .................... 30

 V
List of Tables
Table 1 Cost of usage for BEV’s and Combustors ........................................................ 9

Table 2 Power production base values 2019 and growth factor ranges....................... 20

Table 3 Power consumption base values, growth factor range.................................... 21

 VI
Abbreviations

Abbreviation Term Description

BEV Battery electric vehicle s. chapter 3

PHEV Plug-In-Hybrid Electric Ve- s. chapter 3
 hicle

EV Electric Vehicle s. chapter 3

kWh Kilowatt hour Energy amount

MWh Megawatt hour 1000 kWh

GWh Gigawatt hour 1000 MWh

TWh Terawatt hour 1000 GWh

NEP Netzentwicklungsplan Grid expansion plan

 VII
Abstract
The emerging eMobility trends in Germany invoke a series of technical and political ques-
tions. One of which is whether the electricity demand, which will undoubtably increase
through eMobility, can be met by an increased power production and how the current
official projections of production and demand correspond. This paper examines actual
recent electricity data and attempts to answer said question for the year 2030. The em-
ployed method, a Monte Carlo simulation, shows that indeed, the power consumption in
2030 will likely exceed the national electricity production if the production capabilities will
not be increased more than currently anticipated by official institutions and the govern-
ment. Integrating a large number of electric vehicles into the German automobile fleet
will amplify this effect.

 VIII
1. Introduction
The past six years have continuously been the hottest years in the history of recorded
temperatures and nine of the ten warmest years have occurred since 2005 (Climate.gov,
2020). The Paris Agreement therefore aims to keep the global temperature rise below
two degrees Celsius above pre-industrial levels in order to minimize the impacts of cli-
mate change. It incorporates international collaboration, helping weaker economies and
those countries especially affected. Further, it involves individual national plans, the na-
tionally determined contributions, whose requirements the countries are encouraged to
comply with and regularly report on.

Facing the ubiquitous threat of climate change and global warming, rethinking environ-
mental sustainability has become more important than ever. In the wake of this need,
various trends have been emerging claiming to do their part in reducing global emissions
and saving the planet. Some business models truly are contributing to this goal, others
are merely using it to create greater brand acceptance, playing on the societal credulity
and the desire to purchase fair and sustainably produced goods.

One of the most prominent trends of recent times that has attached itself with the label
of sustainability, is the electrification of vehicles, whether it is electric cars, scooters, or
bikes, all of which have experienced a significantly greater demand in the past years.
Without consulting sales figures of the respective companies, the trend is already visible
especially in urban areas (Tagesspiegel, 2019). eScooter sharing fleets by Lime, Voi,
Tier or Bird are shaping the urban image in German cities and one can observe many
more electric cars on the streets than a few years ago.

The notion of sustainability pushes the demand for eMobility. On top of that, owning an
electric car, particularly one from the luxury segment, has become somewhat of a status
symbol. Furthermore, the German Government has made eMobility one of its top agen-
das as a component of the energy transition (Energiewende), subsidizing purchases of
electric vehicles and charging infrastructure on a currently remarkable level (see chapter
3.2).

Accompanying the eMobility development is an increased demand for energy. It has
been remarked numerous times that the current trend will result in imbalances of supply
and demand, especially regarding the concurring plans to expand the share of fluctuating
renewable energy sources whilst reducing fossil energy sources in the German electricity

Impact of the Increasing Demand for eMobility on Power Consumption in Germany 1
mix. This paper aims to analyze the compatibility of the additional power demand by
eMobility with the production and grid capabilities. The analysis will be carried out
through a Monte Carlo simulation encompassing official consumption and production
projections modelled with various growth factors that are applied to the base year of
2019.

Though eMobility has multiple modes as mentioned above, the focus will lie on one spe-
cific mode, fully electric cars, as it has notably the greatest impact on the power demand
compared to eScooter and eBikes as well as Plug-In-Hybrids.

eMobility leads to a strain on the electric grid of multiple grid levels. As charging stations
are generally connected to the low and medium voltage network, the distribution system
operators are crucial for the electrification of the transport sector by ensuring intelligent
and appropriate power connections. The emerging problems of potential bottlenecks and
solution approaches as well as the government’s current grid expansion plans will be a
part of this paper. The following chapter serves to shed light on the structural logic of this
research paper. It illustrates the employed methods and provides a first overview on the
underlying literature

Impact of the Increasing Demand for eMobility on Power Consumption in Germany 2
2. Methodology

2.1. Approach to the Research Question

As stated before, the central aim of this paper was to assess whether the increased
power demand caused by eMobility can be satisfied by the future production of electricity
and to establish a cause-and-effect relationship between the number of BEV’s on Ger-
man streets and possible energy production shortcomings. The core data needed for
that was on the one hand actual quantitative data from the electricity production and
demand in Germany and the current number of BEV’s, on the other hand prognoses for
the aforementioned for the future. The data used was secondary, to be found on official
government portals and in studies carried out by professional associations and research
institutes.

The overall approach to carry out the analyses of the research problem was to look at
existing electricity data from the base year 2019 and then find production and consump-
tion values for the target year 2030. These values naturally are assumptions. 2030 was
chosen as the target year because it is the milestone year on the way to Germany’s 2050
emission reduction plan. Therefore, concrete objectives regarding CO2 emission are set
as well as plans for the energy budget. Namely, the government promises to reduce CO2
emissions by 55 percent until the year 2030 with 1990 being the reference year
(Bundesministerium für Wirtschaft und Energie, n.d.). Considering these goals and the
predictions of various sources, growth factors for the electricity demand and production
for the base 2019 year were derived.

The validity of the actual production and consumption data is highly reliable, it is meas-
ured data provided on the SMARD portal for transparency in the electricity market by the
Federal Network Agency (Bundesnetzagentur) (SMARD, n.d.). The data is checked for
plausibility by various instances. However, the prognoses for the electricity demand and
consumption trends should be regarded with caution as for example government sources
tend to calculate with a much lower value of power consumption in the future as the
independent research associations.

Impact of the Increasing Demand for eMobility on Power Consumption in Germany 3
2.2. Methods of Analysis

The underlying data was found by an extensive literature research and consists of real
values and future prognoses. Based on that, growth factors for the electricity production
and consumption were derived. Details to the formation of the specific growth factors will
be given in the following chapters.

The core of the paper is an analysis via statistical models carried out with the tools R
Studio and Microsoft Excel to analyze the data. The first was used to perform a Monte
Carlo simulation incorporating the base year (2019) electricity values and the growth
factors with a defined range to model possible diversions from assumed pathways. To
do so it employs selected ranges for parameters such as fuel consumption and annual
mileage. The most important variable in the Monte Carlo simulation is the number of
BEV’s on German streets. That is why it is considered as a percentage of the overall
number of automobiles in Germany and displayed in the graphical evaluation on the x-
axis of the diagram. Excel was used to analyze the base year data and compare produc-
tion and demand on a more granular level in order to find out when potential energy
deficits occur respective to the time of the year and the time of the day.

The paper is thematically divided into three sections. Firstly, the literature research es-
tablishes the data foundation, presents background information, facts and figures on the
augmenting electricity demand, illustrates the current BEV situation on German streets
and addresses and evaluates future trends of eMobility. Based on the findings, calcula-
tions were carried out to determine the growth factors. The literature also provides an
overview of the current power production and the energy market in Germany, explains
the planned expansion of renewable energies, and identifies various bottlenecks in the
developments of the electric grid in Germany on a local and regional level. Secondly,
and serving as the core of the paper, is an analysis which compares energy production
to energy consumption data and models possible pathways of the increased power de-
mand by eMobility. Lastly, solution approaches to successfully implement the transport
transition together with the energy transition will be proposed and examined.

Impact of the Increasing Demand for eMobility on Power Consumption in Germany 4
3. Literature Research
This section of the research paper serves to establish the data fundament for the analysis
as well as a basic understanding of the development of eMobility in Germany. Therefore,
a few definitions must be set beforehand.

Battery Electric Vehicle (BEV)

Fully electric vehicles without a gasoline engine. BEV’s have high-capacity battery packs
onboard which run the electric motor and the electronics. While in operation, BEV’s do
not emit emissions as combustion engines do, however, the emissions caused by the
production of electricity used as fuel must be taken into account if one would want to
carry out a comprehensive and holistic life cycle analysis (EVgo.de, n.d.).

Plug-In-Hybrid Electric Vehicle (PHEV)

PHEV’s possess both, an electric and a combustion engine. They can charge their bat-
tery through regenerative breaking or through plugging in to charging infrastructure. The
battery packs are usually much smaller than for BEV’s so that the electric driving ranges
is generally limited to around 30 kilometers (EVgo.de, n.d.).

Hybrid Electric Vehicle (HEV)

HEV’s are able to run on regular gasoline as well as electric energy. The electric energy
is solely produced by regenerative breaking, thus only very small electric driving ranges
can be achieved. The electric energy is mostly used to start the motor and initially accel-
erate the car (EVgo.de, n.d.).

This paper focuses on the battery electric vehicles as the HEV’s do not have an impact
on the energy demand and the impact of PHEV’s is minor relative to BEV’s as their bat-
tery capacity is very small. A calculation to prove this to back this claim can be found in
the later chapters.

3.1. Development of Increasing Number of Battery Electric Vehi-
 cles in Germany

Figure 1 shows a steady increase in the number of battery electric vehicles over the last
decades. While vehicles with a combustion engine still hold the major share of 98 percent

Impact of the Increasing Demand for eMobility on Power Consumption in Germany 5
of all passenger cars, the exponential development is not to be disregarded. Since 2010
the number of battery electric vehicles has more than doubled every two years. In addi-
tion to the 136,617 BEV’S on January 1st, 2020, 102,175 PHEV’s were admitted in Ger-
many as well as 437,208 HEV’s. All three categories experienced an increase of at least
52 percent with BEV’s having the largest increase of more than 64 percent compared to
the previous year on January 1st (Kraftfahrt-Bundesamt, 2020).

 BEV's in Germany
 160.000
 136.617
 140.000
 120.000
 Number of BEV's

 83.175
 100.000 53.861
 80.000 34.022
 60.000 12.156 25.502
 40.000
 1.790 1.452 2.307 7.114 18.948
 20.000 4.541
 1.931 1.436 1.588
 0
 2006 2008 2010 2012 2014 2016 2018 2020
 Year

Figure 1 Development of admitted EV’s in Germany
(Statista, 2020), own depiction

Likely impediments in the first years were socio-technical and economic barriers such as
the minor level of awareness, the scarce offerings, the relatively high-cost price, the lim-
ited cruising range, the insufficient public charging infrastructure, and the battery charg-
ing time. New technologies without a long history of proven operational capability and
standing political frameworks are generally looked upon skeptically by the broad society
and technology enthusiasts are the first to adopt the new products (Egbue & Long, 2012).
As will be discussed, all the aspects have improved significantly over the years.

As of June 2020, 60 models of electric vehicles by German car manufacturers were
available on the market (BMWi, n.d.). A diverse supply is currently available and is im-
portant for technological and price competition, however, compared to other nations,
Germany is not considered to be at the top of the list. In China, 630.000 electric cars
were sold in 2019. This is surely due to the country’s large population; however, the
market share of 6.3 percent indicates a clear margin compared to Germany. In Norway,

Impact of the Increasing Demand for eMobility on Power Consumption in Germany 6
the share of new registrations is currently at 56 percent and in Sweden around 30 percent
(EFahrer.com, 2020). Scandinavia appears to be very innovative when it comes to eMo-
bility. The differing values of market share generally correlate with a country’s wealth but
within wealthy countries, the government initiatives are a major factor in driving technol-
ogy as well as the number of purchases of electric cars.

3.2. Reasons for Augmenting Demand

The reasons for the augmenting market of eMobility are manifold. As previously men-
tioned, political, social, and technical aspects all play important roles. The German gov-
ernment has invested around three billion Euros into research and development of eMo-
bility (BMWi, n.d.). The aim is to assert a pole position of German car manufacturers
within this emerging sector as it is believed to be the future of traffic and transport. The
investment’s focus lies in various fields such as electrical drive technology, battery, and
energy research, improving the value chain, digitalization, grid integration and intelligent
billing with charging infrastructure as well as driving down production costs especially for
the battery. A threshold value for battery costs is 100 Euros per kilowatt hour, which is
supposed to be accomplished in 2023 (Heise, 2020). This figure relates to average val-
ues for the entire sector, specific suppliers may have individual cost advantages.

A major driver for the purchase decision for electric vehicles is the so called Umwelt-
bonus (eng. “Environment Bonus”). It is a subsidy for people wanting to buy electric cars
and a joint effort of the German government and the car manufacturers. Existing already
for several years in varying scales, the federal share has been enhanced, namely dou-
bled, during the COVID-19 pandemic as an innovation bonus. BEV’s with a list price
below 40,000 Euro are subsidized with 9,000 Euros, Plug-In-Hybrids with 6,750 Euro.
Vehicles that are more expensive are subsidized with 7,500 Euros in case they are fully
electric, Plug-In-Hybrids with 5,625 Euros. The current status of subventions is vowed to
last until 31.12.2021 (Die Bundesregierung, n.d.). In addition to that, electric car owners
enjoy several other benefits. They are not obligated to pay the motor vehicle tax for ten
years, after this period the tax amounts to 50 percent of the regular rate for combustion
engines. Depending on the type of car that might implicate a reduction of 500.00 € per
year. Especially as a company car, the purchase of a BEV has recently become more
financially attractive. Employees pay only 0.25 percent taxes for the non-cash benefit in
case the gross list price of the BEV is below 60,000 € (Einkommensteuergesetz § 6). For
non-electric vehicles, the rate is one percent. Furthermore, the fixed rate per kilometer

Impact of the Increasing Demand for eMobility on Power Consumption in Germany 7
between home and workplace for BEV’s and Hybrid cars is 0,015 percent instead of 0,03
percent. Regarding a mid-range car of 45,000 € gross list price that amounts to a monthly
difference of around 425 € compared to a regular car.

In addition to subsidizing the EV’s itself, the acquisition of charging infrastructure can be
supported as well. Previously, regional municipal utilities or other companies involved in
the energy business have financially supported customers by taking over a part of their
private charging infrastructure. The government started out financing public charging in-
frastructure back in 2017 within the framework of the Förderrichtlinie Ladeinfrastruktur
für Elektrofahrzeuge, partly financing the investment costs (Bundesministerium für
Verkehr und digitale Infrastruktur, n.d.). Only recently a subsidy for private charging in-
frastructure like wall boxes has been implemented. From the end of November 2020, the
investment cost and installation can be supported with 900 Euros from the government
program (Bundesministerium für Verkehr und digitale Infrastruktur, 2020).

In terms of social aspects regarding car purchase decisions, it is interesting to note that
an electric car has become a sort of status symbol. Sustainability aside, it is simply
deemed fashionable to own a BEV or PHEV. Studies show that the target group is gen-
erally very well-funded. Ten percent of the most affluent households in Germany pose
70 percent of EV customers. In many cases of this specific target group, the EV is a
secondary vehicle next to regular cars with extensive horsepower numbers (Sickel,
2020). Many of the more powerful EV’s are likely not bought by people because they
want to do something good for the environment (the sustainability of EV’s, BEV or PHEV,
diminishes with the size of the EV) but because they want to have a powerful electric car
just to possess it. Those cars like the Porsche Taycan, the BMW i8, the Audi eTron or
Tesla Model X experience a very large sales market. The Porsche Taycan was sold
20.000 times in 2020 alone (Handelsblatt, 2021).

Last but not least the technical aspects and benefits of the eMobility development are
worth noting. Over the past years the driving range has significantly increased, making
BEV’s more attractive for longer travel distances as well. Depending on the model dis-
tances of up to 632 km per full battery load can be achieved (Tesla Model S 100D),
however, more common are ranges of 200 to 300 km per battery load (The Mobility
House, 2020). Along with the cost of acquisition and the tax situation, the maintenance
and usage costs are crucial for consumers. To make a comparison for the latter, one
should calculate the cost of the respective fuel for 100 km. The amount depends on the

Impact of the Increasing Demand for eMobility on Power Consumption in Germany 8
driving behavior, the weight of the car and whether additional gadgets such as heating
or cooling system is turned on. However, it is reasonable to make use of average con-
sumption values for BEV’s and combustors.

 BEV Combustor (Petrol)

Consumption per 100 kilometer 15 kWh (E.ON, 2020) 7.8 litres (Statista, 2020)

 31,94 Ct (Statista, 2020)
Cost per unit of fuel (Avg. price per kWh for private 1.30 € (Statista, 2020)
 households in 2019 in Germany)

Cost per 100 kilometer 4.79 € 12.48 €

Cost per annual mileage
 718.50 € 1,872.00 €
(15,000 kilometers)

Table 1 Cost of usage for BEV’s and Combustors

The public charging infrastructure has improved as well, currently almost 16,400 public
charging points exist in Germany, whereof 12,200 are normal and 2,200 are fast charging
points (Bundesnetzagentur, 2020). Prices and pricing models vary significantly (a defi-
ciency that many EV owners rightly complain about), nevertheless, a well-established
infrastructure generally supports the development of eMobility. Initiatives such as maps
of publicly available charging infrastructures (Bundesnetzagentur, 2020) on official por-
tals such as the Federal Network Agency (Bundesnetzagentur) make it more convenient
for customers to plan their trips with their electric vehicles and alleviates the fear of run-
ning out of electricity on the road.

In terms of eMobility in general, apart from electric automobiles, several promoting
measures for eBikes and eScooter have been implemented as well. The development
will only briefly be mentioned and not discussed in further detail. On a nationwide level,
subsidies for eBikes and eScooters are available by the KfW Bankengruppe as well es
by the Federal Office for Economics and Export Control (Bundesamt für Wirtschaft und
Ausfuhrkontrolle, BAFA). Several other subsidies are available from the respective fed-
eral states or local companies (co2online, 2020). Sharing concepts widely implemented
in urban areas for vehicles like electric kick scooters or eBikes often provide market-
based incentives for their customer to make use of. The initial contact for the customer
acquisition and their retention is often realized with particularly cheap usage offers. The
eScooter provider Emmy, which is active in Munich and other cities, for example

Impact of the Increasing Demand for eMobility on Power Consumption in Germany 9
demands a ten Euro registration fee but the price includes 50 charge free minutes
(emmy-sharing.de, n.d.).

3.3. Future Trends for EV‘s

The governments initial goal of one million electric vehicles on German streets in 2020
was too ambitious. At the beginning of the year there were only almost 240,000 EV’s
(including BEV’s and PHEV’s, not HEV’s) (Kraftfahrt-Bundesamt, 2020) which is why the
goal was pushed back two years to 2022. The goal for 2030 was set to seven to ten
million EV’s (Bundesministerium für Umwelt, Naturschutz und nukleare Sicherheit, 2020)
along with one million public charging points. The latter is planned to be realized with an
investment of 300 million Euros (BMWi, n.d.). While these numbers sound optimistic, the
recent actuals give reason for a positive outlook.

In September 2020 alone 21,188 BEV’s were admitted which is more than 260 percent
more than in the same month of the previous year. For PHEV’s the number was even
higher: 54,036 admissions in September 2020 and 185 percent more than in the same
month of 2019. That makes up for eight, respectively 20.4 percent of all new admissions,
making almost every third new admission an electric vehicle. The development suggest
that electric vehicles could have a market share of 30 to 40 percent by 2030 (EnBW,
2020). As of January 1st 2020, the entire automobile fleet in Germany counted
47,715,977 cars which was a plus of 1.3 percent compared to the previous year
(Kraftfahrt-Bundesamt, 2020). The market share above would indicate 14 to 19 million
EV’s in Germany by 2030.

As mentioned before the analysis shows the impact of BEV’s on the power demand in
Germany and possible shortcomings on the production side. The number of BEV’s in
2030 is therefore the most essential variable and depicted on the x-axis in percent of the
entire German automobile fleet in the graphical simulation results. That allows for a clas-
sical “what happens if”-analysis. An accurate prediction for this variable in 2030 is diffi-
cult, however, the total number of BEV’s is assumed to lie between five and 10 million.

Impact of the Increasing Demand for eMobility on Power Consumption in Germany 10
3.4. Power Demand of BEV’s

For the power demand in Germany, the consumption of electricity by BEV’s will play a
vital role in the future. Therefore, in the simulation values for a single BEV over the course
of a year need to be assumed.

An average value that can be found in multiple sources states of 15 kWh/100 kilometers
(E.ON, 2020). Since a precise value is unrealistic, the Monte Carlo simulation uses a
range of ± 20 percent or 12 to 18 kWh/100 kilometers. An average value for the annual
mileage in Germany is 15,000 kilometers (Statista, 2020). The assumed range in the
simulation is again ± 20 percent or 12,000 to 18,000 kilometers for the annual mileage
of a car.

By multiplying these two numbers, one can easily derive the annual electricity consump-
tion for one BEV. To put the consumption of a single BEV in perspective, with 15
kWh/100 km and 15,000 km, the annual consumption would amount to 2250 kWh, which
is comparable to a three-person household in a residential row house building.

To quickly prove the previous statement, that transport modes such as eScooter, eKick-
Scooter and Pedelecs have an insignificant enough impact on the power demand to not
be regarded in this analysis, the following calculation provides a quick insight:

eKick-Scooters consume less than 1 kWh/100 kilometers (Verivox, 2020).

Larger eScooters (model Niu N1 S as a reference) consume approximately 3,5 kWh/100
kilometers including charging losses (ADAC, n.d.).

Assuming an eBike has a driving range of 100 kilometers with one battery charge and
the battery capacity averages 0.5 kWh would add up to a consumption to 0.5 kWh/100
kilometers (Stromliste, 2019).

If there were five million vehicles of all three modes, which is a very unlikely high outcome
even in the future, and if eKick-Scooters had an annual mileage of 1000 kilometers,
eScooters of 3000 kilometers and eBikes of 2000 kilometers, that would amount to the
following electricity consumption:

Impact of the Increasing Demand for eMobility on Power Consumption in Germany 11
1 ℎ 3.5 ℎ 0.5 ℎ
 ( × 1000 + × 3000 + × 2000 ) × 5 × 10⁶
 100 100 100
 = 0.625 ℎ

Based on an overall electricity consumption of 500 TWh per year, these modes would
only make up for 0.125 percent and are thus fairly insignificant. The numbers are ap-
proximations and assumptions and only serve to put the demand of the three vehicle
modes into perspective and explain why this paper only focuses on BEV’s.

Plug-In-Hybrids mostly have a battery range of only 30 kilometers and do not go into full
electric mode often, after the 30 kilometers they run on regular fuel if not charged again.
That means for any longer trips, they emit the full amount of CO2, yet they are still eligible
for the Umweltbonus at purchase and receive many tax advantages and serve the car
manufacturers to artificially lower their fleet CO2 value in order to comply with the regu-
lations. Even though it is clear, that PHEV’s have a much higher CO2 emission than on
the paper (Süddeutsche Zeitung, 2020). If one assumes there were 5 million PHEV’s,
that they would have the same annual driving range as BEV’s and drive 30 percent on a
purely electric basis (Fraunhofer ISI, 2020), the result would be the following:

 15 ℎ
 × 15,000 × 0,3 × 5 × 106 = 3.375 ℎ
 100

Based on an overall electricity consumption of 500 TWh per year, that would only make
up for 0.675 percent. That is 30 percent of what the same amount of purely electric BEV’s
would need and therefore already worth mentioning. However, and this is an important
point for the understanding of the logic of this paper:

The seven to ten million electric vehicles that the government plans to have on German
streets by 2030 already account for BEV’s and PHEV’s. The analysis, however, assumes
that the entire electric fleet consists of BEV’s, resulting in a higher power demand. There-
fore, consumption-wise, it is kind of an “extreme case” scenario when it comes to the
question of what the ratio of BEV’s and PHEV’s will be in the future. From a standpoint
of sustainability that would be the ideal scenario.

3.5. Power Production in Germany – Excursus

The power production in Germany has experienced an overall increase since the 1990ies
due to an augmenting demand of industry and households. There are exceptions from

Impact of the Increasing Demand for eMobility on Power Consumption in Germany 12
the trend, most notably the year of 2009 when the economic downturn caused the econ-
omy to shrink. Ever since 2003 more electricity was generated than consumed leading
to a net electricity export. The upward trend ended in 2017, since then the net production
shrunk by approximately five percent due to the abandonment of conventional power-
plants, especially the nuclear powerplants of which the last one is obligated to be shut
down in the near future, in 2022 to be exact, due to the phase-out law Atomgesetz (AtG)
from 2002 (Umweltbundesamt, 2020).

Figure 2 Net electricity production from 2015 to 2019
(SMARD, n.d.), own depiction

The table above shows the net electricity production from 2015 to 2019. The combined
net production of renewables is marked by the bar on the left outlined in green and the
conventional energies production is marked by the bar outlined in black. It is clearly vis-
ible that the renewable energy sources have increased their share within these five years
significantly. In 2015 the renewable net production share amounted to 30.2 percent, in
2019 it was 43.1 percent with the largest increase from 2018 to 2019 with 5 percent
(SMARD, n.d.). While onshore wind production has by far the largest absolute value in
2019 among the renewable sources, the increase was the highest for offshore wind pro-
duction: almost by 300 percent.

The use of hard coal has recently declined because of the increased production of nat-
ural gas. This is due to decreasing spot prices of natural gas and increasing prices for

Impact of the Increasing Demand for eMobility on Power Consumption in Germany 13
emission allowances leading to natural gas being before hard coal in the merit order
model (ewi, 2020).

By 2030 the government plans to achieve a share of 65 percent of renewable in the gross
electricity consumption. An ambitious plan, which, according to studies, will most likely
fail to be implemented (ewi, 2020). The EWI expects a share of 46 percent renewables
in 2030.

3.6. Input Data for Production and Consumption in 2030

As mentioned before, the ensuing simulation uses base values from 2019 for each en-
ergy source and derives growth factor ranges to derive a corridor for the production of
each energy source in 2030 as well as for the consumption. The base values are actual
net production or consumption values from 2019 in Germany and can be found in Table
1 in chapter 4.2.2. The source for these values is the official information portal for elec-
tricity markets and data SMARD by the Federal Network Agency (Bundesnetzagentur,
BNetzA) and the Department of Commerce (Wirtschaftsministerium, BMWi) (SMARD,
n.d.) where the data is freely accessible. SMARD was implemented to further the energy
market’s transparency, it provides real time date of the power market.

To derive the production and consumption growth factors, the latest grid expansion plan
(Netzentwicklungsplan Strom 2030, NEP) was consulted. The NEP considers the sce-
narios of the BNetzA for the future energy production including the integration of renew-
able energy sources and describes the need for the grid expansion in order to reach the
scenario goals. Being the middle ground between scenarios A 2030 and C 2030, the
scenario B 2030 was chosen for this purpose, representing an energy transition with
increasingly flexible production and consumption, capped carbon dioxide emissions in
powerplants and a moderate expansion of renewable energy sources.

In the NEP installed production capacities in Gigawatt of the various energy sources are
given for the reference year 2017 and predicted for the year 2030. The assumption is
that the ratio between installed capacity of each individual energy source and its actual
production is the same for base year and target year. To transfer the developments to
the reference year 2019 and the net production in TWh the following steps are neces-
sary:

Impact of the Increasing Demand for eMobility on Power Consumption in Germany 14
1. Calculate the average growth rate from 2017 to 2030 for the installed capacities
 ( ) of each energy source (n = 13 stands for the year 2030).

 1
 2030
 =( )
 2017

 2. Calculate the installed capacities for 2019, which is two years from the reference
 year 2017.

 2019 = 2017 ∗ 2

 3. Calculate the growth factors for each energy source from 2019 to 2030.

 ℎ = ( 2030 ÷ 2019 ) − 1

 4. As a definite value prediction is unlikely, it is preferable to have a corridor in which
 the actual value could lie. Therefore, the decision was made to add and respec-
 tively substract 15 percent of the growth factor value to receive a minimum and
 maximum border.

 ℎ = ( 2030 ÷ 2019 ) ± ( 2030 ÷ 2019 ) × 0.15 − 1

An exception in this is nuclear power, the growth factor is simply negative one, as by
2030 no nuclear power plants will be in use. The last one will be taken off the grid in
2022 (Bundesministerium für Umwelt, Naturschutz und nukleare Sicherheit, n.d.).

The consumption growth factor was derived similarly. The aforementioned NEP does
have a prediction for the net electricity consumption in 2030 (543,9 TWh). This prediction
is most likely overestimating the savings by energy efficiency measures. Studies vary in
their propositions for the energy consumption in 2030. An EWI analysis predicts 748
TWh (Energiewirtschaftliches Institut an der Universität Köln, 2020), stating that amongst
others, eMobility and heat pumps will push the consumption values. The Deutsche En-
ergie-Agentur Gmbh (dena), a federally owned, yet proclaimed independent company
that renders services, shapes projects, and conducts studies in the context of the climate
change and the energy transition, quantifies the consumption in 2030 at 670 to 840 TWh,
depending on the scenario (dena-Leitstudie Integrierte Energiewende, 2018). Another
scenario by the Bundesverband Erneuerbare Energie e.V. (BEE) estimates a

Impact of the Increasing Demand for eMobility on Power Consumption in Germany 15
consumption of 740 TWh and also states that the share of eMobility in this scenario will
be 68 TWh.

However, the conservative consumption prediction by the NEP was chosen to derive the
growth factor for three reasons. Number one being that having production and consump-
tion values from the same source ensures consistency. Secondly, the estimates for the
consumption by the NEP is very conservative compared to the other study results men-
tioned above. This implicates, should the results still show an overall power deficit over
the year, the hypothesis, that Germany will have a power gap in the future if the expan-
sion of the renewable energy sources is not pushed much more than it is now, is true
with a high likelihood. And thirdly, because employing all assumptions from the govern-
ment plan serves to question their estimates and perhaps reveal possible weaknesses.
As before for the production and consumption growth factors, to conduct the Monte Carlo
simulation, a corridor of plus and minus 15 percent was chosen to represent possible
deviations from the actual future value.

It is important to note that the eMobility electricity demand is already incorporated in the
consumption values from 2019 and 2030 from the literature. Therefore, the known num-
ber of electric vehicles in 2019 multiplied by their average yearly consumption is sub-
tracted from the net consumption in 2019 in the input data for the modeling. For 2030,
the NEP assumes six million EV’s, which was also multiplied by the average yearly con-
sumption of one EV and subtracted by the estimated overall consumption. These result-
ing values for base and target year were employed to derive the growth factor and the
growth factor range, respectively.

Impact of the Increasing Demand for eMobility on Power Consumption in Germany 16
4. Scenarios – Compatibility of eMobility Trends with
 the Future Electricity Production
This chapter makes use of the previously collected data and trends and employs the
gathered knowledge in order to examine how compatible the future electricity production
is with the increased demand caused by an augmenting number of BEV’S in Germany.

4.1. Simulation Possibilities

In order to show the compatibility and sufficiency of the power production and the power
consumption, various approaches can be taken. The most sophisticated being a holistic
agent-based simulation which focuses on the separate components of a system. In the
case of the power grid, the grid would essentially be recreated virtually, containing all
relevant consumers, producers as agents, their load behavior as dynamic actions and
all grid capacities in the respective locations as well as the infrastructure between the
agents. Small electrical loads such as households, car charging stations, heat pumps as
well as industrial users would be modelled with their specific load profile. Similarly, the
various energy generating sources, conventional and renewables alike, would be part of
the simulation. This kind of simulation is referred to as a bottom-up approach, starting
with the individual agents working up to the complex interactions with the structure con-
necting them (Sameera, Theodoropoulos, Lemarinier, & O'Hare, 2016).

A sophisticated agent-based simulation has the possibility to analyze production and
consumption in a temporal and regional, even local manner, given the required data is
provided. This means, energy deficits can be simulated fairly accurately, and counter-
measures might be undertaken. The greatest difficulty, however, is, besides the availa-
bility of data and complexity of programming, the unpredictability of fluctuating energy
sources like wind and solar energy. As they are dependent on weather conditions, they
cannot be accurately predicted for a large time horizon.

Several programs for the described simulation already exist and are usually part of a
larger research project.

GridSim is a simulation model by the Forschungsstelle für Energiewirtschaft e.V (FfE),
an independent research center for energy efficiency, renewable energy, digitalization,
and integrated energy systems. The model serves a detailed reflection of the distribution

Impact of the Increasing Demand for eMobility on Power Consumption in Germany 17
grid and aims to analyze the implications of various decentralized production and con-
sumption systems on the distribution grid (Forschungstelle für Energiewirtschaft e.V.,
2020). GridSim is capable of modelling many scenarios such as grid loads due to eMo-
bility by differing market penetrations, decentralized production usability for future con-
sumers or the impact of energy storage on integrating fluctuating renewable energy
sources into the energy mix.

As agent-based simulations for the power grid would be exceedingly complicated regard-
ing data acquisition, programming, and behavioral predictions of agents, in this context
it is feasible to make use of a simpler approach to show the impact of increasing eMobility
demand in Germany. This paper will examine an alignment of production and consump-
tion values while assuming different numbers of electric vehicles as an additional load.

4.2. Chosen Simulation

As the agent-based approach is too complex for a small research project such as this
one, a simpler approach was chosen. The goal was to identify whether an energy deficit
may occur in the future, namely in 2030. The previous research concerned the base year
2019 and the underlying trends and assumptions for the year 2030. In order to find out
how likely and severe these potential power deficits will be due to eMobility, an approach
employing an analysis via statistical models using the tools R and Microsoft Excel has
been chosen. The simulation in R serves to model whether the production surpasses the
consumption over the course of a year and the simulation in Excel serves to find the
most critical energy deltas on a temporal level.

4.2.1. Simulation with R
The simulation uses actual electricity production and consumption data from 2019 and
makes use of estimated growth factors to predict the values in the year 2030. The basic
equation of the simulation is the simple difference (delta) between Production and Con-
sumption:

 ∆ 2030 = 2030 − 2030

P Production
C Consumption

The production in turn consists of the shares of the individual energy sources:

Impact of the Increasing Demand for eMobility on Power Consumption in Germany 18
 2030 = ∑ 2030

 = + + + + + + + + + +
 +

The variables represent the production by the various types of energy sources:

BM Biomass HP Hydro power
WOf Wind offshore WOn Wind onshore
PV Photovoltaic OR Other renewables

NE Nuclear energy BC Brown coal
HC Hard coal G Natural gas
PHS Pumped hydro storage OCE Other conventional energy

The summands in P in turn consist of a base value for each energy source in 2019 mul-
tiplied by one plus a respective growth factor to simulate the production of each energy
source in the target year.

 2030
 = 2019 ∗ (1 + ℎ )

For example:

 = 19 ∗ (1 + ℎ )

The formula for the consumption in the target year 2030 is as follows

 2030 = 2019 ∗ (1 + ℎ ) +

 = ∗ ∗
 100

C2019 Energy consumption in 2019 without emobility
CeM additional energy consumption by eMobility
X Number of electric Cars
AM Annual mileage
EKm Energy per 100 km

Impact of the Increasing Demand for eMobility on Power Consumption in Germany 19
Each growth factor and yet unknown variables like the number of electric cars, their an-
nual mileage and the energy per 100 km is actually represented by a corridor of possible
assumptions between a minimum and maximum value. The simulation uses the Monte-
Carlo-Method with 20,000 iterations to create these values.

4.2.2. Input Data R
Power production:

Description Value in MWh Growth factors

Biomass 41,030,981.75 -0.3041, -0.0585

Hydro power 15,843,344.75 -0.15, 0.15

Wind Offshore 24,185,404.00 0.2744, 0.7242

Wind Onshore 99,634,865.00 1.2431, 2.0348

Photovoltaic 41,915,997.00 0.6266, 1.2007

Other renewables 1,317,000.50 2.5446, 3.7956

Nuclear energy 71,044,587.00 -1, -1

Brown coal 102,732,654.75 -0.5767, -0.4273

Hard coal 47,819,697.00 -0.6152, -0.4793

Natural gas 54,624,090.00 -0.0158, 0.3316

Pumped hydro storage 8,954,958.00 0.0065, 0.3617

Other conventional energy 10,051,213.00 -0.2303, 0.0414

Table 2 Power production base values 2019 and growth factor ranges
(SMARD, n.d.), own depiction

Impact of the Increasing Demand for eMobility on Power Consumption in Germany 20
Power consumption:

Description Value

Consumption 2019 without eMobility 490,292,889 MWh

Consumption growth factor -0.0805, 0.2441

Number of electric cars
 0, 50,000,000
(50 million representing the entire German car fleet in 2030)

Annual mileage 12,000, 18000 km

Energy per 100 Km 12, 18 kWh

Table 3 Power consumption base values, growth factor range

4.2.3. Excel Analysis of the Timely Variation of the Power Deficits
The Excel analysis is a separate analysis from the Monte Carlo simulation. They are not
connected mathematically but thematically because a deeper understanding of possible
eMobility consumption problems is revealed in both.

With this analysis, a comparison of production and consumption data from 2019 is car-
ried out to find times when consumption outgrew the production, the so-called power
deficits. Therefore, the aim was to break down the production data from 2019 to a more
granular basis. The load profiles of consumption and production from this year were once
again obtained from the electricity portal SMARD. It is to be noted that this does not
examine the timely occurrence and distribution of power gaps in 2030 or the future in
general. How the energy is produced, centralized or decentralized by many small power
plants, might differ greatly from the current time.

The goal of finding the most critical times of power deficits, when the consumption value
exceeds the production, was realized by directly comparing the actual data. The simple
subtraction of production and consumption for every 15 minutes throughout all of 2019
provides an overview when these power gaps occur because the timestamp is always
given. The simple Excel analysis makes use of the time stamp and shows the number of
negative intervals and their accumulated energy in GWh over the course of the year as
well as on a monthly level. Then the timely distribution is analyzed and compared with
consumption behavior.

Impact of the Increasing Demand for eMobility on Power Consumption in Germany 21
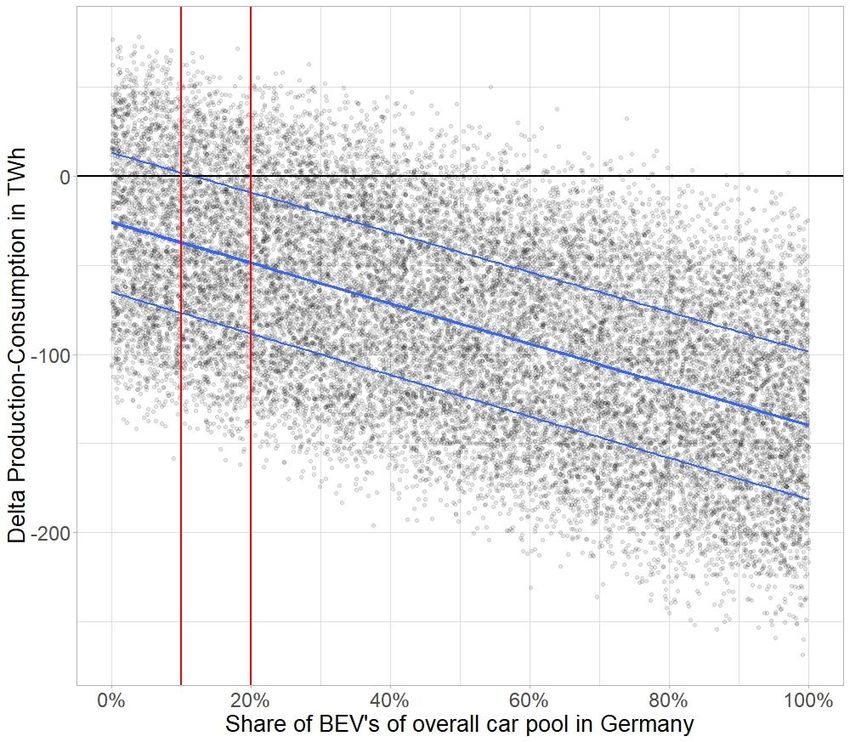
4.3. Analysis Results and Discussion

4.3.1. Monte Carlo Simulation
In Figure 3, the simulation was run without any consumption growth from 2019 to 2030.
On the x-axis the percentage of BEV’s of the overall carpool is provided, which is as-
sumed to be 50 million in 2030. As of 2020, it was 47.1 million and it experienced a slow
but steady increase each year for the past years (Statista, 2020). On the y-axis the dif-
ference between production and consumption is displayed.

To put the numbers into perspective: the production will be around 500 TWh in 2030,
thus, 50 TWh as a power deficit would be roughly ten percent of the production.

The thick blue line is a fitted line through the point cloud to allow for a better overview.
The two thinner blue lines show the quartiles of the statistical distribution, meaning that
50 percent of the data points lie within the two thin blue lines, and 25 percent of the data
points lie each above and below them. The red lines show the planned share of BEV’s
in 2030, namely ten to twenty percent or five to ten million.

Interestingly enough, even if the growth factor for the regular consumption is assumed
to be zero, meaning that the base consumption from 2019 will not increase, the simula-
tion shows that a small number of BEV on German streets will raise the consumption
over the production dimensions. The figure shows that somewhere between five and
seven million electric cars, a power deficit between the annual national production and
consumption will become very likely. The result implies that the gap can only be filled by
electricity imports from neighboring countries, as it is not a temporal or local but an ab-
solute deficit of electricity. By simple market mechanisms, imports from other countries
generally mean higher energy prices than for nationally produced electricity.

Impact of the Increasing Demand for eMobility on Power Consumption in Germany 22
Figure 3 Monte Carlo Simulation with a consistent base consumption from 2019 to 2030

In Figure 4, the regular consumption growth is considered and the result shows that
overall power deficits are much more likely. The median lies below a net zero already at
a share of zero percent BEV’s. At a ten percent share, or five million BEV’s of the 2030
carpool, even the upper quartile crosses the net zero line, implying that there is only a
25 percent chance that the power production exceeds the consumption in 2030 given
the used data and assumptions. Considering the goal of five to ten million BEV’s in the
target year the analysis result implies that the power deficit will likely amount to 40 to 50
TWh based on the current predictions of installed capacities.

Impact of the Increasing Demand for eMobility on Power Consumption in Germany 23
Figure 4 Monte Carlo Simulation from 2019 to 2030

4.3.2. Temporal Power Deficit Analysis
The analysis in Microsoft Excel aimed to get a better understanding of the temporal oc-
currence of negative energy gaps throughout the year and throughout a day. The analy-
sis is separate from the previous simulation but is thematically connected as will be evi-
dent after the result’s discussion.

The underlying data is comprised of the 15-minute interval profiles of production and
consumption. Again the difference of both was calculated, this time for every 15-minute
interval.

By comparing the production and consumption data, the following results became evi-
dent:

 1. Over the course of 2019, the consumption outgrew the production in 11,479
 15-minutes intervals. This represents 32.76 percent of all intervals.

Impact of the Increasing Demand for eMobility on Power Consumption in Germany 24
2. While the overall surplus of production amounts to 28,674.8 GWh, the energy
 quantity of all negative intervals amounts to 9,980.1 GWh.

 3. The average negative interval has a shortcoming of 801.1 MWh.

 4. The largest deficit amounted to 3,689.75 MWh and occurred at 6:30 in the morn-
 ing on the 28th of May.

 5. The most and laragest negative intervals occur from 5:45 to 9:15 in the morning
 and from 17:00 to 22:45 in the evening with 19:45 being the most critical time.

 6. On average, the electricity prices (Figure 7) correlate with the phenomenon of
 the energy deficits. The average hourly peak prices occur at 8:00 in the morning
 with an average price of 45.36 €/MWh and at 19:00 in the evening with an aver-
 age price of 48.76 €/MWh.

Figure 5 and Figure 6 show the course of the accumulated number of energy deficits
over a day (blue line) and the accumulated quantity of energy in MWh (orange line) in
the respective time intervals over the year 2019. Looking at the shape of the plot, one
can quickly notice the similarity to a standard H0 load profile of a household over a day
with the significant morning and evening peaks. Clearly, a correlation to the consumption
in an average household can be drawn, as it is common knowledge that household con-
sume the most energy when people are at home and go after their daily routines of
watching TV, running the dishwasher, or doing the laundry.

Impact of the Increasing Demand for eMobility on Power Consumption in Germany 25
Energy deficits at times of day 2019
 300.000
 Accumulated deficit quantity

 250.000
 200.000
 150.000
 100.000
 [MWh]

 50.000
 -
 00:00
 01:00
 02:00
 03:00
 04:00
 05:00
 06:00
 07:00
 08:00
 09:00
 10:00
 11:00
 12:00
 13:00
 14:00
 15:00
 16:00
 17:00
 18:00
 19:00
 20:00
 21:00
 22:00
 23:00
 Time of day

 Energy deficit

 Energy deficits at times of day 2019
 250
 Interval count with energy deficit

 200
 150
 100
 50
 -
 00:00
 01:00
 02:00
 03:00
 04:00
 05:00
 06:00
 07:00
 08:00
 09:00
 10:00
 11:00
 12:00
 13:00
 14:00
 15:00
 16:00
 17:00
 18:00
 19:00
 20:00
 21:00
 22:00
 23:00

 Time of day

 Interval count

 Average yearly market prices
 60
 Average electricity price [€/MWh]

 50
 40
 30
 20
 10
 0
 00:00
 01:00
 02:00
 03:00
 04:00
 05:00
 06:00
 07:00
 08:00
 09:00
 10:00
 11:00
 12:00
 13:00
 14:00
 15:00
 16:00
 17:00
 18:00
 19:00
 20:00
 21:00
 22:00
 23:00

 Time of day

 Electricity price

Figure 5 Accumulated deficit quantity at times of day

Figure 6 Deficit interval count at times of day

Figure 7 Average yearly market prices at the EEX Stock exchange for Germany in 2019

(SMARD, n.d.), own depiction

Impact of the Increasing Demand for eMobility on Power Consumption in Germany 26
You can also read