Analysis of the regulatory framework for
←
→
Page content transcription
If your browser does not render page correctly, please read the page content below
Analysis of the regulatory framework for
wind power generation in Brazil | Summary Report
Análise do marco regulatório para a geração eólica no Brasil | Relatório de Síntese

           Analisis del marco regulatorio para la generación eólica en Brasil | Informe de Síntesis
Table of contents

A n a ly s i s o f the regulatory framework                                           Analisis del marco regulatorio
f o r w i n d p o wer generation in Brazil                                            para la generación eólica en Brasil

1.	PROINFA ���������������������������������������������������������������������4   1.	PROINFA �������������������������������������������������������������������32

2.	The wind power industry��������������������������������������������6             2.	La Industria Eólica ���������������������������������������������������34

3.	The wind power market ��������������������������������������������� 7            3.	El Mercado Eólico������������������������������������������������������35

4.	Challenges facing the sector��������������������������������������8              4.	Desafíos Sectoriales ������������������������������������������������36

5.	The model for regulated procurement:                                              5.	El modelo de contratacion regulada:
    a dynamic link in wind power investment .������������ 10                             Eslabón dinamizador de la inversión eólica . ���������38

6.	Characteristics of tenders for procurement                                        6.	Caracteristicas de las licitaciones para la
    of wind energy generation ��������������������������������������11                   contratación de generación eólica �������������������������39

7.	Prices in regulated procurement������������������������������ 12                 7.	Precios en la contratacion regulada ��������������������� 40

8.	Returns for the consumer���������������������������������������� 14              8.	Retornos para el consumidor ����������������������������������42

9.	Update on electricity planning ������������������������������� 16                9.	Actualización de la planificacion eléctrica ����������� 44

10.	Recommendations for legislative improvements  17                                10.	Mejoras legislativas���������������������������������������������������45

                                                                                      About GWEC ������������������������������������������������������������������46
A n á l i s e d o marco regulatório
p a r a a g e r a ç ão eólica no Brasil                                               About ABEEólica ������������������������������������������������������������46

1.	PROINFA ������������������������������������������������������������������� 18   Imprint ���������������������������������������������������������������������������46

2.	A indústria eólica������������������������������������������������������20

3.	O mercado eólico������������������������������������������������������ 21

4.	Desafios setoriais������������������������������������������������������22

5.	O modelo de contratação regulada:
    Link dinamizador do investimento eólico. �������������24

6.	Características das licitações
    para a contratação de geração eólica ��������������������25

7.	Preços na contratação regulada �����������������������������26

8.	Retornos para o consumidor������������������������������������28

9.	Atualização do planejamento elétrico �������������������30

10.	Melhoras legislativas������������������������������������������������ 31
Foreword

With its large unpopulated land areas, a coastline of            These developments have not gone unnoticed by
9,600 km and excellent wind resources, Brazil is in a prime      international players, who have been piling into Brazil to
position to become a true wind energy giant, and it is slowly    secure a piece of the cake. With large turbine manufacturers
emerging as a key market for the international wind power        such as Wobben Enercon, Impsa, Suzlon, Siemens, Vestas,
industry. While growth in 2010 was still small in absolute       Alstom, Gamesa, WEG and GE Energy now operating in the
terms, it represented a 50% increase in terms of total           country, Brazil is well equipped to service its domestic
installed capacity, and Brazil just recently reached the magic   market, as well as other Latin American countries. However,
threshold of 1,000 MW of wind power operating across the         to maintain the investment pouring into the sector in Brazil,
country.                                                         both short-term and long-term policy certainty are of
                                                                 essential importance.
The drivers for wind power in Brazil are twofold: firstly, the
country’s fast developing economy drives up electricity          This study, which was undertaken in cooperation between
demand that can no longer be met with the existing               the Brazilian Wind Energy Association (ABEEolica) and the
infrastructure; and secondly, the Brazilian government is        Global Wind Energy Council (GWEC) provides an in-depth
looking at diversifying its energy mix, with wind power          analysis of the Brazilian wind energy market. It evaluates
perfectly suited to complement the large share of existing       the effects of the regulatory approaches to date, analyses
hydro power.                                                     the market and the industry, pinpoints remaining obstacles
                                                                 and challenges, and provides recommendations for
Hydro and wind power are perfect partners in Brazil. Not         legislative improvements.
only are the country’s windiest areas located conveniently
close to demand centres, but in addition, the variable nature    We hope that this study will present policy makers and
of wind power is best accommodated in a highly flexible          industry with valuable insights into both the current status
system such as one dominated by hydropower. Furthermore,         and the potential of the Brazilian wind power market, and
wind power can help alleviate some serious energy security       highlight some avenues for enabling Brazil to truly capture
concerns in Brazil, especially during the dry winters.           the inexhaustible energy source at its door step that is wind
                                                                 energy.
Two very different models have spurred growth in the
Brazilian market: the PROINFA programme which was
introduced in 2002, and the regulated auctions that have         Ricardo Simôes                 Klaus Rave
been taking place regularly since December 2009. As a            President                      Chairman
result of both these efforts, it is expected that as much as     ABEEólica                      GWEC
5,000 MW of wind power could be installed in Brazil by the
end of 2013.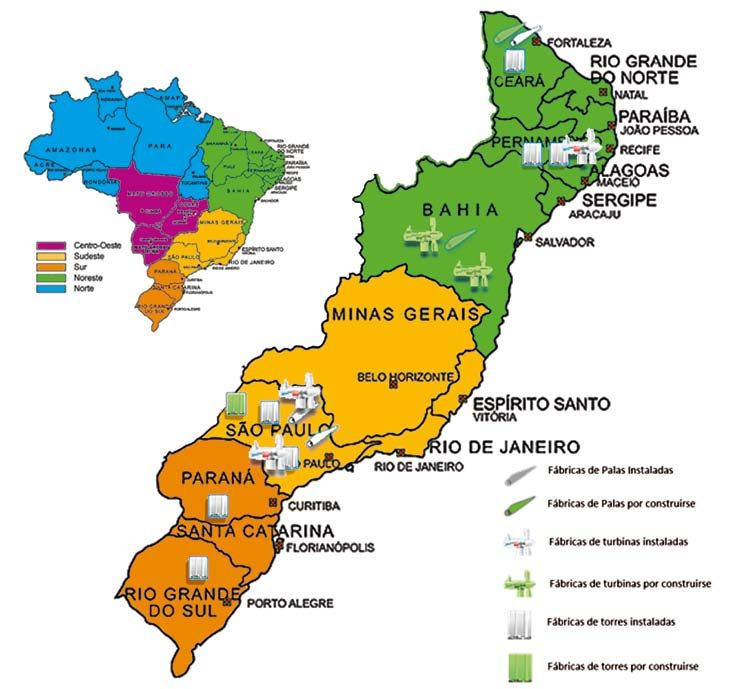
Analysis of the regulatory framework for
wind power generation in Brazil Summary Report *
1. PROINFA capacities greater than 30 MW and natural gas power
stations.
The development of wind power in Brazil started in 2002
based on the public policies adopted under the Programme The acquisition will be again made under a 20-year PPA
of Incentives for Alternative Electricity Sources (PROINFA), with ELETROBRÁS, by means of annual scheduled purchases
which had the aim of diversifying the electricity mix in the from each producer, so that new RE sources achieve a
country by increasing the use of new alternative energy minimum annual increase in power output of 15% to be
sources. supplied to the consumer market.
The programme, which was divided into two phases, The process of selecting the projects is shown in the diagram
extended to small hydro power plants, biomass and wind below:
Analysis of the regulatory framework for wind power generation in Brazil
power, and is divided into two successive phases. Law No.
10. 438 of 26 April 2002 set out the targets and timescales Graph 1: Project selection process for
for PROINFA, as well as the mechanisms for assigning first phase of PROINFA
projects and determining the prices at which electricity will
be sold.
START
For the first phase, a total capacity of 3,300 MW was
assigned, distributed between wind power, biomass and Sort facilities by date of 1st tender
Step 1
small hydropower, of which 1,429 MW were allocated to
wind power.
Select facilities meeting the criteria:
This first quota had to be implemented before 30 December Step 2 Total autonomous = < 550 MW
Total not autonomous = < 550 MW
2008, and included provisions for a fixed tariff and grid Limit per state => 220 MW
access for all electricity produced over a period of 20 years,
distributed equally across all participating sources.
Maximum potential achieved,
not exceeding YES
The first phase of the programme was based on a 20-year END
550 MW for autonomous and
guaranteed power purchase agreement with ELETROBRÁS 550 MW for not autonomous
at the price defined by the government, with floors of 50%, NO
70% and 90% (for small hydro, biomass and wind farms
respectively), of the average retail power price in the final Are there still some NO
Step 3 qualified facilities?
twelve months, and where participation in the programme
is via an Independent Power Producer, and provided that
the nationalisation index for equipment and services is at
least 60% in the first stage.
Recalculate state limits
Step 4 proportionately to tenders
For the second phase, the law set the target for new per state
renewable energy sources to provide 10% of the country’s
annual power consumption within 20 years. This phase was
Select facilities still not chosen,
due to come into force after the target capacity of meeting the criteria:
3,300 MW of the first phase had been met. The price for Total Autonomous = < 550 MW
Total Not Autonomous = < 550 MW
electricity in this phase will be equal to that of competitive Limit per state calculated in step 3
energy generation, defined as the weighted average cost of
the generation through new hydro power plants with Source: Brazilian Ministry of Mines and Energy (MME)
* For the full report (in Portuguese), please see www.gwec.net.
4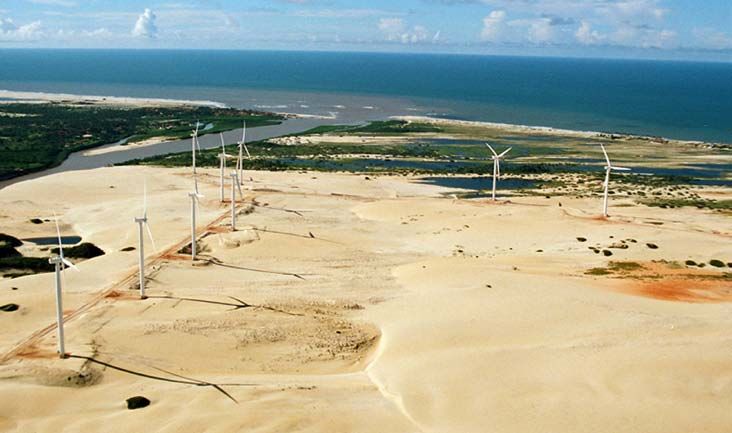
Evaluation of PROINFA: During the implementation of the
first phase, several practical issues undermined the
development of some projects, which led to a delay in the
start of operations. These problems included:
• o
nerous demands and heavy bureaucratic procedures to
obtain or renew environmental licences;
• p
roblems and delays in obtaining the Declaration of
Public Utility (DUP) for projects, a qualification which
facilitates negotiations to obtain the right to use the
Analysis of the regulatory framework for wind power generation in Brazil
assets and rights affected by the projects, in particular
the land, which in many cases is affected by complicated
terms of use and occupation, and disputes between
owners and landholders which make it difficult to identify
the property;
• o
bstacles in connecting to the grid, particularly in the
Central Western region;
• d
ifficulty for the domestic industry to meet high demand
for equipment.
Due to these first experiences, the deadlines set out in the
Programme have been repeatedly postponed and, by the
end of 2010, 926 MW of wind power were installed in Brazil,
spread over 51 wind farms and corresponding to 40
PROINFA projects. Brazil has recently achieved the threshold
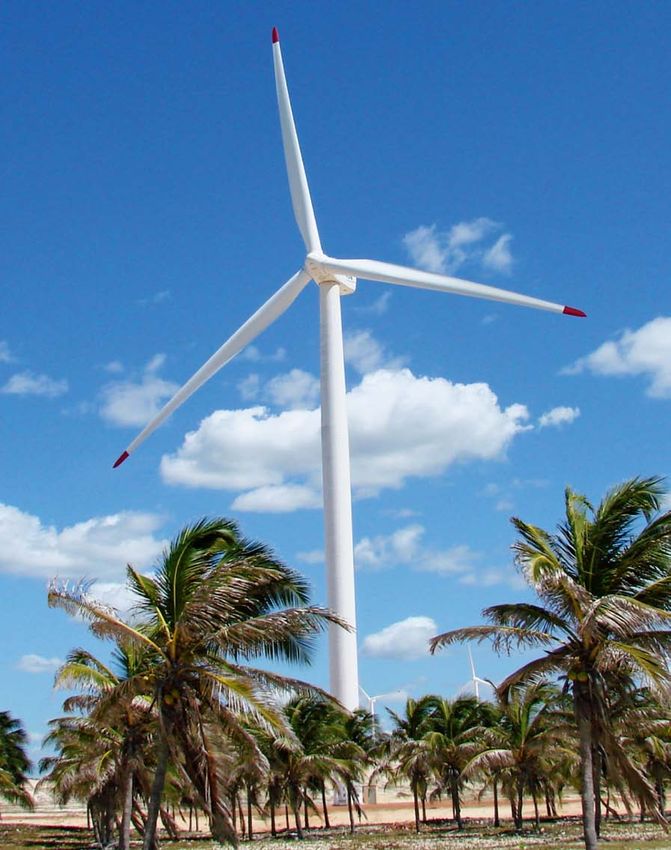
of 1,000 MW of installed wind power and is expected to Rio do Fogo wind farm © Wind Power Works
reach the target of the first phase of PROINFA in 2011.
The rate at which new wind power capacity was installed Graph 2: Annual wind power capacity additions
increased during the last two years of the PROINFA in Brazil (past installations and prognosis)
programme, demonstrating a trend towards sustained (PROINFA+LER 2009+LFA +LER 2010)
growth. Currently, over 97% of the installed wind generation
capacity was achieved through PROINFA projects. 2,000 [MW] 1,970.2
1,577
In December 2009, and again in August 2010 (LER-2009, 1,500
LFA-2010 and LER-2010), the Brazilian Ministry of Mines
and Energy held regulated procurement procedures, which 1,000 871.7
allowed for the participation of wind power. These auctions
500
greatly boosted the development of wind power, and it is 261.4 326.6
expected that by 2013, 5,300 MW of wind power will be 94
0 0
0
installed in Brazil as a result of both PROINFA and the
2008 2009 2010 2011 2012 2013 2014 2015
auctions, attracting investments in excess of $10 bn to the
wind energy sector in the next three years. Source: ABEEólica/ANEEL
5
2. The wind power industry                              increase this capacity, and the sector aims to implement a
                                                                                                                                                    manufacturing base capable of producing between 2.0 GW
                                                                           The wind power industry and its supply chain is becoming                 and 2.5 GW of wind power equipment per year.
                                                                           firmly established in Brazil and, in 2010, offered a varied
                                                                           production capacity across the country of over 1,000 MW                  Brazil has a wind power equipment supply chain, which
                                                                           per annum. Rising industrial investment will significantly               includes the following key global manufacturers:

                                                                                                                 Graph 3: Distribution of the wind power industry in Brazil in 2010
Analysis of the regulatory framework for wind power generation in Brazil

                                                                                       Central-West

                                                                                       South East

                                                                                       South

                                                                                       North East

                                                                                       North

                                                                                                                                                                               Rotor blade plants installed

                                                                                                                                                                               Rotor blade plants to be constructed

                                                                                                                                                                               Wind turbine plants installed

                                                                                                                                                                               Wind turbine plants to be constructed

                                                                                                                                                                               Wind tower plants installed

                                                                                                                                                                               Wind tower plants to be constructed

                                                                            Source: ABEEólica; Elaboração GWEC

                                                                                                                                               6
Turbine assembly plants: Total manufacturing                                             3. The wind power market
            capacity of 1,500 MW/year
Wobben (Sorocaba): 500MW/year; Impsa (Suape-                           As Brazil achieved its first 1,000 MW of installed wind power
Pernambuco): 600MW/year; Gamesa (Bahía) 400 MW/                        capacity, the turbine manufacturers’ market was distributed
year; General Electric - HUB Assembly - Campinas São                   as shown below:
Paulo. Manufacturers such as General Electric, Alstom,
Vestas, Siemens, Suzlon, and the Chinese manufacturer                          Graph 4: Installed capacity by manufacturer
Guodian United Power have announced investments in                                                in 2010
Brazil in response to the positive results obtained in the
2009 and 2010 tenders, which could increase local                        45        [%]
production capacity to reach around 2,000 MW/year.                       40

                                                                                                                                       Analysis of the regulatory framework for wind power generation in Brazil
                                                                         35
                   Rotor blade plants
Total manufacturing capacity of 2,000 MW/year: Tecsis                    30

(Sorocaba-Sao Paulo): 1,500MW/year; Wobben (Sorocaba)                    25
for E70-E74-E82 turbines, Wobben (Pecén-Ceará) for E-40,                 20
E48 turbines; total Wobben capacity: more than 600 MW/                   15
year.
                                                                         10

In addition, there are plans to establish the following                    5

manufacturing facilities: LM-Bahía 300 MW/year and                         0
announced by Suzlon- Ceará, Aerys Tecnologia.                                     Enercon          Suzlon     Vestas         Impsa

Implementation is scheduled by 2012
                                                                        Source: ABEEólica

                     Wind tower plants                                 The tenders held in 2009 (Wind only tender), and in 2010
Total manufacturing capacity around 1,600 MW/year:                     (Alternative energy tender and Reserve energy tender),
Brasilsat, Curitiba, PR – 80towers/year, Engebasa - SAWE,              present a wind farm developers market distributed as
Cubatão, SP 120+ towers/year; Máquinas Piratinga, Recife,              follows:
PE - 80 towers/year; Tecnomaq, Fortaleza, CE - 150 towers/
year; ICEQ, Mirassol, SP; INTECNIAL, Erechim, RS - 80                      Graph 5: Market share wind power developers:
towers/year; RM Eólica Pernambucana (Gonvarri + Arcelor                              2009 and 2010 auctions
Mittal), Recife, Pernambuco. 200 towers/year.
                                                                        Others 25%                                      Renova 11%
Concrete towers are manufactured in three facilities by                                                                Energimp 7%
Wobben, as well as the Spanish manufacturer INNEO.
                                                                                                                        Iberdrola 7%

The Brazilian Wind Energy Association (ABEEólica) is the                Enerfin 3%
                                                                                                                        Martifer 6%
                                                                        CPE 3%
representative industry association for the Brazilian wind
                                                                        Energio 3%
energy industry. Over the last three years, it has significantly        DESA 4%                                           Impsa 5%
increased its membership, established itself as an important            Energisa 4%                                         CPFL 5%
                                                                        Contour 4%                                        CHESF 5%
institutional presence within Brazil, and forged links with
                                                                        SM/JM 4%                                        Gestamp 4%
other national and regional associations. ABEEólica is a
board member of the international umbrella association,                 Source: ABEEólica

the Global Wind Energy Council (GWEC).

                                                                   7
Analysis of the regulatory framework for wind power generation in Brazil

                                                                           Beberibe wind farm © Suzlon

                                                                                      4. Challenges facing the sector

                                                                           The main challenges facing the wind energy sector in Brazil          In the short term, the potential for the development of the
                                                                           in the short term are directly related to the projected              wind power sector is limited to the wind power capacity
                                                                           growth of the market, which will require a significant               planned under both the ongoing PROINFA target and the
                                                                           increase in the rate of wind power installations compared to         results of the auctions.
                                                                           previous years in order to realise the energy supply
                                                                           programme which will result from new auction procedures
                                                                           planned for 2013 and beyond. This will involve:                             Table 1: Operational wind capacity as of
                                                                                                                                                   31 Dec 2010, including PROINFA projects under
                                                                           • m
                                                                              obilising and securing greater financial resources to the             construction and capacity assigned through
                                                                             projects and increasing the rate of financing;                                      2009/2010 auctions

                                                                                                                                                 States                 MW in operation        MW in 2013
                                                                           • increasing the production capacity of the wind power
                                                                              industry, strengthening its presence in Brazil, and                Bahía                               0               977.0
                                                                              developing technological innovations adapted to the                Ceará                            502.2              692.0
                                                                              specific characteristics of wind power in Brazil as well as        Paraiba                           61.8                5.4
                                                                              the country’s power system;                                        Paraná                             2.5                0.0
                                                                                                                                                 Pernambuco                        25.2                0.0
                                                                           • m
                                                                              eeting the logistical requirements of the supply chain
                                                                                                                                                 Piauí                             18.0                0.0
                                                                             for both equipment and services for the professional,
                                                                                                                                                 Rio De Janeiro                    28.1              135.0
                                                                             manufacturing and business activities involved in the
                                                                                                                                                 Rio Grande Do Norte              102.1            1,842.0
                                                                             development of the projects and investments.
                                                                                                                                                 Rio Grande Do Sul                158.0              502.0
                                                                                                                                                 Santa Catarina                    14.4               217.7
                                                                                                                                                 Sergipe                             0                30.0
                                                                                                                                                 Total                           929.0             4,401.1

                                                                                                                                                 Source: ANEEL

                                                                                                                                            8
Based on the current supply agreements, wind power generation       Grid access is one of the key challenges facing wind power
capacity in 2013 will be distributed as shown in graph 6.           in Brazil, and additional investments are needed to allow
                                                                    wind farms to be effectively connected to the power grid in
It is noteworthy that over 80% of contracted wind power             order to transport the produced power to the demand
capacity will be sited in the North Western region of Brazil.       centres. The Brazilian wind power sector supports the
This should be reflected in the next update of the plan for         reinforcement of grid infrastructure in the North East region
electrical infrastructures for transport and distribution.          via a transmission line running parallel to the coast, which

                           Graph 6: Geographical distribution of wind power capacity in 2013

                                                                                                                                    Analysis of the regulatory framework for wind power generation in Brazil
                                                          519 MW                                                     102 MW

                                                          692 MW                                                    1,842 MW

                                                      18 MW                                                          61.8 MW

                                                                                                                     5.4 MW

                                                                                                                 25.2 MW

                                                                                                         30 MW

            Centro-Oeste
                                                                                      977 MW

            Sudeste

            Sur

            Noreste

            Norte

            2.5 MW                                                                         28.1 MW

                                                                                           135 MW

                                                            14 MW

                                                            218 MW

                                                                                                               MW instalados
                                    158 MW

                                    502 MW                                                                     MW por instalarse

 Source: ABEEólica/GWEC

                                                                9
should connect São Luís (MA) and Recife (PE), and would                            Graph 7: Market environments for
                                                                           also benefit Ceará, Rio Grande do Norte and Paraíba.                                 commercialisation of power

                                                                              5. The model for regulated procurement:
                                                                              a dynamic link in wind power investment

                                                                           International experience shows that the model of regulated                 Regulated            Regulated
                                                                                                                                                      Procurement          bilateral       Tenders
                                                                           auctions for wind projects implemented in Brazil has                       Environment –        contracts
                                                                                                                                                      RPE
                                                                           represented a regulatory solution to secure continued
                                                                           investment in this technology. Given the characteristics of
                                                                           the model introduced in the two-phased PROINFA
Analysis of the regulatory framework for wind power generation in Brazil

                                                                           programme, and the fact that its target of 3,300 MW of
                                                                           renewable energy installed capacity for the first phase is
                                                                           expected to be reached for wind power projects this year,
                                                                           the existing gap with the original completion date (2008)
                                                                           should be closed before the start of the programme’s                       Open
                                                                                                                                                      Procurement          Bilateral       Open
                                                                           second phase.                                                              Environment -        contracts       Negotiation
                                                                                                                                                      OPE
                                                                           The development of wind power through the competitive
                                                                           bidding process established in 2009 is a pioneering
                                                                           regulatory approach for Brazil, which has spurred large
                                                                           investments in wind power. Had it not been for these
                                                                           auctions, Brazil would have continued its slow growth, with         Source: GWEC

                                                                           negative effects on the establishment and continuity of the
                                                                           supply chain. Wind power access to the auctions since
                                                                           December 2009 boosted investments ahead of the                     Electricity suppliers and other public service agents for the
                                                                           fulfilment of the 1,400 MW PROINFA target for wind power,          National Interconnection System (SIN) must guarantee
                                                                           providing a larger market for this technology in the short         supply to the entire market through regulated procurement
                                                                           term, as well as continuity for many projects already in the       by means of tenders. This system was put in place to handle
                                                                           pipeline.                                                          public service distribution, i.e. the volume defined by the
                                                                                                                                              government and not in order to diversify the electricity mix
                                                                           The new regulatory approach of holding auctions which              in the way that PROINFA does.
                                                                           include wind power could be improved by accommodating
                                                                           the provisions of PROINFA into this framework in order to          However, this framework also applies to wind energy
                                                                           provide the whole system with greater legal certainty and          generation, which can only be contracted by RPE (auctions).
                                                                           predictability. The development of wind power in Brazil            This interim regulatory framework in which wind power is
                                                                           through competitive bidding constituted a marked change            developed could be improved if it were possible to enable
                                                                           from the PROINFA methodology. While PROINFA was                    and stimulate the open procurement environment so as not
                                                                           implemented with the aim of diversifying the electricity           to interrupt the ongoing investment process.
                                                                           mix, the auction model is based on different energy policy
                                                                           objectives, aiming to efficiently increase the country’s           This would be a step towards increasing investor certainty
                                                                           energy supply security.                                            in the medium and long term, and make the system more
                                                                                                                                              consistent with the energy policy objectives for new
                                                                           In the new model for the electricity sector in Brazil, power is    renewable energy technologies in the PROINFA programme
                                                                           purchased either through a tender processes or through             on the one hand, and with the new electricity sector model
                                                                           open negotiations, as shown in graph 7.                            on the other.

                                                                                                                                         10
6. Characteristics of tenders for procurement
of wind energy generation
General conditions: With the exception of the first wind- However, the projected rules on procurement apply without
only tender in 2009, the framework of regulated contractual distinction to all power generation installations taking part
arrangements for power generation capacity is aimed at a in the tendering process, whether or not they use renewable
variety of technologies without distinction and, as pointed energy sources which are variable in nature, with the same
out earlier, pursues the objective of securing the country’s production obligations for all technologies.
electricity supply.
Graph 8: Main conditions for procurement in tenders assigned to wind energy
Analysis of the regulatory framework for wind power generation in Brazil
Participation and Capability Content Guarantees Restrictions and Penalties
9th New Energy National or international Energy delivered from new Developments without • Warning;
Auction legal entities based in the investments subject to authorisation: • Fine: 1% to 10% of the
(A-5 ). country, on their own or further authorisations and 1% of the total value of investment value;
1st Wind Energy grouped in consortia; licences to operate in SIN the investment according • Temporary prohibition
Auction Investment funds, and in ACR. to the valuation of EPE. to purchase electricity or
(21 Dec 2009) on their own or grouped in Mode: Developments with take part in auctions
Electricity availability authorisation: launched by ANEEL
consortia together with • Delays in delivering
other investment funds or Deadline for completion: R$ 20,000 for each unit of electricity at completion
other legal entities. en 1 Jan 2014, for 15 years energy to be offered. deadline, or insufficient
Legal capability, tax de duración. Warrants: loads: The seller shall buy
compliance, economic COMMENTS: Excess insurance warrant; electricity to guarantee
and finance capability, power can be purchased bank warrant; the total amount
as well as technical or used by the seller public debt titles originally contracted,
capability without prejudice of other
penalties under the
Resoluçión Normativa
ANEEL nº 165/2005
2st Alternative Energy Energy purchase delivered
Auction by alternative generation
(A-3). sources specifically
2nd Wind Energy by PCHs, biomass and
Auction wind power for the SIN
(26 Aug 2010) and the ACR.
Same Mode: Product delivery Same Same
conditions Availability by source conditions conditions
(biomass and wind power).
Deadline for completion:
1 Jan 2013, for 20 years.
Comments:
Same as 2009 auction
3rd Reserve Energy Reserve energy purchase Warning;
Auction. specifically for PCH, wind • Fine: 1% to 10% of the
3rd Wind Energy investment value;
power and biomass • Temporary prohibition to
Auction Mode: Quantities of wind purchase electricity or take part
(25/26 Aug 2010) power delivered. in auctions launched by ANEEL
Deadline for completion: • Delays in delivering
1 Sept 2013, for 20 years. electricity at completion
Comment: deadline, or insufficient loads:
• Energy account:
Purchase of excess power To balance when deliveries
is prohibited. are: 30%
Monetary refund without
prejudice of other penalties.
Comment: It is prohibited
to purchase electricity from
third parties to comply with
the contract.
Source: GWEC
11In reality, however, it is not possible to apply the same Nevertheless, not all wind power projects in Brazil are
regulation to conventional dispatchable energy sources and financed with the involvement of BNDES. In fact, there is a
renewable power generation with variable output, and the noticeable gap between the rate of wind projects contracted
same obligations cannot be imposed on both sectors. in the 2009 and 2010 tenders (4,316 MW, including pending
PROINFA projects), ongoing projects under construction
A specific regulatory framework is required to address the (928 MW), and the number of wind power projects actually
specific characteristics of wind power generation, and financed by BNDES (including PROINFA), which amount to
particularly the variability of wind power output. This would only 1,342 MW.
require specific rules to allow for flexibility in the rigid
obligations for power production and delivery, which are This current situation, which shows a gap in the wind power
currently imposed as part of the regulated procurement development process, could be anticipating scenarios in
Analysis of the regulatory framework for wind power generation in Brazil
process, which was established with different objectives in which some projects might be delayed, and not come into
mind. operation by the stipulated completion date. This issue
could be addressed by relaxing the local content
Nationalisation index for equipment and services: For requirements and making public finance more accessible.
the first and second phase of PROINFA, local content
requirements (so-called ‘nationalisation indices’) were 7. Prices in regulated procurement
stipulated for equipment and services of 60% and 90%
respectively. The prices per kWh following the tendering process give a
quick snapshot of the learning curve experienced in other
In the regulated procurement environment of the auctions, more developed markets.
protectionist measures were introduced in the guidelines
approved for the wind energy reserve tender in 2009. These The final prices have been reduced dramatically, squeezing
included a stipulation prohibiting the import of wind commercial margins across the entire value chain and
turbines with nominal capacity below 1.5 MW (see Art. 3 of representing reductions of around 50% on the tariffs
the MME Portaria No. 211, 28 May 2009, in the draft guaranteed under PROINFA. This can be explained by the
introduced by Portaria No. 242, 25 June 2009). This reduced global dynamics of this market and the deceleration
the restriction that had initially been set for wind turbines witnessed in other regions and countries with more mature
smaller than 2 MW. wind power markets, and this is considering the fact that
the cost of the turbines represents the largest share in the
Nevertheless, there are no similar measures to be found in overall investment in a wind farm.
the Portarias approving the guidelines on the tenders held
in 2010 (LFA and LER), and no nationalisation index is It is foreseeable in the regulated procurement environment
required to take part in the tender process. However, the that wind power generation will start to develop in the best
nationalisation index of 60% remains as a condition to locations. The average capacity factor resulting from the
access funding from the Brazilian development bank BNDES, reserve energy tender (LER 2010) amounts to 50%, twice
and since BNDES financing comes at a lower cost, this the average capacity factor for wind turbines in Europe, and
condition established a de facto local content requirement the conditions for competition imposed will most likely
similar to the ones stipulated under PROINFA and the result in the flourishing of wind power projects on the best
Portarias for the wind-only auction. The result of this has sites.
been a rapid expansion of the local supply chain, attracting
manufacturers who have become eligible for BNDES For the same reasons it is foreseeable that in future the
funding by fulfilling the local content requirements, as well conditions of competition will stimulate the formation of
as meeting deadlines for implementation and other consortia to take part in the tenders and facilitate the
conditions. process for large energy providers with lower financial costs,
better access to funding and economies of scale.
12Table 2: Wind power projects financed by BNDES
Project Location Status Financing BNDES [bn R$] Investment [bn R$] Capacity [MW]
Ventos do Sui Osório (RS) Contracted 465.0 662.4 150.0
Rio do Fogo Rio do Fogo (RN) Contracted 136.0 207.7 49.3
CENAEEL Água Doce (SC) Contracted 20.5 28.3 9.0
Beberibe Beberibe (CE) Contracted 94.9 140.9 25.6
Vale dos Ventos Mataraca (PB) Contracted 162.0 262.0 48.0
Pedra do Sal Pedra do Sal (PI) Contracted 72.0 103.5 18.0
Bons Ventos Aracati (PE) Contracted 258.5 754.0 155.0
IMPSA Santa Catarina Água Doce / Born Jardim da Serra (SC) Contracted 837.8 1.200.0 222.0
Analysis of the regulatory framework for wind power generation in Brazil
Gargaú São Francisco do Itabapoana (RJ) Contracted 79.5 152.0 28.1
Tramandaí Tramandaí (RS) Contracted 231.0 307.0 70.0
CPFL Santa Clara Parazinho (RN) Contracted 560.0 800.0 180.0
IMPSA Ceará Acaraú e Aracati (CE) Contracted 590.0 950.4 211.2
Renova Energia Igaporã, Caetité e Guanambi (BA) Contracted 506.3 698.4 175.5
TOTAL 4,013.51 6,266.60 1,341.65
Source: BNDES
Graph 9: Prices per MWh for wind power in reference markets
160 [$MWh]
140
120
100
80
60
40
20
0
Brazil Mexico Argentina Uruguay Peru Spain
Sources: ANEEL (Brazil), CFE, [Federal Commission for Electricity] (Mexico), Enarsa, [National Energy Company] (Argentina), UTE, [National State Power Company] (Uruguay),
OSINERGMIN [Energy regulatory commission] (Peru), CNE, [National Energy Commission] (Spain)
13Table 3: Comparison of capital expenditure, capacity factors and wind power prices
PPA Price Aug 2010 ∆% Investment cost ∆% Average capacity ∆% Amortisation term ∆%
(R$/Mwh) (R$/kW installed) factor (P50) BNDES (years)
PROINFA 260 5,500 31.7% 12
LER 2009 151.95 -41.6% 4,200 -24% 41.2% 30% 14 16%
LFA 2010 134.69 -11.4% 4,000 -5% 42.4% 2.9% 16 16%
LER 2010 122.71 -8.9% 4,000 - 51% 11.8% 16 16%
* Exchange rate on day of tender
LER 2009 14/12/2009: 1.76 BRL/USD
LFA 2010 & LER 2010 26/08/10: 1.764 BRL/USD. Source: BNDES
8. Returns for the consumer
Analysis of the regulatory framework for wind power generation in Brazil
The tendering process for LFA 2010 (alternative energy This effect is similar to other markets where wind power
sources), which took place in August 2010 showed the generation is well established, and the benefits could be
benefits for consumers of wind energy becoming part of the even greater in Brazil if there was an indication that the
electrical system in terms of cost. Average operating costs continuity of investment was secured in the long term and
were reduced by close to 8% compared to certain scenarios if there was an increase in the share of electricity generated
considered in the electricity ten-year plan (PDDE 2010- from wind power in the electricity grid.
2019), due to a decreasing use of thermal electricity
capacity.
Graph 10: Average marginal operating costs for the main subsystems (SE/CW, S, N and NE)
120 [$MWh] Excelência Energética Scenario (30 it.) [%] 0
Electrical Energy 10-year Plan 2019 (45 it.)
Annual variation (%)
110 107.8
107.0
101.7
100 -5
95.2
93.9 93.9
92.1 91.3
90
36.5 86.9
83.4 83.2 83.1
80 78.1 77.3 -10
75.7 74.6
73.2 73.8
70
66.7
60 -15
50
40 -20
2010 2011 2011 2013 2014 2015 2016 2017 2018 2019
Source: Excelencia Enegética
14Analysis of the regulatory framework for wind power generation in Brazil
Paracuru wind farm © Suzlon
The whole system would benefit substantially from a wind energy generation is rising between 25.7% and 32% as
reduction in costs as the result of an in-depth review of the a result of the cascade tax affecting the supply chain, with
current tax scheme in place for wind energy generation, subsequent loss of competitiveness. The study recommends
which is very cumbersome compared with other markets. A the introduction of a tax relief mechanism for wind energy
study commissioned by ABEEólica found that the cost of investments to stop this loss of competitiveness.
Graph 11: Tax incidence on wind energy investments
II 1.6% a 2.0%
IPI 6.4% a 7.8%
100
Taxes ICMS 13.6% a 17%
75
PIS/COFINS 25% a 3%
Need to
50 ISS 0.7% a 1.6%
Goods and reduce
services ent
25 investm
0
Source: Baker Tilly Brazil / ABEEólica
159. Update on electricity planning While the total volume of projects accepted under the
tendering process is known (including the auction set to
Currently, players in the wind power sector lack information take place in August 2011, for which wind power projects
concerning market development volumes in the medium totalling 10,950 MW have registered), the discretionary
and long term. There is a lack of clarity in the regulation nature of the proposals, together with current energy
affecting the potential options for development of wind planning forecasts for this technology, is creating
energy projects implemented from 2013, which lies in the uncertainty concerning the size and the rates of development
discretionary and random nature of the regulated in the medium and long term.
procurement procedures.
Analysis of the regulatory framework for wind power generation in Brazil
Table 4: Forecasts for installed capacity for technologies in the Electrical Energy Ten-year Plan 2010-2019 [MW]
Source 2010 2011 2012 2013 2014 2015 2016 2017 2018 2019
Hydro 83,169 85,438 86,295 88,499 89,681 94,656 100,476 104,151 108,598 116,699
Uranium 2,007 2,007 2,007 2,007 2,007 3,412 3,412 3,412 3,412 3,412
Natural gas 8,860 9,356 9,856 11,327 11,533 11,533 11,533 11,533 11,533 11,533
Coal 1,765 2,485 3,205 3,205 3,205 3,205 3,205 3,205 3,205 3,205
Fuel oil 3,380 4,820 5,246 8,864 8,864 8,864 8,864 8,864 8,864 8,864
Diesel oil 1,728 1,903 1,703 1,356 1,149 1,149 1,149 1,149 1,149 1,149
Process gas 687 687 687 687 687 687 687 687 687 687
Small hydro power 4,043 4,116 4,116 4,516 5,066 5,566 5,816 6,066 6,416 6,966
Biomass 5,380 6,083 6,321 6,671 7,071 7,421 7,621 7,771 8,121 8,521
Wind energy 1,436 1,436 3,241 3,641 4,041 4,441 4,841 5,241 5,641 6,041
Total 112,455 118,375 122,676 130,774 133,305 140,935 147,605 152,080 157,628 167,078
Source: EPE
Wind power provides a comprehensive response to the The process of energy planning is participative and dynamic,
principles of sustainable and competitive development which enables new situations and improvements to be
implicit in the 1988 Constitution of the Federative Republic incorporated in the expansion criteria for future studies. A
of Brazil and guarantees an indigenous energy supply, which new and much more ambitious approach for wind energy
justifies a very substantial increase in its share in the generation should be outlined according to the technology’s
electricity grid compared to current forecasts and a specific capacity and potential.
regulatory framework which incentivises investment in this
technology. It is fair to attribute one third of the average annual increase
in power generation to wind energy within the time scale of
The Electrical Energy Ten-year Plan 2010-2019 contains the Electrical Energy Ten-year Plan 2010-2019.
annual expansion forecasts for the generation of wind
energy, and for renewable energy in general. This needs to Achieving sustained development of activities in the sector
be updated with a view of the wind power capacity requires a new regulatory framework which would provide
contracted in the 2009 and 2010 tenders, which would certainty in terms of the development volumes in the medium
result in a rate of annual installations of around 2,000 MW and long term, legal security in the processing of projects, and
up to 2013. This needs to be reflected in the forecasts in the a support system which would enhance competitiveness. The
Electrical Energy Ten-year Plan 2010-2019, which did not Electrical Energy Ten-year Plan could help to provide the long-
foresee this current situation. term investor certainty required by the wind energy industry in
order to develop into a more secure and stable environment.
16Graph 12: Expansion forecasts for technologies under Electrical Energy Ten-year Plan 2010-2019
10,000 Increase of installed capacity per source [MW]
Contracted expansion Planned expansion
9,000
8,000
Alternative energy sources Coal
7,000 Process gas Natural gas
6,000 Diesel oil Uranium
5,000 Fuel oil Hydro power
Analysis of the regulatory framework for wind power generation in Brazil
4,000
3,000
2,000
1,000
0
2010 2011 2012 2013 2014 2015 2016 2017 2018 2019 2010 2011 2012 2013 2014 2015 2016 2017 2018 2019
Source: EPE
10. Recommendations for legislative order to develop a mechanism for each technology
improvements according to its state of technological maturity and
development;
Since 2004, we have seen increasingly intense parliamentary
activity bringing together various societal demands geared • e stablish a specific tax regime to incentivise the wind
towards improving the regulatory model for renewable energy industry because of its potential for growth and
energies in Brazil. competitiveness compared with other sources of
renewable energy;
From the perspective of the international wind power
industry, it would be desirable to establish a legal framework • introduce specific regulation for electricity supply based
that would address the most relevant issues for sustainable on wind power and the rights of connection and access to
growth of wind power development in Brazil. This should: power infrastructure networks, taking into account all
the benefits arising from the expansion of these networks;
• include annual targets for consumption of electricity
from wind energy by 2019, taking into account the results • c ontain a development programme for power infra
from tenders held in 2009, 2010 and 2011 and create a structure in line with the renewable energy targets;
specific institutional body charged with planning,
controlling and breaking down barriers to reaching these • include a specific, harmonised administrative procedure
objectives; for evaluating the environmental impact of projects, with
an unambiguous system of administrative powers.
• d
efine the support mechanisms and financing systems
taking into account technological realities, energy
consumption profiles and requirements, and the need to
increase economic efficiency and competitiveness, in
17Análise do marco regulatório para a
geração eólica no Brasil Relatório de Síntese *
1. PROINFA novos aproveitamentos hidráulicos com potência superior a
30.000 kW e de centrais termoelétricas a gás natural
O desenvolvimento da geração de eletricidade de origem calculado pelo Poder Executivo.
eólica no Brasil foi iniciado em 2002 a partir do programa
PROINFA (Programa de Incentivo às Fontes Alternativas de A aquisição se realizará pela ELETROBRÁS garantida por
Energia Elétrica), que coloca em marcha as políticas públicas 20 anos mediante programação anual de compra de cada
destinadas a diversificar a matriz energética do país, a partir produtor, de forma que as referidas fontes atendam no
de novas fontes alternativas de energia. mínimo 15% do aumento anual da energia elétrica a ser
fornecida ao mercado consumidor.
O programa se estende a pequenas centrais hidrelétricas
(PCHs), parques eólicos e biomassa, dividindo-se em duas O processo de seleção dos projetos responde ao seguinte
etapas sucessivas com base na Lei nº 10. 438, de 26 de abril esquema:
de 2002, que estabelece os objetivos e o laço temporal das
Análise do marco regulatório para a generação eólica no Brasil
mesmas, assim como os mecanismos de alocação de Gráfico 1: Processo de seleção de projetos
projetos e determinação de preços de venda da energia primeira etapa PROINFA
elétrica resultante.
INICIO
Para a primeira etapa foram alocados um total de 3.300 MW
de capacidade distribuídas entre todas as fontes de energia
renováveis contempladas, dos quais foram adjudicados Ordenar aproveitamentos
Passo 1 por data da 1a LI
1.423 MW de projetos de geração elétrica a partir da fonte
eólica.
Selecionar aproveitamentos
obedecendo os critérios :
Este primeiro contingente deveria entrar em funcionamento Passo 2 soma Autônomos =< 550.000
sorhă ’Não-Autônomos =< 550.000
antes de 30 de dezembro de 2008, dispondo de um direito limite por estado =< 220.000 kW
de compra garantida de toda a energia produzida durante o
prazo de 20 anos, distribuindo-se equitativamente entre
cada fonte participante. Atingíu o máximo de potencial,
não ultrapassando SIM
50.000 kW por Autônomos e FIM
550.000 kW por Não-Autônomos
A primeira etapa do programa se caracteriza pela compra da
produção garantida pela ELETROBRÁS por 20 anos com NÃO
preço definido pelo poder executivo, tendo como base
50%, 70% e 90% (PCHs, biomassa e parques eólicos) Aínda existem NÃO
Passo 3 empreendimentos
respectivamente, da tarifa média do fornecimento aos habilitados?
consumidores finais nos últimos doze meses, onde a
participação no programa é através da figura do “Produtor
Independente Autônomo”, sempre que o índice de
Recalcular limites dos estados
nacionalização dos equipamentos e dos serviços seja, na Passo 4 proporcionalmente às ofertas
primeira etapa, de no mínimo 60% do valor. por estado
Para a segunda etapa a lei fixou o objetivo de alcançar 10%
do consumo anual do país em 20 anos, começando esta Selecionar aproveitamentos ainda não
escolhidos, obedecendo os critérios :
somente quando alcançados os 3.300MW da primeira soma Autônomos =< 550.000
etapa. O preço de compra da eletricidade será equivalente limites por estado calculado no passo 3
ao valor correspondente à geração de energia competitiva,
definida através do custo médio ponderado da geração de Fonte: MME
* Para o relatório completo (em Português), consulte www.gwec.net.
18Balanço do Programa
Ao longo da implantação da primeira etapa foram surgindo
dificuldades práticas que comprometeram o
desenvolvimento de alguns projetos, assim como atrasos
na entrada de funcionamento de grande parte dos mesmos,
entre os quais cabe destacar:
• E xigências onerosas e burocráticas para a obtenção ou
renovação das licenças ambientais dos projetos;
• D
ificuldades e demoras na obtenção de Declaração de
Utilidade Pública dos projetos, qualificação facilitadora
das negociações para obter o direito ao uso dos bens e
Análise do marco regulatório para a generação eólica no Brasil
direitos afetados pelos projetos, em particular dos
terrenos, que em numerosos casos, encontram
comprometidos por complexas relações de uso e
ocupação e disputas entre proprietários e posseiros que
dificultam a identificação titular da propriedade;
• O
bstáculos na conexão às redes, em particular na região
Centro-Oeste;
Parque Eólico do Rio do Fogo © Wind Power Works
• Insuficiente capacidade da indústria nacional para
atender a demanda de aerogeneradores.
(LER-2009, LFA-2010 e LER-2010),o que permitirá aumentar
Devido a estas primeiras experiências, os prazos previstos até 5.300 MW o parque eólico instalado para o horizonte de
no Programa foram prorrogados até sua conclusão. No final 2013, e em seu conjunto poderá trazer investimentos
de 2010, registraram 926MW instalados em 51 parques estimados em valores que poderão ser superiores a 10.000
eólicos correspondentes a 40 projetos através do PROINFA. M$ ao setor eólico no próximo triênio.
Na atualidade o Brasil acaba de superar seus primeiros
1.000 MW de potência eólica instalada. E é esperado que o Gráfico 2: Potência eólica instalada e a ser instalar
programa esteja completamente concluído no final do anualmente (PROINFA+LER 2009+LFA+LER 2010)
corrente ano de 2011.
2.000 [MW] 1.970,2
O ritmo de implantação e a potência instalada dinamizou 1.577
nos últimos dois anos do programa, o que registra uma 1.500
tendência de crescimento sustentável. Hoje se encontra
mais de 97% da capacidade de geração eólica instalada dos 1.000 871,7
projetos atendidos pelo PROINFA.
500
261,4 326,6
Como desenvolvimento dos projetos via PROINFA e em 94
0 0
0
geral, as atividades inerentes a geração eólica, tem recebido
2008 2009 2010 2011 2012 2013 2014 2015
um forte impulso através de mecanismos de contratação
regulada, habilitados pelo Ministério de Minas e Energia em Fonte: PROINFA+LER 2009+LFA +LER 2010
dezembro de 2009 e agosto de 2010, para a contratação de
energia elétrica através dos leilões realizados nestes anos
192. A indústria eólica sendo que o objetivo do setor é de implantar uma base
industrial capaz de produzir e instalar entre 2,0 GW e
No Brasil se observa uma implantação da indústria eólica e 2,5 GW por ano.
de sua cadeia de serviços e fornecimentos o que resulta que
em 2010 já apresenta uma capacidade produtiva O Brasil conta com uma cadeia de fornecimento de
territorialmente diversificada superior a 1.000 MW anuais, equipamentos para atender o mercado eólico, onde
com crescentes investimentos industriais em curso que destacam os principais fabricantes com vocação global:
aumentarão substancialmente a respectiva capacidade,
Gráfico 3: Distribuição da indústria eólica no Brasil-2010
Análise do marco regulatório para a generação eólica no Brasil
Centro-Oeste
Sudeste
Sul
Nordeste
Norte
Fábricas de Pás de Rotores
Fábricas de pás em construção
Fábricas de montagem de turbinas
Fábricas de montagem de turbinas
em construção
Fábricas de Torres
Fábricas de Torres em construção
Fonte: ABEEólica; Elaboração GWEC
20Fábricas de montagem de turbinas-capacidade de consolidando importante presença institucional interna,
fabricação total: 1.500 MW/ano assim como no âmbito internacional, onde vem estreitando
Wobben (Sorocaba): 500 MW/ano; Impsa (Suape- importantes relações de cooperação.
Pernambuco): 600 MW/ano; Gamesa (Bahia) 400 MW/ano;
General Eléctric - Montagem de HUBs - Campinas São Paulo. 3. O mercado eólico
Fabricantes como General Electric, Alstom, Vestas, Siemens,
Suzlon, e o fabricante Chinês Guodian- United Power, Quando o Brasil alcança seus primeiros 1.000 MW de
anunciaram investimentos no Brasil em resposta aos potência eólica instalada, o mercado de fabricantes de
excelentes resultados obtidos nos leilões de 2009 e 2010, de turbinas apresenta o seguinte cenário de distribuição:
modo que a capacidade local de produção de turbinas poderá
Gráfico 4: Potência acumulada or fabricante até
incrementar-se rapidamente até próximo a 2.000 MW/ano.
dezembro de 2010
Fábricas de Pás de Rotores 45 [%]
Análise do marco regulatório para a generação eólica no Brasil
Capacidade de fabricação total, 2.000 MW/ano: Tecsis 40
(Sorocaba- Sao Paulo): capacidade mais de 1.500 MW/ano; 35
Wobben (Sorocaba) para maquinas E70-E74-E82, Wobben
30
(Pecén-Ceará) para maquinas E-40, E48., entre as 2 plantas
Wobben: mais de 600 MW/ano de capacidade. 25
20
Em fase de projeto encontram-se com as seguintes 15
instalações: LM- Bahia 300 MW/ano e anunciadas por 10
Suzlon- Ceará, e Aerys Tecnologia, Ceará. Entrada em
5
funcionamento prevista: 2012.
0
Enercon Suzlon Vestas Impsa
Fábricas de Torres – capacidade de fabricação total
< 1.600 MW/ano. Fonte: ABEEólica
Existentes: Brasilsat, Curitiba, PR - 80 Torres/ano, Engebasa - A contratação de energia elétrica de origem eólica que
SAWE, Cubatão, SP - > 120 torres/ano; Máquinas Piratinga, surge das licitações acontecidas em 2009 (leilões de energia
Recife, PE - 80 torres/ano; Tecnomaq, Fortaleza, CE - 150 torres/ de reserva exclusiva para fonte eólica), e em 2010 (leilão de
ano; ICEQ, Mirassol, SP cerca 100 torres/ano; INTECNIAL, capacidade para fontes de energia alternativas e leilão de
Erechim, RS - 80 torres/ano; RM Eólica Pernambucana (Gonvarri energia de reserva), apresenta um mercado de promotores
+ Arcelor Mittal), Recife, Pernambuco. 200 torres/ano. de parques eólicos com a seguinte distribuição:
Foi também anunciada uma instalação de fabricação de torres Gráfico 5: Mercado de promotores (2010)
pela companhia espanhola GESTAMP em Santa Isabel-SP.
Outros 25% Renova 11%
E, torres de concreto, hoje já se encontram em operação Energimp 7%
três fábricas de torres de concreto da Wobben e também se
Iberdrola 7%
encontram operativas operações de fabricação de torres de
concreto, da INNEO. Enerfin 3%
Martifer 6%
CPE 3%
Energio 3%
Os principais agentes nacionais e internacionais que operam DESA 4% Impsa 5%
no setor eólico no Brasil estão organizados e agrupados sob Energisa 4% CPFL 5%
Contour 4% CHESF 5%
uma única associação profissionalizada e representativa de
SM/JM 4% Gestamp 4%
seus interesses coletivos, ABEEólica, que aumentou
substancialmente sua massa social nos últimos três anos, Fonte: ABEEólica
21Análise do marco regulatório para a generação eólica no Brasil
Parque Eólico do Taíba © Suzlon
4. Desafios setoriais
Os principais desafios aos que se enfrenta o setor eólico no A curto prazo, o desenvolvimento potencial do setor eólico
Brasil em curto prazo estão diretamente relacionados com está delimitado pelos volumes de potência eólica que
o crescimento previsto de seu mercado, para o qual precisa culminaram do PROINFA somados aos que derivam das
aumentar substancialmente o ritmo de instalação com novas modalidades de contratação regulada:
relação ao mantido no passado, com o fim de atender o
programa de entregas de energia resultante dos novos
mecanismos de contratação para o horizonte de 2013, e
posteriores, o que implicará: Tabela 1: Potência eólica em operação em
31/12/2010, PROINFA, em construção e atribuída
• M
obilizar e assegurar a alocação de maiores volumes de a processos licitatórios de 2009 e 2010 no Brasil
recursos financeiros aos projetos e incrementar os ritmos
de financiamento; Estados MW Em Operação MW Futuros - 2013
Bahía 0 977,0
• Incrementar a capacidade produtiva da indústria eólica, Ceará 502,2 692,0
reforçando sua presença no Brasil, e desenvolver novas Paraiba 61,8 5,4
tecnologias adaptadas às características dos recursos Paraná 2,5 0,0
eólicos e do funcionamento do sistema elétrico no país,
Pernambuco 25,2 0,0
e;
Piauí 18,0 0,0
Rio De Janeiro 28,1 135,0
• R
esolver as necessidades logísticas da cadeia de serviços
Rio Grande Do Norte 102,1 1.842,0
e de fornecimento das atividades empresariais,
Rio Grande Do Sul 158,0 502,0
profissionais e fabris implicadas no desenvolvimento dos
Santa Catarina 14,4 217,7
projetos e investimentos.
Sergipe 0 30,0
Total 929 4.401,1
Fonte: ANEEL
22A distribuição de cargas elétricas entre os estados consideração no próximo plano de infraestruturas elétricas
produtores de eletricidade a partir da geração eólica prevista de transporte e de distribuição.
na atualidade brasileira para o horizonte temporal de 2013,
responderá pela distribuição de potência eólica representada Entre os desafios que enfrenta o setor eólico no Brasil,
no seguinte gráfico: destacamos a necessidade de que se garanta a efetiva
conexão das instalações e o acesso da geração procedente
Destaca a região Nordeste que concentra mais de 80% da das mesmas ao sistema elétrico. O setor eólico brasileiro
potência eólica contratada, o que deve ser levado em apóia os reforços das infraestruturas elétricas na região
Gráfico 6: Distribuição territorial de potência eólica
519 MW 102 MW
692 MW 1.842 MW
Análise do marco regulatório para a generação eólica no Brasil
18 MW 61,8 MW
5,4 MW
25,2 MW
30 MW
Centro-Oeste
977 MW
Sudeste
Sul
Nordeste
Norte
2,5 MW 28,1 MW
135 MW
14 MW
218 MW
Potência eólica em operação (MW)
158 MW
502 MW Potência eólica futura – 2013 (MW)
Fonte: ABEEólica; Elaboração GWEC
23You can also read