Green Provinces of Canada - Ontario and British Columbia lead the peloton in the race to become Canada's greenest province* - Corporate Knights
←
→
Page content transcription
If your browser does not render page correctly, please read the page content below

Green Provinces
of Canada
Ontario and British Columbia lead the peloton
in the race to become Canada’s greenest province*
By Erin Marchington
Illustrations by Clayton Junior

40 • Corporate Knights • Sp r in g 2012

Here is a look at who’s leading
                                                                  the way in each category:
                                                                  Air and Climate: With a score of 87 per cent,
                                                                  the territory of Yukon secured top spot in this category by
                                                                  ranking first in four of nine indicators. Most notably, Yukon
                                                                  has reduced its greenhouse-gas emissions by 41.3 per cent
                                                                  between 1990 and 2009, greatly exceeding the Kyoto target
                                                                  of 6 per cent below 1990 levels by 2012. Per dollar of GDP
                                                                  it also has the lowest levels of fine particulate, mercury and
                                                                  chromium emissions.
                                                                      Ontario, which scored 83 per cent, stood out as the top
                                                                  province by having the highest GDP per kilotonne of nitro-
                                                                  gen oxide (NOx) and volatile organic compounds (VOC)
                                                                  emitted, and among the highest GDP per megatonne of
                                                                  GHG emissions. Ontario, like the Yukon, is the only other
                                                                  jurisdiction to achieve Kyoto compliance.

                                                                  Water: Northwest Territories (N.W.T.) ranked first with
                                                                  a score of 80 per cent, taking top spot in half of the category
                                                                  indicators. Perhaps unsurprising for a sparsely populated
                                                                  jurisdiction, all monitored stations in N.W.T. were observed
                                                                  to have normal or high water quantity. Most impressive was
                                                                  N.W.T.’s water productivity. It had the highest GDP per litre

I
     t’s mid-summer and the air is thick. Thirteen riders         of water use, with Alberta following closely behind.
     form a peloton in the 10th stage of Le Tour De France,           The two provinces, however, with the highest overall
     grinding their way through the French Alps. All are in       score in this category were Saskatchewan and Manitoba,
pursuit of the coveted yellow jersey, cycling’s most presti-      each scoring 78 per cent. They showed low counts of toxins
gious prize. But in the mountains with 10 more stages in          released into water supplies and high rates per capita of sec-
the tour to go, it’s still anybody’s race. The riders are close   ondary wastewater treatment.
together, drafting, and there are no breakaways yet.
    Canada’s provinces and territories have clearly formed        Nature: The Yukon (82 per cent) and Alberta (81 per
a peloton in the 2012 Corporate Knights Green Provincial          cent) scored significantly higher than others, each ranking
Report Card, with Ontario and British Columbia leading            first in two indicators. The Yukon ranked tops when it came
the pack and Alberta and Saskatchewan struggling to keep          to preserving the ecological integrity of its national parks. It
up. But no one has yet broken away in the race to become          also shared top spot with Alberta (and P.E.I.) by achieving
Canada’s greenest province or territory.                          greater than one visit per capita at its national parks in the
    We evaluated their environmental performance using            2010/2011 season.
a series of 35 indicators grouped into seven categories: air          Alberta – along with Quebec and Ontario – also had the
and climate, water, nature, transportation, waste, energy         highest percentage of forestland protected under the FSC-
and buildings, and innovation. Building on previous CK            certified management indicator, with 5,656,930 hectares
green province reports, this year’s ranking methodology           FSC-certified in 2010. B.C. has the most overall protected
used the most current available data (ranging from 2008 to        areas, followed closely by Alberta.
2011). Much of it came through federal sources that allowed
for direct comparisons between Canada’s 13 jurisdictions.         Transportation: Nunavut scored 95 per cent
One major source was Environment Canada’s new Canadi-             here, putting it far above all other provinces and territories.
an Environmental Sustainability Indicators (CESI) database,       Kilometres driven per capita for both light duty (940.3 km)
which was just made publicly accessible last year.                and heavy duty (62.7 km) vehicles were well below the na-
    Our aim is to give readers a snapshot of the environmen-      tional average of 9,069 km and 639.8 km, respectively. This
tal health and resource productivity of our provinces and         may be partially explained by the lack of road and highway
territories, and in doing so give a sense of how serious each     infrastructure in the territory. Only British Columbia came
jurisdiction is in dealing with such challenges. As you read,     close to Nunavut’s transportation performance – at least
it is important to note that these indicators are influenced      with respect to heavy vehicles, which in the province trav-
not just by past provincial policy decisions, but also by mu-     elled an average of 132.9 km per capita.
nicipal and federal policies. They also don’t reflect the im-         Manitoba and Newfoundland had the highest fuel effi-
pacts of relatively new policies and programs, which will no      ciency for heavy duty vehicles, while Quebec and Nova Sco-
doubt affect the conclusions of future reports.                   tia had the most fuel-efficient light duty vehicle fleets.

                                                                                             Sp r ing 2 0 1 2   • Corporate Knights • 41
Waste: With a score of 71 per cent Nova Scotia came                       Where do
out clearly on top, showing the highest efficiency in the area
of waste disposal. The province earned $80,000 in GDP for
                                                                          we go from here?
every tonne of disposed waste, making it twice as efficient

                                                                          I
as lowest-ranking provinces Manitoba and Quebec. No data                      n at least one of the seven categories in our 2012 Green
was available for the territories.                                            Provinces Report Card we see the Yukon, Northwest
    Nova Scotia also scored relatively well for its waste di-                 Territories, Alberta, Nunavut, Nova Scotia and B.C.
version efforts. The province diverted 308 kg of material per             leading the way. Ontario didn’t lead any single category, so
capita annually, exceeding the national average of 251 kg/                how did it come out on top overall?
capita diversion and well within striking distance of leaders                 No one province or territory excels in every category,
B.C. and New Brunswick.                                                   similar to cyclists in le Tour. Some achieve highest or sec-
                                                                          ond highest scores in one category, but lowest scores in
Energy and Buildings: Many provinces and                                  other categories. Ontario and B.C. both topped our 2012
territories are struggling in this category and there is no               ranking because they achieved highest or second highest
clear front-runner. Overall winner B.C. scored a lacklustre               scores in multiple categories, and have no extremely low
60 per cent. It didn’t get highest score in any single indicator          scores. Even so, out of an ideal overall grade of 100 per cent
but was relatively strong across most of them. It received                Ontario achieved only 61 per cent and B.C. achieved a grade
89 per cent of its electricity generation from a combination              of 60 per cent, which relative to other provinces gave them
of hydroelectric, wind, solar and other renewables, and had               an A– letter grade.
a total of 9,820 grant applications for the ecoENERGY home                    There’s room to do so much better. CK has calculated
retrofit program last year, working out to about 22 applica-              that if all provinces and territories got the highest score in
tions per 10,000 people – higher than the national average.               each of the seven categories measured in our 2012 report,
                                                                          the Canadian average would be 86 per cent, making our na-
Innovation: On the other hand, B.C. was the clear                         tion more than just an excellent student. Indeed, it would
leader in the category of innovation with an overall score                put us in the category of green economy genius.
of 93 per cent. It achieved a very high grade for both the                    It’s clearly doable. For each indicator of each category, it
amount of venture capital its green technology businesses                 has already been done by at least one province or territory.
are attracting and the number of cleantech companies per                  To pursue such best practices on a national scale, however,
capita that call the province home. Between 2002 and 2011                 will require much greater cooperation, collaboration, and
venture capitalists have invested over $138 per capita in                 information sharing than experienced so far.
B.C.’s green startups; only Ontario comes close to this with                  Behind that is the belief that each and every province
an average investment of $80.50 per capita. With 160 clean-               and territory can achieve continued economic prosperity
tech companies in total at the end of 2011, B.C. also has one             without needless sacrifice to the environment, and the natu-
of the highest numbers of companies per capita.                           ral capital necessary to sustain our long-term well-being. K

   Methodology                                                            *How the layout was approached

                                                                          T
                                                                                 he next six pages in this package show the overall
   Research Team:                                                                ranking, grade and individual category ranking for
   Erin Marchington: Lead researcher                                             Canada’s 10 provinces, starting with British Colum-
   Katie Howard: Researcher                                               bia and moving east to Newfoundland and Labrador. Our
                                                                          Green Provincial Report Card ranks the country’s 13 prov-
   Green Provinces Advisory Committee:                                    inces and territories together, but the low population den-
   Faisal Moola, program director of terrestrial conservation             sities of the territories make it difficult – and not particu-
   and science at the David Suzuki Foundation                             larly helpful – to directly compare with provinces in some
   Sachi Gibson, technical and policy analyst at the Pembina Institute    categories. For this reason we have excluded the territories
   Jose Etcheverry, assistant professor, Faculty of Environmental         from the layout of the summary report that follows. Please
   Studies, York University                                               note that the rankings that follow will, as a result, be out of
                                                                          10, not 13.
   Sources of Data:
   Environment Canada, Natural Resources Canada, Forest Steward-          For a detailed look at how the territories
   ship Council, Parks Canada, Transport Canada, Statistics Canada,       performed and where they rank relative
   Cleantech Group, Analytica Advisors                                    to each other and other provinces, visit
                                                                          corporateknights.com/greenprovinces.
   Methodology:
   For methodology, details on each indicator and analysis limitations,
   go to corporateknights.com/greenprovinces

42 • Corporate Knights • Sp r in g 2012
Sp r ing 2 0 1 2 • Corporate Knights • 43
British Columbia
Strengths
A green-energy powerhouse that gets 89 per
cent of its electricity from renewables and is
a hotbed for clean technology innovation. In
the area of transportation, B.C. is the prov-
ince with the lowest vehicle-kilometres trav-
elled per capita, for both heavy duty and light
duty vehicles. B.C. is also one of the least
wasteful provinces, with a relatively high GDP
per tonne of waste disposed and one of the
highest waste diversion rates in the country.     Ranked 2nd

Weaknesses
Gets low grade for water and could do much
                                                  A-
more to lower GHGs and other pollutants.
                                                  4th   Air + Climate
B.C. had the lowest number of water stations
                                                  9th   Water
with “normal” or “high” water quantity, a poor    4th   Nature
water quality score, and less than 60 per cent    1st   Transportation
of its population is served with secondary        2nd   Waste
wastewater treatment. GDP per kilotonne           1st   Energy + Building
of GHG and non-GHG emissions are mostly           1st   Innovation
above the national average, but not reflective
of a province blessed with vast green-energy
resources.

                                                          Alberta
                                                          Strengths
                                                          Rates high in the nature category with 12.4
                                                          per cent of land given protected status to
                                                          conserve habitat of ecological importance.
                                                          Also tops in percentage of forest land certi-
                                                          fied under Forest Stewardship Council and
                                                          has relatively high visits per capita to national
                                                          parks. In water category, is province with
                                                          highest GDP per litre of water used. It hosts
                                                          an above-average number of clean technol-
                                                          ogy companies, while nearly 10 per cent of
                                                          new housing starts are “green homes,” ahead
Ranked 9th                                                of most provinces.

C                                                         Weaknesses
                                                          Low energy productivity, highest residen-
10th   Air + Climate                                      tial energy use per capita, and province with
5th    Water                                              least amount of renewables in electricity mix
1st    Nature                                             at 5.72 per cent. Province with the highest
10th   Transportation
                                                          number of kilometres travelled per capita, for
7th    Waste
10th   Energy + Building
                                                          both heavy duty and light duty vehicles. Sec-
5th    Innovation                                         ond-highest GHGs per capita and second-
                                                          lowest carbon productivity, reflecting oil sands
                                                          growth and heavy dependence on fossil fuels
                                                          for electricity generation. This is also reflected
                                                          by high emissions of non-GHG pollutants,
                                                          including NOx, VOCs and chromium.

44 • Corporate Knights • Sp r in g 2012
Ranked 10th
Saskatchewan
                                                                                           C
Strengths                                                                                   9th     Air + Climate
Performs well in water category. Has rela-                                                  2nd     Water
tively low releases of mercury, lead and cad-                                               6th     Nature
mium into water systems, and has second-                                                    9th     Transportation
ary wastewater treatment for more than 90                                                   8th     Waste
per cent of population. Virtually all monitored                                             9th     Energy + Building
water stations report normal or high quan-                                                  7th     Innovation
tities with fairly average quality ratings. Citi-
zens keen on home efficiency. Province had
highest number of applications per capita
for the 2011/12 ecoENERGY home retrofit
program.

Weaknesses
Saskatchewan has one of the lowest GDPs
per tonne of waste disposed and one of the
lowest waste diversion rates in country. It has
lowest energy productivity, the second-high-
est residential energy use per capita, and an
electricity system heavily dependent on coal.
Province with the second-highest number of
kilometres travelled per capita for light duty
vehicles and third-highest for heavy duty
vehicles. Has highest GHGs per capita, lowest
carbon productivity score, and saw high-
est growth of GHG emissions in the country
between 1990 and 2009.

                                                               Manitoba
                                    Ranked 8th
                                                               Strengths
                                    C+                         Like Saskatchewan, Manitoba is a high per-
                                                               former in the water category, but also does
                                                               well in energy. It has relatively high GDP per
                                    6th    Air + Climate       litre of water used and 98 per cent of popu-
                                    1st    Water               lation has secondary wastewater treatment.
                                    10th   Nature
                                                               As well, all water monitoring stations show
                                    8th    Transportation
                                    9th    Waste
                                                               normal or high levels and there is below-aver-
                                    2nd    Energy + Building   age release of toxins. Manitoba’s electricity
                                    9th    Innovation          mix is virtually 100 per cent renewable.

                                                               Weaknesses
                                                               Its economy is wasteful. It only produces
                                                               $40,000 in GDP for every tonne of waste
                                                               disposed – putting it tied for last place with
                                                               Quebec – and it has the lowest waste diver-
                                                               sion per capita in Canada. In transportation,
                                                               its heavy-duty vehicle fleet averages second-
                                                               highest kilometres travelled per capita (prov-
                                                               inces only) and has the lowest fuel efficiency
                                                               in the country. Its national parks, meanwhile,
                                                               score lowest on ecological integrity.

                                                                                Sp r ing 2 0 1 2   • Corporate Knights • 45
Ranked 1st
Ontario
Strengths
                                                                                  A-
Still on a path to phase out coal power and                                       1st   Air + Climate
phase in more renewables, Ontario already                                         9th   Water
scores high in air and climate. It generates                                      3rd   Nature
the most GDP per kilotonne of NOx, VOCs,                                          6th   Transportation
and particulates, and for every megatonne of                                      5th   Waste
CO2-equivalent GHGs. It has reduced GHGs                                          3rd   Energy + Building
by 6.5 per cent since 1990, making it the only                                    2nd   Innovation
province to reach Kyoto emission-reduction
targets. It gets high marks for building green
homes and embracing energy retrofits for old
ones, and is a clean technology leader.

Weaknesses
Waste diversion per capita is below the national
average. Among provinces, it has the lowest
visits per capita to national parks. Its residen-
tial sector’s energy use per capita is slightly
below the national average. In the area of
water, it scores near the bottom because of
high levels of mercury, lead and cadmium
releases relative to the other provinces.

                                                    Quebec
                                                    Strengths
                                                    The province scores well in the air and cli-
                                                    mate category, having reduced its GHG emis-
                                                    sions by 1.9 per cent since 1990. Also leads
                                                    the country with the lowest GHG levels per
                                                    capita. An emphasis on boreal forest protec-
                                                    tion has led to over 50 per cent of its forests
                                                    being FSC certified. Hydro-electric power
                                                    continues to power the province, with 97
                                                    per cent of energy generation coming from
                                                    renewable sources. Light vehicles are fuel
                                                    efficient, burning 9.9 litres per 100 km.
Ranked 4th
                                                    Weaknesses
B                                                   Quebec receives lowest water score by main-
                                                    taining poor water quality, releasing large
                                                    amounts of mercury, lead and cadmium into
3rd    Air + Climate                                streams and rivers, and consuming 706 litres
10th   Water
                                                    of water a day per capita. National park visi-
2nd    Nature
3rd    Transportation
                                                    tation is sporadic, with under 1.5 million visits
4th    Waste                                        last year. The waste score is reduced due to
4th    Energy + Building                            the province being tied with Manitoba in gen-
6th    Innovation                                   erating the highest levels of waste compared
                                                    to GDP output. Chromium emissions are ele-
                                                    vated in the air and climate category.

46 • Corporate Knights • Sp r in g 2012
New Brunswick                                                                          Ranked 7th

Strengths
Earns high grade in transportation, with
                                                                                       C+
lowest levels of heavy duty vehicle usage                                              7th   Air + Climate
after B.C. New Brunswick is competitive on                                             6th   Water
waste, with highest rate of diverted mate-                                             9th   Nature
rial per capita annually. The province’s water                                         2nd   Transportation
quality leads the nation, and it has the great-                                        3rd   Waste
est percentage of cumulative species that                                              6th   Energy + Building
                                                                                       8th   Innovation
are not in danger at 88 per cent. The pop-
ulation, along with that of Saskatchewan,
took the greatest advantage of the federal
ecoENERGY home retrofit program.

Weaknesses
Only 3.1 per cent of the province qualifies as a
protected nature area, and there are no FSC
certified forests. New Brunswick uses great-
est amount of water per capita, and residen-
tial consumption is high. Inefficient levels of
GHG per capita push air and climate scores
down, along with elevated sulphur oxide and
mercury emissions. Low energy productivity,
along with inefficient residential energy use,
places the province in front of only Alberta
and Saskatchewan in energy category.

                                                   Nova Scotia
                                                   Strengths
  Ranked 5th                                       Leads all provinces in waste management,
                                                   mixing the most efficient levels of waste dis-

  B-                                               posal per capita with a high diversion rate.
                                                   National parks within provincial boundaries
                                                   have the greatest ecological integrity, and
  8th   Air + Climate                              cumulative species status score is high as
  4th   Water                                      well. Residential energy use per capita is tied
  5th   Nature                                     for second in efficiency, and the province is
  7th   Transportation
                                                   home to greatest percentage of new green
  1st   Waste
  8th   Energy + Building
                                                   certified housing starts. It also maintains the
  4th   Innovation                                 third-largest number of cleantech companies
                                                   per capita.

                                                   Weaknesses
                                                   Nova Scotia has third-lowest air and climate
                                                   score, due to GHG emissions growing 10.5
                                                   per cent since 1990, low levels of GHG effi-
                                                   ciency, and elevated sulphur oxide levels.
                                                   Energy ranking was affected by small amount
                                                   of electricity generation, 12 per cent, being
                                                   derived from renewables. Municipal waste-
                                                   water treatment levels are low in the prov-
                                                   ince, with only 31 per cent of residents living
                                                   in areas with secondary wastewater treat-
                                                   ment facilities or better.

                                                                    Sp r ing 2 0 1 2   • Corporate Knights • 47
P.E.I.
                                          Ranked 3rd                       Strengths
                                                                           Rates third on air and climate, with low GHG
                                          B+                               emissions per capita. The province has reduced
                                                                           its GHG emissions by 3.4 per cent since 1990.
                                          2nd   Air + Climate
                                                                           By treating 100 per cent of municipal wastewa-
                                          3rd   Water                      ter and releasing no lead, cadmium or mer-
                                          8th   Nature                     cury, it is ranked third on its water score as well.
                                          5th   Transportation             Prince Edward Island is tied with Manitoba in
                                          n/a   Waste                      generating the most energy, 99 per cent, from
                                          5th   Energy + Building          renewable sources, though this is largely
                                          3rd   Innovation                 because other sources of energy are bought
                                                                           from neighbouring provinces.

                                                                           Weaknesses
                                                                           The province is ranked third from the bottom
                                                                           on nature, with smallest amount of protected
                                                                           area set aside, and the second-lowest cumula-
                                                                           tive species status score. Transportation cate-
                                                                           gory is affected by significant use of the least
                                                                           fuel-efficient heavy vehicles in the country.
                                                                           Water quality is poor, tied with Manitoba for
                                                                           the second-lowest rating after Quebec. Clean-
                                                                           tech position is lowered because P.E.I. is one of
                                                                           only two provinces that has received no venture
Newfoundland &                                                             capital investments since 2002.

Labrador
Strengths
Competitive in several nature categories,
maintaining the strongest levels of ecological
integrity in national parks, the second-high-
est score in species protection, and a high
volume of Parks Canada visitation. In the
transportation category, heavy vehicles in
Newfoundland are second in fuel efficiency.
They are driven rarely, at an average of 437
km per capita. The 97 per cent of electricity
generation coming from renewables boosts
its energy ranking.

                                                                    Ranked 6th
Weaknesses
Newfoundland has the lowest innovation
score due to the lack of venture capital
                                                                    C+
investment over the past decade, as well as
containing the smallest number of cleantech                         5th    Air + Climate
companies per capita of any province. Water                         7th    Water
quality and treatment is low, as only 7.9 per                       7th    Nature
cent of the population has secondary waste-                         4th    Transportation
                                                                    6th    Waste
water treatment or better. The province’s
                                                                    7th    Energy + Building
nature indicators suffer as a result of no FSC                      10th   Innovation
certified forests, and just 4.6 per cent of land
being designated as a protected area.

48 • Corporate Knights • Sp r in g 2012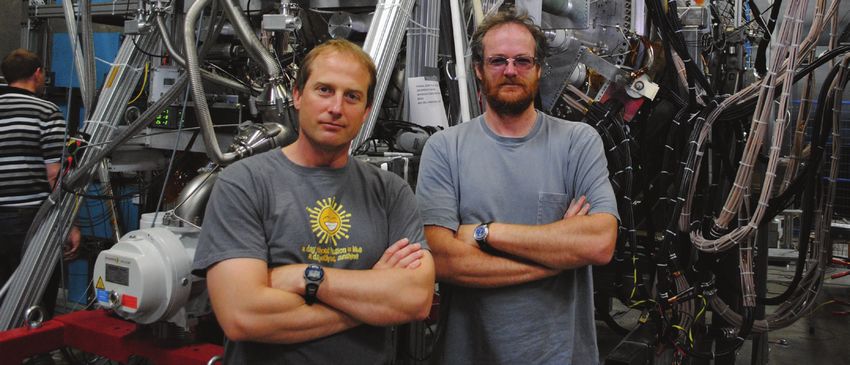
Sp r ing 2 0 1 2 • Corporate Knights • 49
50 • Corporate Knights • Sp r in g 2012
Sp r ing 2 0 1 2 • Corporate Knights • 51
Canada’s Pickup Province                                                                       Looking ahead, don’t expect electric
                                                                                           vehicles to save the day. “In a more fos-
                                                                                           sil fuel intensive grid, such as Alberta’s,
Bigger vehicles, longer drives mean                                                        the benefits of battery electric and plug-
                                                                                           in hybrid EVs is undermined by a reli-
low transportation grade for Alberta                                                       ance on coal for electricity production,”
By Tyler Hamilton                                                                          according to the Pembina Institute, an
                                                                                           energy and environmental think tank
                                                                                           based in Calgary.

                                                                                           Alberta has the highest
                                                                                           number of light-duty
                                                                                           vehicles per household
                                                                                           and per capita of
                                                                                           any province.

                                                                                               It points out that driving a plug-in
                                                                                           electric vehicle in Alberta would reduce
                                                                                           carbon dioxide (or equivalent) emis-
                                                                                           sions by only four grams per kilometre,
                                                                                           or 1.1 per cent, compared to a conven-
                                                                                           tional gasoline-powered vehicle. This
                                                                                           could improve if the province, with its
                                                                                           strong wind, geothermal and country-
                                                                                           leading solar resources, moved to make
                                                                                           renewable energy sources and natural
                                                                                           gas a larger part of its power mix.
                                                                                               Nicholas Rivers, Canada Research
                                                                                           Chair in Climate and Energy Policy at
                                                                                           the University of Ottawa, said cheap
                                                                                           natural gas and renewables – particu-

I
    t’s not difficult to look around Alber-   • The number of vehicles in Alberta grew     larly wind – represent a potent combi-
    ta and find innovative initiatives that   by 36 per cent between 2000 and 2009,        nation for moving away from coal. “If
    are helping to green up the prov-         by far the highest growth rate of any        ‘fast’ emissions reductions were really
ince. Calgary’s light-rail transit system,    province.                                    a priority then this would be one way
the CTrain, is the first in Canada to get                                                  to achieve it,” he said. Electric vehicles
all of its electricity from wind power.       • Alberta has the highest number of light-   would then make more sense.
The Town of Okotoks became the first          duty vehicles per household and per cap-         Aggressively converting Alberta’s
community in North America to heat            ita of any province.                         fleet of about 218,000 medium- and
a neighbourhood with a solar district                                                      heavy-duty diesel trucks to run on com-
heating system. Edmonton, meanwhile,          • Alberta and Saskatchewan are the only      pressed (CNG) or liquefied natural gas
is poised to become the first munici-         two provinces that have more vans, SUVs      (LNG) could also have a near-term im-
pality in Canada to produce ethanol at        and pickup trucks on the road than cars      pact. A study by the consultancy ICF
a commercial scale from its municipal         and station wagons. Specifically, Alberta    Marbek estimates that switching to
solid waste.                                  has 1.46 million vans, SUVs and pickup       CNG or LNG from diesel would reduce
    But isolated initiatives such as these    trucks compared to 1.12 million cars and     greenhouse-gas emissions by 19 per
are lost within Alberta’s larger environ-     station wagons.                              cent and 23 per cent respectively.
mental footprint. The oil sands are an                                                         Other alternatives? Use smaller, more
obvious target, as well as the province’s     • The amount of energy used for trans-       fuel-efficient vehicles. Carpool and car
power system, which generates 75 per          portation in Alberta grew by 38 per cent     share. Invest in and encourage transit
cent of its electricity from coal. Less       between 2000 and 2009, the second-           use. It’s a hard sell in wild rose country,
discussed is the love affair Albertans        highest growth rate in the country after     where pickup trucks rule the roads and
– along with their neighbours in Sas-         Saskatchewan.                                roughly a quarter of provincial gross
katchewan – have with their vehicles.                                                      domestic product comes from the oil
    Alberta ranks near the bottom in the      • Heavy-duty vehicles in Alberta drive       and gas sector. But Albertans are also a
transportation category of our Green          more kilometres per capita than any other    tough bunch, bursting with innova-
Provincial Report Card. Consider the          province – more than double compared to      tion, and never ones to walk away from
following data from Transport Canada          Ontario and triple compared to Quebec.       a challenge. K
and Natural Resources Canada:

52 • Corporate Knights • Sp r in g 2012
Sp r ing 2 0 1 2 • Corporate Knights • 53
methods. Local opponents to new land-
                                                                                           fills, who express strong concern about
                                                                                           soil and water contamination, have ef-
                                                                                           fectively convinced municipalities over
                                                                                           the past decade to continue operating
                                                                                           existing facilities that are rapidly fill-
                                                                                           ing up. To meet existing demand, On-
                                                                                           tario alone maintains 32 large landfill
                                                                                           sites, along with 958 smaller ones. Over
                                                                                           2,000 sites have been retired over the
                                                                                           past century, according to the Ontario
                                                                                           Ministry of the Environment.
                                                                                                As Canada struggles to meet its goal
                                                                                           of reducing greenhouse-gas emissions
                                                                                           17 per cent below 2005 levels by 2020,
                                                                                           leading sources of methane expulsion
                                                                                           have faced greater scrutiny. Environ-
                                                                                           ment Canada reported that Canadian
                                                                                           landfills in 2010 accounted for 20 per

Burn After Reading                                                                         cent of national methane emissions.
                                                                                           This is one area where utilities and
                                                                                           private companies have been active in
Garbage incineration may not sound pretty, but                                             waste-to-energy, by setting up systems
                                                                                           to capture and combust methane emit-
it’s gotten a lot cleaner, and may be our best bet                                         ted from the breakdown of organic ma-
for combatting a growing municipal waste problem.                                          terials. The introduction of methane
                                                                                           capture technology at 42 disposal sites
By Jeremy Runnalls
                                                                                           in Canada has resulted in 25 per cent of
                                                                                           methane emissions being transformed
                                                                                           into energy. Methane capture systems

F
        rom the top of Amagerforbrænd-       room, and this was our only option.”          have grown in popularity in Canada
        ing, the largest of three gar-           But the Danes quickly realized the        over the past decade compared to gar-
        bage incineration plants located     combustion of waste had other benefits,       bage incineration plants. They are less
in downtown Copenhagen, is an idyllic        such as the production of electricity and     expensive to install, face muted com-
panorama of the waterfront. A newly          heat. Incineration now falls more broad-      munity opposition and have received
constructed opera house, donated by          ly into the waste-to-energy category.         federal tax incentives and funding from
shipping magnate Maersk Mc-Kinney            Countries such as Denmark and Japan           pools of money, such as the Green In-
Moller, casts a shadow over the water        have located their incinerators in urban      frastructure Fund.
several kilometres away. A new island,       centres so that the steam can be used to           So is it better to burn or bury waste
built by the municipality and covered        power or heat nearby homes.                   for clean electricity generation? The
with imported sand to act as a beach-            Even as incineration facilities have      U.S. Environmental Protection Agency
front during the summer, is within           proliferated throughout Europe and            analyzed this question in a compre-
walking distance. The plant has been         Asia over the past several decades,           hensive life-cycle report published in
embraced by the general public, with         North America has been reluctant to           conjunction with North Carolina State
nearby residents so accustomed to it         embrace them. No new incinerators             University in 2009. They determined
that the city council is currently consid-   have been built in Canada or the United       that, if paired with a high diversion
ering a proposal for retrofitting the fa-    States for the past 15 years, due to well-    rate, the newest incineration technolo-
cility to include a fully functioning ski    organized public opposition. Accord-          gies generate significantly more energy,
hill on top.                                 ing to the Canadian Energy-from-Waste         while reducing the greenhouse-gas
    In Denmark, the burning of waste         Coalition, only eight facilities exist in     emissions and habitat loss that come
has been an accepted practice for over       Canada, processing 3 per cent of the          from traditional landfills.
40 years. Jan Gehl, a well-known Dan-        country’s municipal solid waste. Den-              More than a decade since the last
ish urban design architect, believes that    mark, a country of just 5.5 million peo-      Canadian incinerators were built, mu-
this originally stemmed from space           ple, diverts 54 per cent of its waste to 29   nicipalities are beginning to consider
constraints in a country 38 times more       incineration plants, many of them using       new waste-to-energy systems as part of
densely populated than Canada. “We’ve        the most advanced technologies on the         their overall waste management strate-
never had the luxuries that North Amer-      market.                                       gy. Proposed facilities in Vancouver and
icans enjoy, where you can easily find           With Canada’s municipal waste vol-        Durham/York County, north of Toronto,
an inexpensive location for large-scale      umes rising steadily on a per capita ba-      each received city council approval last
garbage disposal out of sight and out of     sis since 1980, there has been a growing      July. Since then, however, they have be-
mind. In the 1970s, we simply ran out of     need to find alternative waste disposal       come ground zero for local opposition.

54 • Corporate Knights • Sp r in g 2012                                                        Photo courtesy of Amagerforbrænding
The author inspects
mechanical claws
used to manage the
constant stream of
waste entering into
the facility.
for Canadian municipalities.”
Several other projects have been de-
veloped or are in the works within Can-
ada that produce energy in a different
Artist's rendering of proposed ski hill in downtown Copenhagen that would be built atop current incinerator. manner from combustion or methane
capture. A plasma gasification facility
Denmark, a country of just 5.5 million people, diverts in Ottawa, run by Plasco Energy Group,
recently signed a new deal with the city
54 per cent of its waste to 29 incineration plants to continue processing unprocessed
and unsorted solid waste. A proposed
emissions standards, which are some of waste-to-ethanol plant in Edmonton,
the strictest in the world. “Compared run by Montreal-based Enerkem has
to other sources of air pollution hu- received provincial funding and is cur-
man activities create, concerned citizens rently under construction.
should not be focused on dioxins.” The private sector has grown more
The other suspicion, shared by many enthusiastic about Canadian waste-
opponents of incineration, is that mod- to-energy opportunities as well, led by
ern waste-to-energy plants undercut industry leader Waste Management
municipal recycling and diversion pro- of Houston, Texas. While continuing to
grams by creating a constant need for invest in methane capture through-
waste. Former Toronto mayor David out North America, the company set
Miller, a vocal opponent who instituted up a venture capital arm about five
Waterfront view from roof of Amagerforbrænding.
a ban on incineration within Toronto years ago to invest in startups focused
and fought the proposed Durham/York on expanding recycling and managing
Resistance falls into two camps. The waste-to-energy plant while in office, waste. It has spent hundreds of millions
incinerators that the Canadian pub- describes incineration as “expensive since then, including the purchase of an
lic has previously been exposed to, like and polluting, but most of all damaging 11 per cent stake in Enerkem in 2010.
the Algonquin energy-from-waste facil- to recycling efforts.” More recently, it invested $8.5 million
ity in central Ontario, are decades old Nobel, however, disputes this claim. directly into Enerkem’s waste-to-etha-
and outfitted with obsolete technology. Danish municipalities have placed di- nol facility in Edmonton.
Residents of Vancouver and Durham/ version at the top of their list, recycling “We’re really focused on finding
York fear these plants will bring about 54 per cent of their waste, and burning those technologies and processes that
similarly-reduced air quality. Former 42 per cent. What can’t be burned safely is can help us efficiently segregate materi-
Canadian Idol contestant Shane Wiebe diverted to one of only two landfills in the als that are in our waste streams,” says
has even written a protest song about it, country, and chemicals, paint and elec- Joe Vaillancourt, managing director in the
called “landfill in the sky.” tronics are processed at special facilities. organic growth group at Waste Manage-
University of Victoria climate scien- A strong recycling system, explains ment. Once segregated, some materials
tist Andrew Weaver, however, says the Matt McCulloch, director of corporate can be recycled, some turned into green
science doesn’t support those fears. He consulting at the Pembina Institute, is chemicals, some into energy. “We’ve got
states that most of the particulate mat- paramount to constructing successful about 40 investments so far,” he says.
ter, which used to be released by incin- incineration facilities within Canada. With enthusiasm for new landfills
erators, is now captured by scrubbers “Waste-to-energy is not an excuse to waning and utilities hungry for further
and filters before being released into the ignore or sideline community recy- energy generation, more cities are sure
air. Christian Nobel, a specialist in waste cling systems. Carefully sorting through to follow Vancouver’s and Ottawa’s lead
management at the Danish environ- waste to recycle as much as possible, in considering incineration in the years
mental consultancy Veksebo, points out while diverting the rest to waste-to- ahead. But it promises to be a tough
that similar facilities easily pass Danish energy facilities, is the optimal scenario haul. K
Sp r ing 2 0 1 2 • Corporate Knights • 55The Nature Effect
How green space can improve a province’s
bottom line
By Faisal Moola
I
n the early 1990s the Clinton ad- now represents less than 1 per cent, and work can result in less stress and more
ministration put a stop to logging in compared to growing film production job satisfaction among employees, as well
huge swaths of old growth forest in (2 per cent), high-tech (8 per cent), and as increased productivity and reduced ab-
the U.S. to protect a small, non-descript tourism (10 per cent). senteeism and employee turnover.
brown bird that was facing extinction: This shift in employment patterns is In addition to health benefits, nature
the northern spotted owl. Many people partly because many former resource- also provides a myriad of non-market
predicted that forestry-dependent com- dependent communities located near economic benefits, according to re-
munities in Oregon and Washington larger urban areas have been success- search by the David Suzuki Foundation
State would be eviscerated by the deci- ful in attracting diversified businesses and others. These benefits come in the
sion to protect “owls over jobs.” That – drawing city people who want to shift form of services provided by the com-
fear was exploited by George Bush Sr., gears and enjoy the benefits of living in a munity’s natural ecosystems, or natural
who attacked Clinton’s Northwest For- community more connected with nature. capital. Forests purify the air and keep
est Plan with the claim that “We’ll be For many firms, the motivation to the city cool in summer. Wetlands filter
up to our necks in owls and every mill establish workplaces in communities drinking water and protect communi-
worker will be out of a job.” like Eugene and Portland in Oregon ties from floods. Fields and farms pro-
Bush’s prediction that environmen- and Victoria, B.C., or nearby bucolic vide local food and habitat for pollina-
tal protection would cause an economic bedroom communities, is a recognition tors and other wildlife.
apocalypse in the region proved to be that employees benefit from access to The benefits of easier access to na-
unfounded. Rather, job losses in the for- nature and improved quality of life. As ture have not been lost on governments.
estry sector were more than offset by a the mayor of the mill town of Spring- Ontario has permanently protected
boom in new types of employment. Eco- field, Oregon, told the New York Times more than 700,000 hectares of near-ur-
nomic growth was driven by the arrival shortly after logging restrictions came ban green space and farmland through
and expansion of high-tech firms, like into effect to protect the spotted owl, “It its internationally renowned Greenbelt.
Sony and Hewlett-Packard, and federal wasn’t blind, dumb luck that helped us Quebec recently announced its plan to
programs that retrained former loggers land Sony; the company wanted a pris- wrap Montreal and Quebec City in pro-
and mill workers for diverse new em- tine place on the river.” tected greenbelts as well, and the feder-
ployment opportunities, including in Indeed, many of today’s most suc- al government plans to create Canada’s
the high-tech manufacturing sector. cessful companies are recognizing the first urban National Park, in the Rouge
Every socioeconomic indicator showed importance of quality of life for their Watershed in the heart of the Greater
that, far from facing economic ruin, employees – at work and at home. Toronto Area.
former resource-dependent communi- Many are willing to locate their opera- These initiatives to protect nature,
ties responded positively to increased tions closer to nature, and to green their literally in the backyards of millions of
nature conservation. Over the following own workplaces. Thus we have seen people, are happening at a time when
decade, the region’s graduation rates in- a boom in the number of green roofs, fewer Canadians are visiting our ex-
creased, income levels rose, poverty fell, green walls and rain gardens integrated isting system of far-flung wilderness
and the unemployment rate remained into the design of office complexes. parks. Visits to the National Parks sys-
unchanged despite a 91 per cent reduc- This green wave in the workplace tem are down 7 per cent across Canada
tion in logging on public lands. Today, has been bolstered by the many positive as a whole, down 10 per cent in Quebec
despite being the historical timber- benefits of green time over screen time. and Ontario, and 18 per cent lower in
basket of the U.S., Oregon now credits Over the last decade, researchers from the Maritimes. Parks Canada officials
high-tech manufacturing with produc- fields as diverse as biology, psychiatry, are now openly talking about the cre-
ing 10 per cent of its economic output ecology, horticulture and medicine have ation of the new Rouge National Park
– more than eight times the national come to the conclusion that spend- as a “gateway park” for the Canadian
average. ing time in nature is good for our own public, with the hope that citizens will
To the north, in the Chilliwack For- health and well-being. Their research become better connected with nature in
est District of southwestern British has shown that access to natural assets their backyards and more likely to visit
Columbia, resource-dependent towns like parks and green spaces can improve Canada’s cherished wild spaces.
that were built on logging and milling our physical and mental health while The fact is, nature is clearly worth much
ancient forests into two-by-fours now enhancing community. more than we think. It provides essential
support a far more diversified employ- University of Illinois researcher services and produces health and econom-
ment base as well. The proportion of Frances Kuo has documented that ac- ic benefits that far exceed the short-term
employment from logging in the region cess to nature close to where people live gains obtained from its destruction. K
56 • Corporate Knights • Sp r in g 2012Different Shades of Instead of a carbon tax, Ontario’s
landmark Green Energy Act and feed-
Green Innovation
in-tariff program – and its ambitious
commitment to phase out coal-fired
generation by 2014 – have established
B.C., Ontario and Quebec earn top grades the province as one of the best places
as nurturers of clean technologies on the continent to develop renewable
energy and smart grid innovations fo-
By Paul Brent cused on energy management, storage
and efficiency. A relatively new Water
Opportunities Act aims to make On-
tario a leader in water conservation and
treatment technologies.
Government funds aimed at green
innovation development and smart grid
technologies, as well as support for
community power, have added to the
province’s allure. The MaRS Discovery
District in Toronto has become one of
the nation’s leading incubators for clean
technology innovation, while several
universities in southern Ontario – in-
cluding University of Waterloo, Univer-
sity of Ontario Institute of Technology
Nuclear fusion startup General Fusion of Vancouver exemplifies B.C.'s culture of cleantech innovation. and Queen’s University – are generating
both green innovations and entrepre-
C anada’s clean technology in-
dustry, like the country itself,
comes with regional strengths
and needs – with each province’s policies
green innovations developed and spun
out of B.C. universities has also played
a major role. Another boost has come
from the B.C. government’s Innovative
neurs with the right business skills to
take clean technologies to market.
“You can’t take a great technology
developer and expect them to be a won-
and programs, unique geographies, and Clean Energy (ICE) Fund, which since derful business developer,” said Vicky
mix of universities and industries having 2008 has contributed more than $72 mil- Sharpe, chief executive of Sustain-
a direct influence on green innovation. lion to 56 clean energy projects. In ad- able Development Technology Cana-
Across the country, roughly 700 com- dition, the introduction of a provincial da, the federal agency that gives grants
panies make up the $9-billion cleantech carbon tax in 2008 created opportunities to cleantech demonstration projects.
sector. Most are in British Columbia, for firms such as Nexterra, which helps You need both, she said.
Ontario and Quebec, which also fetch a industries reduce their carbon footprint Quebec, with 152 companies (21
lion’s share of venture capital. The num- by generating electricity from biomass. per cent), has traditionally been strong
ber of companies and venture invest- Ontario, with 221 companies (31 per in industrial manufacturing, water and
ment per capita in each province is one cent of the total), may lead the country waste management technologies. Bak
way to measure each jurisdiction’s sup- in absolute numbers but still lags B.C. attributes this strength to its having
port for green innovation. when measured per capita. Even so, it has “a regulatory framework that is very
B.C. is home to 160 cleantech com- been most successful at attracting venture smart and very proactive in terms of
panies, representing 23 per cent of Can- capital for its green-themed startups. recycling.” Rather than setting up a
ada’s total, according to Ottawa’s Ana- dedicated government fund to support
lytica Advisors. The province’s green Cleantech firms by province, 2011 development and commercialization,
innovation strengths lie in transpor- Quebec recently decided to invest in
tation, renewable energy, fuel cells and the sector through venture capital firm
smart grid technologies, reflecting the Companies per Number of Cycle Capital Management.
Prov. 1,000,000 people Companies
influence of utility B.C. Hydro and fuel- Nova Scotia, with 50 companies,
cell pioneer Ballard Power. PE 49.93 7 stands out on the East Coast for its
“B.C. companies have a long history BC 36.36 160 strength around green chemistry, biofu-
in power management, including power NS 27.12 25 els and renewable energy, such as wind
conditioning and battery storage, while AB 24.14 88 and tidal power. In the prairies, Alberta’s
the province’s diverse geography and SK 20.32 21 88 companies, operating in a province
historic forestry industry support a QB 19.23 152 known for its oil sands resources, are
range of alternative generation technolo- ON 17.20 221 largely focused on soil, water and emis-
gies such as wind, solar, biomass and tidal NB 14.64 11 sions remediation technologies, such as
energy,” according to consultancy KPMG. MB 14.07 17 carbon capture and sequestration.
Celine Bak, a partner with Analyti- NL 13.60 7 Said Bak: “Each province or region
ca, said long-term public investment in is taking a slightly different approach.” K
Source: Analytica Advisors Sp r ing 2 0 1 2 • Corporate Knights • 57Provincial Power
It’s time to turn energy vision into action
By Marlo Raynolds
T
alking about a “national energy Though there is no shortage of chat- newable energy, and investing in energy
strategy” is very much in vogue ter about the shape and scope of a Ca- efficiency.
these days, almost the way we nadian energy strategy, these are really First, each province should put a
talked about “climate change strategies” the minimum specifications of any plan, fiscal incentive in place to reduce and
for the first decade of the new millen- provincially or nationwide, that could eventually eliminate environmental im-
nium. Industry associations, provinces, set us up for truly long-term prosperity pacts. Translation: tax carbon. Look to
think tanks, unions, energy companies, by sparking an incredible wave of inno- British Columbia for a strong model
non-governmental organizations – all vation. to build from. Use the levies from pol-
are calling for a cross-country approach Even with a national vision, how- lution to reduce income taxes, pro-
to managing and transitioning our en- ever, it is the provinces that hold the tect low-income energy consumers and
ergy system. But, can we move these jurisdictional power and responsibility further invest in energy efficiency. The
conversations to practical action? What to deliver. And the biggest mistake our sooner each province sends the signal
will it really take to make the necessary provinces could make is to focus on “re- that it costs to pollute our environment,
transitions in how we produce energy source development” as opposed to fo- the faster we will innovate and imple-
and consume energy services? cusing on the “energy services” we need. ment cleaner solutions.
To start with, we need a coherent vi- To state it bluntly, people don’t really Next, impose progressively strict-
sion of what we, as a nation, want to be care about energy resources; we care er pollution standards on all sources
when we grow up given our world-scale about the services they bring us, such as of energy-related emissions. Use these
abundance of energy resources. mobility, light, warm homes, electron- performance-based standards to drive
Last year, environmental action group ics and cold beer. These desired services innovation that will in turn purge pol-
Tides Canada conducted a series of won’t change much, but the resources lution from the energy sector. A good
workshops resulting in a document that make them possible will. example is regulations on coal power
called “A New Energy Vision for Cana- Take mobility. During the preced- plants – regulations that force utilities
da.” It outlines the broadly accepted vi- ing century, petroleum overwhelmingly to either eliminate emissions or shut the
sion for a national energy strategy that: provided this service. We continue to plants down. For my home province of
use barrels of oil as a metric of future Alberta, the priority should be setting
• Provides accessible, fair and efficient energy demand and often point to the scientifically informed limits on total
energy services to citizens with minimal growing demand for oil in China. But cumulative environmental impacts of
risk to future generations; China does not really care about oil; the oil sands.
it cares about mobility. If and when Third, renewable energy reduces
• Leverages our considerable renewable that economy can provide its people pollution yet is rewarded for doing so in
resources and existing institutions to in- with mobility by another means that very few jurisdictions. When politicians
crease our share of the global market for is cheaper, cleaner, domestically pro- don’t have the guts to price pollution
low-carbon goods and services, spurring duced, more accessible and higher per-
new jobs, investment and innovations; formance, it will do so rather quickly. In
other words, meet the electric car. % of in-province electricity
• Reduces the risk of climate disruption Today, Canada is a powerhouse in generation from renewables
by lowering carbon emissions to a level, the last century’s dominant energy cur-
and at a pace, recommended by the rency. But as times change we need to Prov. % electricity from renewables
global scientific community; adapt and be positioned to be a com-
petitive player in this century’s emerg- MB 99.48%
• Protects and restores air, land and ing energy technologies. This means PE 99.18%
water resources by setting hard caps on each province must ask itself: How are QB 97.02%
cumulative ecosystem and atmospheric we going to compete in an “energy- NL 96.93%
impacts; and technology” focused global economy? BC 89.03%
Where should we start? NB 33.20%
• Encourages local stewardship over low- Different priorities will exist for ON 23.74%
carbon energy production and resources. each province, but across the country SK 21.43%
each should focus on: pricing pollution, NS 11.87%
steadily reducing limits on total pollu- AB 5.72%
tion, properly valuing the benefits of re-
Source: Statistics Canada; Canadian Geoexchange Coalition
58 • Corporate Knights • Sp r in g 2012Advertisement
To state it bluntly, people don't really care about
energy resources; we care about the services they
bring us, such as mobility, light, warm homes,
electronics and cold beer.
to capitalize on the incredible opportu-
Energy productivity nities in energy efficiency across all en-
ergy services – home heating, mobility,
$M GDP/terajoule
entertainment, and more. Look to Man-
Prov. of energy used itoba for a portfolio of leading efforts on
energy efficiency.
ON 0.22 Each province can tweak these ac-
BC 0.18 tions to suit its particular political re-
NS 0.18 alities but if we Canadians want our fair
PE 0.18 share of the rapidly growing trillion-
QB 0.18 dollar cleantech sector, we need to act
MB 0.17 like the future matters to us. As global
NL 0.16 population grows, resource constraints
NB 0.14 increase and pollution threatens us all,
AB 0.11 one thing is certain: societies that create
SK 0.09 and market clean energy solutions will
thrive. This is our best chance to make a
Source: 2009, Environment Canada positive contribution to global chal-
lenges, and along the way regain respect
properly, their only option for levelling on the world stage. K
the playing field for non-polluting ener-
gy sources is to fiscally recognize their Marlo Raynolds is a senior advisor to
added environmental benefits. The best the Tides Canada Energy Initiative and
example of this is Ontario’s feed-in-tar- the Pembina Institute (pembina.org). He
iff (FIT) program, which very transpar- is currently living in France on a sabbat-
ently presents to energy consumers the ical. This article represents his views and
value of cutting pollution. not necessarily those of any organization
Finally, provinces should use a com- to which he is associated.
bination of standards, incentives, pric-
ing, community planning and education
Use of "geothermal" heat pumps
Number of Units Per 10 Inhabitants by Province
2007 2008 2009 2010
10
9
8
7
6
5
4
3
2
1
0
ON SK NB MB BC PE QC NS AB NF
Sp r ing 2 0 1 2 • Corporate Knights • 59You can also read