Uncertainties in Amazon Hydropower Development: Risk Scenarios and Environmental Issues around the Belo Monte Dam
←
→
Page content transcription
If your browser does not render page correctly, please read the page content below
www.water-alternatives.org                                                                         Volume 3 | Issue 2
Sousa Júnior, W.C. and Reid, J. 2010. Uncertainties in
Amazon hydropower development: Risk scenarios and
environmental issues around the Belo Monte dam.
Water Alternatives 3(2): 249-268

Uncertainties in Amazon Hydropower Development: Risk Scenarios
and Environmental Issues around the Belo Monte Dam
Wilson Cabral de Sousa Júnior
Professor, Instituto Tecnológico de Aeronáutica, São José dos Campos, SP, Brazil; wilson@ita.br

John Reid
Executive Director, Conservation Strategy Fund, Sebastopol, CA, USA; john@conservation-strategy.org

ABSTRACT: The Amazon region is the final frontier and central focus of Brazilian hydro development, which raises
a range of environmental concerns. The largest project in the Amazon is the planned Belo Monte Complex on the
Xingu river. If constructed it will be the second biggest hydroelectric plant in Brazil, third largest on earth. In this
study, we analyse the private and social costs, and benefits of the Belo Monte project. Furthermore, we present
risk scenarios, considering fluctuations in the project’s feasibility that would result from variations in total costs
and power. For our analysis, we create three scenarios. In the first scenario Belo Monte appears feasible, with a
net present value (NPV) in the range of US$670 million and a rate of return in excess of the 12% discount rate
used in this analysis. The second scenario, where we varied some of the project costs and assumptions based on
other economic estimates, shows the project to be infeasible, with a negative NPV of about US$3 billion and
external costs around US$330 million. We also conducted a risk analysis, allowing variation in several of the
parameters most important to the project’s feasibility. The simulations brought together the risks of cost
overruns, construction delays, lower-than-expected generation and rising social costs. The probability of a positive
NPV in these circumstances was calculated to be just 28%, or there is a 72% chance that the costs of the Belo
Monte dam will be greater than the benefits. Several WCD recommendations are not considered in the project,
especially those related to transparency, social participation in the discussion, economic analysis and risk
assessment, and licensing of the project. This study underscores the importance of forming a participatory
consensus, based on clear, objective information, on whether or not to build the Belo Monte dam.

KEYWORDS: Belo Monte, large dams, risk scenarios, Amazon, hydroelectric power, Xingu river

INTRODUCTION
Hydropower is Brazil’s primary source of electric energy, developed under a model that has involved
very large dams and extensive transmission lines. Much of this infrastructure was in place by the end of
the 1980s. This past decade’s energy crisis has awakened the country to the possibility of reducing
environmental impacts through energy efficiency and to Brazil’s potential for alternative energy, while
at the same time compelling society to weigh the real need for new mega-dams (Vainer and Bermann,
2001). This presents an opportunity to chart an energy strategy based on a broad set of sustainability
criteria.
    However, within this context of doubts and pressures, the federal government sought to move
forward with the Belo Monte Hydroelectric Complex on the Xingu river in the Amazonian state of Pará.
The project has been studied and reformulated over the years. The most significant change was the
reduction in the area of the reservoir from 1255 km² to 440 km². There were also updates and additions
to environmental and hydrological studies, budgets and timetables.

Sousa Júnior and Reid: Costs and benefits of the Belo Monte dam                                            Page | 249
Water Alternatives - 2010 Volume 3 | Issue 2
Belo Monte has become the subject of debate for a variety of reasons, including the substantial
costs of construction, the nature of mitigation measures proposed in the feasibility report and the
power-generation estimates, which have been challenged because the river’s flow is highly seasonal.
There has also been substantial resistance to the project on the part of riverine people who fear the
loss of land and resources. All these points, plus the complex engineering challenges of Belo Monte,
bring up the need to complement existing studies with a closer look at the project’s sustainability.
This paper strives to examine the real costs and benefits of the Belo Monte dam proposal and to run
a variety of risk analysis scenarios that test the project’s sensitivity to uncertainty in key assumptions. It
then moves to an assessment of how the decision-making process around the Belo Monte dam
compares with the standards established by the World Commission on Dams (WCD).
ENERGY GENERATION AND SOCIO-ECONOMICS: KEY ELEMENTS FOR PLANNING AND EXPANSION
A country’s energy system has complex impacts on its economy. In general, a contraction of energy
supply restrains economic activity, which can provoke impacts from the reallocation and even rationing
of energy, to changes in technology that emphasise energy efficiency.
Given the relationship between energy and the economy, many development models place strong
emphasis on the energy-economic production correlation. Various studies associate energy availability
with gross domestic product (GDP) (Nilsson, 1993; Schipper, 2000). But, according to Cohen (2005), the
energy-economic development relationship merits closer analysis because GDP hides a series of
economic problems, including inequity among regions and social classes, not to mention uncounted
environmental costs. All these characteristics are key to energy planning geared to the true economic
goals of a country or region.
Princen (1999) argues that excessive energy consumption in northern hemisphere nations and
among southern hemisphere elites needs to be brought into closer balance with energy use in southern
countries and less-privileged classes. This notion has gained increasing acceptance within
environmentalist circles. Still public policies in developed countries have tended to focus almost
exclusively on energy efficiency without addressing the overall consumption, which will continue to
drive high energy use, even with efficiency improvements. This same pattern is being emulated by
developing countries, which strive to increase energy supply (sometimes from cleaner sources) more
than managing and reducing demand, as signalled by Sunkel (1979), and corroborated by many
researchers over the last few decades.
In this regard, Leite and Bajay (2007) estimate that Brazil could reduce its projected 2030
consumption by 20% solely through energy-efficiency measures. That research focused on the main
consuming sectors, industry, other commercial users, residential consumers and agriculture. The
possibility of electricity savings illustrates that consumption need not exactly track economic growth
and that, indeed, Brazil has the potential to reduce energy consumption per unit GDP (see Totten et al.,
this issue).
To increase supply, Brazil began damming Amazonian rivers on a large scale in the mid-1980s. The
project we analyse here, though still not constructed, was a top priority more than 20 years ago. The
country turned to the North because nearly all the hydropower potential in the densely populated
Southeast had been exhausted by that point.
Amazon dam projects face divisions in public opinion. Industrial projects, particularly energy
projects, now face higher standards and scrutiny since the promulgation of new environmental
regulations and the advent of stricter environmental licensing procedures. At the same time, the
multiple economic and political interests in large projects have limited the impact and efficacy of these
environmental procedures. The new planning approach in the country’s electricity sector points to the
need for socio-environmental evaluation at the stage when potential projects are being compiled in
inventories, long before specific projects are in advanced planning stages. We would add that to enable
this sort of pro-active planning, old inventories of priority projects in the Amazon need to be discarded
Sousa Junior and Reid: Costs and benefits of the Belo Monte dam Page | 250Water Alternatives - 2010 Volume 3 | Issue 2
in favour of up-to-date lists that reflect a more comprehensive and holistic vision of energy
development, particularly in undeveloped watersheds like the lower Xingu.
THE SOCIAL AND ENVIRONMENTAL IMPACT OF HYDROELECTRIC PLANTS IN BRAZIL
Past experience
The modern economy’s critical dependency on energy underscores the need for its more rational and
effective use by society as a whole. Large projects in the energy sector come up against financial,
environmental and social restrictions. As regards hydroelectric plants, these issues are more critical and
involve conflict with various actors: landowners (livestock ranchers), farm workers, traders, the urban
and rural population that has to be moved, loggers, indigenous communities, social movements and
non-governmental organisations (NGOs). This web of interests makes analysis of these projects
complex.
In Brazil, the initial investment in hydroelectric plants in Amazonia has been shown to be extremely
risky. Projects such as Balbina, Samuel and Tucuruí, for various reasons, have demonstrated the
complexity of construction that significantly alters the environment. Balbina, in Amazonas State, is
recognisably the worst, with a flooded area of 2360 km2 for potential generation of only 250 MW and
long periods of low productivity caused by the seasonality of flows. The Samuel project, in spite of
being more efficient than Balbina, still has a poor area flooded against potential generation ratio.
Tucuruí, in the State of Pará, has the best area against potential generation ratio of the three projects,
but its projected flooded area was underestimated and the power plant mainly serves demand from an
energy-intensive sector which is not very energy-efficient: aluminium. Sousa Júnior (1998) analysis of
the Serra da Mesa reservoir – one of the last big Brazilian dams brought online, in the late 1990s –
revealed systematic errors that led to an overestimate of the reservoir areas and, as a result, the
potential energy generation.
In terms of social and environmental impact, in the specific case of Tucuruí, an estimated 13.4
million m3 of timbre and several animal and plant species have been lost to flooding. The construction
of the reservoir and the dam operation have changed the river, covered up archaeological sites, led to
greenhouse gas (GHG) emissions, affected water quality, led to an overpopulation of insects and
displaced people to areas around the dam, all of which have put pressure on natural resources in areas
not actually flooded by the project (IDESP, 1991).
As regards indigenous areas, the main direct and indirect impacts of the construction of large
hydroelectric reservoirs are resettlement of communities (affecting lifestyle), flooding of areas
(including places of spiritual value), loss of hunting and farming plots, and an increase in infectious
disease (Santos and Andrade, 1990).
In terms of hydrology, the formation of a reservoir increases the hydrostatic pressure on springs
situated along the river banks and on the rivers that are dammed. Such a situation leads to alterations
in the natural feeding and draining of aquifers. Alterations to aquifers lead to ecological and economic
impacts, as they modify the land use patterns. This has occurred at some hydroelectric plants, such as
Itaipú and Samuel, requiring the projects to compensate for land that had not been included for
expropriation. In Samuel, groundwater elevation also resulted in the hydromorphisation of about 8000
ha (Muller, 1996).
There are also impacts from inundated forest biomass. Not cutting down the forest, in addition to
making it difficult to use the reservoir for other purposes, alters the water quality and favours the
proliferation of insects, both of which affect public health and human migration patterns. Historically,
there have been few cases of pre-flooding forest clearing.
The precise contribution of hydroelectric reservoirs to GHG emissions is still a matter of discussion.
There is controversy, even in the scientific world, as can be seen in the debate that has lasted for over
ten years on the methodologies and results of GHG emission estimates for tropical reservoirs in Brazil
Sousa Junior and Reid: Costs and benefits of the Belo Monte dam Page | 251Water Alternatives - 2010 Volume 3 | Issue 2
(Fearnside, 1995; Rosa et al., 1996; Fearnside, 2004; and Rosa et al., 2004). The main point of
contention is the accounting of gases, mainly methane, emitted by the hydroelectric plants’ spillways
and turbines. Methane, concentrated at depths of around 30 metres, is said to be quickly moved at
lower pressures and higher temperatures, becoming volatile in contact with the atmosphere
(Fearnside, 2004; Kemenes et al., 2007).
Non-dam infrastructure required for the construction of the plant, which includes transmission lines,
sub-stations, maintenance areas, and roads, are in fact part of the plant’s activities and hence should be
considered when analysing its feasibility. The absence of a large-capacity transmission line would
prevent Belo Monte’s use to supply shortfalls in energy production in the southeast of Brazil. According
to Borenstein and Camargo (1997) a 500 kV transmission line in general takes up a space of 65 metres
in width and, in the case in question, about 400 km in length. These works very often affect
archaeological sites, indigenous villages, forest parks or ecological reserves as much as the plant itself.
The impact on ecosystems and biodiversity must also be stressed. The direct and indirect effects
include the alteration of the natural habitat (in this case, largely a change on the freshwater
ecosystem), consequently impacting biotic interaction; saturation of the adjacent soils; micro-climate
alterations; and compartmentalisation of habitats (formation of islands in the reservoir and the
segregation of tracts along the transmission lines). Such effects have unpredictable results on
biodiversity, which in turn is hard to measure, contributing to the underestimation of environmental
impacts in environmental assessments.
Goodland et al. (1993) analysed various hydroelectric plants in tropical forest regions and identified
situations in which such projects should be avoided. These situations include projects in pristine forest
regions, places where a local population would have to be removed, areas of species endemism and, in
general, where there is a possibility that biodiversity will be lost, among others. These factors tend to
be present, in varying degrees, in hydroelectric projects in the Brazilian Amazon.
Brazil and participation in the WCD and United Nations Environment Programme (UNEP)/Dams
and Development Project (DDP)
The pervasive costs and problems mentioned above speak for themselves with regard to the necessity
for Brazil to adopt better standards in the way dams are planned and built. Brazil took part in the WCD
process and, although it has not entirely embraced the recommendations made by the commission
(Dubash et al., 2001), it has agreed with the main principles and analysis methodologies proposed.
Brazil’s National Water Agency (ANA) represented the country at the commission, and currently
participates in the work done by the Dams and Development Project (DDP), being a member of the
DDP’s Steering Committee. From a diplomatic standpoint, Brazil appears to concur with the WCD
principles, in that it has been an active participant in the WCD’s work and the Brazilian representatives
have expressed agreement with the documents produced by the WCD.
However, the Brazilian electricity sector took shape around a technical bureaucracy that centralises
decision-making to the exclusion of institutions with related interests. ANA is one of these institutions
which, despite the growth of its responsibilities, has difficulty influencing the agenda when it comes to
hydroelectricity. The inner circle of institutions linked directly to the electrical sector – government
bodies, public generation companies, and electricity research bodies, as well as regulatory bodies, share
decision-making among themselves. Planning is based on management of supply to meet the constant
and unmanaged expansion in demand. The driver of this thinking is linked to the discussions posited at
the beginning of this report of the link between GDP and the demand for electrical energy.
The influential institutions in Amazon hydro planning include the National Electrical Energy Agency
(ANEEL), the National Electrical System Operator (ONS), the recently created Energy Research Company
(EPE), and large state electrical energy generators, Eletrobrás and Eletronorte. ANA, whose remit
should involve large hydroelectric reservoirs and the multiple uses of water, has little or no influence on
large hydroelectric plant projects. The National Water Agency has concentrated its management efforts
Sousa Junior and Reid: Costs and benefits of the Belo Monte dam Page | 252Water Alternatives - 2010 Volume 3 | Issue 2
on issues such as charging for the use of water and the creation of watershed committees on federally
controlled rivers. Its involvement in the environmental licensing process of large dams is just a piece of
the bureaucracy: the analysis carried out by ANA is limited to grant a certified water availability, in
order to support the activity.
This illustrates two bureaucratic structures that have little convergence between them – water
management and electrical energy management. The former is notably Brazil’s representative on
forums abroad, including UNEP/DDP. Brazilian hydro projects have paid little attention to those
processes, making the country’s participation in the international bodies seem rhetorical.
Furthermore, as reported by The Economist (2003), if the World Bank and other international
agencies were to shy away from financing big dams, many bigger countries, Brazil included, would go
ahead on their own. When it happens, "it is a racing certainty that their dams will involve more
kickbacks and corruption – and that they will ignore the WCD guidelines altogether" (The Economist,
2003).
THE BELO MONTE HYDROELECTRIC PROJECT
About 40% of Brazil’s hydroelectric potential is to be found in the Amazon basin. Among the main
tributaries on the right bank of the Amazon river is the Xingu river sub-basin, covering an area of
509,000 km2. It is estimated that about 14% of the inventoried hydro potential Brazil has is to be found
in this sub-basin (ANEEL, 2002).
Near Altamira, on the Xingu river, is an area of rapids, forming what is known as Volta Grande (Big
Bend), named for the abrupt southern swing the river makes on its otherwise northward journey to the
Amazon. The Volta Grande, according to Ab’Saber (1996), is part of the southern Amazonian fall line,
and presents a site for hydro development because of the rapid change in elevation.
In 2002, Eletronorte released its latest feasibility report on the Belo Monte Hydroelectric Complex,
installation of a capacity of 11,181 MW and a significant reduction in the reservoir area from 1225 km 2
to 440 km2. This report was updated in 2009.
The Belo Monte project would generate large amounts of energy for the first few months of the
year, when it would be possible to store water in the reservoirs in the southeast and northeast of Brazil,
making up for the current shortfalls in generation in the Brazilian electricity generation system.
However, the issue of whether the project would simply be the first step in the continued exploitation
of the Xingu river has been raised (Bermann, 2002; Santos and Andrade, 1990). The official position,
contained in a resolution of the National Energy Policy Council (CNPE, 2008), is that no dams will be
built on the Xingu upstream of the Belo Monte Complex. However, this resolution may be altered by
the Council in the future, which, given the Council’s pro-dam make-up, makes this a fragile barrier to
future dam building on the river.
The project had its previous environmental licence launched in February 2010. According to the
Brazilian environmental legislation, it is the first step of the whole licensing process. After that, the
project has to obtain the installation and operation licences. In order to grant the previous licence, the
environmental agency has analysed the Environmental Impact Assessment (EIA) presented by the
former construction holding.
The environmental licensing process has been controversial, mainly due to the lack in consultation
with local people – traditional and indigenous communities – and the environmental impacts are
underestimated. The process was interrupted for several times to take into account the guidelines of
the new environmental body. The last document revision was approved on February 1st, 2010, under
criticism from environmentalists and scientific groups. After that, the provisional environmental licence
was suspended twice by the Federal Judge before the dam auction was finally reopened on April 20th,
2010.
Two of the largest construction companies (Odebrecht and Camargo Correa), who had addressed
the Xingu and Belo Monte feasibility and environmental studies, have refused to participate in the
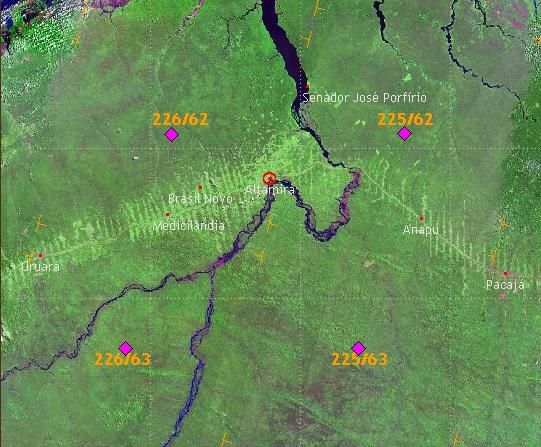
Sousa Junior and Reid: Costs and benefits of the Belo Monte dam Page | 253Water Alternatives - 2010 Volume 3 | Issue 2 public dam bid. The winning consortium has heavy participation by public companies – CHESF and Eletronorte. Nowadays, the government is providing a legal/financial arrangement in order to maintain the project schedule. A few basic characteristics of the Belo Monte Complex are described in what follows. The project location and hydrology The Belo Monte Hydroelectric Complex is in the Volta Grande on the Xingu river in the State of Pará, in the North of Brazil. The project involves three sites: the Belo Monte Site, which lies at the intersection of the Xingu river and the Transamazon highway, the Pimental site, which lies in Vitória do Xingu and Altamira, and the Bela Vista site, in the region between Belo Monte and Pimental. Figure 1 shows the latest configuration of the Belo Monte Hydroelectric Complex: Water is diverted by the Pimental dam, transferred laterally to the Belo Monte dam built on a left bank tributary (with a secondary dam at Bela Vista to avoid spillage back into the river), from where it is returned to the river after generating electricity. Figure 1. Configuration of the Belo Monte Hydroelectric Complex (Eletronorte, 2002). The basin has a hot climate with tropical rainfall concentrated from January to May. The dry period runs from June to November. The period of heaviest rainfall in the high and medium regions of the Xingu is from January to March. In the region of Altamira, evapotranspiration varies from 100 mm to 150 mm a month throughout the year, with the annual range being around 50 mm between the maximum months (dry period) and minimum months (rainy period), and rainfall averages 1885 mm. Covering 509,000 km², a large part of the Xingu river basin has not been deforested. The area slated for the hydroelectric infrastructure is near Altamira and the BR-230 Transamazon highway, and is therefore fragmented among a variety of uses, from extensive cattle farming to agriculture and forestry, in addition to remaining native forests. Figure 2 shows a mosaic of Landsat 7 satellite images of the Volta Grande do Xingu area. In the centre of the figure is the region of BR-230 highway, which passes downstream of the dams. Sousa Junior and Reid: Costs and benefits of the Belo Monte dam Page | 254
Water Alternatives - 2010                                                                            Volume 3 | Issue 2

Figure 2. Mosaic of Landsat 7 images in the project area.

The Xingu river has distinct periods of rainfall and drought. Figure 3 illustrates the temporal
distributions of stream flows, a direct consequence of rainfall in the region.

Figure 3. Hydrogram of stream flow in characteristic hydrological years.

                        30000

                        25000

                        20000
          Flow (m3/s)

                        15000

                        10000

                        5000

                           0
                                oct   nov   dec    jan      feb   mar    apr   may   june   july   aug   sep

                            Wet year (1977-1978)         Average year (1996-1997)    Dry year (1998-1999)

Sousa Junior and Reid: Costs and benefits of the Belo Monte dam                                             Page | 255
Water Alternatives - 2010 Volume 3 | Issue 2
Technical aspects of the project
The installed power-generation capacity at the main powerhouse at the Belo Monte Hydroelectric
Complex would be 11,000 MW, distributed throughout 20 Francis generator units, each with a unit
power of 550 MW. The complementary plant, which would use the residual stream flow, would have an
installed capacity of 181.3 MW and would have seven bulb-type turbines, with a unit power of 25.9
MW. Such an arrangement would guarantee steady energy (a minimum constant energy production
capacity) of 4637 MW on average at the main plant and 77 MW on average at the complementary plant
(Eletronorte, 2009).
However, Bermann (2002) says that the Belo Monte’s nominal capacity would only be fully exploited
for three months of the year because of the flow variations. According to the author, the construction
of one or more of the four other large plants inventoried in the upper basin would be necessary to
regulate the flow from the Xingu river in order to achieve the declared energy level on a steady basis. In
another simulation, Cicogna (2004) shows that the firm energy value at Belo Monte, working in
isolation – that is, not including other projects or the interconnection with the national system – would
only be 1172 MW on average. The author says the large variations in natural stream flows, combined
with the limits imposed by a lack of storage are the main causes of this low value.
The dam would form a reservoir with a total water surface area of 440 km² (the feasibility study
shows values ranging from 440 to 565 km2), with the normal maximum operation level of 97 metres
above sea level. This reservoir would be made up of two distinct parts: the Xingu canal, which includes
the area from the diversion point on the Xingu river at 97 metres and the reservoir for the channels,
determined by the stream flows diverted from the Xingu river through the derivation channels. This
region would have a complementary spillway. The enterprise is conceived as a run-of-the-river project.
That is, the number of turbines in operation will depend basically on natural stream flows to the
powerhouse, as the reservoir has a reduced capacity. The project also includes the construction of
transmission lines, a river port, a navigation lock, access roads and a bridge over the plant’s escape
canal.
Project costs
The budget for the Belo Monte Complex is based on data from June, 2001, when the current project
was drawn up (in financial terms, there is no update on the official report). The total value is R$9.6
billion ($4.0 billion at $1.00=R$2.38, June/2001, the exchange rate at the time the project was drawn
up1), including interest during construction. These values forecast a cost of $12.4/MWh, considered to
be competitive by Eletronorte. It must be stressed that such values do not include transmission system
costs and accessory construction (the port, navigation locks and substations).
Table 1 summarises the relevant information regarding official costs surveyed by Eletronorte.
SOCIAL, ECONOMIC AND ENVIRONMENTAL FEASIBILITY AND COSTS
Based on the data and social, economic and environmental information available, including those
surveyed in the feasibility studies done by Eletronorte, the plan to construct the Belo Monte
hydroelectric plant on the Xingu river was evaluated. This was based on an in-depth analysis of the
costs and benefits.
From society’s perspective, adopted in this study, the project was assessed based on social costs and
benefits, expanding the small universe of the project manager and the merely fiscal perspective of the
State. Hence, a value was sought to be attributed to the social costs not computed in private analysis,
so as to internalise these costs, or at least make them explicit and making it clear to society who would
enjoy these benefits and who would pay for the costs.
1
In this paper we use $ to mean the currency of the US dollar and R$ to mean the currency of the Brazilian Real.
Sousa Junior and Reid: Costs and benefits of the Belo Monte dam Page | 256Water Alternatives - 2010 Volume 3 | Issue 2
Table 1. Costs for Belo Monte Complex: Generation and transmission.
Costs parameters: energy generation Amount Unit
Investment costs* 4037.90 $x106
O&M costs 291.2 $x106
Total cost 4329.10 $x106
Generation costs 12.4 $/MWh
Dollar value (June 2001) 2.38 R$
Costs parameters: energy transmission Amount Unit
Investment costs 1767.10 $x106
O&M costs 158.42 $x106
Losses 55.27 $x106
Total cost* 2192.84 $x106
Transmission cost 8.14 $/MWh
* Considering interest at 12%/y during construction.
Source: Eletronorte, 2002.
In the approach used in this study, the social cost was determined in such a way as to reflect the social
perception of environmental damage. The value of this damage was obtained from costs represented
by increased public and private spending on water treatment, the loss of economic activities associated
with ecotourism, traditional and ornamental fishing activities, and carbon emissions by the
hydroelectric reservoir.
Costs
The global cost estimated by Eletronorte (2002) was not altered in the last update of the Belo Monte
project, despite the significant changes in terms of engineering and environmental propositions
presented by the project managers. There is some controversy over the real cost of the project, raised
by members of the government, in which it has been claimed that the current cost of the Belo Monte
plant would be around $9 billion. Professionals from the large hydroelectric plant construction sector
have mentioned up to $17 billion (FSP, 2010; The Economist, 2010; G1, 2010), mainly because of the
engineering complexity and uncertainty about the costs of environmental mitigation and compensation
called for in the project’s environmental licence. These variations in the total cost of the project are
considered in our risk analysis.
In addition to the construction costs, this study considered the following external costs for which
data were available:
1. Losses in fishing – cTF – The calculation considered average productivity in fishing and the
market value of fish throughout the year (peak-season and off-season). A gradual substitution
was also considered of the species fished, of lotic to lentic environments.
2. Losses in ornamental fish collection – cORF – Collection of aquarium fish in the region to be
flooded contributes to much of Brazil’s exports in this sector. In terms of the market value, it is
worth more than traditional fishing, given its export markets. Many members of the local
population are employed in the activity, sorting, performing maintenance, and selling fish to
the USA, Germany, and Japan. Values were obtained from consulting Brazilian export figures
and interviewing local traders.
Sousa Junior and Reid: Costs and benefits of the Belo Monte dam Page | 257Water Alternatives - 2010 Volume 3 | Issue 2
3. Losses in water quality – cWAT – Damming contributes to a loss of water quality at levels that
are higher than those currently observed because of the alteration in the lotic environment to
the lentic, in lesser hydrodynamics. One indirect consequence of these alterations is increased
cost of water treatment to make it potable (for domestic supply). Even though most of the
water used domestically in the municipality of Altamira comes from underground sources, the
loss of quality in a usable spring represents an opportunity cost that must be considered in the
analysis. Hence, the cost noted is related to the increased cost of water treatment to make it
potable, estimating that the quality of the reservoir will diminish by the equivalent of one 'class'
(according to the classification of water bodies – Resolution CONAMA 357/05). The cost is
limited to the consumption of water in the basin (estimated at 0.41 m 3/s).
4. A loss of agricultural and livestock activities – cAGR and CAT – Cultivated areas will be flooded,
with lost net income currently derived from farming and ranching in those areas.
5. Carbon dioxide (CO2) and methane (CH4) emission costs – cGAS – The gases generated by the
reservoir, caused by the flooding process and the decomposition of biomass, were computed
based on an estimate of the biomass in the areas to be flooded, added to estimates of methane
gas emissions presented by the EIA. Based on the classification of satellite images, four types of
soil cover were estimated (forests, pastureland, annual crops and general farm-land) and their
respective carbon concentrations derived from biomass (Alves et al., 1997). The total value, in
tons of carbon, was multiplied by the credit value according to the European market (Point
Carbon, 2009).
6. Losses in water through evaporation – cH2O – This cost is related to the losses of water from
the surface water in the reservoir. According to studies by Eletrobrás (1999), in the region of
the Belo Monte plant, net evaporation is 145 mm/m 2/y. This results in a loss of around
74,820,000 m3 of water a year for the planned reservoir. A cost was associated relative to an
eventual charge for the use of water, according to the law established in Brazil (the value of the
charge for the use of water in the hydroelectric reservoirs currently corresponds to 0.75% of
the value of the energy generated. As generation by Belo Monte is one of the uncertain
variables, it was estimated from the Single Public Price, established federally).
7. Losses for tourism – cTUR – There is great potential for this activity in the region, but there is no
infrastructure, other than two fishing hotels and a jungle hotel. The potential is for specialised
tourism focused on the external market. A survey of the immediate added value plus the
potential over the period under analysis would represent the opportunity cost for tourism.
Equation 1 sums up the in-depth analysis of costs and benefits.
t
NPV ( Bt Ct CSt ).(1 r ) t (Eq. 1)
1
where, NPV = Net present value; B = Benefit variables; C = Cost variables; CS = Social cost variables; r =
return rate; and t = time.
Equation 2 presents the social cost variables.
CS = cATP+cORF+cWAT+cAGR+cCAT+cGAS+CH20+cTUR (Eq. 2)
Certain externalities were excluded from the calculation due to lack of information. These include the
value of non-commercial fauna and flora, the value of recreation, the loss of commercial aquatic
species, archaeological and cultural sites associated with the traditional communities and indigenous
peoples, and the direct economic losses for these communities in terms of fishing resources, access to
quality water, farmable land, etc).
Sousa Junior and Reid: Costs and benefits of the Belo Monte dam Page | 258Water Alternatives - 2010 Volume 3 | Issue 2
These limitations have made the analysis conservative and indicate an underestimation of the value
of the social and environmental impacts.
Benefits
The benefit of the project lies in the generation of electrical energy. The value of this energy is
measured using references to the cost of producing the same quantity using other sources. This is how
estimates are made by the National Electrical Energy Agency (ANEEL) to set contractual energy costs. It
must be stressed that the Brazilian electricity system attributes differentiated values for energy
contracted by the government compared to excess energy – if any – which can be sold on the open
market.
This study does not include a fiscal analysis (of the local, State or Federal treasury). Such an analysis
would have to consider Financial Compensation for the Use of Water Resources (CFURH), which is a
percentage paid by hydroelectric energy producers for using water resources. The management and
distribution of resources collected by the municipalities, States and the Federal Government are the
responsibility of ANEEL. Jucá and Lyra (2004) also used other fiscal mechanisms: the Global Reversion
Reserve; the ANEEL inspection fee; the Contribution to Energy Development; private and social taxes
(Programa de Integração Social - PIS/Programa de Formação do Patrimônio do Servidor Público - PASEP;
Contribuição para o Financiamento da Seguridade Social - COFINS) and the contribution to the Retail
Energy Market (Mercado Atacadista de Energia).
It should also be noted that this analysis does not look at the local municipalities individually. They
will certainly be impacted both positively and negatively. The urban population will increase, requiring
more public services and infrastructure. During the construction period there will likely be a fall in
unemployment, which may be reversed upon its completion. The expansion of electrification would
have many local benefits, but the real obstacle is not the supply of energy, but local distribution
infrastructure. Local impacts are complex and depend on factors that require further study.
SCENARIOS AND RISK AND SENSITIVITY ANALYSIS
The scenarios and their internal rates of return
For the purpose of analysis two scenarios were drawn up for the project. In the first scenario the
benefits and costs of the project were considered as presented by the feasibility study, added with the
externalities mentioned above. This analysis compares an 'optimistic' scenario against a 'pessimistic' or
'conservative' scenario. In the second scenario, some variables are changed considering realistic ranges
of variation based on the historical experience reviewed earlier, especially those related to the
construction time, total costs and the future prices of energy. For each scenario the Net Present Value
(NPV) and the Internal Rate of Return (IRR) were calculated, using the official feasibility study’s discount
rate of 12%/y. A risk analysis was carried out to integrate continuous variations in economic
parameters, expressing the result in terms of the likelihood of feasibility. Table 2 shows the parameters
of our cost-benefit analysis. The results for the analysis of scenarios 1 and 2 are presented in table 3.
The first scenario, which we could call 'optimistic', using the official project’s data, showed feasibility
with an IRR of 13.45% and an NPV around $670 million. The social costs (externalities) from this
scenario, calculated under the assumptions of Eq. 2, are around $500 million in terms of present values,
in other words, over the 50-year time-span of the analysis. Since the analysis does not include all
categories of social costs (due to data constraints) it has almost certainly underestimated their total
value. Therefore, we cannot conclude decisively whether the project passes the basic test of economic
feasibility – a net present value greater than zero.
Sousa Junior and Reid: Costs and benefits of the Belo Monte dam Page | 259Water Alternatives - 2010 Volume 3 | Issue 2 Table 2. Parameters of the analysis. Parameters Units Scenario 1 Scenario 2 Effective generation – main unit MW 4637 3996 Turbines performance % 92 92 Effective generation – auxiliary unit MW 77 77 Building time years 5 10 Lake area Km2 565 600 Building costs – generation $ x106 3860 16,393 Operation and maintenance (O&M) costs – generation $ x106 278 1182 Building costs – transmission lines $ x106 1800 2732 Transmission losses $ x106 55 55 O&M costs – transmission $ x106 161 244 Energy price (like official bid) $/MWh 42 42 Energy price (free market) $/MWh 46 39 Annual discount rate % 12 12 Charge factor – North region % 80 80 Energy under regulated agreement % 70 90 Energy on free market % 30 10 Economic analysis time Years 50 50 Table 3. Results: Scenarios 1 and 2 of Belo Monte project analysis. Parameters Scenario 1 Scenario 2 Net Present Value – NPV ($) 671,912,090 - 2,930,627,485 Internal Return Rate – IRR (%) 13.45 7.37 Social costs* ($) 502,758,702 331,182,114 Feasibility’s threshold ($/y) 80,788,000 - * Upon valued items As a result, we have calculated the level of annual social costs that would put the overall 50-year NPV below zero. Or, in other words, the present social costs value that would result in an NPV equal to zero. This is $80 million/y, in addition to the $500 million total already considered.2 If the sum of all social costs,3 including all environmental and cultural damage, is greater than $80 million/y, the project is infeasible. If the social costs are less, it is feasible. Another way of seeing this is that the present value of annual $80 million payments over 50 years equals $670 million. Of course, social costs will vary over time and the $80 million figure represents an annualised value. The second scenario, which we could call 'realistic' or 'pessimistic', was conducted under the assumptions presented and discussed before: cost overruns, delays, lack of power generation, lower open-market energy prices and a distinct contractual arrangement for the complex (this defines the free-market margin of the energy sales: the larger the margin, the larger the gains). The results have 2 The NPV before any social costs were considered was approximately $1.27 billion. Subtracting the $500 million in social costs brings the NPV down to $670 million. The NPV of the possible additional social costs of $80 million/y, over 50 years, would be $670 million. If we subtract this NPV of the possible additional social costs of $670 million from the overall NPV of benefits of $670 million, the result is a total NPV of zero. 3 The environmental and social valuation methods can vary widely. Some of them (like contingent valuation and emergy valuation) estimate non-market values which, alone, could make the Belo Monte project infeasible in the first scenario. From this point of view, our study is conservative and we are assuming that externalities are underestimated. Sousa Junior and Reid: Costs and benefits of the Belo Monte dam Page | 260
Water Alternatives - 2010                                                                            Volume 3 | Issue 2

pointed to the infeasibility of the complex, with a negative NPV around $3 billion and social costs
around $330 million. The lower social costs in this scenario are due to the time in which we consider
the carbon costs from the flooded biomass: in the first scenario, when the dam filling would be on time,
this carbon is released in the 5th year; in the second scenario, with the simulated construction delay,
the carbon is released in the 10th year, reducing this cost in terms of present value (to see more about
the weight of each analysed parameter, see sensitivity analysis ahead).

Risk and sensitivity analysis
In order to make a more realistic evaluation, we also carried out a sensitivity and risk analysis using
variations in the input data. We ran a simulation (using the Monte Carlo method in the Oracle Crystal
Ball software) with 13 variables relevant to the analysis of feasibility, and 10,000 iterations. Each
iteration uses a value for each input variable, according to a specified range and distribution of that
variable. In this way, the net present value is calculated 10,000 times with virtually every possible
combination of input variables. The criteria of variation of parameters are presented in table 4.
    Each one of these 10,000 scenarios has generated an NPV, which permits us to create a cumulative
probability curve. The risk simulations conducted show the probability of occurrence of various values
for the NPV, considering variation in the values of inputs used to calculate the NPV (see table 4). The
results are plotted on cumulative probability charts. In this way we can see the NPV corresponding to
any specific probability. The cumulative probability curve shows the probability that the NPV will be
less than, or equal to, any given reference value.
    Figure 4 shows the result of a risk analysis, emphasising the average values and the probability of
success of the investment under the conditions studied.

Table 4. Risk analysis criteria.

Variable                           Distribution              Parameters
Opportunity cost –                 Normal                    Min=$3.9Mi, Max=$7.4Mi, Mean=$5.7Mi, std.
Agriculture                                                  dev.=$570k
Opportunity cost – Cattle          Normal                    Min=$180k, Max=$350k, Mean=$270k, std.
ranch                                                        dev.=$27k
Opportunity cost –                 Normal                    Min=$2.2Mi, Max=$4.7Mi, Mean=$3.2Mi, std.
Ornamental fishes                                            dev.=$320k
Opportunity cost –                 Normal                    Min=$940k, Max=$1.78Mi, Mean=$1.36Mi, std.
Traditional fisheries                                        dev.=$136k
Carbon emissions                   Exponential               Min=500k (t), Max=2.7M (t)
Carbon price                       Exponential               Min=$10, Max=$100, rate=$0.03
Lake area                          Gamma                     Min=516 Km2, Max=665 Km2, scale=20 Km2, shape=2
Building costs                     Gamma                     Min=$4.2Bi, Max=$17Bi, scale=$1.30Bi, shape=4
Effective power                    Minimum extreme           Min=1.2k MW, Max=4.4k MW, Likeliest=3.9k MW
                                                             scale=520 MW
Charge factor                      Minimum extreme           Min=74%, Max=89%,
                                                             Likeliest=85%, scale=2%
Energy price – free market         Minimum extreme           Min=14 $/MWh, Max=48 $/MWh,
                                                             Likeliest=39 $/MWh, scale=4.7 $/MWh
Energy price – regulated           Normal                    Min=27 $/MWh, Max=51 $/MWh,
                                                             Likeliest=39 $/MWh, scale=3.9 $/MWh
                                                                                     3          6        9
Notes: Min=Minimum value; Max=Maximum value; std. var. = Standard Variation; k=(x10 ); Mi=(x10 ); Bi=(x10 ).

Sousa Junior and Reid: Costs and benefits of the Belo Monte dam                                                Page | 261
Water Alternatives - 2010 Volume 3 | Issue 2
Figure 4. Probability of NPV for the Belo Monte project under the studied conditions.
Note: The 'Forecast values' in blue and the 'Certainty probability' represent the simulated values where NPV is greater than
zero and the project is feasible.
The results of our risk analysis projected a 28.67% probability of feasibility (NPV>0) with an average
NPV of negative $ 727 million among the 10,000 values calculated. Stating the result in a different way,
our analysis showed that there is a 72% chance that the costs of the Belo Monte project will be greater
than the benefits. In general, investors avoid projects with such an elevated degree of risk. In the case
of public projects, such risks can be assumed for political reasons and spread across the entire base of
taxpayers (or utility ratepayers) in the form of subsidies from the public treasury or approval of
electricity rates high enough to pay back the construction costs. In the case of Belo Monte, we see
government assuming part of the financial risk and transferring it to the general public by way of tax
exemptions and subsidized credit granted to the consortium selected to build the dam.
The variables that most influenced the outcome of the analysis are presented on the sensitivity
analysis graphic, shown in figure 5.
The items that contributed most positively to the final value were energy generated (firm), the price of
energy to be marketed, the load (capacity) factor and the price of energy on the open market to sell
surplus energy.
The variables that most negatively influenced the NPV – and therefore the feasibility of the project –
were the construction time, construction costs, carbon emissions and the market price of carbon
credits. Cost overruns and delays are clearly factors that impact the feasibility of large infrastructural
projects. The WCD report (WCD, 2000) cites an average cost overrun of 56% in a review of 81 large
dams worldwide. Though the variation is wide – the worst cases are from India – the numbers show
that planning and technical difficulties are endemic to large dams. Another important and typical
problem is corruption in public contracts, particularly when these processes lack transparency, which
has been the case with many Brazilian projects, notably Itaipú, the world’s second largest hydroelectric
plant. McCully (2001) presents various cases in which dams were delayed and fraught with corruption.
The author cites the Itaipú dam as a worst case of cost overruns. Schilling and Canese (1991) estimated
that an amount of around $20 billion was spent on the project, the original budget for which was $3.4
billion. In the present study, costs overruns of around 12% of the estimated budget would be sufficient
to make the project infeasible. Similarly, generation of 12% lower than expected would also make the
project infeasible (more on this later).
Sousa Junior and Reid: Costs and benefits of the Belo Monte dam Page | 262Water Alternatives - 2010 Volume 3 | Issue 2
Figure 5. Sensitivity analysis: Correlation to NPV.
Correlation to NPV
-0,6 -0,4 -0,2 0 0,2 0,4 0,6 0,8
Effective power
Building time
Energy price - regulated
Building costs
Charge factor
Carbon emissions
Carbon price
Energy price - market
Opport. costs - agriculture
Opport. costs - ornamental fishes
Opport. costs - fisheries
Opport. costs - cattle
Reservoir area
Technical difficulties often delay dam construction and decrease economic returns by delaying the
onset of revenues. The WCD report (cited before) showed that of 99 projects studied, 50% were
completed on time, 30% with delays of one to two years, and 15% with delays of three to six years.
Four other projects had delays longer than 10 years. The Tucuruí dam was slowed by over nine years by
financing and other difficulties.
Discount rates and their influence on an environmental economics analysis
The value of time in benefit-costs analysis can make a great difference in terms of weighting short- and
long-run values. Some authors advocate the use of minimum values when analysing sustainability.
Fearnside (2009) proposes evaluations for a period of 100 years with discount rates at 1%/y, in cost-
benefit analysis of tropical forest carbon storage projects. Row et al. (1981) propose 4% as the discount
rate for long-term forestry projects. The financial assessment generally uses 10%/y as proposed by the
World Bank (Belli et al., 2001).
High discount rates tend to overestimate the short-term values. Environmental conservation
projects, when analysed with high discount rates become less attractive to traditional investors.
Similarly, infrastructural projects, when analysed at discounted rates around 12%/y can appear
unattractive unless costs are spread over the first 10 years. When costs are concentrated in the first
years of construction, these projects are difficult to justify economically (see Jeuland, this issue, for an
elaborate discussion on discount rates).
In this analysis, the discount rates were of secondary importance, given that the project, with its
high cost and uncertainty surrounding the effective energy to be generated, among other aspects, has a
great probability of failure. The values of both costs and benefits were distributed throughout the study
Sousa Junior and Reid: Costs and benefits of the Belo Monte dam Page | 263Water Alternatives - 2010 Volume 3 | Issue 2 period which meant that the lower the rate, the greater the benefits and also costs in terms of Net Present Value. THE RECOMMENDATIONS OF THE WCD AND THE BELO MONTE PROJECT Only a few of the WCD recommendations are followed by the Belo Monte project. In what follows we review the seven recommendations of the WCD (Dubash et al., 2001) and discuss their incorporation (or not) in the Belo Monte project. Gaining public acceptance – Decision-making processes and mechanisms are used that enable informed participation by all groups of people, and result in the demonstrable acceptance of key decisions. Where projects affect indigenous and tribal peoples, such processes are guided by their free, prior and informed consent. The Federal Government as the main actor interested in the construction of Belo Monte is making efforts to convince the public of the benefits of the projects. But confronted with groups opposing construction of the dam, the government has characterised them as obstructionist and has steamrolled the resistance. It has used all the political resources at its disposal in a secretive process to win environmental approval for the plan. The decision-making process has, therefore, not been open and participatory. Comprehensive options assessment – Alternatives to dams often do exist. To explore these alternatives, needs for water, food and energy are assessed and objectives clearly defined. The appropriate development response is identified from a range of possible options. In the assessment process, social and environmental aspects have the same significance as economic and financial factors. The main argument for Belo Monte is the need for more electricity to feed economic growth and avoid blackouts in the next 20 or 30 years. The feasibility studies only consider isolated alternatives, none of which can match the output of the massive Belo Monte. Nevertheless, alternatives are not considered in an aggregated way, and investment in demand-side management measures is overlooked. Some analysts believe that these measures could offer additional production which is considerably higher than what the Belo Monte project promises. Addressing existing dams – Opportunities exist to optimise benefits from many existing dams, address outstanding social issues and strengthen environmental mitigation and restoration measures. Benefits and impacts may be transformed by changes in water use priorities, physical and land use changes in the river basin, technological developments, and changes in public policy expressed in environment, safety, economic and technical regulations. Some studies have already demonstrated the potential of investments in existing dams, upgrading their power production. A range from 20% to 40% of new energy could be provided by investments in existing dams (Bermann et al., 2004). However, it is a proposal that must be considered as a part of a whole energy plan, since the refurbishment or upgrading could not fulfil, in isolation, the growing energy demand. This option is not considered in the energy planning as carried out, for example, by EPE (Tomalsquim and Guerreiro, 2008). Sustaining rivers and livelihoods – Understanding, protecting and restoring ecosystems at river basin level is essential to foster equitable human development and the welfare of all species. Options assessment and decision-making around river development prioritise the avoidance of impacts, followed by the minimisation and mitigation of harm to the health and integrity of the river system. The Belo Monte project has been improved since its launch, in 1979, and with public criticism of the project. This improvement reduces the estimated social and environmental impacts, mainly due to the reduction in the reservoir area. However, according to an independent expert panel created to evaluate the impact of the project, several social and environmental questions have remained unaddressed, especially those related to damage in the dry section of the river, called Volta Grande. It is a part of the Sousa Junior and Reid: Costs and benefits of the Belo Monte dam Page | 264
Water Alternatives - 2010                                                                Volume 3 | Issue 2

natural path of the river that will remain dry after water is laterally diverted at the dam for the purpose
of energy generation, affecting the ecosystems, traditional communities and indigenous people
downstream of the dams (Santos and Hernandez, 2009). In addition, there are uncertainties over the
hydrological data, including ecological flows and flooding area that must be better addressed.
Recognising entitlements and sharing benefits – Joint negotiations with adversely affected people result
in mutually agreed and legally enforceable mitigation and development provisions. Successful
mitigation, resettlement and development are fundamental commitments and responsibilities of the
State and the developer. Accountability of responsible parties to agreed mitigation, resettlement and
development provisions is ensured through legal means, such as contracts, and through accessible legal
recourse at national and international levels.
   There is controversy about the number of people affected by the dam. The original estimates were
reduced by 50% in the last environmental report (EIA). Nevertheless, that amount is disputed by social
local groups who claim that the total number of affected people could be three times the project
estimation. On the other hand, some local inhabitants are supporting the project, because they expect
improvement in quality of life with jobs and economic activities that would be generated in the region.
The total number of workers directly or indirectly connected to the dam, according to project
estimates, is around 96,000. This number is quite close to the current population of Altamira city. This
implies a demand for infrastructure that will generate externalities to the local government, which is
also not considered by the official analysis.
Ensuring compliance – Ensuring public trust and confidence requires that governments, developers,
regulators and operators meet all commitments made for the planning, implementation and operation
of dams. A set of mutually reinforcing incentives and mechanisms is required for social, environmental
and technical measures.
    The electric energy system in Brazil is well organised in institutional terms, with strong political and
economic interests and a consolidated institutional framework. However, in spite of its organisation,
this sector has low transparency related to contracts, public accountability, and even operational
schemes. Sometimes the sector is compared with a black box, which contributes to a lack of public
trust. Therefore, the public has little confidence that provisions such as those for ecological flows will
be enforced. There is no credible and independent institution that will ensure flows at times of critical
energy demand.
Sharing rivers for peace, development and security – Storage and diversion of water on transboundary
rivers have been a source of considerable tension between countries and within countries. As specific
interventions for diverting water, dams require constructive cooperation. Consequently, the use and
management of resources increasingly become the subject of agreement between States to promote
mutual self-interest for regional cooperation and peaceful collaboration. External financing agencies
support the principles of good-faith negotiations between riparian States.
    This is probably the least problematic among WCD’s recommendations with regard to the Belo
Monte project. As the Xingu is a non-transboundary river the project does not entail external pressures
related to water conflicts. The more pertinent discussion related to this principle is about the virtual use
of water and the ecological dumping, since a good part of the Xingu’s energy demand is from the
mining industry (aluminium and manganese). As in the case of the Tucuruí dam, the energy consumed
by this industrial sector is subsidised and associated environmental damage is externalised. This follows
the classic pattern of privatising the benefits and socialising the costs of development and
infrastructural projects.
    In addition to the principles established by the WCD, the Commission also presented guidelines for
reservoir implementation (WCD, 2000), which are elaborations of the principles. Guideline 11 presents
criteria for good economic risk analysis (WCD, 2000). According to Fujikura and Nakayama (2002), this is
one of the easiest of the guidelines for governments and investors to implement, given that the

Sousa Junior and Reid: Costs and benefits of the Belo Monte dam                                 Page | 265
You can also read