Resting Energy Expenditure: From Cellular to Whole- Body Level, a Mechanistic Historical Perspective
←
→
Page content transcription
If your browser does not render page correctly, please read the page content below
Review Obesity
OBESITY BIOLOGY AND INTEGRATED PHYSIOLOGY
Resting Energy Expenditure: From Cellular to
Whole-Body Level, a Mechanistic Historical Perspective
1, Brooke Smith1, Jared Dahle2, Samantha Kennedy1, Nicole Fearnbach 1,
Steven B. Heymsfield
3, Anja Bosy-Westphal4, and Manfred J. Müller4
Diana M. Thomas
The basis of heat generated by the human body has been
a source of speculation and research for more than 2,000 Study Importance
years. Basal heat production, now usually referred to as What is already known?
resting energy expenditure (REE), is currently recognized ► Measurements and predictions of basal metabolic rate
as deriving from biochemical reactions at subcellular and or closely related resting energy expenditure are widely
cellular levels that are expressed in the energy expended used in the study and clinical management of adults with
by the body’s 78 organs and tissues. These organs and obesity.
tissues, and the 11 systems to which they belong, influ- ► Vast knowledge of the mechanisms leading to basal heat
production in humans has been acquired by investigators
ence body size and shape. Connecting these subcellular- working in basic and clinical research areas over the past
/cellular-level reactions to organs and tissues, and then century.
on to body size and shape, provides a comprehensive ► A synthesis connecting these diverse observations with
understanding of individual differences in REE, a contem- common adult phenotypes is lacking.
porary topic of interest in obesity research and clinical
What does this review add?
practice. This review critically examines these linkages,
► This review integrates mechanisms at the cellular and
their association with widely used statistical and physio-
organ-tissue body composition and functional levels with
logical REE prediction formulas, and often-unappreciated variation in body size and shape.
aspects of measuring basal heat production in humans. ► Combining these integrated mechanisms with a person’s
age and race/ethnicity provides a new basis for understand-
Obesity (2021) 29, 500-511.
ing individual differences in basal heat production in adults.
► This review also critically examines newer concepts re-
lated to the influence of ongoing weight loss and subse-
quent weight maintenance on basal heat production.
Historical Overview a person’s oxygen consumption were not yet standardized in the late
19th century, prompting Magnus-Levy to recommend strict conditions
On the eve of the French Revolution in 1789, Antoine Lavoisier and his for measuring “Grundumsatz,” or basal metabolic rate (BMR), in 1899
coworkers published their findings likening heat production in animals (2,3). Measuring BMR soon became the widely accepted tool for diag-
and humans to “combustion” in a candle: uptake of oxygen and release nosing thyroid diseases and monitoring the effects of treatment.
of heat, carbon dioxide, and water (1). The candle’s flame is extinguished
when its combustible matter, or mass, is exhausted. One century later, in Four decades later, so much knowledge had accumulated on the topic
1895, an astute observer, Adolf Magnus-Levy, surmised that combustion of human energy expenditure that Eugene F. Du Bois devoted his entire
accounted for the weight loss that a woman with obesity experienced 494-page classic book, published in 1936, to “Basal Metabolism in
when his colleagues treated her with thyroid tablets (2). Magnus-Levy Health and Disease” (4). By then, “thousands” of indirect calorimeters
tested his hypothesis by administering thyroid tablets to a nurse with had been installed at medical centers throughout the world, including
obesity while monitoring whole-body oxygen consumption over the major institutions such as Mayo Clinic (4). Diagnosing and monitor-
course of 3 weeks (2). His hypothesis proved correct: the nurse’s oxygen ing diseases such as hypo-or hyperthyroidism required setting stan-
consumption increased by 30%, proving that thyroid extract stimulates dards for “normal” BMR, and most workers at the time agreed that
metabolism and heat production in humans. Recognizing the relevance values within ± 10% of predictions based on body surface area were an
of his observation, Magnus-Levy went on to show that myxedema was acceptable range. People with diseases such as acute hyperthyroidism,
accompanied by a metabolic rate almost half that of normal, a state he as shown by Magnus-Levy (2), had BMR of 80% to 100% above those
corrected by administering thyroid extract (2). Protocols for evaluating predicted for their age, sex, and body size.
1 Pennington Biomedical Research Center, Baton Rouge, Louisiana, USA. Correspondence: Steven B. Heymsfield (steven.heymsfield@pbrc.edu) 2 Integrated
Physiology Program, University of Colorado Anschutz Medical Campus, Aurora, Colorado, USA 3 Department of Mathematical Sciences, United States Military
Academy West Point, New York, USA 4 Department of Human Nutrition and Food Science, Christian-Albrecht University of Kiel, Kiel, Germany.
© 2021 The Obesity Society. Received: 7 October 2020; Accepted: 16 November 2020; Published online 24 February 2021. doi:10.1002/oby.23090
500 Obesity | VOLUME 29 | NUMBER 3 | MARCH 2021 www.obesityjournal.org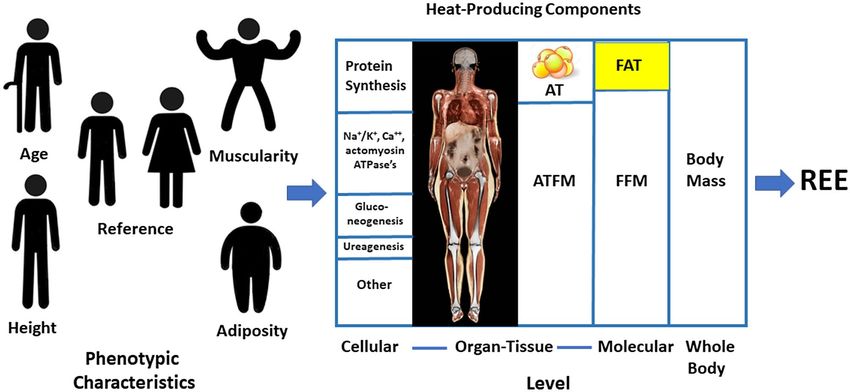
Review Obesity
OBESITY BIOLOGY AND INTEGRATED PHYSIOLOGY
Indirect calorimeters have long since been replaced by sensitive Other causes of variability in resting heat production estimates
blood tests for diagnosing thyroid and other metabolic diseases. Yet include training effects (12), technical measurement errors (12-14),
BMR, or more commonly, resting energy expenditure (REE), is as indirect calorimetry equipment and calculation differences (12), and
relevant today as it was when Du Bois published his book in 1936 intra-individual variation over time. The use of standardized mea-
(4). Countless BMR and REE estimates are made every day by peo- surement conditions showed that intra-individual variability over
ple across the globe to derive energy requirements. Physiology and days or months in REE is relatively low (15). Johnstone et al. (14)
clinical research laboratories include REE measurements as part of measured postabsorptive energy expenditure three consecutive times
numerous applied and basic research projects. REE measurements in the morning and found that only 2% of the observed variability was
are often predicted using statistical approaches (e.g., regression anal- attributable to within-individual effects, a portion of which (0.5%)
ysis), such as applying the Harris-Benedict equations (5) reviewed was analytic error. Bader et al. (16) reported an intra-individual coef-
in detail by Du Bois 8 decades ago (4). Are there new ideas on ways ficient of variation (CV) for REE of 5% measured over time peri-
to predict BMR and REE beyond statistical models? Could we use ods extending up to 6 months that also included measurement error.
equations such as those reported by Harris and Benedict as a window Schoffelen and Plasqui (17) reported the highest reproducibility for
through which to view the cellular and organ-tissue determinants of sleeping metabolic rate (CV, 2.4%) measured in a respiratory cham-
BMR? How far have we come in explaining individual differences in ber with a larger CV (3.3%) for BMR evaluated using a ventilated
BMR beyond the “± 10%” suggested in 1936 by Du Bois (4)? Is BMR hood indirect calorimeter.
influenced by variation in energy balance? This review examines
these questions, with a focus on adults, beginning with an overview Today, the term “BMR” is largely reserved for measurements made
of relevant measurement conditions and mechanisms underlying heat under the strict conditions reported in classical metabolic studies. The
production. term “REE” encompasses a wider range of reported measurement con-
ditions (18), although in some published reports REE is used synony-
mously with BMR.
Measurement
Magnus-Levy’s concept of BMR was that it represents the “metab- Mechanisms
olism required for the conservation of normal functions while the Now in the third century since Lavoisier’s seminal discoveries (1), the
organ activity is eliminated as much as possible” (2). Strict mea- mechanisms leading to basal heat production in humans are largely un-
surement conditions were established to minimize variation in en- derstood at the subcellular, cellular, and organ-tissue levels, although
ergy expenditure owing to technical measurement errors, extraneous important gaps remain. The sections that follow provide an overview
participant stimulation, and even movement during the test. The ex- of these mechanisms, gaps in current knowledge, and potential future
tent to which these rigorous conditions were met is embodied in the research areas.
classic study by Harris and Benedict (5), who reported in 1918 that
evaluated participants were in “perfect muscular repose” as “assured
by an automatic record of all movements, even those imperceptible Cellular level
to a trained observer.” Early studies often included multiple mea- By the end of the 19th century, it was understood that three organic
surements on the same day in each participant with extreme values substrates in the diet, protein, fat, and carbohydrate, were oxidized
excluded from results (4). in vivo with release of CO2, H2O, N, and heat (19). The decades
that followed established the mechanisms by which the three primary
Magnus Levy and others set ambient temperature during BMR mea- metabolic fuels are transformed to usable forms of energy at the sub-
surements within the thermoneutral range of ~21°C-27°C so that inter- cellular and cellular levels. The first step is ingestion of metabolic
nal temperature regulation in the lightly clothed person was maintained fuels as components of food, and about 95% of this ingested energy
by dry heat loss and not by sweating or non-shivering thermogenesis is retained (20). Another 4%-5% is lost in the urine as urea and other
(6). As with imperceptible body movements, “thermal comfort” effects nitrogenous compounds, the end products of protein metabolism.
related to age, sex, body composition, and clothing are now recognized The remaining ~90% is available for cell metabolism and accounts
as factors that can have a subtle influence on a person’s REE (6,7). A for whole-body oxygen consumption and heat production (Figure 1).
recent proposed approach is to track skin blood flow before and during The estimates that follow were derived from a variety of studies, in-
energy expenditure studies as a means of monitoring vasoconstriction- cluding in vitro experiments (21).
vasodilation responses that signal challenges to core temperature sta-
bility (6,7). Of the metabolizable energy available after accounting for fecal
and urinary losses, the majority is processed by cells via the Krebs
BMR does not represent the nadir in 24-hour heat production. Minimum cycle in mitochondria. A relatively impermeable inner mitochon-
levels of arousal and movement are reached during stage 3 sleep (8), drial membrane is separated from a porous outer membrane by an
with sleeping metabolic rate tending to be lower than early morning intermembrane space. Krebs cycle enzymes located on the inner
awake metabolic rate by about 5% (9). BMR also varies during the mitochondrial folds, or cristae, generate ATP via oxidative phos-
ovulatory cycle in women, with higher energy expenditure (~7%) in the phorylation. During this process, protons are pushed across the inner
luteal phase that begins following ovulation compared with the follic- mitochondrial membrane into the intermembrane space, creating an
ular phase that starts with menstruation (10). A portion of the increase electrochemical gradient that powers conversion of chemical energy
in heat production during the luteal phase of the menstrual cycle can be in metabolic fuels to ATP. This process is tightly coupled, although
accounted for by a small rise in core temperature (0.27°C) (10); a 1-°C partial uncoupling of substrate oxidation to ATP generation releases
elevation leads to a 13% increase in energy expenditure (11). heat that largely accounts for REE (21). Two components of
www.obesityjournal.org Obesity | VOLUME 29 | NUMBER 3 | MARCH 2021
501
Obesity Resting Energy Expenditure Perspective Heymsfield et al.
Figure 1 Energy utilization at the cellular level in the basal state. †While most cell oxygen consumption and energy generation culminate with ATP
synthesized in mitochondria, about 10% of respiratory oxygen uptake supports the actions of miscellaneous tissue oxidases (21). For example,
oxygenase enzymes in the brain incorporate molecular O2 into hydroxyl groups when synthesizing neurotransmitters such as norepinephrine
and serotonin. Modified from Rolfe and Brown (21). MITOC, mitochondria; N, nitrogen; Q, heat; VO2, oxygen consumption.
mitochondrial heat generation are recognized: a basal proton leak Another one-third of ATP is consumed in reactions involving mem-
that accounts for up to 20%-30% of oxygen consumption and is brane ATPases (21). These enzymes dephosphorylate ATP and release
thought to affect whole-body energy utilization and inducible pro- energy needed for basal cellular processes. The three major classes of
ton leaks that play a role in the heat generated by brown adipose ATPases, NA+/K+, Ca++, and actomyosin, account for ~20%, ~4%-
tissue (21). Uncoupling of ATP synthesis is a feature of brown adi- 6%, and ~5%-6% of basal mitochondrial ATP consumption and heat
pocytes, but the consensus is that basal heat production by brown production, respectively (21). The functional tasks of these ATPases
adipose tissue in thermoneutral environments is relatively small in include maintenance of cellular osmotic equilibrium, electrochemical
adults (22,23). Proton leakage is observed in other tissues, including gradients, muscle tone, and other related activities.
skeletal muscle, liver, kidneys, and brain (21). The recent discovery
that sarcolipin (a transmembrane proteolipid that regulates several Cellular-level processes are moderated by hormones, some of which
sarcoplasmic reticulum Ca++-ATPases in skeletal muscle) may be directly influence thermogenesis (26). Notably, multiple cellular activ-
related to non-shivering thermogenesis highlights the potential role ities involved in thermogenesis are regulated by thyroid hormone
of other heat-loss mechanisms that may be activated under some (26,27).
circumstances (24).
Organ-tissue level
There are other pathways outside of the mitochondria that consume or The oxygen-consuming cellular reactions described in Figure 1 are
produce smaller amounts of ATP. For instance, some ATP is generated reflected in the basal heat production rates of brain, heart, liver, and
outside of mitochondria during glycolysis, an oxygen- independent other organs and tissues. Our current understanding of these rates
pathway in which glucose is converted to pyruvate in the cytosol. Other evolved through a combination of animal and human investigations
subcellular organelles also contribute to overall energy expenditure, conducted over the past century. In 1907, the English scientist Joseph
although they have a small role. For example, lysosome v-type ATPases Barcroft began reporting a series of catheterization studies aimed at
maintain H+ ion gradients in order to sustain the low pH required for estimating the mass-specific metabolic rates (Ki) of major organs
the optimum function of some hydrolases (25). and tissues (28). Publishing studies in dogs 1 year later, Barcroft
found that “summated” tissue metabolism (29) could explain 83% of
The ATP generated by mitochondria are distributed across multi- the animal’s resting oxygen consumption. Field and colleagues later
ple cellular processes required for maintenance of basal metabolic reported in 1939 that cumulative in vitro tissue respirations could
functions (Figure 1). Three biosynthetic pathways consume almost account for 89% or more of an albino rat’s REE (30). Drabkin and
one-third of available ATP, the largest of which is protein synthesis Jean in 1950 (31) reported basal oxygen consumption estimates for
(~15%-18%) followed by gluconeogenesis (~5%-8%) and ureagen- human brain, heart, liver, kidneys, and skeletal muscle, and by 1992,
esis (~2%) (21). accumulated findings led Elia to propose Ki values for most major
502 Obesity | VOLUME 29 | NUMBER 3 | MARCH 2021 www.obesityjournal.org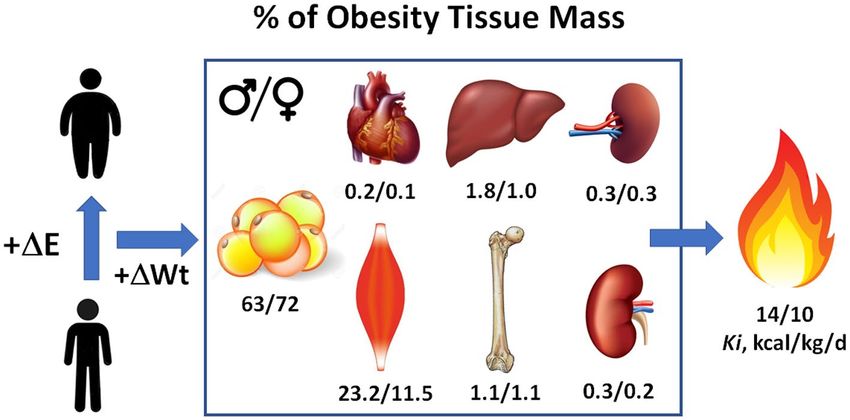
Review Obesity
OBESITY BIOLOGY AND INTEGRATED PHYSIOLOGY
peristaltic actions, and many other actions that moderate basal oxygen
consumption. An example of their impact on organ Ki values can be
appreciated using the rate-pressure product relationship for heart, myo-
cardial oxygen consumption ∝ heart rate × systolic blood pressure (37).
During sleep, heart rate and blood pressure reach a nadir at about 3 am,
resulting in a Ki value that is markedly lower than in the awake state
(38). That is one of several similar physiological responses that lead
to a lower sleep REE than awake REE measured in the early morning.
Despite tremendous progress made over the past century, our ability to
measure REE at the organ-tissue level remains limited. First, there is
a critical need for methods that can quantify actual Ki values in vivo
across most organs and tissues. As a result of this limitation, current
physiological models incorporate estimated Ki values for some major
organs and tissues, but none are recognized for components such as
the gastrointestinal tract and lung. Instead, tissues for which no Ki
value exist are frequently lumped into a large “residual” component
that is then assigned an estimated Ki value; however, this introduces
a source of error into REE estimation. A second limitation is that
whole-organ volumes evaluated with MRI cannot account for non-
metabolically active components such as blood, connective tissue, and
Figure 2 Mass-specific metabolic rates (Ki values) of selected organs and tissues (32) fat that can be present in variable amounts in skeletal muscle, liver,
and the whole body. Selected data for males and females (M/F) from a previously
reported study (33) (Supporting Information) were used to estimate mass, resting
and other organs (39). This variance can influence an organ’s density, a
energy expenditure (REE), and percentage of daily REE. Age, weight, height, and value now assumed constant when converting MRI-measured volumes
BMI of the sample were (M/F): 45.3/40.4 years; 87.0/76.9 kg; 179/167 cm; and to mass. Third, published Ki values may not accurately account for
27.3/27.3 kg/m2. regional differences in oxygen consumption that occur within some
organs and tissues, such as the brain (40). The same likely applies to
adipose tissue, a highly diverse tissue located in different anatomic
human organs and tissues (32) (Figure 2). Combining these estimated sites throughout the body (41,42). Lastly, as we review in a later sec-
Ki values with corresponding organ and tissue weights provided a tion, Ki values are age specific, and information is only now emerging
means by which a person’s REE could be calculated as the sum of on mass-specific organ metabolic rates that apply across the life-span
major organ and tissue REEs. According to this approach, an organ (43-45).
or tissue’s REE is the product of its estimated Ki value and mass. For
example, the heart’s Ki value was estimated by Elia as 440 kcal/kg/d,
and thus the average 300-g organ is predicted to consume 132 kcal/d Whole-body level
or roughly 10% of a person’s REE. Weight. Wt, or mass, represents the sum of all cellular and organ-
tissue-level heat-generating components and a relatively small amount
Noninvasively measuring the volume and mass of most body organs and of metabolically inert matter such as hair, tendons, and extracellular
tissues with magnetic resonance imaging (MRI), without undue radiation connective tissues. The relationship between REE and body mass is
exposure, became feasible in the late 1990s. Gallagher et al. in 1998 (34) a defining feature of mammals, including humans, and is articulated
and Illner et al. in 2000 (35) combined MRI-measured organ and tissue in Kleiber’s Law, REE ∝ Wt0.75 (46). Accordingly, Wt is the primary
volumes with Elia’s Ki values to achieve proof of concept in humans REE predictor variable at the whole-body level and makes up a key
by demonstrating close agreement (mean Δ, 1%-2%) between summated component of modern prediction equations, the most enduring of which
organ and tissue mass heat production rates and REE in healthy adults. were reported by Harris and Benedict in 1918 (5),
Their physiological modeling approach was straightforward: each major
organ and tissue volume was measured with MRI and converted to mass Men: REE = 66.5 + (13.75 × Wt) + (5.003 × Height) − (6.755 × Age)
using assumed stable tissue densities; the energy expenditure of each
organ and tissue was next calculated as the product of Elia’s Ki value and Women: REE = 655 + (9.563 × Wt) + (1.850 × Height) − (4.676 × Age)
measured mass; and REE was then calculated by summing the individual
organ and tissue REEs. An example of these calculations is shown in with REE, Wt, height, and age in kilocalories/day, kilograms, centime-
Figure 2 for a demonstration sample consisting of healthy adults reported ters, and years, respectively. This classic equation provides a window
in a previous study (33) and whose characteristics are summarized in into the underlying structural factors, the organs and tissues that account
Supporting Information I. A person’s whole-body Ki can be derived as for a person’s basal rate of heat production. For example, questions
their measured or calculated REE divided by their body weight (Wt), and such as why height and age are included in these equations, why there
these Ki values are given in the figure for men and women and in Table 1 are separate equations for men and women, and why these equations
for Reference Man and Reference Woman (33,36). predict REE values for African Americans that are systematically lower
than those measured (38) can be answered by exploring how body size
The energy costs of physiological processes regulated by the autonomic measures such as weight and height translate to organ-tissue-level heat-
nervous system are incorporated into the estimated organ and tissue Ki producing units of the human body. This approach provides a mech-
values as reported by Elia (32). These homeostatic activities include anistic basis at the organ-tissue level for statistical whole-body REE
heart rate, blood pressure, glomerular filtration, respiratory activity, prediction equations such as those reported by Harris and Benedict (5).
www.obesityjournal.org Obesity | VOLUME 29 | NUMBER 3 | MARCH 2021
503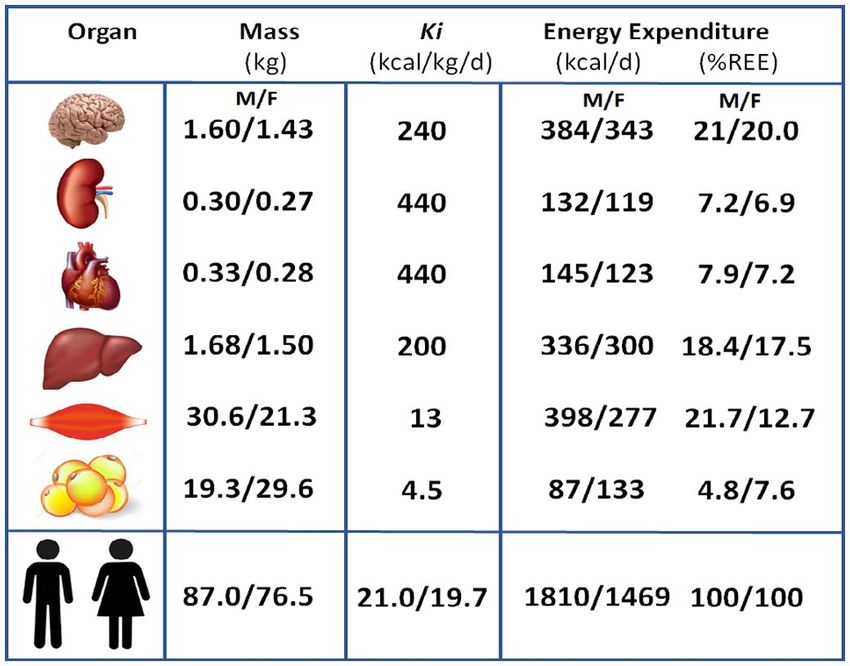
Obesity Resting Energy Expenditure Perspective Heymsfield et al.
TABLE 1 Composition and REE of reference man and woman†
Mass (kg) % of Mass % of REE % ATFM
Component Man Woman Man Woman Man Woman Man Woman
Adipose tissue 15 19 21.4 32.8 4.0 6.3
Skin 2.6 1.8 3.7 3.1 1.1 1.0 4.7 4.6
SM 28 17 40 29.3 21.7 16.4 50.9 43.6
Bone 10 6.8 14.3 11.7 1.4 1.2 18.2 17.4
Heart 0.33 0.24 0.47 0.34 8.7 7.8 0.60 0.62
Liver 1.8 1.4 2.57 2 21.5 20.8 3.27 3.59
Kidneys 0.31 0.28 0.44 0.39 8.1 9.1 0.56 0.72
Spleen 0.18 0.15 0.26 0.21 1.1 1.1 0.33 0.38
Brain 1.4 1.2 2.00 1.71 20.0 21.3 2.55 3.08
Residual 10.4 10.1 14.9 17.4 12.4 15.0 18.9 25.9
Total 70 58 100 100 100 100 100 100
Residual mass is the difference between body weight and the sum of the nine other measured organs and tissues.
ATFM, adipose-tissue free mass; Ki, mass-specific metabolic rate; REE, resting energy expenditure; SM, skeletal muscle.
†
From Snyder et al. and Hwaung et al. (33,36).
The human body has 78 organs, and yet remarkably, they and the 11 sys- Before continuing, it is important to note that, in the remainder of
tems they compose are relatively stable proportions of Wt across normal- this review, we use the term “adipose tissue” rather than “fat mass”
weight adults. That’s one reason why Reference Man and Woman have unless otherwise specified in a cited publication. Body fat is largely
similar respective whole-body Ki values (i.e., REE/Wt) of 24.3 and 23.6 composed of triglyceride (48), and fat-free mass (FFM) includes the
kcal/kg/d (Table 1) and why REE is highly correlated with body mass in cellular portion of adipose tissue, or metabolically active adipocytes,
adults, as it is in our demonstration sample (men/women; R2, 0.69/0.72; along with the 77 other organs and tissues. Methods such as MRI
both P < 0.001). All adults, in effect, are largely designed the same way, quantify adipose tissue, while dual-energy x-ray absorptiometry esti-
which is why body mass accounts for more than two-thirds of interindi- mates fat mass (42). Adipose-tissue free mass (ATFM) and FFM are
vidual differences in REE. This concept is captured in Pelley’s prediction calculated as the difference between Wt and adipose tissue and fat
equation (47), REE (kilocalories/day) = 24 × Wt (kilograms) for adults mass, respectively.
whose weights are within the normal body mass index range.
A woman at the same weight as a man has a larger relative amount of
However, deviations from these stable organ and tissue proportions adipose tissue and a smaller proportion as the remaining ATFM. If we
are recognized, and hundreds of scientific papers spanning more than replace body mass in our REE prediction model with adipose tissue
a century have tried to explain the remaining one-third of “missing” and ATFM, R2 increases further from 0.80 to 0.82, and the slope of the
variance. A small proportion of this variability is accounted for by tech- sex covariate decreases from 220 kcal/d to 110 kcal/d. ATFM includes
nical measurement factors and fluctuations in REE over time in the 77 of the body’s remaining 78 organs and tissues, so we need to nar-
same person, owing to biological factors such as the menstrual cycle row down which ones might account for the residual REE differences
in women or changes in energy balance, as discussed in a following between men and women described by our model. One potential fac-
section. Dozens of statistical equations such as those reported by Harris tor is muscularity since androgens present in men are well-recognized
and Benedict (5) have been published linking REE and factors beyond moderators of skeletal muscle mass and function (49). Another is sex
Wt. By inference, these factors signal that organ and tissue proportions, differences in brain mass; on average, absolute brain mass is 100-200 g
and perhaps their cellular makeup and activity, vary beyond that pre- smaller in women, relative to men (50), although as a percentage of
scribed by total body mass according to a person’s level of adiposity, ATFM, brain mass is larger in women (Table 2). At the same ATFM,
stature, age, and other measurable characteristics. women are thus predicted to have less skeletal muscle and more brain
mass than men. Consistent with this conjecture, ATFM has a Ki value
For example, men have a higher REE than women, and most of this of about 30 kcal/kg/d in Reference Man and 33 kcal/kg/d in Reference
difference is accounted for by a larger body mass in men. However, Woman. Accordingly, when we replace ATFM in our REE prediction
adding sex as an REE predictor in our demonstration sample regres- model with skeletal muscle and brain mass, R2 increases further from
sion model with weight as a covariate increases R2 from 0.67 to 0.80. 0.82 to 0.84, and the sex covariate is no longer significant with a slope
The slope of the sex covariate is 220 kcal/d, the predicted difference of 35 kcal/d. Adding the remaining organs that compose ATFM shown
in REE between men and women at the same weight. The differing in Figure 2 to the model increases R2 further to 0.87, with all terms sig-
associations between REE and body mass in men and women is one nificant except bone, spleen, and skin mass; the intercept of this model
reason why published REE prediction equations that include weight is 3.0 kcal/d (P = nonsignificant). The proportions of adipose tissue,
as a covariate are often sex specific. Why are these sex differences in skeletal muscle, brain, and perhaps other organs and tissues and the
REE present after controlling for body mass, and what do they reveal REE they determine thus differ between men and women who weigh
about differences in organ and tissue proportions that exist in men and the same amount. That is the main reason why REE equations at the
women? whole-body level are sex specific and why statistical REE prediction
504 Obesity | VOLUME 29 | NUMBER 3 | MARCH 2021 www.obesityjournal.org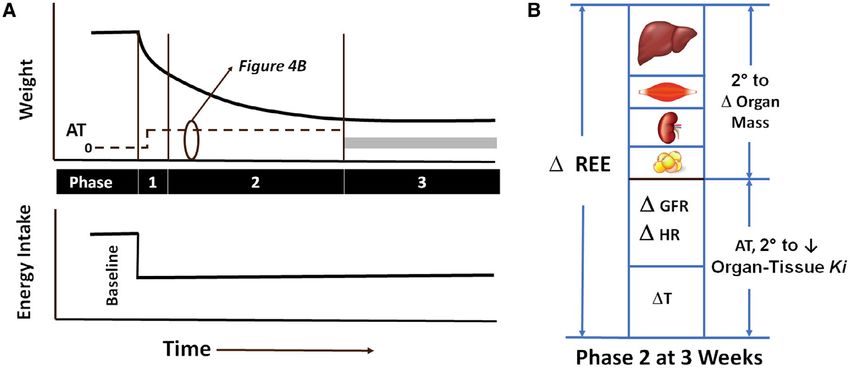
Review Obesity
OBESITY BIOLOGY AND INTEGRATED PHYSIOLOGY
At the organ-tissue level, most organs decrease in mass over the
TABLE 2 Age, body size, and REE of Reference Man (RM) and adult life-span, an effect of aging masked in part by weight stability
Woman (RW)† brought about by an increase in adipose tissue mass (52,53,59,60).
That is part of the reason why the elderly have a lower REE than
RM RW
their young counterparts of the same weight and height; adipose tis-
Age (y) 25 25 sue has a much lower Ki value than most lean tissues (Figure 2).
Weight (kg) 70 58 Another factor that affects whole-body Ki is the proportional makeup
Height (cm) 170 160 of organs; not all organs lose mass to the same relative extent with
REE (kcal/d)* 1711 1389 aging. Some organs, such as the heart, can increase in mass second-
ary to underlying common medical conditions, such as high blood
Ki (kcal/kg/d) 24.4 23.9
pressure (52,59,60). The smaller mass of most organs in the elderly
†From
is accompanied by histologic changes that affect REE. For example,
Snyder et al. and Hwaung et al. (35,36).
*For consistency, resting energy expenditure (REE) was calculated using the Harris- microscopic examination of skeletal muscle from older adults reveals
Benedict equation (5). an increase in intermuscular adipose tissue, connective tissue, and
a smaller number of contractile fibers, notably type 2 (fast-twitch)
formulas replacing weight with adipose tissue mass and ATFM should fibers (61).
ideally be sex specific.
These combined cellular metabolic and histologic changes that
Height. Our focus so far has been on body mass as a measure of accompany aging also appear to impact organ Ki. In 2010, Wang et
a person’s size. The study of basal heat production across people al. (62) examined Ki values using a regression analysis approach in
differing in size would be much simpler if all humans were spherical 131 healthy adults whose major organs and tissue volumes were mea-
in shape and had the same proportions of all 78 organs and tissues. sured with MRI. Overall, Ki values in elderly adults were about 3%
In fact, there are large between-individual differences in body shape, below those of younger adults (e.g., 194 and 233 kcal/kg/d for liver
the most notable of which is variation in height after controlling and brain vs. 200 and 240 kcal/kg/d). Geisler et al. (60) came to a
for weight. If a person’s hypothetical weight is kept constant similar conclusion in 2016. The proportion of brain gray matter (Ki,
while stretching their length, their shape will change as well as the 163 kcal/kg/d) decreases with age relative to white matter (Ki, 76
proportions of their organs and tissues. Brain mass, for example, kcal/kg/d), an observation consistent with a reduced whole-brain Ki
differs minimally across people who are short and tall and who are in older adults (60). Although results are inconsistent, brain cerebral
the same age and sex (50). At the same weight, a tall person will have metabolic rate of oxygen, measured with multiple different methods
much less adipose tissue than a short person of the same age and sex. and expressed per unit mass of tissue, appears lower in the elderly,
Skeletal structure is strongly influenced by stature according to well- notably in specific regions (63).
defined biomechanical “rules” (51). If we add 10 cm to Reference
Cellular, metabolic, histologic, and anatomic changes thus appear to
Man and Reference Woman’s height while holding their weight
largely account for the lower REE observed in elderly adults. The
and age constant (Supporting Information II), their whole- body
magnitude of these effects at the clinical level can be estimated with
respective Ki values increase from 24.4 and 23.9 kcal/kg/d to 25.2
some simple calculations. Here, we start with Reference Man and
and 24.3 kcal/kg/d or about 30-50 kcal/d. Thus, after controlling for
Woman at age 25 years. Five decades later, their respective Ki values
weight, a person’s height has a significant but small effect on REE,
would decline from 24.4 kcal/kg/d and 23.9 kcal/kg/d to 21.6 kcal/kg/d
reflecting the net of these as-yet not well characterized organ-tissue
and 19.6 kcal/kg/d (Supporting Information II), a reduction of
effects. For this reason, height is second only to Wt as a covariate in
about 10% to 15%. This is about the same magnitude of REE low-
published statistical REE prediction equations (52,53). ering experienced by Magnus-Levy between the ages of 26 and 76
years (47). An even more striking decrease in REE with age was
Age. Magnus Levy first measured his REE at age 26 and again when reported by Muller et al. (64), who observed a peak mass-specific
he was 76 years old (54). His REE, adjusted for body surface area, had REE of FFM of 25.6 kcal/kg/d in growing prepubertal children and a
declined by 13% over the 5 decades. Magnus Levy also reported that level more than half that in people over the age of 80 years at
Benedict, Du Bois, and other pioneers experienced similar reductions 12.0 kcal/kg/d.
in REE as they aged. Since then, many studies ranging from cellular
to organ-tissue levels have identified underlying mechanisms leading Adiposity and muscularity. Our review so far on how body size,
to reductions in basal whole-body oxygen consumption and energy shape, and composition relate to REE has focused on generalities
expenditure with aging. describing people who have a relatively “normal” Wt. But what
happens to REE when Wt increases beyond what is considered
With increasing age, there are reductions in red blood cell membrane the normal range based on a measure such as BMI? Under these
NA+/K+ ATPase activity (55); skeletal muscle myosin heavy chain and conditions, the “growth” in body mass can take two main pathways:
mitochondrial protein synthesis rates (56); number of liver mitochon- growth of the adipose tissue compartment during and after a period
dria (57); liver, heart, and skeletal muscle mitochondrial respiratory of positive energy balance; and growth of the skeletal muscle
chain capacity (57); tissue β-adrenergic receptors (58); and increases in compartment during and after a period of increased physical activity
the rate of mitochondrial proton leakage in skeletal muscle (56). These levels. The effects on REE would be simple to describe if the gained
and many other mechanisms at the cellular level may account, in part, weight consisted solely of adipose tissue or skeletal muscle mass,
for the lower basal oxygen consumption and energy expenditure rates although that does not occur. To understand how “growth” of body
observed in the elderly. mass in adults influences body composition, we frame this discussion
www.obesityjournal.org Obesity | VOLUME 29 | NUMBER 3 | MARCH 2021
505Obesity Resting Energy Expenditure Perspective Heymsfield et al.
in the context of the evolutionary biology hypothesis referred to as by 25 kg, their predicted REE will increase from 1,711 and 1,389 kcal/d
symmorphosis (45). According to the symmorphosis hypothesis, to 2,055 and 1,628 kcal/d, respectively; corresponding whole-body
organisms are “economically” evolved to accommodate maximal Ki values will decrease from 24.4 and 23.9 kcal/kg/d to 21.6 and
metabolic and mechanical demands without energetic inefficiencies 19.6 kcal/kg/d (Supporting Information II). The REE increase in people
brought about by carrying “excess” structure. The symmorphosis who have obesity is therefore not solely accounted for by an enlarge-
construct states that structures and functions of organs are adaptable to ment of the low metabolic rate adipose tissue compartment.
the loads placed on them, the effects are coordinated across systems,
and responses are optimized to maximize energetic efficiency. This Skeletal muscle has a Ki value of 13 kcal/kg/d, higher than that of adi-
concept provides a roadmap by which we can understand why pose tissue (4.5 kcal/kg/d) but much lower than that of visceral organs
compartments such as ATFM and FFM are so highly correlated with such as liver (200 kcal/kg/d) and heart (440 kcal/kg/d). As with adipose
REE. tissue, increases in skeletal muscle impose functional demands on other
body compartments such as bone, although we do not have detailed
Beginning with adipose tissue, functional demands are placed on models that describe these effects. Voluntarily building skeletal mus-
most body organs and their systems with expansion of this compart- cle mass through strength or endurance training increases functional
ment during periods of positive energy balance. To preserve basal demands that stimulate adaptive responses in heart mass and structure
homeostatic functions and maintain reserve capacities, many organs (65,66).
adapt by changing their structure and mass. These adaptations are
mediated by extrinsic and intrinsic mechanisms and in theory lead While we do not yet have firm data on the composition of “mus-
to organ structures that perfectly match the demands placed on them cularity” tissue, the implication of these observations is clear: wide
(65). In the case of adipose tissue expansion, systemic functional between-individual differences in adiposity and muscularity are pres-
demands lead to coordinated structural effects on skeletal muscles, ent in the general population and likely explain part of the observed
bones, heart, and other organs and tissues (Figure 3) (65). Systems variability in predicted REE values with equations such as the Harris-
with multiple organs and tissues are also linked through their func- Benedict formulas. A relatively large adipose tissue compartment is
tional activities. A large adipose tissue mass with high daily energy accompanied by high total-body percentage adipose tissue or fat.
expenditure requires coordinated actions across cardiovascular, respi- Similarly, a relatively large skeletal muscle compartment is accom-
ratory, and urinary systems. The main components of “obesity tis- panied by low percentage adipose tissue or fat. Therefore, one way to
sue” are skeletal muscle, bone, and visceral organs. Intra-individual improve REE prediction beyond body mass and account for variation
responses to weight gain can be heterogeneous, e.g., the myocardium in adiposity and muscularity is to add a measure of either percent-
hypertrophies in unique patterns related to varying loading conditions age adipose tissue or percentage fat. For example, when we add per-
brought about by differing increases in heart rate and blood pressure centage fat to our demonstration sample REE prediction model that
(59). includes Wt, R2 increases from 0.69 and 0.72 to 0.75 and 0.79 in men
and women, respectively. This approach has the same effect as mod-
While adipose tissue has a Ki of 4.5 kcal/kg/d, obesity tissue has a Ki ifying the Harris-Benedict equations by replacing Wt with adipose
of about 10-14 kcal/kg/d, reflecting the combined energy expenditure tissue and ATFM or fat mass and FFM. There are many published
of these other organ and tissue contributors to REE (36). If we increase versions of these statistical REE prediction models that also include
Reference Man (70 kg) and Reference Woman’s (60 kg) body mass age, sex, and other covariates (67,68).
Figure 3 Weight (Wt) gain following a period of positive energy balance includes not only an expanded adipose
tissue compartment but also increases in the mass and structure of other tissues and organs, some of which are
depicted in the figure. The percentage of “obesity tissue” consisting of these multiple components is shown in the
figure for men and women along with the respective mass-specific metabolic rates (Ki) of this compartment. The
data shown are cross-sectional and are those reported by Hwaung et al. (33). ΔE, energy balance.
506 Obesity | VOLUME 29 | NUMBER 3 | MARCH 2021 www.obesityjournal.orgReview Obesity
OBESITY BIOLOGY AND INTEGRATED PHYSIOLOGY
We began this section describing body mass as the sum of 78 organs specifically on the temporal sequence of metabolic changes present
and tissues. As shown in our review, the structures of these many during and after weight loss. The following observations are based on
different body compartments and their associated systems are not the longitudinal studies of Muller and colleagues (6,74) conducted
independent; rather, they follow “rules” that still need refinement and in young men residing on a metabolic unit under strictly controlled
discovery but that we now recognize to be of fundamental importance conditions.
in defining how sex, stature, age, adiposity, and muscularity relate to
REE. Equations for predicting REE such as those reported by Harris Embarking on a weight loss protocol with a 50% energy deficit led to
and Benedict (5) are useful because they capture these major deter- rapid weight loss in the men (decay constant, X ± SD, −0.78 ± 19 kg/d)
minants of coordinated tissue and organ responses at the population (74) that lasted about 3 days, a period referred to as Phase 1 (Figure 4A).
level. Similarly, combined compartments such as ATFM and FFM By the third day, REE levels were about 50 to 100 kcal/d below those
are powerful predictors of REE because tissues and organs undergo predicted by the group’s organ-tissue body composition model (74).
a predictable integrated response to variation in loading conditions The difference between measured and predicted REE is referred to as
brought about by fluctuations in adiposity and muscularity across the metabolic adaptation or “adaptive thermogenesis” (75).
adult life-span.
Phase 1 was characterized by a sharp drop in plasma levels of insulin
Race/ethnicity. Even after controlling for weight, height, and age and a rise in glucagon, rapid glycogenolysis, and negative energy, nitro-
in the sex- Benedict equations, structural differences gen, sodium, and water balances. Free-water clearance, linked to the
specific Harris-
between racial/ethnic groups account for a small portion of between- fall in insulin levels and an energy-requiring process (76), decreased
individual differences in REE. The best-documented of these is for with excess urinary salt and osmolyte excretion during Phase 1 and is
African Americans compared with their White American counterparts among the physiological adjustments that impact organ Ki values, in
(69). African Americans have a 5% lower REE compared with people this case the kidneys. Others have reported REE reductions of similar
of the same weight, height, and age who are White (69-71). African magnitude with total fasts lasting 24 to 48 hours (77,78).
Americans, on average, have a larger proportion of their weight as
skeletal muscle and bone and a smaller proportion as adipose tissue and Weight loss slowed markedly after several days (−0.19 ± 0.03 kg/d),
organ mass than do people who are White of the same body size (69). heralding the onset of Phase 2. The slowing of weight loss reflected
The racial/ethnic differences in REE are no longer significant when a transition from mainly decrements in ATFM to a relative increase in
prediction models include body fat, skeletal muscle, and bone mass as lipid oxidation and depletion of fat contained within adipose tissue. By
covariates (70). The same kinds of REE prediction model differences the third protocol week, there were measurable significant reductions
related to body structure are reported for many other racial/ethnic in adipose tissue, liver, skeletal muscle, and kidney mass (Figure 4B)
groups and extend back to studies conducted more than 5 decades ago that could account for about 60% of the lowering of REE from baseline.
(72). An important consideration is that factors such as diet, activity The remaining reduction in REE, adaptive thermogenesis, was similar
levels, and sociodemographic variables can account for some of these to Phase 1 at 50 to 100 kcal/d. Three factors could account for the mag-
previously reported REE and body composition differences between nitude of adaptive thermogenesis at week 3 according to the authors:
race and ethnic groups. a significant reduction in glomerular filtration and heart rate/systolic
blood pressure that lowered respective kidney and heart Ki values, and
Genetic mechanisms are now recognized as the basis for some of the a decrease in core temperature that impacted whole-body energy expen-
individual and group differences in organ size among people who are diture. A recent study by Heinitz et al. (79) reported the presence of
healthy. One recent example is the adaptive increase in spleen volume adaptive thermogenesis during Phase 2 at weeks 1 and 3 with weight
present in the Bajau people of Southeast Asia, who live a subsistence loss of about 100 kcal/d, the same average magnitude as observed by
lifestyle that includes breath-hold diving (73). The enlarged spleen Muller et al. (74). Martins et al. (67) also observed an adaptive thermo-
with greater capacity to hold oxygenated blood improves tolerance to genesis level of 90 ± 94.5 kcal/d (P < 0.001) after 8 weeks of a 1,000
hypoxia and is associated with genetic variants in the PDE10A gene kcal/d low-energy diet in participants with obesity. Adaptive thermo-
(73), a phosphodiesterase linked with thyroid function and spleen genesis was no longer significant (26.8 ± 121.5 kcal/d) following 4
size. weeks of weight stabilization during which the participants gained a
small amount of weight.
Active weight loss thus will lower REE on average by about 50-100
kcal/d beyond that estimated using physiological prediction models;
Weight Loss Effects in the study by Muller et al. (74), only 60% of participants displayed
Magnus-Levy, Benedict, Du Bois, and other early investigators were adaptive thermogenesis at the third week of weight loss. Statistical
meticulous in their BMR evaluations, including requirements for par- prediction models will therefore be inaccurate when estimating REE
ticipants to be weight stable. Today, we can predict a weight-stable in most people losing weight. Exploration into the basis for this inac-
person’s REE within ± 5%, and organ-tissue prediction models leave curacy provides insights into the inherent limitations of statistical
only about 10% of the between-individual variance in REE unex- REE prediction formulas when applied in people losing weight. An
plained after considering technical measure factors (74). In current extreme example is useful in this regard, examination of the changes
clinical settings, however, prediction formulas are often used to in Agostino Levanzin’s sleep energy expenditure during his 31-day
estimate a person’s REE and energy requirements during a weight total fast in 1912 (80). Francis Gano Benedict, who 6 years later with
control program or in the “post-obesity” state. These practices raise J. Arthur Harris published the now classic Harris-Benedict BMR pre-
the question of what effects active weight loss or weight stability diction equations (5), made detailed sleep energy expenditure measure-
in the postobesity state have on REE measurements. Here, we can ments on Levanzin using both direct and indirect calorimetry systems.
gain insights into these questions from published studies focused Levanzin’s weight loss curve and energy expenditure measurements are
www.obesityjournal.org Obesity | VOLUME 29 | NUMBER 3 | MARCH 2021
507Obesity Resting Energy Expenditure Perspective Heymsfield et al.
Figure 4 (A) Time course of the weight change that follows a reduction in energy intake held at the same lower level until a new steady state is reached.
The horizontal gray bar located in Phase 3 reflects the uncertainty in adaptive thermogenesis (AT) magnitude present in the post-obesity state. (B) The
lowering of resting energy expenditure (REE) observed during Phase 2 following 3 weeks of 50% caloric restriction in men whose weight was in the
normal BMI range (74). About one-half of the lowering of REE can be accounted for by reductions in liver, skeletal muscle, adipose tissue, kidney, and
brain mass. The remainder is considered AT as reflected in lowering of organ-tissue mass-specific metabolic rate (Ki) values. Muller et al. (74) ascribed
AT in their study to a slowing of heart rate (HR), reduction in glomerular filtration rate (GFR), and decrease in core temperature (T).
Figure 5 Course of 31-day total fast of Levanzin that was studied by Francis Gano Benedict in 1912 (80). Upper left and right panels show Levanzin’s weight and sleep energy
expenditure (EE) changes, measured by direct (Dir Cal) and indirect calorimetry (Ind Cal), over the 31-day experiment. The lower left panel shows the actual measured sleep
energy expenditure and the predicted basal metabolic rate using the Harris-Benedict equation (5) for men over the 31-day experiment. The lower right panel shows the
whole-body Ki values (mass-specific metabolic rates) corresponding to the energy expenditure measurements and predictions to the left.
508 Obesity | VOLUME 29 | NUMBER 3 | MARCH 2021 www.obesityjournal.orgReview Obesity
OBESITY BIOLOGY AND INTEGRATED PHYSIOLOGY
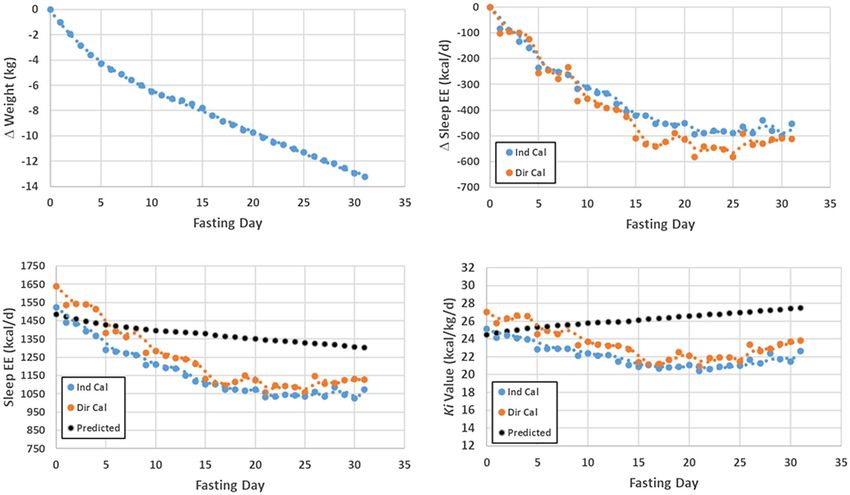
Figure 6 Linkages between common phenotypes and basal heat-producing components of the human body at the cellular, organ-tissue, molecular, and whole-
body levels. AT, adipose tissue; ATFM, adipose tissue-free mass; FFM, fat-free mass; REE, resting energy expenditure.
shown in the upper panels of Figure 5. His sleep energy expenditure Conclusion
fell by about 100 kcal/d during the first several days of the fast, largely
Phase 1. Weight and energy expenditure continued to decrease during Two thousand years have elapsed since humans first recorded their the-
the remainder of the 31-day fast (Phase 2). The Harris-Benedict BMR ories on what produces heat in the human body (19). Two hundred years
equation for men increasingly overestimates Levanzin’s actual sleep ago, Lavoisier laid the foundations for modern physiology and metabo-
energy expenditure with progression of the fast, as shown in the lower lism by relating heat production in animals and humans to the processes
left panel of the figure. The statistical Harris-Benedict BMR prediction leading to combustion in a candle (1). Today, we have a deep under-
equations, in addition to their development in people who were weight standing of basal heat production, including how body size, shape, and
stable, link a lower Wt at the same height and age to a lower adiposity composition relate to molecular, cellular, and organ-tissue thermogen-
level. The Harris-Benedict equation for men thus predicts an increasing
esis mechanisms (Figure 6). Nevertheless, large gaps persist, includ-
Ki value as Levanzin loses weight, as shown in the lower right panel of
ing our inability to quantify many of the involved processes in living
the figure. The Harris-Benedict equation includes the inherent assump-
humans. Moreover, our REE prediction models remain fragmentary
tion that lower Wt at the same height and age translates to less adiposity
tissue and thus higher Ki value. Recall from the earlier discussion that owing to their development using small samples that are homogenous
increasing adipose tissue is accompanied by a fall in a person’s Ki value; in terms of age, race, and ethnicity, thus lacking the diversity present
here, the associations are reversed. By contrast, Levanzin’s actual Ki in humankind. We have yet to fully integrate REE measurements into
values decrease during the fast, a reflection of rapidly changing organ- clinical physiology. Thus, vast future areas of research remain untapped
tissue proportions and their associated Ki values (adaptive thermogen- that can fulfill the unrelenting demand for new knowledge on basal heat
esis). Detailed body composition, unavailable to Benedict at the time, production mechanisms in humans.O
would give further insights into the magnitudes of these effects and the
level of estimated adaptive thermogenesis. While total fasts are rarely
encountered in clinical practice, the kinds of errors described here can Acknowledgments
be anticipated when applying statistical REE prediction equations to
The authors acknowledge Ms. Melanie Peterson for her assistance in
patients with obesity during their weight control program.
preparing this manuscript.
Reaching a weight plateau (Phase 3) can take many months to arrive Funding agencies: This work was partially supported by the National Institutes of
at a new steady state with neutral energy balance and fully remodeled Health Nutrition Obesity Research Centers (NORC) Grant P30DK072476 Pennington/
organs and tissues (81). Of the available literature describing metabolic Louisiana and Grant P30DK040561 Harvard.
features of people reaching Phase 3, post-obesity, some conclude that
Disclosure: The authors declared no conflict of interest.
predicted and measured REE are approximately equal, whereas others
report persistent metabolic adaptations, even during periods of weight Supporting information: Additional Supporting Information may be found in the on-
regain (25,46,67,68,82-91). line version of this article.
www.obesityjournal.org Obesity | VOLUME 29 | NUMBER 3 | MARCH 2021
509Obesity Resting Energy Expenditure Perspective Heymsfield et al.
References 34. Gallagher D, Belmonte D, Deurenberg P, et al. Organ-tissue mass measurement allows
modeling of ree and metabolically active tissue mass. Am J Physiol 1998;275:E249-E258.
1. Lavoisier AL, Laplace PS. Mémoire Sur la Chaleur, lu à l’Académie Royale des
35. Illner K, Brinkmann G, Heller M, Bosy-Westphal A, Muller MJ. Metabolically active
Sciences. Paris: Impr. royale; 1783.
components of fat free mass and resting energy expenditure in nonobese adults. Am J
2. Magnus-Levy A. Energy metabolism in health and disease. J Hist Med Allied Sci
Physiol Endocrinol Metab 2000;278:E308-E315.
1947;2:307-320.
36. Snyder WS, Cook MJ, Nasset ES, Karhausen LR, Howells GP, Tipton IH. Report of the
3. Henry CJ. Basal metabolic rate studies in humans: measurement and development of
Task Group on Reference Man. Oxford: Pergamon Press; 1975.
new equations. Public Health Nutr 2005;8:1133-1152.
37. Gobel FL, Norstrom LA, Nelson RR, Jorgensen CR, Wang Y. The rate-pressure product
4. Du Bois EF. Basal Metabolism in Health and Disease; vol 494. 3rd ed. Philadelphia: as an index of myocardial oxygen consumption during exercise in patients with angina
Lea & Febiger; 1936. pectoris. Circulation 1978;57:549-556.
5. Harris JA, Benedict FG. A biometric study of human basal metabolism. Proc Natl Acad 38. Degaute JP, van de Borne P, Linkowski P, Van Cauter E. Quantitative analysis of
Sci U S A 1918;4:370-373. the 24-hour blood pressure and heart rate patterns in young men. Hypertension
6. Soares MJ, Muller MJ. Resting energy expenditure and body composition: critical as- 1991;18:199-210.
pects for clinical nutrition. Eur J Clin Nutr 2018;72:1208-1214. 39. Sinha J, Duffull SB, Green B, Al-Sallami HS. Evaluating the relationship between lean
7. Kingma B, Frijns A, van Marken LW. The thermoneutral zone: implications for meta- liver volume and fat-free mass. Clin Pharmacokinet 2020;59:475-483.
bolic studies. Front Biosci (Elite Ed) 2012;4:1975-1985. 40. Geisler C, Hubers M, Granert O, Muller MJ. Contribution of structural brain pheno-
8. Fontvieille AM, Rising R, Spraul M, Larson DE, Ravussin E. Relationship between types to the variance in resting energy expenditure in healthy Caucasian subjects. J Appl
sleep stages and metabolic rate in humans. Am J Physiol 1994;267:E732-E737. Physiol (1985) 2018;125:320-327.
9. Kumahara H, Yoshioka M, Yoshitake Y, Shindo M, Schutz Y, Tanaka H. The difference 41. Pond C. The Fats of Life. Cambridge: Cambridge University Press; 1998.
between the basal metabolic rate and the sleeping metabolic rate in Japanese. J Nutr Sci 42. Shen W, Wang Z, Punyanita M, et al. Adipose tissue quantification by imaging methods:
Vitaminol (Tokyo) 2004;50:441-445. a proposed classification. Obes Res 2003;11:5-16.
10. Zhang S, Osumi H, Uchizawa A, et al. Changes in sleeping energy metabolism and 43. Muller MJ, Wang Z, Heymsfield SB, Schautz B, Bosy-Westphal A. Advances in the
thermoregulation during menstrual cycle. Physiol Rep 2020;8:e14353. doi:10.14814/ understanding of specific metabolic rates of major organs and tissues in humans. Curr
phy2.14353 Opin Clin Nutr Metab Care 2013;16:501-508.
11. DuBois EF. The basal metabolism in fever. JAMA 1921;77:352-355. 44. Pourhassan M, Eggeling B, Schautz B, et al. Relationship between submaximal oxygen
12. Soares MJ, Shetty PS. Long-term stability of metabolic rates in young adult males. Hum uptake, detailed body composition, and resting energy expenditure in overweight sub-
Nutr Clin Nutr 1987;41:287-290. jects. Am J Hum Biol 2015;27:397-406.
13. Durnin JVGA. Basal metabolic rate in man. Food and Agriculture Organization of the 45. Estenson TL. Symmorphosis: On Form and Function in Shaping Life; vol xiii.
United Nations. Published October 1981. Accessed December 9, 2020. http://www.fao. Cambridge, MA: Harvard University Press; 2000: 263.
org/3/m2845e/m2845e00.htm 46. Kleiber M. Body size and metabolism. Hilgardia 1932;6:315-351.
14. Johnstone AM, Murison SD, Duncan JS, Rance KA, Speakman JR. Factors influenc- 47. Pelley JW. Elsevier’s Integrated Review Biochemistry; vol xii. 2nd ed. Philadelphia:
ing variation in basal metabolic rate include fat-free mass, fat mass, age, and circu- Elsevier/Mosby; 2012:214.
lating thyroxine but not sex, circulating leptin, or triiodothyronine. Am J Clin Nutr 48. Comizio R, Pietrobelli A, Tan YX, et al. Total body lipid and triglyceride response to en-
2005;82:941-948. ergy deficit: relevance to body composition models. Am J Physiol 1998;274:E860-E866.
15. International Dietary Energy Consultative Group (IDECG). Variability in adult 49. Schiaffino S, Dyar KA, Ciciliot S, Blaauw B, Sandri M. Mechanisms regulating skeletal
BMRs. Updated September 19, 1995. Accessed September 25, 2020. http://archi muscle growth and atrophy. FEBS J 2013;280:4294-4314.
ve.unu.edu/unupre ss/food2/U ID01E /UID01E 05.HTM#variab ility %20in%20adu 50. Heymsfield SB, Muller MJ, Bosy-Westphal A, Thomas D, Shen W. Human brain mass:
lt%20bmrs similar body composition associations as observed across mammals. Am J Hum Biol
16. Bader N, Bosy-Westphal A, Dilba B, Muller MJ. Intra-and interindividual variability 2012;24:479-485.
of resting energy expenditure in healthy male subjects—biological and methodological 51. Biewener AA. Scaling body support in mammals: limb posture and muscle mechanics.
variability of resting energy expenditure. Br J Nutr 2005;94:843-849. Science 1989;245:45-48.
17. Schoffelen PFM, Plasqui G. Classical experiments in whole-body metabolism: open- 52. Gallagher D, Allen A, Wang Z, Heymsfield SB, Krasnow N. Smaller organ tissue
circuit respirometry-diluted flow chamber, hood, or facemask systems. Eur J Appl mass in the elderly fails to explain lower resting metabolic rate. Ann N Y Acad Sci
Physiol 2018;118:33-49. 2000;904:449-455.
18. Compher C, Frankenfield D, Keim N, Roth-Yousey L; Evidence Analysis Working 53. He Q, Heshka S, Albu J, et al. Smaller organ mass with greater age, except for heart.
Group. Best practice methods to apply to measurement of resting metabolic rate in J Appl Physiol (1985) 2009;106:1780-1784.
adults: a systematic review. J Am Diet Assoc 2006;106:881-903. 54. Magnus-Levy A. Basal metabolism in the same person after an interval of fifty years.
19. Heymsfield SB, Bourgeois B, Thomas DM. Assessment of human energy exchange: JAMA 1942;118:1369. doi:10.1001/jama.1942.62830160002007a
historical overview. Eur J Clin Nutr 2017;71:294-300. 55. Gambert SR, Duthie EH Jr. Effect of age on red cell membrane sodium -potassium
20. Heymsfield SB, Smith J, Kasriel S, et al. Energy malabsorption: measurement and nu- dependent adenosine triphosphatase (na+-k+ atpase) activity in healthy men. J Gerontol
tritional consequences. Am J Clin Nutr 1981;34:1954-1960. 1983;38:23-25.
21. Rolfe DF, Brown GC. Cellular energy utilization and molecular origin of standard met- 56. Short KR, Bigelow ML, Kahl J, et al. Decline in skeletal muscle mitochondrial function
abolic rate in mammals. Physiol Rev 1997;77:731-758. with aging in humans. Proc Natl Acad Sci U S A 2005;102:5618-5623.
22. Carpentier AC, Blondin DP, Virtanen KA, Richard D, Haman F, Turcotte EE. Brown 57. Bratic A, Larsson NG. The role of mitochondria in aging. J Clin Invest 2013;123:951-957.
adipose tissue energy metabolism in humans. Front Endocrinol (Lausanne) 2018;9:447. 58. Ruggiero C, Ferrucci L. The endeavor of high maintenance homeostasis: resting meta-
23. Fernandez-Verdejo R, Marlatt KL, Ravussin E, Galgani JE. Contribution of brown adi- bolic rate and the legacy of longevity. J Gerontol A Biol Sci Med Sci 2006;61:466-471.
pose tissue to human energy metabolism. Mol Aspects Med 2019;68:82-89. 59. Bosy-Westphal A, Eichhorn C, Kutzner D, Illner K, Heller M, Muller MJ. The age-
24. Bal NC, Periasamy M. Uncoupling of sarcoendoplasmic reticulum calcium atpase pump related decline in resting energy expenditure in humans is due to the loss of fat-free mass
activity by sarcolipin as the basis for muscle non-shivering thermogenesis. Philos Trans and to alterations in its metabolically active components. J Nutr 2003;133:2356-2362.
R Soc Lond B Biol Sci 2020;375:20190135. doi:10.1098/rstb.2019.0135 60. Geisler C, Braun W, Pourhassan M, et al. Age-dependent changes in resting energy
25. Cooper GM. The Cell: A Molecular Approach. 2nd ed. Sunderland, MA: Sinauer expenditure (ree): insights from detailed body composition analysis in normal and over-
Associates; 2000. weight healthy Caucasians. Nutrients 2016;8:322.
26. Silva JE. Thermogenic mechanisms and their hormonal regulation. Physiol Rev 61. Lexell J. Human aging, muscle mass, and fiber type composition. J Gerontol A Biol Sci
2006;86:435-464. Med Sci 1995;50 Spec. No.:11-16.
27. Kim B. Thyroid hormone as a determinant of energy expenditure and the basal meta- 62. Wang Z, Ying Z, Bosy-Westphal A, et al. Specific metabolic rates of major organs and
bolic rate. Thyroid 2008;18:141-144. tissues across adulthood: evaluation by mechanistic model of resting energy expendi-
28. Barcroft J, Dixon WE. The gaseous metabolism of the mammalian heart: Part I. J ture. Am J Clin Nutr 2010;92:1369-1377.
Physiol 1907;35:182-204. 63. Aanerud J, Borghammer P, Chakravarty MM, et al. Brain energy metabolism and blood
29. Barcroft J. Zur lehre vom blutgaswechsel in den verschiedenen organen. Ergebnisse der flow differences in healthy aging. J Cereb Blood Flow Metab 2012;32:1177-1187.
Physiologie 1908;7:699-794. 64. Muller MJ, Geisler C, Hubers M, Pourhassan M, Braun W, Bosy- Westphal A.
30. Field J, Belding HS, Martin AW. An analysis of the relation between basal metabolism Normalizing resting energy expenditure across the life course in humans: challenges
and summated tissue respiration in the rat i. The post-pubertal albino rat. J Cell Comp and hopes. Eur J Clin Nutr 2018;72:628-637.
Physiol 1939;14:143-157. 65. Heymsfield SB. Energy expenditure-body size associations: molecular coordination.
31. Drabkin DL, Jean R. The distribution of the chromoproteins, hemoglobin, myoglobin, Eur J Clin Nutr 2018;72:1314-1319.
and cytochrome c, in the tissues of different species, and the relationship of the total 66. Heymsfield SB, Peterson CM, Bourgeois B, et al. Human energy expenditure: advances
content of each chromoprotein to body mass. J Biol Chem 1950;182:317-334. in organ-tissue prediction models. Obes Rev 2018;19:1177-1188.
32. Elia M. Organ and tissue contribution to metabolic rate. In: Kinney JM, Tucker HN, eds. 67. Martins C, Roekenes J, Salamati S, Gower BA, Hunter GR. Metabolic adaptation is an
Energy Metabolism: Tissue Determinants and Cellular Corollaries. New York: Raven illusion, only present when participants are in negative energy balance. Am J Clin Nutr
Press; 1992:61-79. 2020;112:1212-1218.
33. Hwaung P, Bosy- Westphal A, Muller MJ, et al. Obesity tissue: composition, en- 68. Rosenbaum M, Hirsch J, Gallagher DA, Leibel RL. Long-term persistence of adaptive
ergy expenditure, and energy content in adult humans. Obesity (Silver Spring) thermogenesis in subjects who have maintained a reduced body weight. Am J Clin Nutr
2019;27:1472-1481. 2008;88:906-912.
510 Obesity | VOLUME 29 | NUMBER 3 | MARCH 2021 www.obesityjournal.orgYou can also read