DECARBONISATION OPTIONS FOR THE DUTCH BOTTLE-GRADE PET INDUSTRY - A. Tran, K.J. West
←
→
Page content transcription
If your browser does not render page correctly, please read the page content below
DECARBONISATION OPTIONS
  FOR THE DUTCH BOTTLE-
   GRADE PET INDUSTRY

                      A. Tran, K.J. West

                         07 May 2021

Manufacturing Industry Decarbonisation Data Exchange Network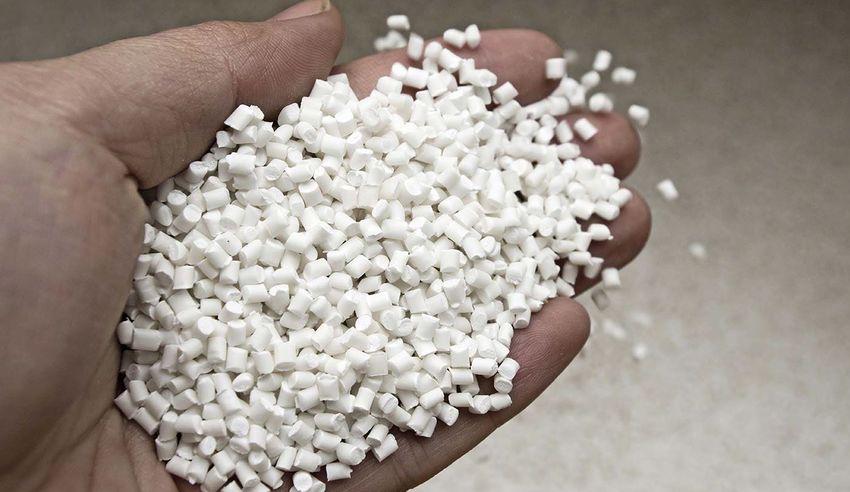
Decarbonisation options for the Dutch bottle-grade PET industry
© PBL Netherlands Environmental Assessment Agency; © TNO
The Hague, 2021
PBL publication number: 4617
TNO project no. 060.47868 / TNO 2021 P10748

Authors
A. Tran and K.J. West

Acknowledgements
We are grateful for feedback from Ashwin Briedjlal, Wout Fornara, John Sluijmers, and Paul
Straatman (Indorama Ventures Europe B.V.).

MIDDEN project coordination and responsibility
The MIDDEN project (Manufacturing Industry Decarbonisation Data Exchange Network) was
initiated and is also coordinated and funded by PBL and TNO. The project aims to support
industry, policymakers, analysts, and the energy sector in their common efforts to achieve
deep decarbonisation. Correspondence regarding the project may be addressed to:
Dick van Dam (PBL), dick.vandam@pbl.nl, or Silvana Gamboa Palacios (TNO),
silvana.gamboapalacios@tno.nl.

This publication is a joint publication by PBL and TNO and can be downloaded from:
www.pbl.nl/en. Parts of this publication may be reproduced, providing the source is stated, in
the form: Tran, A., & West, K. J. (2021). Decarbonisation options for the Dutch bottle-grade
PET industry. PBL Netherlands Environmental Assessment Agency & TNO, The Hague.

PBL Netherlands Environmental Assessment Agency is the national institute for strategic
policy analysis in the fields of the environment, nature and spatial planning. We contribute to
improving the quality of political and administrative decision-making by conducting outlook
studies, analyses and evaluations in which an integrated approach is considered paramount.
Policy relevance is the prime concern in all of our studies. We conduct solicited and
unsolicited research that is both independent and scientifically sound.

TNO Energy Transition has a twofold mission: to accelerate the energy transition and to
strengthen the competitive position of the Netherlands. TNO Energy Transition conducts
independent and internationally leading research and we stand for an agenda-setting,
initiating and supporting role for government, industry and NGOs.

This report was reviewed by Indorama Ventures Europe B.V.
PBL and TNO remain responsible for the content. The decarbonisation options and
parameters are explicitly not verified by the companies.
Contents
List of abbreviations and acronyms                                                  4
Summary                                                                             5

INTRODUCTION                                                                        6
Scope                                                                               6
Reading guide                                                                       6

1  BOTTLE-GRADE PET AND PTA PRODUCTION IN THE
NETHERLANDS                                                                         7
1.1   Indorama Ventures Europe B.V.                                                 7
1.2   History                                                                       8
1.3   Local infrastructure                                                          8
1.4   Production capacity                                                           9
1.5   Greenhouse gas emissions                                                     10

2     BOTTLE-GRADE PET AND PTA PROCESSES                                          11
2.1   Bottle-grade PET value chain                                                 11
2.2   Technical description of bottle-grade PET                                    11
2.3   PTA production processes at Indorama Rotterdam                               12
2.4   PET production processes at Indorama Rotterdam                               14
2.5   Utilities at Indorama Rotterdam                                              16
2.6   Energy consumption and emissions                                             16

3     BOTTLE-GRADE PET AND PTA PRODUCTS AND APPLICATIONS 18
3.1   IVL products in the Netherlands                                              18
3.2   Bottle-grade PET and PTA market                                              19
3.3   Applications of PTA                                                          21
3.4   Applications of bottle-grade PET                                             21

4     OPTIONS FOR DECARBONISATION                                                 23
4.1   Fuel substitution                                                            23
4.2   Heat recovery and utilization                                                28
4.3   Process substitution                                                         30
4.4   Recycling                                                                    30
4.5   MEG and PX from biomass                                                      32
4.6   Carbon Capture and Storage (CCS)                                             33
4.7   Product design                                                               34
4.8   Alternative materials                                                        34

5   DISCUSSION                                                                    36
REFERENCES                                                                        38

                                                       A MIDDEN report – PBL – TNO | 3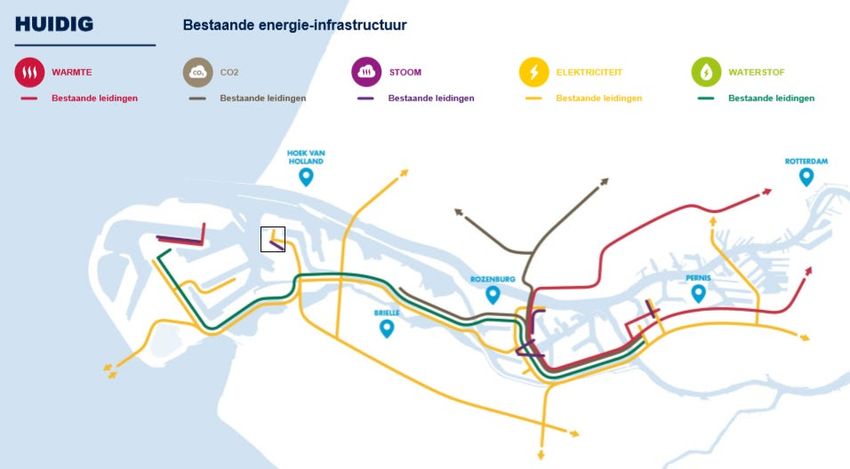
List of abbreviations and acronyms

  Abbreviation or acronym         Meaning

 4-CBA                            4-Carboxybenzaldehyde

 A-PET                            Amorphous polyethylene terephthalate

 BHET                             Bishydroxyethyl terephthalate

 CHP                              Combined heat and power

 CO2                              Carbon dioxide

 CO2-eq                           Carbon dioxide equivalent

 CP                               Continuous polymerization

 CTA                              Crude terephthalic acid

 CSD                              Carbonated soft drinks

 FDCA                             2,5-Furandicarboxylic acid

 GHG                              Greenhouse gas

 HET                              Hydroxyethyl terephthalate

 Indorama Rotterdam               Indorama Ventures Europe B.V.

 IV                               Intrinsic viscosity

 IVL                              Indorama Ventures Public Company Limited

 LHV                              Lower heating value

 MEG                              Mono-ethylene glycol

 MIDDEN                           Manufacturing industry decarbonisation data exchange
                                  network

 MX                               Meta-xylene

 PEF                              Polyethylene 2,5-furandicarboxylate

 PET                              Polyethylene terephthalate

 PIA                              Purified isophthalic acid

 PLA                              Polylactic acid

 PTA                              Purified terephthalic acid

 PX                               Para-xylene

 rPET                             Recycled polyethylene terephthalate

 t, kt, Mt                        Tonne (103 kg), kilotonne (106 kg), megatonne (109 kg)

 y                                Year

PBL – TNO | 4 – A MIDDEN report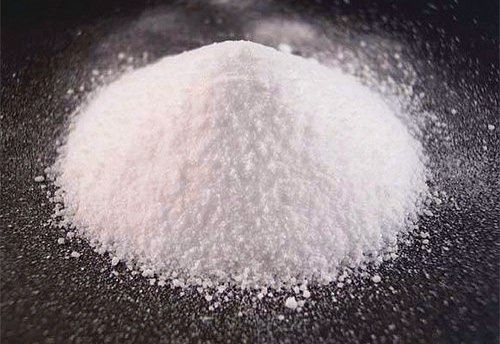
FINDINGS

Summary
Indorama Rotterdam is a petrochemical company which specializes in the production of bottle-
grade PET (polyethylene terephthalate) pellets and PTA (purified terephthalic acid) powder.
Indorama, located in the Europoort section of the Port of Rotterdam, is the largest producer of
bottle-grade PET and PTA in the Netherlands. In 2016, Indorama Rotterdam accounted for 125
ktCO2-eq of greenhouse gas emissions. Bottle-grade PET is used in the manufacturing of
packaging (mainly beverage bottles). PET is produced by esterifying and polymerizing PTA and
MEG (mono-ethylene glycol). PTA is for a key material input to PET production and is produced
by oxidizing PX (para-xylene). Indorama Rotterdam produces PTA for its on-site PET
production, as well as PTA that is shipped to other facilities. Indorama Rotterdam has 426 kt
of bottle-grade PET production capacity and 700 kt of PTA production capacity. The processes
at Indorama Rotterdam require electricity, steam and heat which are provided by an on-site
natural gas-fired CHP and natural gas boiler, complemented by grid electricity.

Table S1: Estimated energy consumption and emissions for PET and PTA production.

                                                                          2016 estimate

  Greenhouse gas emissions [ktCO2-eq]                                          125

  Electricity consumption [TJ]                                                 326

  Steam consumption [TJ]                                                       406

  Direct heat consumption [TJ]                                                 730
Source: Greenhouse gas emissions based on reported EU ETS emissions (NEa, n.d.). Energy consumption
estimated based on author calculations for 350kt PTA and 400kt PET capacity with 80% utilization. See Chapter
2 for additional information.

Key decarbonisation options for bottle-grade PET production include:
    • Fuel substitution: Emissions from natural gas combustion can be reduced via fuel
       substitution. Biogas, green gas, electricity, and hydrogen have all been considered.
       Green gas could be directly substituted using existing equipment, while biogas and
       hydrogen would require retrofits. Electrification of the utilities would require the
       replacement of existing equipment and supplemental grid electricity consumption.
    • Energy efficiency: Process substitution could be used to increase the energy
       efficiencies of the technologies which produce bottle-grade PET and PTA. Residual heat,
       particularly from PTA production, can also be recovered and reused to decrease the
       overall energy demand. Mechanical vapour recompression could be used to increase
       the temperature of residual heat, potentially in combination with thermal storage.
    • Material efficiency, material substitution and circularity: Increasing the recycled
       content of bottle-grade PET and using MEG and PX from biomass could help to reduce
       the emissions upstream and downstream in the value chain. Changing the product
       design and using alternative materials could also potentially yield additional emissions
       reductions, both directly in the process and in other parts of the supply chain.

This report describes the current status of the bottle-grade PET production by Indorama in the
Netherlands, and discusses potential decarbonisation options. The estimates and descriptions
in this report are based on publicly available literature and data, and have been reviewed by
Indorama Rotterdam.

                                                                              A MIDDEN report – PBL – TNO | 5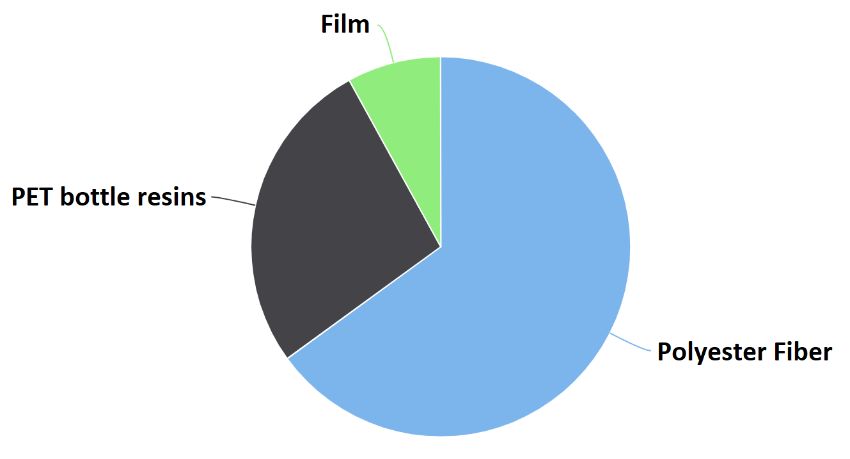
FULL RESULTS

Introduction
The Climate Agreement set out the ambitions to decrease the total CO2 emissions in the
Netherlands by at least 49% in 2030 compared to 1990 levels (Afspraken van het
Klimaatakkoord, 2020). This is in line with the goals set by the Paris agreement: a maximum
increase in average global temperature of 2°C, and preferably limiting global average
temperature rise to 1.5°C. The MIDDEN project – the Manufacturing Industry Decarbonisation
Data Exchange Network – aims to support industry, policy makers, analysts and the energy
sector in their common efforts to achieve deep decarbonisation, by providing data and analysis
on the industrial sector of the Netherlands. This report describes the current situation of the
Dutch bottle-grade PET and PTA sector and the options and conditions for its decarbonisation.

Scope
Production locations
This report describes the current situation for the production activities of Indorama Ventures
Europe B.V. in the Netherlands (henceforth “Indorama Rotterdam”), which is a subsidiary of
Indorama Ventures Public Company Limited (henceforth “IVL”). IVL is active in 31 countries
on five continents, and has a large number of subsidiaries. This report focuses only on
Indorama Rotterdam, located in the Europoort area of the Port of Rotterdam.

Products
Indorama Rotterdam is the largest producer of PTA and bottle-grade PET in the Netherlands.

Processes
The key processes in PTA and bottle-grade PET production are oxidation, crystallization,
separation, drying, solvent recovery, esterification, polymerization, cooling, and chipping.
These are described in Section 2.

The main options for decarbonisation are:
   •   Fuel substitution (biogas, green gas, electricity, or hydrogen)
   •   Energy efficiency
   •   Material efficiency and substitution.

Reading guide
Section 1 introduces the Dutch bottle-grade PET and PTA industry. Section 2 describes the
current situation for PTA and bottle-grade PET production processes in the Netherlands, and
Section 3 describes the relevant products of these processes, while options for decarbonisation
are systematically quantified and evaluated in Section 4. The feasibility and requirements of
those decarbonisation options are discussed in Section 5.

PBL – TNO | 6 – A MIDDEN report
1 Bottle-grade PET and
PTA production in the
Netherlands
1.1 Indorama Ventures Europe B.V.
IVL is a global company which produces a wide range of petrochemical products (Indorama
Ventures, n.d.-f). The head office of IVL is in Bangkok, Thailand, and it operates sites in 31
countries on five continents (Indorama Ventures, n.d.-j). In 2019, IVL’s revenue was USD 11.4
billion (Indorama Ventures, 2021). Indorama Rotterdam, the subsidiary of IVL located in the
Netherlands, produces bottle-grade PET (polyethylene terephthalate) and PTA (purified
terephthalic acid) at a 48.2 hectare site at the Europoort area of the Port of Rotterdam
(Indorama Ventures, n.d.-c; Port of Rotterdam, 2016). PTA is used as a precursor for
bottle-grade PET.
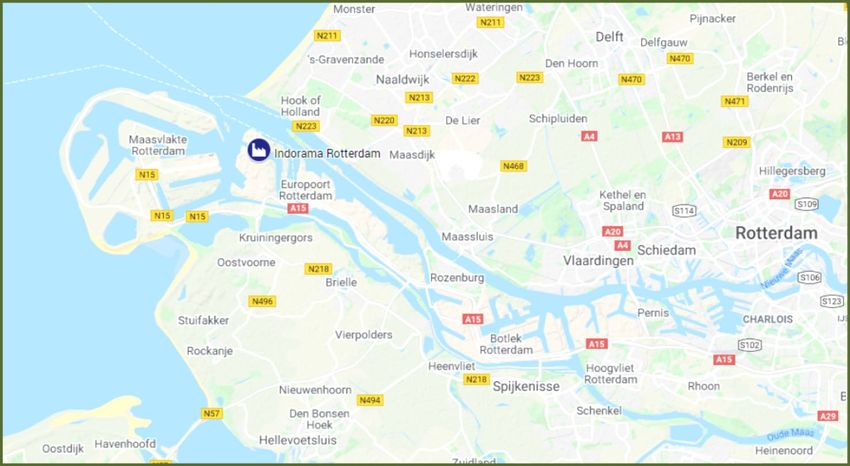
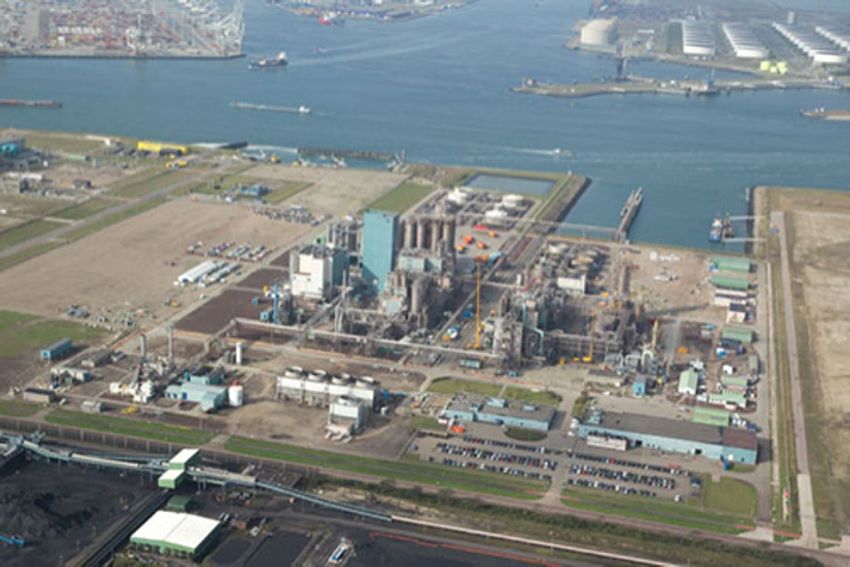
Figure 1. The location (bottom) and photo of (top) of Indorama Rotterdam.
Sources: Indorama Ventures (n.d.-b) and Port of Rotterdam (2016)
A MIDDEN report – PBL – TNO | 7Indorama Rotterdam is the only producer of bottle-grade PET and PTA in the Netherlands (CPME, n.d.; PDC, 2012). In 2016, Indorama Rotterdam had 230 employees (Port of Rotterdam, 2016). Figure 1 gives the location and a photo of Indorama Rotterdam. Figure 2 shows bottle-grade PET and PTA at standard conditions. Figure 2. Bottle-grade PET (left) and PTA (right) at standard conditions. Sources: Indiamart (n.d.) and Indorama Ventures (n.d.-f) 1.2 History The Indorama Rotterdam site was originally owned by Eastman Chemical, where production of bottle-grade PET and PTA began in 1998 (Sinclair, 1998; De Volkskrant, 1996). The decision to start these manufacturing activities at this location was based on the availability of a highly- skilled workforce, the suitability of raw materials from nearby oil refineries, and the accessibility of the site (De Volkskrant, 1995). Eastman Chemical changed the name of the site to Voridian Europoort B.V. (RVO, 2015; Taylor, 2001). In 1998, a utilities facility, called Europoort Utility Partners, was also built nearby to supply energy for the production activities, as a joint venture of Eneco (50%) and Air Products (50%) (Lukkes, n.d.; Port of Rotterdam, 2007). In 2008, IVL acquired the PTA and PET production facility and continued operating under the name of Indorama Holdings Rotterdam B.V (Indorama Ventures, n.d.-b). In 2010, the utilities were acquired by IVL as well (Indorama Ventures, 2011). The name of the utilities facility then changed to Indorama Ventures Europe utility island (Port of Rotterdam, 2016). The entire site, including the utility island, is now called Indorama Ventures Europe B.V (Indorama Ventures, n.d.-b). 1.3 Local infrastructure The port of Rotterdam has its own energy infrastructure, and Indorama Rotterdam is connected to this network (Figure 3) (Port of Rotterdam, 2019a). Indorama Rotterdam has its own utilities facility on site where steam is generated. Though specific suppliers are unknown, there is capacity in Port of Rotterdam to produce necessary feedstocks and material inputs to bottle-grade PET production, such as para-xylene (PX) at the ExxonMobil Chemical Aromatics Plant, and mono-ethylene glycol (MEG) at Shell Nederland Chemie (Port of Rotterdam, 2016). IVL also owns Wellman Recycling Spijk, a PET recycling facility (Indorama Ventures, n.d.-g). PBL – TNO | 8 – A MIDDEN report
Indorama

Figure 3. Existing energy infrastructure of Port of Rotterdam, in 2019.
Source: Port of Rotterdam (2019a)

Note: The captions translate to: Title: “CURRENT Existing energy infrastructure.” In red: heat, in gray: CO2, in
purple: steam, in yellow: electricity, and in green: hydrogen. “Bestaande leidingen” = existing pipelines.

1.4 Production capacity
Since the start of operations at the site in 1998, its PET and PTA production capacities have
increased several times (Table 1). In 2018, PTA capacity was doubled. PTA produced at the
site is used for bottle-grade PET production in Rotterdam, but also shipped to other PET
producing sites. This report focuses on 2016, as the most recent year when statistics were
available for typical operations. During 2017, the PTA expansion was underway, and at the
time of writing 2018 statistics were incomplete.

Table 1. Annual production capacity of Indorama Rotterdam of PET and PTA.

                     PET capacity            PTA capacity
  Year                                                            Source
                        (kt/y)                  (kt/y)
  1998                      130                   290             Sinclair (1998)

  2010                      200                   350             Port of Rotterdam (2010)

  2012                      390                   350             Murray (2010)

  2016                      400                   350             Port of Rotterdam (2016)

  2018                      426                   700             Indorama Ventures (n.d.-a, n.d.-b)
                                                                  Popovic (2017)

The utilities facility contains a natural gas CHP installation (GE LM2500 gas turbine) with
electrical capacity of 23.7 MWe, and an auxiliary natural gas boiler (EEA, 2019; General
Electric, n.d.) with a capacity of 65 tonnes of 40 bar steam per hour. Other on-site utilities
include cooling towers, a waste gas expander, two air compressors, and a water
demineralizer.

                                                                                 A MIDDEN report – PBL – TNO | 9
1.5 Greenhouse gas emissions
Indorama Rotterdam is a large producer of PET and PTA, both fossil fuel-intensive processes
that produce large amounts of CO2 emissions. Figure 4 shows reported direct CO2 emissions
from the site, from 2005 to 2020, from the Dutch Emissions Authority database (NEa, n.d.).
Though throughout this period the CO2 emissions were reported under three institutional
names (Europoort Utility Partners V.O.F., Indorama Holdings Rotterdam B.V., and Indorama
Ventures Europe B.V.), the emissions were always reported with the same permit number.
Because of changes in capacity and maintenance-related shutdowns, this report uses 2016 as
a representative base year (Polyestertime, 2018; S&P Global, 2019).
180
160
140
120
ktCO2-eq
100
80
60
40
20
0
2005 2006 2007 2008 2009 2010 2011 2012 2013 2014 2015 2016 2017 2018 2019 2020
Europoort Utility Partners V.O.F. Indorama Holdings Rotterdam B.V.
Indorama Ventures Europe B.V.
Figure 4. Greenhouse gas emissions from 2005 to 2020.
Source: NEa (n.d.)
Note: Permit number NL-200400249.
PBL – TNO | 10 – A MIDDEN report2 Bottle-grade PET
and PTA processes
2.1 Bottle-grade PET value chain
The PET value chain starts with crude oil (Levi & Cullen, 2018). Ethylene, PX (para-xylene),
and MX (meta-xylene) are produced via refining and steam cracking. These three commodities
are processed into MEG (mono-ethylene glycol), PTA and PIA (purified isophthalic acid),
respectively. These three precursors are then used in the production of bottle-grade PET. The
upstream value chain for non-fiber PET (including bottle-grade PET) is shown in Figure 5,
including the global annual production in 2013 of the relevant commodities in million tonnes
per year (Mt/y). 33% 1 of the global PET production was non-fiber in 2013. The category of
non-fiber PET is mostly made up of bottle-grade PET (around 77% in 2016) (Plastics Insight,
n.d.-a). Bottle-grade PET is transported to packaging manufacturers for further processing. At
the end of product lifetimes, PET is either recycled or discarded as waste (typically incinerated).
Figure 5. The non-fiber PET value chain.
Source: Levi & Cullen (2018)
2.2 Technical description of bottle-grade PET
PET, or polyethylene terephthalate, is a polymer made of chains of the monomer ethylene
terephthalate (CPME, 2017). This monomer is produced by the bonding of two chemicals: PTA
and MEG. A polymer is a large chain of a repeating chemical structure. Ethylene terephthalate
is an ester, which means PET fits the scientific definition of a “polyester”. However, the term
polyester often colloquially refers to fiber-grade PET (commonly used in the textile industry).
In this report, for clarity, we will refer to PET, bottle-grade PET, and fiber-grade PET, rather
than polyester.
One of the most important characteristics of PET is its intrinsic viscosity (IV), which depends
on the number of monomers that make up each polymer (Thiele, 2007). The IV of PET can be
1
This only includes PET which is produced by the PTA route, which is used for about 98% of PET production.
A MIDDEN report – PBL – TNO | 11estimated using the Billmeyer equation, based on the dilution into a solvent (Farah, Kunduru,
Basu, & Domb, 2015), and is measured in units of deciliters per gram (dL/g). This is the inverse
of polymer solution concentration. Intrinsic viscosity varies depending on the PET product; the
manufacturer is able to control the IV by prolonging or shortening the polymerization process,
to give the final product the desired properties. PET with high intrinsic viscosity has polymers
with long chains of monomers, which makes the molecular weight of the polymer high, and
increases the rigidity of the PET. PET with shorter chains of monomers has the opposite
characteristics: lower molecular weight and more flexibility. Bottle-grade PET requires PET
polymers with relatively long chains of monomers. The other two grades of PET, fiber- and
film-grade PET, require smaller numbers of monomers. Table 2 shows the typical IV and
product examples for each of these three grades.
Table 2. The typical intrinsic viscosities of the three main classifications of PET
PET classification IV (dL/g) Product examples
Fiber-grade 0.40 - 0.70 Textile
Film-grade 0.60 - 0.70 BoPET (biaxially oriented PET film) (for example,
used for flexible food packaging, paper coating,
insulation)
Bottle-grade 0.70 - 0.85 Water bottles (IV: 0.70 - 0.78)
Carbonated soft drink bottles (IV: 0.78 - 0.85)
Source: Gupta, & Bashir (2002)
Indorama Rotterdam specializes in the production of bottle-grade PET, with the highest IV. For
bottle-grade PET, 2% of the PET mass is made up of PIA, or isophthalic acid, which is an
isomer 2 of PTA (European Commission, 2016a).
2.3 PTA production processes at Indorama Rotterdam
PTA, or purified terephthalic acid, is a precursor of bottle-grade PET. PTA is produced by
oxidizing PX, or para-xylene (CPME, 2016). Several processes for PTA production exist; a
diagram of the Eastman process is shown in Figure 6 (Zein et al., 2010). Crude terephthalic
acid (CTA) is an intermediate product in the production of PTA. Oxidizing para-xylene (PX) into
PTA has a conversion factor of 98.3%. Indorama Rotterdam requires PTA with a minimum
purity of 99.9% (Indorama Ventures, 2017a), which they achieve through the post-oxidation
sub-process, which removes impurities and continues the oxidation process.
Indorama Rotterdam uses equipment supplied by GPT to produce PTA (GPT, n.d.; Indorama
Ventures, n.d.-b), based on the Eastman process. The process is described by the mass flow
and energy flow diagrams below (Figures 6 and 7).
2
An isomer is a molecule with an identical chemical formula but a different spatial arrangement of atoms.
PBL – TNO | 12 – A MIDDEN reportFigure 6. Mass flow diagram for 1 kg of PTA.
Source: Engineering ToolBox (2003a); Zein et al. (2010)
Note: The mass of air consists 23.14% of oxygen (Engineering ToolBox, 2003a).
Figure 7. Energy flow diagram for 1 kg of PTA.
Sources: Cao, Chang, & Kaufman (2011); Neelis, Patel, Blok, Haije, & Bach (2007)
Note: The figure above shows author estimates based on publicly available literature. The value for residual
heat is from Neelis et al. (2007) and the other values are from Cao et al. (2011). Reliable estimates were not
available at this level of detail, but the full PTA production process requires 0.346 GJ electricity/t PTA and 0.981
GJ steam/t PTA (See Table 3).
1. Oxidation
First, the PX (liquid) is oxidized into CTA (Cao et al., 2011; CPME, 2016). A mixture
of PX, acetic acid (solvent), catalyst and compressed air is put into a bubble column
reactor in liquid phase at a high temperature (175 - 225 °C) and pressure (15 - 30
bar). The high pressure is needed to keep PX in a liquid state. The conversion of PX
into PTA has a yield of 98.3%, and the remaining 1.7% consists of unconverted PX
and impurities (Zein et al., 2010). The oxidation reaction produces water (Figure 8).
The partial burning of acetic acid causes acetic acid losses and CO2 emissions. The
oxygen needed for the reaction is supplied as compressed air. This process is
exothermic so no additional heat is required, but some electricity is used for pumps
and blowers.
Figure 8. Chemical reaction: PX and oxygen react to form PTA and water.
Source: MCPI (2018)
A MIDDEN report – PBL – TNO | 132. Post-Oxidation
To guarantee that the PTA has a high purity, the post-oxidation sub-process is used to
remove impurities and to continue with the oxidation process. Post-oxidation increases
the yield from 98.3% to 98.9% (Zein et al., 2010). The remaining PX is removed via
digestion so that the PTA at least has a purity of 99.9%. Post-oxidation requires steam
to reach the required temperature for oxidation and electricity for pumps and blowers.
3. Crystallization
The resulting PTA is still dissolved in acetic acid and water. To produce solid PTA
crystals, a crystallizer is used (Zein et al., 2010). The crystallizer separates water and
acetic acid from the system, and at the same time forms solid PTA crystals (Skindzier,
Kaplan, & Roberts, n.d.). The acetic acid and water continue to the solvent recovery
sub-process. The crystallizer requires steam for heating and electricity for pumps and
blowers.
4. Separation
By using a vacuum flash drum and a rotary vacuum filter, most of the remaining acetic
acid and water is separated and sent to the solvent recovery step (Zein et al., 2010).
Separation equipment requires electricity.
5. Drying
The solid PTA is completely dried into a powder. The dryer uses steam to heat air and
electricity to circulate that air.
6. Solvent Recovery
The acetic acid is recovered by distilling it out of a solution (Cao et al., 2011). Solvent
recovery is crucial for decreasing the costs of producing PTA, as recovered acetic acid
can be reused. Solvent recovery is relatively energy-intensive, requiring steam for
distillation and electricity for pumps and blowers.
2.4 PET production processes at Indorama Rotterdam
The production of bottle-grade PET happens in two distinct stages. The first stage is melt
polymerization, in a liquid state (Ma, 2005). Indorama Rotterdam uses technology from GPT
and INVISTA for the melt polymerization stage (Indorama Ventures, n.d.-a; INVISTA, n.d.).
Melt polymerization produces amorphous polyethylene terephthalate (A-PET), with IVs of 0.6
dL/g or lower (Ma, 2005). The second stage is solid state polymerization, which increases the
IV of the PET product to around 0.8 dL/g in a solid state (Papaspyrides, & Vouyiouka, 2009).
In addition to electricity and steam, heat transfer oil is also heated with two natural gas thermal
oil heaters to provide heat for the process. Each thermal oil heater has an output of 14 MWth,
but they have different efficiencies: 92% and 107% (LHV basis). The PET production process
is described by the mass flow and energy flow diagrams below (Figures 9 and 10).
Figure 9. Mass flow diagram for 1 kg of bottle-grade PET.
Sources: European Commission (2016a) and Santhana Gopala Krishnan, & Kulkarni (2008)
Note: The figure above shows author estimates based on publicly available literature.
PBL – TNO | 14 – A MIDDEN reportFigure 10. Energy flow diagram for 1 kg of bottle-grade PET.
Sources: CPME (2017), Papaspyrides, & Vouyiouka (2009) and Port of Rotterdam (2016)
Note: The figure above shows author estimates based on publicly available literature. The grey values are
approximations, which were calculated by dividing the total energy [0.72 GJ electricity/t PET and 0.43 GJ
steam/t PET] over the sub-processes proportionally to the residence time and temperature differential.
The overall chemical equation of PET production is shown by Figure 11. For bottle-grade PET,
the number of monomers per chain (n) in this equation is typically between 100 and 200
(CPME, 2017). The chemical process of the bonding of PTA and MEG into PET is called a
polycondensation reaction, because of the condensation of water that occurs.
Figure 11. Chemical equation: n units of PTA reacts with n units of MEG to produce
PET with n ethylene terephthalate monomers and water.
1. Mixing
First, PTA, MEG and PIA are mixed together into a paste (slurry mixture). The molar
ratio of PTA+PIA to MEG is 1:1.15 (Santhana Gopala Krishnan, & Kulkarni, 2008). An
excess of MEG is needed to optimize the reaction rate. Electricity is required for mixing.
2. Esterification
The next step is the production of pre-PET 1 (with very low IV) through the bonding
of PTA, MEG and PIA into esters (ChemistryScore, n.d.). This process produces water
and MEG as a by-product, and the resulting MEG is reused in the mixing sub-process.
The chemical process to produce pre-PET 1 is done at standard pressure and at a high
temperature (about 280 °C), in the presence of an antimony catalyst (CPME, 2017;
INVISTA, n.d.; Köpnick, Schmidt, Brügging, Rüter, & Kaminsky, 2000). Water and MEG
are removed throughout the whole PET production process to optimize the reaction
rate. The residence time for esterification is about five hours and requires heat
(provided via natural gas burners).
3. Pre-polymerization + 4. Melt Polymerization
The pre-PET 1 is pre-polymerized in a vacuum, increasing its IV to produce pre-PET 2.
As the IV of the PET product increases, pre-PET 2 is fed into a disk-shaped reactor
(still in a vacuum), which optimizes the removal of water and MEG because of the
increased surface area (Ma, 2005). Melt polymerization produces A-PET with an IV of
about 0.6 dL/g. The third and fourth sub-processes are assumed to be operating at
A MIDDEN report – PBL – TNO | 15about 300 °C (INVISTA, n.d.), with a combined residence time of about five hours.
Heat (from natural gas burners) and electricity are required to create vacuum
conditions.
5. Cooling
The A-PET is then brought into contact with cooling water, solidifying it into long
strands of about 2.5 mm thickness (Indorama Ventures, 2017b; UL Prospector, n.d.-
a). Cooling requires electricity.
6. Chipping
The strands of A-PET are chipped into solid and cubical PET pellets (Indorama
Ventures, 2017b; UL Prospector, n.d.-a). These pellets have reached fiber-grade PET
quality. Chipping requires electricity.
7. Pre-crystallization and drying
The solid A-PET pellets are exposed to a hot nitrogen stream (185 °C, heated with
steam) (Indorama Ventures, 2017b; Papaspyrides, & Vouyiouka, 2009). The PET
crystallizes, into opaque white pellets, in about one hour. In this sub-process, as well
as the crystallization and polymerization sub-processes, nitrogen is used instead of air
to prevent oxidation by atmospheric oxygen (Köpnick et al., 2000).
8. Crystallization
This sub-process is also done with exposure to a hot nitrogen stream (210 - 220 °C,
heated with steam) (Papaspyrides, & Vouyiouka, 2009), with about one hour residence
time.
9. Solid-state polymerization
Solid state polymerization (SSP) increases the IV to the desired level for the final
product, again by applying a hot nitrogen stream (205 - 215 °C, heated with steam)
(Papaspyrides, & Vouyiouka, 2009). Solid state polymerization takes a relatively long
time, about 15 hours. At the end of this sub-process, the pellets have the properties
of bottle-grade PET, which has an IV of about 0.8 dL/g.
10. Cooling
The bottle-grade PET pellets are cooled by blowing (non-heated) nitrogen over them
(Indorama Ventures, 2017b). The final product at Indorama Rotterdam is an opaque,
white, cylindrical 2.5mm pellet.
2.5 Utilities at Indorama Rotterdam
Most of Indorama’s energy requirements for the production of PTA and bottle-grade PET comes
from on-site utilities (Kreijkes, 2017; Port of Rotterdam, 2016). Indorama Rotterdam has a
natural gas CHP installation (GE LM2500 gas turbine) with 23.7 MWe capacity, and an auxiliary
natural gas boiler with a capacity of 65 tonnes per hour of 40 bar steam (EEA, 2019; General
Electric, n.d.). The CHP unit has a total efficiency of 81% and an electrical efficiency of 33%.
Indorama Rotterdam uses the auxiliary boiler if additional steam is needed beyond the CHP
unit output. The process steam demand can also be fully met by the auxiliary boiler, which has
a capacity of 49.9 MWth and an efficiency of about 92%. Depending on gas and electricity
prices, Indorama Rotterdam can choose to operate the CHP unit, the auxiliary boiler or both
(in combination with grid electricity).
2.6 Energy consumption and emissions
The consumption of useful energy for the production of 1 kg PTA and 1 kg bottle-grade PET is
shown in Table 3.
PBL – TNO | 16 – A MIDDEN reportTable 3. Useful energy for the production of 1 kg PTA and 1 kg bottle-grade PET.
Electricity Steam Fuel Total
Product
(MJ) (MJ) (MJ) (MJ)
PTA 0.346 0.981 0.000 1.327
PET 0.720 0.430 2.208 3.358
Sources: CPME (2017), Port of Rotterdam (2016) and Zein et al. (2010)
There are four main sources of CO2 emissions in this process. Table 4 shows estimated direct
CO2 emissions for 2016. The relative shares of each source vary from year to year, depending
on production levels and operation of utilities.
Table 4. Sources of CO2 emissions in 2016.
Emissions Fraction
Emissions source
(ktCO2-eq) (%)
Natural gas CHP 26.4 21
Natural gas boiler 35.2 28
Natural gas thermal oil heater 40.3 32
Acetic acid burning 23.1 19
2016 Total 125.0 100
Sources: CBS (2020), CPME (2016), EEA (2019), NEa (n.d.) and RVO (2019)
The water input for the production of 1 kg PTA and 1 kg bottle-grade PET is shown in Table 5.
Because PTA production is exothermic, a large supply of cooling water is needed. This water
is drawn from the canals around Indorama Rotterdam, and cooling towers are used to circulate
the water.
Table 5. Water input for the production of 1 kg PTA and 1 kg bottle-grade PET
(includes on-site utilities).
Process water Cooling water Total
Product
(kg) (kg) (kg)
PTA - 251.0 251.0
PET 0.5 9.6 10.1
Sources: CPME (2017) and Zein et al. (2010)
A MIDDEN report – PBL – TNO | 173 Bottle-grade PET
and PTA products
and applications
3.1 IVL products in the Netherlands
IVL groups its products in six product families: feedstock, PET, packaging, fibers, recycling,
and wool (Indorama Ventures, n.d.-g). IVL has two subsidiaries in Netherlands: Indorama
Ventures Europe B.V. (Indorama Rotterdam) (Indorama Ventures, n.d.-a) and Wellman
Recycling Spijk (Indorama Ventures, n.d.-g). Indorama Rotterdam produces more PTA than is
required for its production of PET, and the surplus is used to supply its other subsidiaries within
Europe, such as IVL’s facilities in Germany and Lithuania (Indorama Ventures, n.d.-b, n.d.-d,
n.d.-e).
Wellman Recycling Spijk, IVL’s other subsidiary in the Netherlands, produces recycled PET
(rPET) flakes. This product is made by washing and chipping post-consumer PET into small
flakes (Wellman International, n.d.). These rPET flakes are shipped to Wellman International
Ireland to be processed into fiber-grade PET. This production process is not the focus of this
report and thus will not be discussed in more detail.
Table 6. Products of IVL in the Netherlands.
Product family Product Group Products Specification Application Location
Feedstock PTA PTA - PET Rotterdam
PET Bottle/Sheet RAMAPET IV = 0.80 General, non- Rotterdam
N180 reheat
PET Bottle/Sheet RAMAPET IV = 0.80 General, reheat Rotterdam
R180
PET Bottle/Sheet RAMAPET IV = 0.82 Carbonated soft Rotterdam
R182 (C) drinks, high-
reheat
PET Bottle/Sheet RAMAPET IV = 0.84 Thick-walled Rotterdam
P184 products
PET Other/Specialties RAMAPET IV = 0.82 Carbonated soft Rotterdam
R182 (C) drinks, fast-reheat
Recycling Flake RM 7007FS 1250 ppm Fiber, food-contact Spijk
rPET colored flakes
Recycling Flake RM 7004 2000 ppm Fiber, food-contact Spijk
rPET colored flakes
Source: Indorama Ventures (n.d.-c)
PBL – TNO | 18 – A MIDDEN reportAll the PET produced by Indorama Rotterdam is bottle-grade, but within this grade Indorama
Rotterdam produces five types of bottle-grade PET, differentiated by application and IV. IVL
calls its PET products RAMAPET, which is a brand name. The “R” in some product names stands
for the presence of a reheat additive, which is used for increasing its heat absorption (PolyOne,
n.d.). The “N” in product means the opposite: it does not contain reheat additive. “P” is used
for a special type of RAMAPET used for thick-walled products. If a product name contains a
“(C)” at the end, then it has properties which are especially suitable for carbonated soft drinks
(CSD). The two types of RAMAPET R182 (C) have different applications: one is used for bottles
or sheets and can be heated to a high temperature, while the other is used for specialties and
can be quickly heated. The two types of rPET flakes which are made at Wellman Recycling
Spijk are differentiated by the concentration of colored flakes. This differentiation is important
for the quality of the products which are made from these flakes.
IVL describes RAMAPET N180 as a general purpose, non-reheat PET resin for bottles, with an
IV between 0.78 and 0.82 dL/g (Indorama Ventures, n.d.-h; UL Prospector, n.d.-a). RAMAPET
N180 consists of cubical pellets with 2.5mm sides, and has the following applications for
carbonated soft drinks, other beverage bottles, household products, food packaging,
thermoformed containers, and pharmaceutical and medical applications.
RAMAPET R180 is very similar to RAMAPET N180, but it is typically used for thermoformed
containers. It contains a moderate level of reheat additive, allowing the molding of more
complicated shapes and an efficient molding of light-weighted designs (Omnexus, n.d.-a; UL
Prospector, n.d.-b). Reheat additive makes the product more able to absorb heat, which makes
the energy consumption for PET pellet processing up to 30% lower compared to non-reheat
PET (PolyOne, n.d.), without changing its appearance. RAMAPET R180 can also be used for
film.
RAMAPET R182 (C) can be used for the same applications as above, except pharmaceutical
and medical applications (Omnexus, n.d.-b). It contains a high level of reheat additive. Its IV
is between 0.80 and 0.84 dL/g, which makes these bottle-grade PET pellets more rigid than
RAMAPET N180 and RAMAPET R180.
RAMAPET P184 is a slowly crystallizing, non-reheat PET resin for thick-walled applications that
require optimal transparency, with an IV between 0.82 and 0.86 dL/g (Indorama Ventures,
n.d.-i; UL Prospector, n.d.-c). RAMAPET P184 is the least flexible bottle-grade PET produced
by Indorama Rotterdam. It has applications for refillable bottles, large (10 to 20 liter)
containers, thick-walled jars, and thermoformed containers.
3.2 Bottle-grade PET and PTA market
About 99% of global PTA production is used for the production of PET (Levi, & Cullen, 2018),
but there are other products which can be made from PTA, such as polybutylene terephthalate
(PBT) (Plastics Insight, n.d.-a). According to HDIN Research, IVL was in 2018 the world’s fifth
largest PTA producer, with roughly 5% of global production capacity. 3 Chinese companies have
been rapidly building PTA capacity in recent years, with some analysts forecasting a global
overcapacity as these Chinese plants capacities outpace global demand for PTA and PET
production capacities. Plant size has increased in recent years as well, with Zhongtai
Petrochemical building a 1.2 Mt/year plant, and Hengli Petrochemical building a 2.5 Mt/year
plant. China’s total PTA capacity was expected to reach nearly 70 Mt per year by the end of
2020 (Bork 2020).
3
The top six producers are YiSheng, Hengli Petrochemical, Xianglu Petrochemical, Reliance Industries,
Indorama, and BP (HDIN Research 2019).
A MIDDEN report – PBL – TNO | 19IVL has the world’s largest production capacity of bottle-grade PET (Indorama, n.d.-f). Its capacity reached 4200 kt capacity globally in 2017 (Figure 13) (Plastics Insight, n.d.-b). Indorama Rotterdam accounted for around 10% of IVL’s worldwide bottle-grade PET production. According to Indorama, 1 in 5 PET bottles in produced globally is made from Indorama’s resins (Indorama, n.d.-f). The markets for both PET and PTA change rapidly, and up-to-date publicly available information on capacities and production levels are limited. PTA prices are heavily dependent on the price of feedstocks, including PX and MEG, which are both produced from oil (top graph in Figure 14) (ICIS, 2018). The bottle-grade PET price is volatile and also follows the prices of its precursors, MEG and PX (bottom graph in Figure 14) (Murray, 2018). Bottle-grade PET prices in Europe fell from almost 1,400 EUR/tonne in early 2012 to a low of about 850 EUR/tonne in 2016, as paraxylene and MEG prices also dropped considerably. From 2016 to 2018, bottle-grade PET prices in Europe recovered to almost their 2012 levels, following the general trend of crude oil prices during that period. PTA prices, similarly, increased through 2018, reaching a maximum of nearly 70 USD/tonne (over 80 EUR/tonne). Figure 12. Top: The price curves of MEG, PX, PTA and crude oil, November 2017 to September 2018. Bottom: The price curves of MEG, PX and bottle-grade PET, 2012 to 2018. Sources: ICIS (2018) and Murray (2018) PBL – TNO | 20 – A MIDDEN report
3.3 Applications of PTA
PTA has three main applications (Figure 15) (PlasticsInsight, n.d.-a). About 65% of the PTA
was used for “Polyester Fiber” (made from fiber-grade PET), which is by far the largest of the
three. “PET bottle resins” (made from bottle-grade PET) had a market share of 27%. The
remaining 8% was filled by “Film” (made from film-grade PET). Fiber-grade PET is colloquially
often called polyester 4, and is mainly used for textile production. Film-grade PET is used for
the manufacturing of packaging films.

Figure 13. Applications of PTA in 2016.
Source: Plastics Insight (n.d.-a)

3.4 Applications of bottle-grade PET
Bottle-grade PET is used for many types of containers, mostly for the bottling of beverages
(Figure 16) (Plastics Insight, n.d.-b). The figure depicts that in 2016 the markets for bottled
water, carbonated soft drinks (CSD) and other drinks were responsible for 71% of the global
bottle-grade PET consumption. The 14% used for sheet & film can be attributed to the
application of bottle-grade PET in the thermoforming industry (Helmke, 2014), which presses
PET sheets into the desired shape by using hot molds. Some packaging film types require the
properties of bottle-grade PET.

Figure 14. Applications of bottle-grade PET in 2016.
Source: Plastics Insight (n.d.-b)

Note: CSD = carbonated soft drinks

4
    Polyester as a chemical term can refer to many products, so this is called fiber-grade PET in this report.

                                                                                 A MIDDEN report – PBL – TNO | 21
After manufacturing, bottle-grade PET pellets are processed further by being melted and
shaped into packaging products. During transport, the pellets absorb moisture from the
environment (Indorama Ventures, n.d.-h). As moisture has a negative effect on the IV of PET
during its melt processing, the PET pellets have to be dried again before they can be processed
into containers. Manufacturing of PET bottles happens in two steps. First, the PET pellets are
melted into pre-forms, which look like test tubes. The second step is called stretch blowing, in
which the cylindrical preforms are re-heated and air is blown into them to create the desired
shapes.
PET plastic has become one of the most widely used packaging materials due to several key
advantages (Coca-Cola Nederland, 2017; ING, 2019): PET plastic is lightweight, flexible, and
inexpensive to produce. This makes it convenient for transport, versatile, durable, and cost-
efficient. However, PET plastics also has significant environmental impacts related to end-of-
lifetime disposal of products made from PET. Low degradability means it can remain in the
environment for thousands of years, if not recycled or incinerated, and can end up in the
oceans where it is harmful to marine life. Recycling PET plastic can reduce the associated
natural resource consumption and greenhouse gas emissions, but the share of PET that is not
recycled remains high, and degradation of quality in the recycling process is a challenge. While
public awareness of the environmental problems of plastic pollution has increasingly led to
negative public opinion with respect to single-use plastic products, they remain ubiquitous.
At the end of product lifetimes, PET plastic is often not differentiated from the other plastic
types. The European demand distribution of the different plastic types in 2017 is shown in
Figure 17. In practice, different plastic types are often mixed in the same waste streams, which
is problematic for recycling because of the cost and difficulty of separation. In the Netherlands
and nine other European countries, landfilling of recyclable waste is restricted, which has led
to a relatively high overall plastic packaging recycling rate, close to 50% in the Netherlands in
2016 (including PET and other plastic packaging), compared to an EU average of about 41%.
The recycling rate in the Netherlands for post-consumer plastic packaging waste was lower,
about 37%. (PlasticsEurope, 2018).
PE (polyethylene)
PP (polypropylene)
19%
30% PVC (polyvinyl chloride)
7%
PUR (polyurethane)
7%
8% 19%
PET (polyethylene terephthalate)
10%
PS (polystyrene)
Others
Figure 15. European plastic demand distribution in 2017.
Source: PlasticsEurope (2018)
PBL – TNO | 22 – A MIDDEN report4 Options for
decarbonisation
4.1 Fuel substitution
Within the site boundaries, Indorama uses natural gas and grid electricity for the production
of bottle-grade PET and PTA. Natural gas use is the main source of Indorama Rotterdam’s
direct emissions from fuel combustion. In 2016, 81% of their CO2 emissions were from natural
gas combustion (Table 4). Reducing natural gas use by switching fuels could therefore
potentially provide large emissions savings. There are multiple options for decarbonisation via
fuel substitution.
This section focuses on Scope 1 emissions, also called direct emissions, which are emitted on
site. Scope 1 emissions include both fuel combustion emissions and process emissions from
chemical reactions. Other sections include decarbonisation options which address Scope 2
emissions (emissions from purchased heat and electricity) and Scope 3 emissions (emissions
from upstream and downstream processes related to the energy and material inputs of the
process, including all other indirect emissions). Scope 3 emissions in particular are difficult to
quantify without a full Life Cycle Assessment (LCA), but can be an important part of the impact
of a product and its value chain. For plastics, for example, end-of-life combustion of products,
which falls into Scope 3, is important.
4.1.1 Biogas
Biogas, produced via anaerobic digestion of biodegradable materials, can be used to replace
natural gas. This is commonly produced from municipal solid waste, municipal waste water,
crop residues, and animal manure. The net calorific value of biogas, about 23 MJ/Nm3,
depending on the source (SGC, 2012), is lower than that of natural gas (31.65 MJ/Nm3) (RVO,
2019), which means that the biogas input rate needs to be about 38% higher to keep the
same capacity. The most abundant components of biogas are methane (40-75 vol%) and
carbon dioxide (15-60 vol%) (Bharathiraja et al., 2018). The composition of biogas is highly
variable depending on the feedstock material and process. Hydrogen sulfide (H2S) and
moisture must be removed from the biogas, because they can corrode equipment (Van Dorp,
2013). The purification process requires additional equipment.
Retrofits to combustion equipment would also be necessary; existing burners would need to
be replaced with biogas burners (Alm, Falk, Nightingale, & Zehr, 2011). To keep the same
capacities, these burners have higher input rates than the original natural gas input rates.
Tables 7, 8 and 9 give the economic data of replacing natural gas with biogas. Under EU ETS,
biogas, and other biogenic energy carriers, are assumed to be net carbon neutral over their
lifetimes. Although biogas technology is mature, the availability of low-cost biogas is a limiting
factor to the implementation of this option. IEA’s cost curve for global biogas supply in 2018
estimated that about 25 EJ (600 Mtoe) of biogas could be sustainably produced, with costs
ranging from just above 2 EUR/GJ to about 26 EUR/GJ. The estimated potential would grow
by 50% by 2050, with an average cost below 12 EUR/GJ 5 (IEA, 2020). Costs are highly
dependent on technology choice, type of biomass, and availability of the biomass resources.
5
Costs have been converted from USD to EUR2017 on the basis of a 2017 average exchange rate of 1.1297.
A MIDDEN report – PBL – TNO | 23Today, about 14 PJ of biogas are produced in Netherlands, mainly via anaerobic digestion of
agricultural waste and manure, with smaller shares from landfill gas recovery and sewage
sludge (Scarlat et al., 2018). European biogas production costs are around 17 EUR/GJ, on
average (IEA, 2020). This domestic production is insufficient for all potential applications of
biogas, and future growth in supply and demand is uncertain. Competitiveness of biogas for
this purpose will depend on future prices of different possible fuels and demand for biogas in
other parts of the economy.
Table 7. Biogas purification plant, economic data 6.
Characteristics Value Source
Fuel Electricity Bailon Allegue, & Hinge
(2014); Kvist (2011)
Avoided CO2 Not applicable: decarbonisation
occurs in combustion in the thermal
oil heaters and boiler
Capacity 200 – 2,000 m3/hour Bailon Allegue, & Hinge
(purified biogas from raw biogas) (2014); Kvist (2011)
Efficiency 100%
Lifetime 15 years Bailon Allegue, & Hinge
(2014); Kvist (2011)
CAPEX 134 – 595 EUR2017/(m3/hour) Bailon Allegue, & Hinge
(2014); Kvist (2011)
Fixed OPEX 3 – 30 EUR2017/(m3/hour)/year Assumed 2-5% of CAPEX
TRL 9
Market entry Present
Table 8. Retrofitting a biogas burner to the boiler, economic data.
Characteristics Value Source
Base year 2016
Fuel Purified biogas
Avoided CO2 35.2 kt (28% of 2016 level) See Table 4
Capacity 300 – 1,200 kWth (burner output) Heattec (n.d.)
Efficiency 80 – 85% Alm et al. (2011)
Lifetime 25 years
CAPEX 13 – 55 EUR2017/kWth Alm et al. (2011); Heattec
(biogas burner, steam output) (n.d.); Van Berkel, &
Hernandez (2018)
Fixed OPEX 0.3 – 2.7 EUR2017/kWth/year Assumed 2-5% of CAPEX
(biogas burner, steam output)
TRL 9
Market entry Present
6
All cost data in this chapter is expressed in EUR2017.
PBL – TNO | 24 – A MIDDEN reportTable 9. Retrofitting a biogas burner to the two thermal oil heaters, economic data.
Characteristics Value Source
Base year 2016
Fuel Purified biogas
Avoided CO2 40.3 kt (32% of 2016 level) See Table 4
Capacity 300 – 1,200 kWth (burner output) Heattec (n.d.)
Efficiency 87 – 91% Pirobloc (n.d.-a)
Lifetime 25 years
CAPEX 12 – 50 EUR2017/kWth Heattec (n.d.); Pirobloc
(biogas burner, heat output) (n.d.-a); Van Berkel, &
Hernandez (2018)
Fixed OPEX 0.2 – 2.5 EUR2017/kWth/year Assumed 2-5% of
(biogas burner, heat output) CAPEX
TRL 9
Market entry Present
4.1.2 Green gas
Biogas can be upgraded to green gas, also called biomethane, by removing the CO2, hydrogen
sulfide (H2S) and moisture (Van Dorp, 2013). Green gas, or biomethane, has similar properties
and composition to natural gas, and thus could be used to replace natural gas directly, without
retrofits to the CHP, boiler and thermal oil heater. Natural gas which has 100% CO2
compensation is also called green gas (Essent, n.d.), but this section refers to upgraded biogas.
The upgrading process requires new equipment to remove CO2. There are different
technologies for the upgrading plant: water scrubbing, amine scrubbing, pressure swing
adsorption, membrane separation and organic physical scrubbing (Danish Energy Agency,
2017). The different technologies have similar investment costs (SGC, 2013). However, the
most commonly applied technology is water scrubbing. After upgrading to green gas, the gas
has nearly the same net calorific value as natural gas. Further upgrading and purification could
be used to reach H-gas quality (high calorific gas); alternatively, burner operation parameters
could be adjusted to allow combustion of L-gas (low calorific gas) quality upgraded biogas.
There may be an impact on efficiency of existing equipment. The existing utilities of Indorama
Rotterdam, such as the CHP and the auxiliary boiler, could be operated with green gas.
Green gas could potentially also be transported to the site with the existing natural gas
infrastructure; this would not be possible with biogas because it has different properties.
Currently, the availability of green gas in the Netherlands is low, and it is not available for
Indorama Rotterdam to purchase it via the existing gas pipelines (HIER, 2017).
Table 10 considers biogas purchase and an on-site upgrading plant. Although green gas
technology is mature, the availability of biomass or biogas could be a constraint in the future.
A MIDDEN report – PBL – TNO | 25Table 10. Biogas upgrading plant, economic data.
Characteristics Value Source
Base year 2016
Fuel Electricity Sun et al. (2015)
Avoided CO2 Not applicable: decarbonisation
occurs in combustion in utilities
Capacity 100 – 2,000 Nm3/hour (creating SGC (2013)
green gas from raw biogas)
Efficiency 95 – 97% Sun et al. (2015)
Lifetime 20 years Lorenzi, Gorgoroni, Silva,
& Santarelli (2019)
CAPEX 1,529 – 5,607 EUR2017/(Nm3/hour) SGC (2013)
Fixed OPEX 31 – 280 EUR2017/(Nm3/hour)/year Assumed 2-5% of CAPEX
Variable OPEX 4 – 19 EUR2017/GJ IRENA (2017)
(import of raw biogas)
TRL 9
Market entry Present
4.1.3 Electricity
Currently both steam and oil are used as heat transfer agents at Indorama Rotterdam, and
they both can be heated with electricity instead of natural gas. An electric boiler could replace
the natural gas boiler (VNP, 2018), while an electric thermal oil heater could replace the natural
gas thermal oil heater (Pirobloc, n.d.-b). Both technologies use the resistance of an electric
component to generate heat, and are commercially available. While electric thermal fluid
heaters are commercially available, no data was available to make a techno-economic
comparison to the conventional technology. Table 11 summarize the techno-economic data for
an electric boiler.
Switching to electrified heat generation would require an increase in Indorama’s purchase of
electricity from the grid. At a system level, such a switch could have an impact on total
greenhouse gas emissions, depending on the emissions intensity of electricity in the grid, and
the effects of the increased demand on grid operations. Scope 2 emissions (from purchased
electricity, heat, steam, or cooling) should be considered from a system perspective, though
the table below considers only Scope 1 emissions (from on-site fuel combustion and
processes).
PBL – TNO | 26 – A MIDDEN reportTable 11. Electric boiler, economic data.
Characteristics Value Source
Base year 2016
Fuel Electricity (green, grid)
Avoided CO2 35.2 kt (28% of 2016 level) See Table 4
Capacity 0.6 – 74 MWth Berenschot, Energy
(steam output) Matters, CE Delft, &
Industrial Energy Experts
(2017); Marsidi (2019);
Thermona (2010); Weil-
McLain (2016)
Efficiency 95 – 100% Thermona (2010); Weil-
McLain (2016)
Lifetime 10 – 15 years Berenschot, CE Delft, &
ISPT (2015); VNP (2018)
CAPEX 150 – 200 EUR2017/kWth Berenschot, Energy
(including installation, steam Matters, CE Delft, &
output) 7 Industrial Energy Experts
(2017); Thermona (2010);
Weil-McLain (2016)
Fixed OPEX 1.1 – 1.2 EUR2017/kWth/year Berenschot, Energy
(steam output) Matters, CE Delft, &
Industrial Energy Experts
(2017); Thermona (2010);
Weil-McLain (2016)
TRL 9
Market entry Present
4.1.4 Hydrogen
Using hydrogen as a fuel would require a replacement of the natural gas burners of the boiler
and thermal oil heater with hydrogen burners (VNP, 2018). In order for this option to support
decarbonisation, hydrogen from low-carbon sources (often called green and blue hydrogen)
need to be used. Green hydrogen is hydrogen which is produced from fossil carbon-free
sources, such as biomass or renewable electricity (GeoPura, n.d.). Blue hydrogen is produced
via steam methane reforming with carbon capture and storage (Van Capellen, Croezen, &
Rooijers, 2018). Hydrogen requires different combustion conditions compared to natural gas,
which means that additional changes to equipment and operation practices are needed. Table
12 gives the economic data of the hydrogen option. Although hydrogen technology is mature,
the availability of low-cost, low-carbon hydrogen is a limiting factor to the implementation of
the option. Furthermore, impacts on Scope 2 and 3 emissions (beyond the plant’s on-site
combustion emissions) should be considered.
7
Installation costs are site-specific.
A MIDDEN report – PBL – TNO | 27Table 12. Retrofitting a hydrogen burner to the boiler, economic data.
Characteristics Value Source
Base year 2016
Fuel Hydrogen (green or blue)
CO2-eq avoided 35.2 kt (28% of 2016 level) See Table 4
Capacity 1 – 85 MWth E&M Combustión (2019)
Efficiency 100% (LHV)
85% (HHV) VNP (2018)
Lifetime 20 years VNP (2018)
CAPEX 246 EUR2017/kWth (hydrogen VNP (2018)
burners, including installation,
steam output)
Fixed OPEX 5 – 12 EUR2017/kWth/year Assumed 2-5% of CAPEX
(hydrogen burners, steam output)
TRL 9
Market entry Present
4.2 Heat recovery and utilization
PX oxidation produces 7.62 GJ of heat per tonne of PTA production and bottle-grade PET
production also produces residual heat, mostly originating from its cooling processes.
Currently, much of the residual heat is removed with cooling water. Recovering and utilizing
this heat in the process would reduce overall energy needs and could contribute to
decarbonisation. Incorporating the flow of cooling water into a heat network could recover the
residual heat which is transported by the cooling water. There are multiple possible
destinations for this heat, but this is limited by the quality of the residual heat. The provided
temperature of the residual heat and the availability of the recovered heat are crucial for
implementation of this option.
The residual heat could contribute to meeting the heat demand for bottle-grade PET and PTA
production, which would require additional equipment and infrastructure at Indorama
Rotterdam. The recovered heat could be used to decrease the fuel demand for both oil and
steam heating. Techno-economic data for the required equipment is site-specific and not
available publicly.
Mechanical vapour recompression is a technology which increases the temperature of vapour
by performing mechanical compression (Marsidi, 2018). This technology could allow Indorama
Rotterdam to produce useful temperatures from the residual heat which is already produced
on site. Table 14 gives the economic data of installing mechanical vapour recompression
technology at the site.
PBL – TNO | 28 – A MIDDEN reportYou can also read


