Aqueous-phase qOH oxidation - On the importance of atmospheric loss of organic nitrates by
←
→
Page content transcription
If your browser does not render page correctly, please read the page content below
Atmos. Chem. Phys., 21, 4915–4937, 2021
https://doi.org/10.5194/acp-21-4915-2021
© Author(s) 2021. This work is distributed under
the Creative Commons Attribution 4.0 License.

On the importance of atmospheric loss of organic nitrates by
aqueous-phase qOH oxidation
Juan Miguel González-Sánchez1,2 , Nicolas Brun1,2 , Junteng Wu1 , Julien Morin1 , Brice Temime-Roussel1 ,
Sylvain Ravier1 , Camille Mouchel-Vallon3 , Jean-Louis Clément2 , and Anne Monod1
1 AixMarseille Univ, CNRS, LCE, Marseille, France
2 AixMarseille Univ, CNRS, ICR, Marseille, France
3 Laboratoire d’Aérologie, Université de Toulouse, CNRS, UPS, Toulouse, France

Correspondence: Juan Miguel González-Sánchez (juanmiguelgs93@gmail.com) and Anne Monod
(anne.monod@univ-amu.fr)

Received: 10 July 2020 – Discussion started: 9 October 2020
Revised: 16 January 2021 – Accepted: 21 February 2021 – Published: 30 March 2021

Abstract. Organic nitrates are secondary species in the at-          cially for polyfunctional organic nitrates: for 50 % of the
mosphere. Their fate is related to the chemical transport of         proposed organic nitrates for which the qOH reaction oc-
pollutants from polluted areas to more distant zones. While          curs mainly in the aqueous phase (more than 50 % of the
their gas-phase chemistry has been studied, their reactivity         overall removal), their qOH-oxidation lifetimes increased by
in condensed phases is far from being understood. However,           20 % to 155 % under cloud/fog conditions (liquid water con-
these compounds represent an important fraction of organic           tent LWC = 0.35 g m−3 ). In particular, for 83 % of the pro-
matter in condensed phases. In particular, their partition to        posed terpene nitrates, the reactivity towards qOH occurred
the aqueous phase may be especially important for oxidized           mostly (> 98 %) in the aqueous phase, while for 60 % of
organic nitrates for which water solubility increases with           these terpene nitrates, their lifetimes increased by 25 % to
functionalization. This work has studied for the first time          140 % compared to their gas-phase reactivity. We demon-
the aqueous-phase qOH-oxidation kinetics of four alkyl ni-           strate that these effects are of importance under cloud/fog
trates (isopropyl nitrate, isobutyl nitrate, 1-pentyl nitrate, and   conditions but also under wet aerosol conditions, especially
isopentyl nitrate) and three functionalized organic nitrates         for the terpene nitrates. These results suggest that consider-
(α-nitrooxyacetone, 1-nitrooxy-2-propanol, and isosorbide            ing aqueous-phase qOH-oxidation reactivity of biogenic ni-
5-mononitrate) by developing a novel and accurate compe-             trates is necessary to improve the predictions of their atmo-
tition kinetic method. Low reactivity was observed, with kOH         spheric fate.
ranging from 8 × 10⁷ to 3.1 × 10⁹ L mol−1 s−1 at 296 ± 2 K.
Using these results, a previously developed aqueous-phase
structure–activity relationship (SAR) was extended, and the
resulting parameters confirmed the extreme deactivating ef-          1   Introduction
fect of the nitrate group, up to two adjacent carbon atoms.
The achieved extended SAR was then used to determine the             Nitrogen oxides (NOx = qNO + qNO2 ) intensely impact air
 qOH-oxidation rate constants of 49 organic nitrates, includ-        quality and the environment as they play key roles in the
ing hydroxy nitrates, ketonitrates, aldehyde nitrates, nitrooxy      production of relevant air pollutants such as ozone (O3 ), ni-
carboxylic acids, and more functionalized organic nitrates           trous acid (HONO), nitric acid (HNO3 ), and secondary or-
such as isoprene and terpene nitrates. Their multiphase at-          ganic aerosol (SOA). Their atmospheric chemistry controls
mospheric lifetimes towards qOH oxidation were calculated            the concentrations of the three main oxidants, O3 , qOH, and
using these rate constants, and they were compared to their          NO3 q radicals. The past few decades have witnessed impor-
gas-phase lifetimes. Large differences were observed, espe-          tant reductions in NOx direct emissions in Europe or North
                                                                     America, resulting in changes in their atmospheric fate, by

Published by Copernicus Publications on behalf of the European Geosciences Union.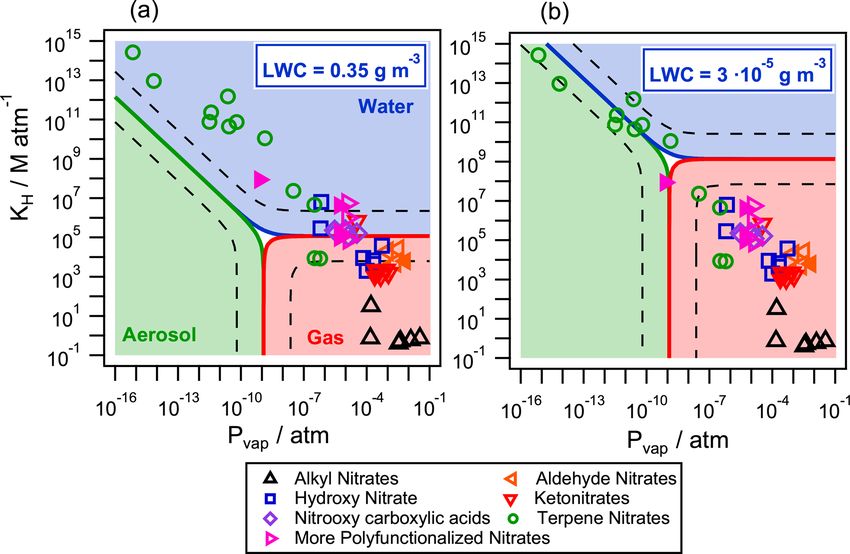
4916                J. M. González-Sánchez et al.: Atmospheric loss of organic nitrates by aqueous-phase qOH oxidation

increasing the relative importance of their conversion to or-      consisting of a comparison between the decay of the target
ganic nitrates (Romer Present et al., 2020). The latter are sec-   compound versus a reference compound, for which the kOH
ondary organic compounds, which are formed by the reactiv-         value is well known. Many studies have used the thiocyanate
ity of NOx with volatile organic compounds (VOCs). Ow-             anion (SCN− ) as the reference compound. Its decay can be
ing to their long atmospheric lifetimes (much longer than for      easily followed by online spectroscopic measurement of the
NOx ), organic nitrates can be transported from polluted to        formed radical anion (SCN)2 q− in the presence and absence
remote areas. During their long-range transport, these com-        of the target compound (Herrmann, 2003). This technique,
pounds may (1) release back NOx far from NOx sources via           however, is not well suited for species with low reactivity
direct photolysis and/or qOH oxidation or (2) act as a defini-     for which kOH ≤ 109 L mol−1 s−1 , i.e., more than 10 times
tive sink of atmospheric NOx by hydrolysis of the nitrate          lower than kOH+SCN− = 1.12(±0.20) × 1010 L mol−1 s−1 . In
group and/or by deposition. Organic nitrates thus act as sinks     this case, the target species should reach high concentrations
and reservoirs of NOx , leading to a broader spatial distribu-     to be able to compete with the thiocyanate anion. These high
tion of NOx and thus spreading the ozone, HONO, and SOA            concentrations may interfere with the measurements. Other
formation from the local to the regional scale. For this reason,   indirect methods use offline measurements for monitoring
understanding and considering the reactivity of organic ni-        the target and reference compounds. However, most of these
trates is necessary for accurately predicting their atmospheric    methods use reference compounds for which kOH values have
fates and impacts on air quality.                                  not been so widely explored, thus inducing important uncer-
   The gas-phase chemistry of organic nitrates has been stud-      tainties in the experimentally determined kOH values (Her-
ied through kinetic experiments focusing on their qOH oxi-         rmann, 2003).
dation (Bedjanian et al., 2018; Picquet-Varrault et al., 2020;         The aim of this work was to accurately determine aqueous-
Treves and Rudich, 2003; Wängberg et al., 1996; Zhu et             phase kOH rate constants by developing a new online compe-
al., 1991) and direct photolysis (Clemitshaw et al., 1997;         tition kinetic method, which is well suited to species with low
Picquet-Varrault et al., 2020; Suarez-Bertoa et al., 2012).        reactivity. The effectiveness and the relevance of the method
These experiments provide data for different types of organic      were validated on compounds for which kOH rate constants
nitrates, including alkyl nitrates, ketonitrates, hydroxy ni-      are well known. Then, the method was used to determine the
trates, dinitrates, cyclonitrates, and alkene nitrates, and pro-   kOH rate constants of some organic nitrates, and the results
vide knowledge on their gas-phase atmospheric fate. Al-            were used to extend the aqueous-phase structure–activity re-
though alkyl and alkene nitrates are highly volatile, poly-        lationship (SAR) developed earlier (Monod and Doussin,
functional organic nitrates may show much lower volatil-           2008; Doussin and Monod, 2013) to the nitrate group. Fur-
ity and they can partition to condensed phases as aqueous          thermore, the prediction of kOH rate constants for other at-
and aerosol phases. Their presence in submicron particles          mospherically relevant organic nitrates in the aqueous phase
has been observed in a fraction ranging from 5 % to 77 %           was performed with the extended SAR. Finally, the potential
(in mass) of organic aerosol in Europe and North Amer-             multiphase fate of these compounds in the atmosphere was
ica (Kiendler-Scharr et al., 2016; Lee et al., 2019). Despite      estimated.
this fact, their reactivities in condensed phases have been
poorly explored. Most studies have focused on hydrolysis,
a reaction that is extremely structure dependent, mostly oc-       2     Experimental
curring in tertiary or allylic nitrates (Hu et al., 2011; Liu et
al., 2012), while the non-hydrolyzable fraction of α- and β-       2.1    Principle
pinene particulate organic nitrate ranges from 68 % to 91 %
in mass (Takeuchi and Ng, 2019). To our knowledge, only            The originality of this work relies on a competition kinetic
one study experimentally determined the photolysis kinet-          method monitored by online decay measurements of the ref-
ics of organic nitrates in the aqueous phase (Romonosky et         erence compound in the reactor’s headspace using a proton
al., 2015) and concluded that the qOH removal processes            transfer reaction mass spectrometer (PTR-MS). Concerning
should have a higher relevance. However, there have been           the target compounds, depending on their properties (sol-
no attempts to experimentally determine their aqueous-phase        ubility, volatility, and instrumental response), their kinetic
 qOH-oxidation reactivity.                                         decays were monitored in the reactor’s headspace by PTR-
   Aqueous-phase qOH-oxidation processes play a key role           MS or offline by ultra-high-performance liquid chromatogra-
in the removal and production of water-soluble compounds           phy photodiode array detector (UHPLC-UV). The developed
in the atmosphere (Herrmann et al., 2015). The determi-            method employed methanol as the reference compound be-
nation of kinetic rate constants is essential to understand        cause (i) its kOH rate constant, 9.7 (±1.5) ×108 L mol−1 s−1
their lifetimes and to develop more precise models to predict      at 298 K, is widely accepted (Table S1); (ii) this value is
pollution events and the scale of pollutant transport. Deter-      relevant for competitive kinetics relative to species with
mining aqueous-phase qOH-oxidation second-order rate con-          low reactivity; and (iii) its extremely sensitive quantification
stants (kOH ) may be done by competition kinetic methods           by PTR-MS was expected to not suffer from any interfer-

Atmos. Chem. Phys., 21, 4915–4937, 2021                                               https://doi.org/10.5194/acp-21-4915-2021
J. M. González-Sánchez et al.: Atmospheric loss of organic nitrates by aqueous-phase qOH oxidation                                 4917

ences with the selected organic nitrates (Aoki et al., 2007;          Prior to each experiment, the reactor’s headspace was ex-
Lindinger et al., 1998).                                           tensively purged with pure air for 1 h while PTR-MS mea-
   Due to the known sensitivity of organic nitrates to photol-     surements were set for stabilization purposes. The target
ysis (Romonosky et al., 2015), aqueous qOH radicals were           compound and methanol were then added directly into the
generated in the dark by the Fenton reaction (Reaction R1)         aqueous phase, and the reactor’s headspace signal was mon-
(Neyens and Baeyens, 2003) by dropwise addition of a solu-         itored for 30 min before the reaction with constant stirring
tion of Fe2+ to an acidic solution of H2 O2 in excess contain-     of the solution to determine the first-order rate constant of
ing methanol and the target compound.                              evaporation (kvap ) of each compound under the reaction con-
                                                                   ditions. The reaction was then started by adding dropwise
Fe2+ + H2 O2 → Fe3+ + qOH + OH−                            (R1)    the Fe2+ solution for 15 to 30 min (depending on the vol-
                                                                   ume of Fe2+ added). During experiments performed with
The method was validated using isopropanol and acetone as          isopropyl nitrate, α-nitrooxyacetone, 1-nitrooxy-2-propanol,
target compounds, whose qOH-oxidation rate constants are           and isosorbide 5-mononitrate, the aqueous phase was sam-
well known (Table S1). The method was then used to deter-          pled every 3 min for offline measurements by UHPLC-UV.
mine new kOH values for four alkyl nitrates (isopropyl nitrate,    Once the flow of Fe2+ was stopped, the system was kept stir-
isobutyl nitrate, 1-pentyl nitrate, and isopentyl nitrate) and     ring for another 30 min while continuously monitoring the
three polyfunctional organic nitrates (α-nitrooxyacetone, 1-       reactor’s headspace.
nitrooxy-2-propanol, and isosorbide 5-mononitrate); see Ta-
ble 1. Furthermore, a tentative study of 2-ethylhexyl nitrate      2.3     Methodology
kOH rate constant was performed using this method, but it
                                                                   In such a competition between the target compound (X) and
                                                                   methanol (M) towards qOH radicals (Reaction R2),
was limited by its very low solubility.

2.2   Experimental setup and protocol                              X/M + qOH → Products,                                (R2)
                                                                   in the absence of direct photolysis, the second-order kinetic
The aqueous-phase reactor consisted of a 1 L three-neck
                                                                   rate constant of the target compound, kOH,X (in L mol−1 s−1 ),
round-bottom flask closed hermetically with rubber caps
                                                                   is directly obtained from the slope (kOH,X /kOH,M ) of the lin-
(Fig. 1). A Razel syringe pump at 0.33 mL min−1 was used
                                                                   ear plot of ln([X]0 (aq) /[X]t (aq) ) versus ln([M]0 (aq) /[M]t (aq) )
with a glass syringe to add dropwise a solution of Fe2+
                                                                   derived from Eq. (1).
into the reactor’s aqueous solution. A second syringe was
also connected to the reactor to add the target and the ref-            [X]0 (aq)   kOH,X      [M]0 (aq)
                                                                   ln             =       · ln           ,                           (1)
erence compounds and to sample the aqueous phase when                   [X]t (aq)   kOH,M      [M]t (aq)
necessary. The reactor’s aqueous solution was continuously         where [X]0 (aq) /[X]t (aq) represents the aqueous-phase con-
stirred before and during the reaction with a magnetic stir-       centration relative decay of the target compound, and
rer. A flow of synthetic air constantly guided a fraction of the   [M]0 (aq) /[M]t (aq) represents the aqueous-phase concentra-
headspace gas phase to the PTR-MS instrument, with a flow          tion relative decay of methanol.
of 0.050 L min−1 using a mass flow controller (Brooks SLA             Using the Fenton Reaction (R1), qOH radicals were gen-
Series). A 1 : 30 dilution was performed downward of the           erated within the aqueous phase and could not reach the
reactor’s flow using synthetic air at 1.450 L min−1 . All ex-      headspace in sufficient numbers to react significantly with
periments were performed at room temperature (296 ± 2 K).          the target compounds in the gas phase. This was confirmed
   In each experiment, the Fe2+ solution consisted of 5–           by the validation experiments (Sect. 3.1) where the values
10 mL of FeSO4 q7H2 O (0.02–0.06 mol L−1 ), added drop-            found for kOH,X /kOH,M ratios were those of the aqueous-
wise to the solution of 400 mL of H2 O2 (in excess, i.e.,          phase reactions and not those of the gas phase, which are
0.004 mol L−1 ) acidified by H2 SO4 (0.005 mol L−1 ), to keep      a factor of 2 to 3 higher.
pH = 2.5 (Micro pH electrode, Thermo) during the reaction.            Headspace analyses were based on the direct proportion-
Concentrations and volumes of the Fe2+ solution were var-          ality between aqueous- and gas-phase concentrations of the
ied in order to optimize the qOH attack on the reference and       analytes (Karl et al., 2003). Therefore, in cases where both
the target compounds. All experiments and their initial con-       the target and the reference compounds were monitored by
ditions are compiled in Table S2. The Fe2+ solution was used       PTR-MS, Eq. (1) can be written as Eq. (2) (see Appendix A
as the limiting reagent to minimize its possible interference      for detailed explanations).
with the organic nitrate reaction products. In addition, it was
                                                                        ncps(X)0   kOH,X      ncps(M)0
verified in control experiments that H2 O2 , used in excess,       ln            =       · ln          ,                             (2)
did not react with any of the target compounds. Furthermore,            ncps(X)t   kOH,M      ncps(M)t
control experiments at pH = 2.5 confirmed that none of the         where ncps(X) and ncps(M) are the normalized count
organic nitrates underwent hydrolysis at significant rates un-     rates of the target compound and methanol, respec-
                                                                                  ncps(X) = cps(X+ )/cps(H3 O+ )
                                                                                           P
der our experimental conditions.                                   tively;  i.e.,                                 and

https://doi.org/10.5194/acp-21-4915-2021                                              Atmos. Chem. Phys., 21, 4915–4937, 2021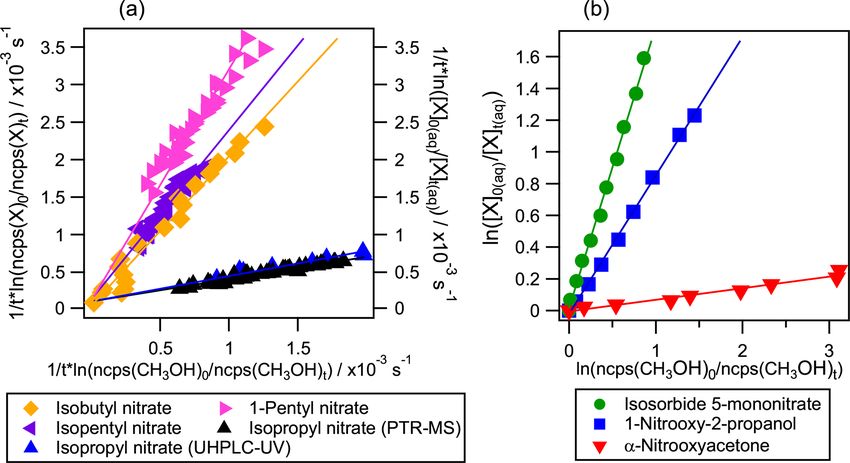
4918                  J. M. González-Sánchez et al.: Atmospheric loss of organic nitrates by aqueous-phase qOH oxidation

Table 1. Chemical structures and properties of the studied organic nitrates. Henry’s law constants were obtained from Sander (2015) except
for 2-ethylhexyl nitrate and isosorbide 5-mononitrate, which were calculated using the SAR developed by Raventos-Duran et al. (2010).
Organic nitrate solubilities were calculated using the model WSKOWWIN™.

  Name                        Structure          KH, 298 K (mol L−1 atm−1 )        Solubility at 298 K (mol L−1 )   Monitored by

  Isopropyl nitrate                                                       0.75                       2.5 × 10⁻²     PTR-MS, UHPLC-UV

  Isobutyl nitrate                                                        0.60                       9.4 × 10⁻³     PTR-MS

  1-Pentyl nitrate                                                        0.74                       2.7 × 10⁻³     PTR-MS

  Isopentyl nitrate                                                       0.40                       2.5 × 10⁻³     PTR-MS

  2-Ethylhexyl nitrate                                                    0.18                         1 × 10⁻⁴     PTR-MS

  α-Nitrooxyacetone                                                  1.0 × 10³                               1.6    UHPLC-UV

  1-Nitrooxy-2-propanol                                              6.7 × 10⁴                               0.6    UHPLC-UV

  Isosorbide 5-mononitrate                                           1.3 × 10⁷                               0.3    UHPLC-UV

  Isopropanol                                                             130                               16.6    PTR-MS

  Acetone                                                                     30                            17.2    PTR-MS

ncps(M) = cps(M+ )/cps(H3 O+ ). The normalization                        of the aqueous-phase qOH-oxidation rate constant was per-
             P
of the H3 O+ count rate removes any signal variability due to            formed by plotting the relative decay of the aqueous-phase
fluctuating performance of the ion source.                               concentration (ln([X]0 (aq) /[X]t (aq) ) against the relative de-
   Depending on the properties of the investigated organic               cay of the reference compound signal in the gas phase
nitrates (i.e., their water solubility, volatility, and instrumen-       (ln(ncps(M)0 /ncps(M)t ) as shown in Eq. (3):
tal response), different treatments were applied to deter-
mine their kinetic decays. All the very volatile compounds                    [X]0 (aq)   kOH,X      ncps(M)0
                                                                         ln             =       · ln          .                       (3)
were monitored in the reactor’s headspace by PTR-MS: this                     [X]t (aq)   kOH,M      ncps(M)t
comprised the target alkyl nitrates (for which Henry’s law
constant KH < 1 mol L−1 atm−1 ), as well as methanol, ace-               In addition, for the most volatile molecules (i.e., alkyl ni-
tone, and isopropanol (KH < 300 mol L−1 atm−1 ). Further-                trates), further corrections were performed to subtract the
more, due to the low water solubility of alkyl nitrates, their           contribution of evaporation to the overall reaction decay.
initial concentrations were limited to 5 × 10⁻⁵ mol L−1 . On             Their high volatilities induced a substantial decay in their
the other hand, the target polyfunctionalized organic nitrates           concentrations that was systematically measured prior to the
were much less volatile (KH > 1000 mol L−1 atm−1 ), and                  start of the reaction, inferring a specific first-order rate con-
their detection by PTR-MS was more problematic; their rel-               stant of evaporation (kvap ) of each compound under the reac-
ative decays were monitored in the aqueous phase by of-                  tion conditions. While for methanol, acetone, or isopropanol
fline UHPLC-UV. For these compounds, the determination                   the evaporation decay was negligible, for the alkyl nitrates
                                                                         it accounted for 2 % to 20 % of the molecule’s consumption

Atmos. Chem. Phys., 21, 4915–4937, 2021                                                      https://doi.org/10.5194/acp-21-4915-2021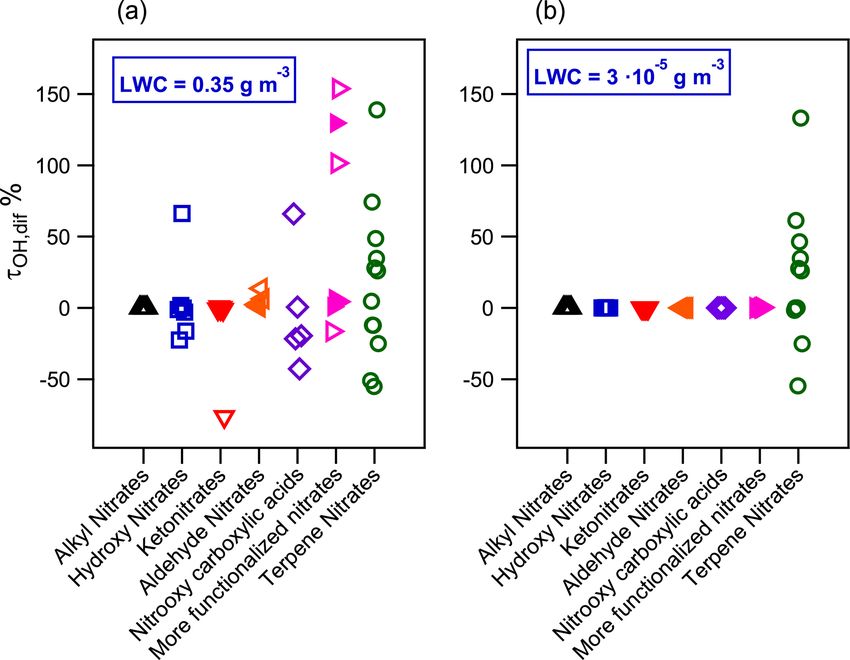
J. M. González-Sánchez et al.: Atmospheric loss of organic nitrates by aqueous-phase qOH oxidation                         4919

Figure 1. Experimental setup for the competition kinetics method.

during the reaction. To consider this contribution, Eq. (4) was     isosorbide 5-mononitrate. For isobutyl nitrate, 1-pentyl ni-
used instead of Eq. (2) for volatile alkyl nitrates:                trate, and isopentyl nitrate, compounds which undergo a sig-
                                                                    nificant evaporation decay, Eq. (4) was used. Finally, iso-
1      ncps(X)0          kOH,X 1     ncps(M)0                       propyl nitrate was chosen for intercomparing both methods
  · ln          = kvap +      · · ln          ,               (4)
t      ncps(X)t          kOH,M t     ncps(M)t                       as it is water soluble and volatile enough to be monitored by
                                                                    both analytical techniques; its aqueous-phase kOH was deter-
where t is the reaction time (in seconds). Plotting 1/t ·           mined by both Eqs. (4) and (5).
ln(ncps(X)0 /ncps(X)t ) versus 1/t · ln(ncps(M)0 /ncps(M)t )
resulted in a straight line with a slope of kOH,X /kOH,M and an     2.4     Analytical measurements
intercept of kvap . The value of kvap was determined during the
30 min prior to the reaction, and its value was fixed in Eq. (4).   2.4.1    PTR-MS
This treatment was not necessary for methanol, acetone, or
isopropanol, due to their lower volatilities. For isopropyl ni-     A commercial high-sensitivity quadrupole PTR-MS (IONI-
trate, whose decay was also monitored in the aqueous phase          CON Analytik GmbH) was used to monitor the concentra-
by UHPLC-UV, Eq. (5) was used (in addition to Eq. 4):               tion decay of the reference compound (methanol) and seven
                                                                    target compounds (acetone, isopropanol, isopropyl nitrate,
1      [X]0 (aq)          kOH,X 1     ncps(M)0                      isobutyl nitrate, 1-pentyl nitrate, isopentyl nitrate, and 2-
  · ln           = kvap +      · · ln          .              (5)
t      [X]t (aq)          kOH,M t     ncps(M)t                      ethylhexyl nitrate) during the reaction. The drift tube volt-
                                                                    age was 600 V, the reactor chamber pressure was 2.19 mbar,
In summary, the aqueous-phase qOH-oxidation rate con-               and the drift tube temperature was 333 K. These values cor-
stants of isopropanol and acetone were determined using             respond to an E/N value of 136 Td (Townsend, with 1
Eq. (2), while Eq. (3) was used for determining the rate            Td = 10−17 V cm−2 ), where E is the electric field strength
constants of α-nitrooxyacetone, 1-nitrooxy-2-propanol, and          (V cm−1 ), and N is the ambient air number density within the

https://doi.org/10.5194/acp-21-4915-2021                                             Atmos. Chem. Phys., 21, 4915–4937, 2021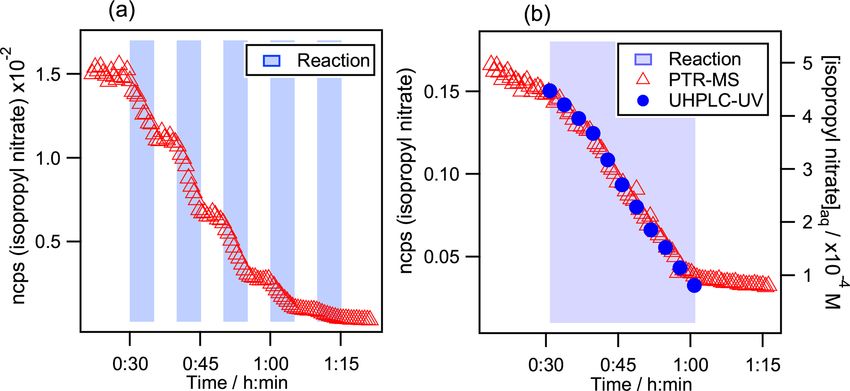
4920                 J. M. González-Sánchez et al.: Atmospheric loss of organic nitrates by aqueous-phase qOH oxidation

drift tube (molecule cm−3 ). Measurements were performed              volatile target compounds were quantified by UHPLC-UV
using the multiple ion detection (MID) mode on a short list           (Thermo Scientific Accela 600) at 200 nm. The device was
of 11–13 preselected m/z values resulting in measurement              equipped with a Hypersil Gold C18 column (50 × 2.1 mm)
cycles of 25–35 s. This list includes the hydronium ion iso-          with a particle size of 1.9 µm and an injection loop of 5 µL.
tope H18    +                                               q    +
         3 O (m/z = 21) and its water clusters, H2 O H3 O             A binary eluent of H2 O and CH3 CN was used for all anal-
              q     +
and (H2 O)2 H3 O (m/z = 37 and m/z = 55, respectively)                yses at a flow rate of 400 µL min−1 . Two gradients were
as well as parasitic ions NO+ and O+    2 (m/z = 30 and m/z =         used depending on the compounds’ polarity. For isopropyl
32) for diagnostic purposes. The remaining ions correspond            nitrate, the gradient started from H2 O/CH3 CN 80/20 (v/v)
to the protonated reference compound, methanol (m/z = 33),            to 50/50 (v/v) for 3 min, held at this proportion for 1 min,
and to the 5–7 major products of organic nitrates. The indi-          and then set back to 80/20 (v/v) within 10 s until the end
vidual fragmentation patterns of the organic nitrates deter-          of the run, at minute 5 (method A). For more polar com-
mined during a series of preliminary measurements in scan             pounds, i.e., α-nitrooxyacetone, 1-nitrooxy-2-propanol, and
mode (21–200 amu) are listed in Table S3. Data were cor-              isosorbide 5-mononitrate, a similar gradient was employed
rected by normalizing the ion signals with the number of hy-          but the initial and final proportions were H2 O/CH3 CN 90/10
dronium ions in the drift tube, calculated by multiplying by          (v/v) in order to optimize their retention times (method B).
500 the signal at m/z = 21.                                              Calibration curves were optimized to obtain good lin-
   Isopentyl nitrate and 2-ethylhexyl nitrate were analyzed by        earity between 5 × 10⁻⁵ and 1 × 10⁻³ mol L−1 with a
PTR-MS for the first time. The other compounds, isopropyl             R 2 > 0.9995. The retention times were 0.9, 1.1, 1.2, and
nitrate, isobutyl nitrate, and 1-pentyl nitrate, were previously      2.4 min for 1-nitrooxy-2-propanol, isosorbide 5-mononitrate,
investigated by Duncianu et al. (2017) and Aoki et al. (2007).        α-nitrooxyacetone, and isopropyl nitrate, respectively. Lim-
Table S3 compiles detected fragments and their relative in-           its of detection are 9×10⁻⁶ mol L−1 for isopropyl nitrate and
tensities for all the studied organic nitrates in this work. Com-     1 × 10⁻⁵ mol L−1 for the other three compounds.
pared to the previous studies, similar trends in the fragmenta-
tion of organic nitrates were found. Fragments with the high-         2.5    Reagents
est relative intensities correspond to the R+ fragment, pro-
duced after the nitrate group loss in the drift tube, and to          Chemicals were commercially available and used as sup-
the NO+                                                               plied: isopropyl nitrate (96 %, Sigma-Aldrich), isobutyl ni-
         2 ion, which was detected for all organic nitrates, ex-
cept for 2-ethylhexyl nitrate. Other relevant fragments were          trate (98 %, Sigma-Aldrich), 2-ethylhexyl nitrate (97 %,
the RO+ fragment and/or other ions (such as C3 H+               +     Sigma-Aldrich), 1-pentyl nitrate (98 %, TCI Chemicals),
                                                        5 , C3 H7 ,
      +
C4 H9 ) which were formed by further fragmentation of the             isopentyl nitrate (98 %, TCI Chemicals), isosorbide 5-
R+ fragment.                                                          mononitrate (98 %, Acros Organics), H2 O2 (30 %, non-
   The minimum standard sensitivity normalized to 106 hy-             stabilized, Acros Organics), FeSO4 q7H2 O (99 %, Sigma-
dronium ions for all organic nitrates was determined prior to         Aldrich), H2 SO4 (95 %–98 %, Merck), chloroacetone (95 %,
the start of the reaction, by calculating the maximum possi-          Sigma-Aldrich), AgNO3 (99 %, VWR Chemicals), KI
ble gas-phase concentrations assuming the Henry’s law equi-           (98 %, Sigma-Aldrich), and NaBH4 (98 %, Sigma-Aldrich).
librium (see Table S3). The sensitivities range from 3 to             Methanol (Fisher Chemical), acetonitrile (Fisher Optima),
7 ncps ppbv−1 for all organic nitrates. From these sensitivi-         and isopropanol (Honeywell) were LC/MS grade and used
ties, it was calculated that in the reactor’s headspace the tar-      as supplied. Acetone (Carlo Erba Reagents) and ether (Fisher
get organic nitrates were detectable at concentrations higher         Chemical) were HPLC grade. Tap water was purified with a
than 1 × 10⁻⁷ mol L−1 in the aqueous phase.                           Millipore Milli-Q system (18.2 M cm and TOC < 2 ppb).
   For methanol, assuming Henry’s law equilibrium, us-                   Non-commercial organic nitrates, i.e., α-nitrooxyacetone
ing a KH = 204 mol L−1 atm−1 (average value out of those              and 1-nitrooxy-2-propanol, were synthesized and purified.
reported in Sander, 2015), the minimum standard sensi-                α-Nitrooxyacetone was synthesized by the nucleophilic sub-
tivity normalized to 106 hydronium ions would be 9 ±                  stitution reaction of iodoacetone which was synthesized
1 ncps ppbv−1 , corresponding to an effective sensitivity >           previously from chloroacetone. The ketone group from
360 cps ppbv−1 at the typical H3 O+ count rate of 4×10⁷ cps.          α-nitrooxyacetone was reduced to produce 1-nitrooxy-2-
Under these conditions, it would be detectable in the reac-           propanol. See Sect. S1 in the Supplement for further details.
tor’s headspace at aqueous concentrations higher than 9 ×
10−6 mol L−1 .                                                        3     Results and discussion

2.4.2   UHPLC-UV                                                      3.1    Validation of the kinetic method

All the investigated organic nitrates show an intense UV ab-          Three different kinds of validation experiments were per-
sorption around 200 nm (Fig. S1). Aliquots of the solution            formed. Their goals were (1) to verify that the partition of the
were sampled every 3 min from the reactor and the least               reactants between the aqueous phase and the gas phase (in the

Atmos. Chem. Phys., 21, 4915–4937, 2021                                                 https://doi.org/10.5194/acp-21-4915-2021
J. M. González-Sánchez et al.: Atmospheric loss of organic nitrates by aqueous-phase qOH oxidation 4921
reactor’s headspace) was rapidly reached during the reaction; 3.2 New aqueous-phase kOH determinations:
(2) to intercompare the two methods (PTR-MS and UHPLC- application of the kinetic method to organic
UV); and (3) to validate the aqueous-phase kinetic kOH rate nitrates
constants using well-known values, i.e., those of acetone and
isopropanol.
Figure 2a shows the headspace signal measured by PTR- Aqueous-phase kOH for organic nitrates were determined for
MS during the aqueous-phase qOH oxidation of isopropyl ni- the first time using the developed competition method. The
trate. The light blue background indicates periods when the kinetic rate constants were calculated by Eq. (4) for isobutyl
solution of Fe2+ (0.06 mol L−1 ) was dripped into the reactor nitrate, 1-pentyl nitrate, and isopentyl nitrate; by Eq. (3) for
to produce qOH radicals. One can clearly observe how the α-nitrooxyacetone, 1-nitrooxy-2-propanol, and isosorbide 5-
isopropyl nitrate signal decay starts immediately at the be- mononitrate; and by Eqs. (4) and (5) for isopropyl nitrate.
ginning of the addition of Fe2+ and ceases promptly when it Figure 4 shows some examples of the linear regressions ob-
is stopped. The partition between the aqueous phase and the tained for each organic nitrate where the slope corresponds
reactor’s headspace is therefore swiftly reached and is faster to the kOH,X /kOH,M ratio. It evidences the diversity of values
than the PTR-MS measurement cycle rate (25 s for the short- obtained for the studied organic nitrates, which all fall within
est cycle). less than an order of magnitude from that of methanol, thus
Figure 2b shows the isopropyl nitrate decay during its confirming that this reference is appropriate for the studied
aqueous-phase qOH-oxidation while monitoring its concen- molecules.
tration with the PTR-MS and the UHPLC-UV. It is clear from The determined aqueous-phase qOH-oxidation rate con-
the figure that the kinetics are identical for both methods. stants for the organic nitrates are compiled in Table 2. Un-
Furthermore, the ratios of kOH,isopropryl nitrate /kOH,methanol certainties were calculated by propagating the standard devi-
were 0.29 (±0.06) and 0.31 (±0.06) using the PTR-MS ation of the replicates with the uncertainty of the methanol
method, Eq. (4), and the UHPLC-UV one, Eq. (5), respec- kOH rate constant. Then, to account for the small number of
tively. These results obtained for isopropyl nitrate confirm experiments performed for some molecules, the uncertainties
that its gas-phase concentrations in the reactor’s headspace are given by the confidence limits of 95 % given by Student’s
are proportional to its aqueous-phase concentrations. In ad- t distribution. This explains why the value obtained for 1-
dition, this proves that there is no qOH attack in the gas phase: pentyl nitrate shows the largest uncertainty as its kOH was
the ratios of kOH,X /kOH,M observed are significantly differ- determined by only two experiments. Data for 2-ethylhexyl
ent from the gas-phase rate constant ratios, which are about nitrate showed inconsistency compared to the other alkyl ni-
2 or 3 times higher. Furthermore, it shows that there are no trates (significantly lower value with respect to its chemical
further interferences in the reaction other than the compound structure). It is possible that even with a low initial concen-
evaporation. tration (5 × 10⁻⁵ mol L−1 ), well below its solubility thresh-
The validation of the method was achieved by determining old (1×10⁻⁴ mol L−1 ), the complete dissolution of the com-
the aqueous-phase qOH-oxidation rate constants for acetone pound was not achieved when the reaction started, thus in-
and isopropanol, which have been extensively studied in the ducing an incorrect rate constant value. Furthermore, it is
literature (Table S1). Both compound decays were monitored suspected, from its structure, to present some surface activ-
in the reactor’s headspace with the PTR-MS, and their kOH ity, thus preventing this compound from dissolving into the
values were determined using Eq. (2). The experiments were bulk water.
triplicated. The uncertainty of the rate constant was calcu- Even though there are no other data available in the lit-
lated by the propagation of the standard deviation of the three erature to compare with, the kOH values obtained for the
values and the methanol rate constant uncertainty. other organic nitrates are consistent regarding the chemical
Figure 3 compares the experimentally determined kOH val- structures: they reflect that the rate constant increases with
ues for acetone and isopropanol in this work with the previ- the number of reactive sites. In more detail, the chemical
ous values reported in the literature. The determined rate con- structure of the organic nitrate and the position of the ni-
stants, 1.9 (±0.1) ×109 L mol−1 s−1 for isopropanol and 1.0 trate group plays an important role in the qOH-oxidation rate
(±0.2) ×108 L mol−1 s−1 for acetone, agree very well with constant. Figure 5a compares these values with the rate con-
the reported values within the experimental uncertainties. stants of their corresponding alcohols and non-functionalized
These results show the relevance of the developed method molecules. It shows how the qOH oxidation is reduced when
for accurately determining the aqueous-phase qOH-oxidation the nitrate group (–ONO2 ) is replacing an alcohol group
rate constant of any semivolatile or non-volatile compound (–OH) or hydrogen (–H). The nitrate group attached to
detectable either by PTR-MS or by UHPLC-UV. Hereafter, a primary carbon atom (i.e., isobutyl nitrate, 1-pentyl ni-
the new rate constants for organic nitrates are presented and trate, isopentyl nitrate, α-nitrooxyacetone, and 1-nitrooxy-
discussed. 2-propanol) slows down the reactivity by a factor of 1.7 to
3.1 in comparison to their H-substituted homologs (isobu-
tane, pentane, isopentane, acetone, and isopropanol). For iso-
https://doi.org/10.5194/acp-21-4915-2021 Atmos. Chem. Phys., 21, 4915–4937, 20214922 J. M. González-Sánchez et al.: Atmospheric loss of organic nitrates by aqueous-phase qOH oxidation Figure 2. Kinetic decays of isopropyl nitrate during its aqueous-phase qOH oxidation. (a) Monitored by PTR-MS during several sequential additions of the Fe2+ solution. Initial conditions in the reactor were [Isopropyl nitrate]0 = 5×10⁻⁵ mol L−1 , [H2 O2 ]0 = 4×10⁻³ mol L−1 , and [H2 SO4 ]0 = 5 × 10⁻³ mol L−1 . (b) Intercomparison between PTR-MS and UHPLC-UV detection. Initial conditions were [Isopropyl nitrate]0 = 6 × 10⁻⁴ mol L−1 , [CH3 OH]0 = 3 × 10⁻⁴ mol L−1 , [H2 O2 ]0 = 4 × 10⁻³ mol L−1 , and [H2 SO4 ]0 = 5 × 10⁻³ mol L−1 . In both graphs, the time is set to 0 when isopropyl nitrate is injected. Blue background indicates periods when the solution of Fe2+ (0.06 mol L−1 ) was dripped into the reactor to produce qOH radicals. Figure 3. Validation experiments: determination of the aqueous-phase kOH values using the new developed method and comparison with the reported values in the literature for (a) isopropanol and (b) acetone. The horizontal line represents the average value of the previous studies. propyl nitrate, a secondary organic nitrate, the qOH attack is ens the C–H bond of the α- and the β-carbon atoms, thus reduced by an order of magnitude compared to n-propane. lowering the hydrogen abstraction (Atkinson et al., 1982). A reduction of the reactivity caused by the presence of However, the reduction of the reactivity is clearly more pro- the nitrate group also occurs in the gas phase but in a much nounced in the aqueous phase, implying a solvent kinetic ef- slighter manner (Fig. 5b). It has been discussed that the ni- fect that can more effectively lower the reactivity. This could trate group has an electron-withdrawing nature that strength- be induced by the stabilization of the reactant (Koner et al., Atmos. Chem. Phys., 21, 4915–4937, 2021 https://doi.org/10.5194/acp-21-4915-2021
J. M. González-Sánchez et al.: Atmospheric loss of organic nitrates by aqueous-phase qOH oxidation                                     4923

Figure 4. Examples of competition kinetic results for the studied organic nitrates using the new developed method: experiments 8, 14, 16,
19, 21, 24, and 26 (listed in Table S2). In panel (a) molecules were monitored in the reactor’s headspace by PTR-MS (left axis and horizontal
axis) except for isopropyl nitrate which was also monitored by UHPLC-UV (right axis). In panel (b) methanol was monitored in the reactor’s
headspace by PTR-MS (horizontal axis) while the polyfunctional organic nitrates were followed by UHPLC-UV (left axis).

Table 2. Aqueous-phase qOH-oxidation rate constants for eight organic nitrates: comparison between the experimental rate constants
(kOH exp ) and the simulated ones (kOH sim ) using the extended SAR. Calculations use the SAR parameters indicated in Table 4. The fac-
tor 1 is the relative difference between the simulated and the experimental rate constant (Eq. 10). n stands for the number of experimental
determinations of each rate constant (note that for isopropyl nitrate six experiments were performed; in three of them the value was deter-
mined twice using both Eqs. (4) and (5), thus resulting in nine determinations). Experimental uncertainties are 95 % confidence interval.

                 Studied compounds            kOH exp (×108 L mol−1 s−1 )      kOH sim (×108 L mol−1 s−1 )          1    n
                 Isopropyl nitrate                               2.8 (±0.6)                              3.0   −0.07     9
                 Isobutyl nitrate                                 17 (±11)                              13.5   +0.22     3
                 1-Pentyl nitrate                                 31 (±46)                              31.8   −0.02     2
                 Isopentyl nitrate                                  22 (±9)                             24.6   −0.10     3
                 α-Nitrooxyacetone                               0.8 (±0.4)                              1.3   −0.69     3
                 1-Nitrooxy-2-propanol                           8.7 (±1.9)                              6.3   +0.28     3
                 Isosorbide 5-mononitrate                           18 (±5)                             14.2   +0.19     3

2007) or by the formation of a solvent barrier provoked by               Monod (2013) was extended to organic nitrates. Briefly, the
the nitrate group solvation which could hinder the attack of             principle of the estimation assumes that the overall rate con-
the hydroxyl radical. The latter inhibiting effect could hin-            stant for the qOH-radical-induced H abstraction is equal to
der the qOH attack further than the β position, up to the γ              the sum of each kinetic rate of each reactive site. These
position.                                                                partial kinetic rate constants are determined by considering
   In order to evaluate this question and to predict the reactiv-        the chemical environment of the function along the carbon
ity of other organic nitrates with qOH radicals in the aqueous           skeleton. Each –CH3 , –CH2 –, –CH
4924 J. M. González-Sánchez et al.: Atmospheric loss of organic nitrates by aqueous-phase qOH oxidation
Figure 5. Comparison between the kOH values for organic nitrates, the corresponding alcohols, and non-substituted homolog compounds
(a) in the aqueous phase and (b) in the gas phase. Aqueous-phase kOH values were taken from Reuvers et al. (1973) and Adams et al. (1965)
for alcohols; Getoff (1991) and Rudakov et al. (1981) for H-substituted compounds; and the predictions using the SAR for hydroxy acetone
and the –OH and –H substituted homologs of isosorbide 5-mononitrate. Gas-phase kOH values were taken from Atkinson et al. (1982);
Atkinson and Aschmann (1989); Becker and Wirtz (1989); Bedjanian et al. (2017); Suarez-Bertoa et al. (2012); Talukdar et al. (1997);
Treves and Rudich (2003); and Zhu et al. (1991) for organic nitrates as well as from Atkinson et al. (1997, 1992) and Atkinson (2003) for
H-substituted homologs.
ONO2 ) and G(–ONO2 ) parameters, one specific parameter, tion factor which indicates the presence of one or two oxygen
H(–ONO2 ), was included to test the influence of the nitrate atoms in the ring.
group on the reactivity on distant reactive sites in γ position, Furthermore, as with all carbonyl compounds, α-
Eq. (6): nitrooxyacetone can be hydrated in water, leading to an equi-
librium with its geminal diol form; thus, the equilibrium con-
n
X Y Y stant, Khyd , is defined if water activity is considered to be
k= k (i) · F (αgroup) · G(βgroup) unity by Eq. (7).
i=1
[gem-diol]
·
Y
HONO2 (γ group) · C(ring) , (6) Khyd = (7)
[carbonyl]
The reactivity of these partner molecules toward qOH rad-
where k(i) is the partial rate
Q constant for a –CHJ. M. González-Sánchez et al.: Atmospheric loss of organic nitrates by aqueous-phase qOH oxidation 4925
signals associated with the geminal diol configuration and Table 3. SAR tests on organic nitrate parameters: five case tests
the ones associated with the carbonyl form. Details on these evaluated the nitrate group influence. Constraints imposed are the
experiments as well as the α-nitrooxyacetone NMR spec- following: values fixed to 1 (i.e., no influence on the reactivity)
tra are presented in Sect. S3. The hydration constant for α- marked by *; F(–ONO2 ) =G(–ONO2 ) for case 3 and case 4; and
nitrooxyacetone was determined to be Khyd = 0.048 ± 0.002 G(–ONO2 ) =H(–ONO2 ) for case 5. In bold is the selected case.
The slope is the correlation slope between the simulated and the
at 298 K.
experimental kOH rate constants, and R 2 is the corresponding cor-
3.3.2 Database for the extended SAR relation coefficient. The 1 factor is the relative difference between
the simulated and the experimental rate constant. Q is the sum of the
A dataset of 24 experimental kOH rate constants for lin- square difference between calculated and experimental values nor-
malized by the experimental uncertainties. Efficiencies at 75 % and
ear ethers and 8 for cycloethers from the literature comple-
60 % represent the percentage of organic nitrates with |1| < 0.25
mented by 7 organic nitrate kOH rate constants determined and |1| < 0.40, respectively.
in this work were used together to determine the contribu-
tion factors of each group. Table S4 compiles all compounds Case 1 Case 2 Case 3 Case 4 Case 5
with the corresponding values of experimental kOH rate con-
stants and their associated uncertainties. The rate constants of F(–ONO2 ) 0 0 0.17 0.18 0
qOH oxidation of all mentioned ethers were previously deter- G(–ONO2 ) 1∗ 0.33 0.17 0.18 0.37
H(–ONO2 ) 1∗ 1∗ 1∗ 0.92 0.37
mined using competition kinetic methods. The rate constants Slope 1.18 1.18 1.01 0.98 0.53
were recalculated considering updated values for the refer- R2 0.92 0.97 0.96 0.95 0.94
ence compounds. For the latter, recommended values were 1 −5.19 −0.14 − 0.19 0.05 2.06
chosen in most cases; however, when no recommendation Q 23.0 0.12 0.59 0.58 0.93
was mentioned in the literature or when more recent studies Efficiency 75 % 29 % 86 % 71 % 57 % 14 %
were published, average values were calculated (Table S1). Efficiency 60 % 43 % 100 % 86 % 86 % 43 %
Outlier values were discarded by using Dixon’s Q test.
The F, G, H, and X parameters were varied simultaneously
using the Microsoft® Excel® Solver routine to solve the mul- Table 4. SAR results: new calculated neighboring effects parame-
tivariate linear regressions in order to minimize the sum of ters for ethers, cyclic ethers and organic nitrates (using case 3 con-
the square difference between calculated and experimental straints).
values normalized by the experimental uncertainties (Eq. 9).
X (ki,exp − ki,sim )2 Parameter Value
Q= , (9)
i σi2 F(–O–) 1.10
G(–O–) 0.33
where ki,exp and ki,sim are the experimental and simulated C 0 5(ring) 1.43
kOH values, respectively, for compound i, and σi is the exper- C 0 6(ring) 1.79
imental uncertainty. This target Q value allowed us to give F(–ONO2 ) 0.17
priority, in the simulations, to experimental data determined G(–ONO2 ) 0.17
with low uncertainties, thus improving the reliability of the
SAR compared to the previous developments. The experi-
mental uncertainties were determined thoroughly for organic
nitrates (Sect. 4.2) and were directly used for the SAR. For second step, a test of different constraints on organic nitrate
ethers, the associated experimental uncertainties were recal- parameters was performed using the ether parameters esti-
culated by considering not only the linear plot uncertainties mated in the first step (for isosorbide 5-mononitrate). Due to
but also the uncertainties associated with the values for the the restricted database for organic nitrates, constraints were
reference compound, using the propagation of uncertainty. settled on for the values of F(–ONO2 ), G(–ONO2 ), and H(–
For the values reported with no uncertainty, we arbitrarily ONO2 ), and five different cases were tested (Table 3) in order
assigned a 100 % uncertainty to prevent an excessive contri- to find the best compromise between a minimum number of
bution of unclear determinations. This was the case, for ex- independent variables and a realistic parameterization of the
ample, for all the determinations reported in the works from possible long-range deactivating effects of the nitrate group.
Anbar et al. (1966) and Eibenberger (1980). The five different cases were developed to investigate if the
The preexisting parameters of the SAR were not modified, deactivating effect affects only the reactive sites in α posi-
and they were used as reported in Doussin and Monod (2013) tion to the nitrate group (case 1) or reaches the reactive sites
and Monod and Doussin (2008). To calculate the new pa- in β position (case 2 and case 3) or in γ position (case 4 and
rameters, in a first step, a rough estimation of the ether pa- case 5). In the final step, once the optimal case was selected,
rameters (F(–O), G(–O–), and X(–O–)) was performed using all the new parameters were simultaneously adjusted using
our dataset by starting from different initial conditions. In a the whole dataset (Table 4).
https://doi.org/10.5194/acp-21-4915-2021 Atmos. Chem. Phys., 21, 4915–4937, 20214926 J. M. González-Sánchez et al.: Atmospheric loss of organic nitrates by aqueous-phase qOH oxidation
3.3.3 SAR results
The results obtained for the five cases tested are shown in Ta-
ble 3. Different parameters were evaluated in order to choose
the optimal case. The correlation slope between the simu-
lated and the experimental kOH rate constants as well as their
correlation coefficient, the Q values, and the relative differ-
ence between the simulated and the experimental rate con-
stant was calculated for each organic nitrate using Eq. (10):
kexp − ksim
1= , (10)
kexp
where the sum of all the individual 1 factors is given in Ta-
ble 3. A value close to 0 indicates the absence of any signifi-
cant bias.
In all cases, each contribution factor for organic nitrates
which was varied resulted in a value lower than 1, and the
nearer to the nitrate group, the lower the value, confirm-
ing the deactivating effect of the group. Nonetheless, when
cases 1, 2, and 5 were run, the calculated value for F(–
ONO2 ) dropped to 0, meaning a total suppression of the H-
abstraction in the α position, which is unlikely, thus discard-
ing these three cases. In the two remaining cases (3 and 4),
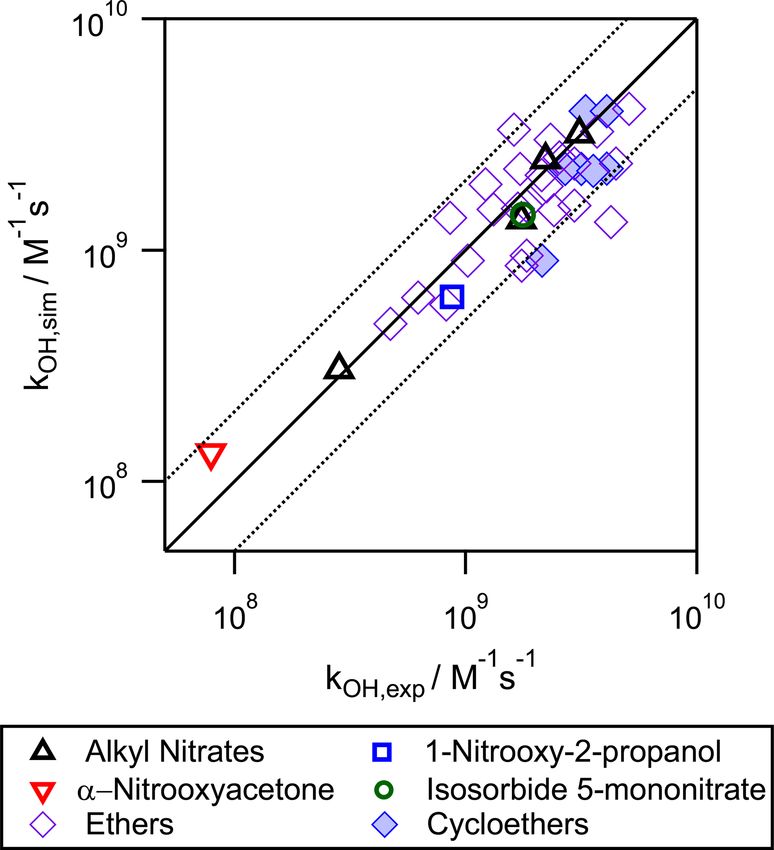
Figure 6. Correlation plot between the experimental and the sim-
the nitrate group impacts on the reactivity up to the β or the
ulated aqueous-phase qOH-oxidation rate constants for organic ni-
γ position, respectively. Most of the evaluation parameters trates and ethers. The solid line corresponds to the 1 : 1 regression,
are very similar in both cases, but case 4 is much less con- and the dotted lines represent the limits where the simulated rate
strained than case 3, which holds only one variable (Table 3). constants deviate from the experimental ones by a factor of 2.
Case 3 was thus selected as the optimal case. Furthermore,
the value obtained for H(–ONO2 ) in case 4 (0.92) is close
to unity, thus showing a very slight influence of the nitrate
group in the γ position, and the difference between this value range of reactivities (over 2 orders of magnitude). The effi-
and unity potentially falls in the experimental uncertainties. ciency of the proposed extended SAR for organic nitrates,
The results indicate that the impact of the nitrate group on ethers, and cycloethers was studied by calculating the rela-
the reactivity towards qOH radicals only affects the α- and tive difference between the simulated and the experimental
the β-reactive sites. This means that the reduced reactivity rate constants (1 factor, see Eq. 10). Overall, for 51 % of
(observed in Fig. 5) is caused by the electron-withdrawing the experimental values, the efficiency was better than 75 %
effect of the nitrate group which is enhanced in the aqueous (|1| < 0.25) and better than 60 % (|1| < 0.4) for 69 % of ex-
phase. perimental values. For organic nitrates, six out of the seven
In the final step, using case 3 constraints, all the new studied molecules presented an efficiency better than 60 %.
parameters were simultaneously adjusted using the whole Compared to the previous versions of the SAR tested for
dataset, and the results are listed in Table 4. The resulting other functional groups (Doussin and Monod, 2013; Monod
neighboring factors for organic nitrates are F(–ONO2 ) = G(– and Doussin, 2008), the efficiencies were slightly lower. This
ONO2 ) = 0.17. For ethers, the results show that F(–O– may be due to the way the SAR parameters were calculated
) = 1.10, which is a value higher than unity, and G(–O– in this work. While the previous SAR aimed at minimizing
) = 0.33, which is lower than 1. This reveals an influence 1 for a maximum number of values, in this work, a good ef-
similar to the –OH group, for which F(–OH) = 2.10 and G(– ficiency was prioritized for the experimental values with low
OH) = 0.44. For these groups, the α position is activating uncertainties using Eq. (9). Several arguments provide some
due to a positive mesomeric effect, whereas the β position is evidence on the reliability of the application of the SAR to
deactivating due to the oxygen electron-withdrawing effect. other compounds: (i) there are only a few discrepancies (de-
Furthermore, the resulting value for X(–O–) = 1.79 reflects viations by a factor of 2) between the experimental and sim-
that the presence of oxygen atoms in a ring increases the re- ulated values, even for low-weighted experimental values;
activity of the molecule. (ii) the resolved parameters were chemically coherent; (iii) a
Figure 6 shows the correlation between the calculated ver- wide range of reactivities were covered (2 orders of mag-
sus the experimental kOH values, and it is compared to the nitude); and (iv) the good agreement between the simulated
1 : 1 regression line. It shows good linearity covering a wide and the experimental kOH values (within uncertainties) for
Atmos. Chem. Phys., 21, 4915–4937, 2021 https://doi.org/10.5194/acp-21-4915-2021J. M. González-Sánchez et al.: Atmospheric loss of organic nitrates by aqueous-phase qOH oxidation 4927
isosorbide 5-mononitrate (Table 2). Being a highly complex conditions to wet aerosols, we evaluated the atmospheric
polyfunctional compound (bearing two ring, two ether, one phase partition of these 49 relevant organic nitrates, and we
alcohol, and one nitrate groups), its good result gives some estimated the importance of the qOH-oxidation reaction in
validation of the extended SAR application to polyfunctional the aqueous phase. Finally, the atmospheric multiphase qOH-
compounds. oxidation lifetimes of these compounds under cloud/fog con-
Due to the restricted database used here to build the ex- ditions were calculated and compared to their gas-phase life-
tended SAR, the –ONO2 contribution factors could not eluci- times.
date the differences between the F(–ONO2 ) and G(–ONO2 )
contribution factors. We acknowledge that the differences be- 4.1 Aqueous- and aerosol-phase partition of organic
tween the two factors may be significant as it happens for nitrates
the gas-phase reactions (Jenkin et al., 2018). In order to bet-
ter assess the detailed influence of the nitrate group to each The partition of atmospherically relevant organic nitrates be-
carbon, more experimental determinations of the kinetic rate tween the aqueous, gas, and aerosol phases was evaluated.
constants should be done for the reactivity of these com- The partition between the gas and aqueous phases was calcu-
pounds in the aqueous phase. However, as we have found lated using Eq. (11):
a good agreement between the simulated values and the ex- nX,gas ρW
perimental ones, the present SAR is useful to estimate the Kgas/aq = = , (11)
nX,aq LWC KH RT
importance of aqueous-phase qOH oxidation for organic ni-
trates in the atmosphere. where nX,gas and nX,aq are the number of moles of com-
The extended SAR was used to calculate the qOH- pound X that are present in the gas and aqueous phases, re-
oxidation rate constants of several atmospherically relevant spectively; ρW is the density of water (in g m−3 ); LWC is
compounds, such as hydroxy nitrates, isoprene nitrates, and the liquid water content (LWC in g m−3 ); KH is the effec-
terpene nitrates. The atmospheric fate of these molecules is tive Henry’s law constant (in mol L−1 atm−1 ); R is the ideal
discussed in the next section. gas constant equal to 0.082 atm L mol−1 K−1 ; and T is the
temperature in kelvin.
The partition between the gas and the aerosol phases was
4 Atmospheric implications calculated using Eq. (12):
In light of these results on the aqueous-phase qOH oxida- nX,gas
vap
Maer γX PX
tion of organic nitrates, we estimated the importance of these Kgas/aer = = , (12)
nX,aer Caer RT
processes in the atmosphere. We used the developed SAR to
predict the kOH rate constants of other atmospherically rel- where nX,aer is the number of moles of compound X that are
evant organic nitrates to evaluate if the aqueous-phase qOH present in the aerosol phase, Maer is the mean organic molar
oxidation has a significant role in their atmospheric lifetimes. mass in the aerosol phase (in g mol−1 ), γX is the activity co-
vap
Some of the evaluated organic nitrates have been detected in efficient of compound X, PX is its saturation vapor pressure
field campaigns (Beaver et al., 2012; Li et al., 2018); they (in atm), and Caer is the total organic aerosol mass concentra-
are expected products from isoprene or monoterpenes pho- tion (in g m−3 ). Combining Eqs. (11) and (12), one obtains
tooxidation (Lee et al., 2014), or they are small polyfunc- the fraction of any compound in each phase. The concentra-
tional nitrates that may be formed by the fragmentation of tion of a compound in each phase depends on the values of
vap
terpene nitrates or by the oxidation of alkyl nitrates (Picquet- KH and PX .
Varrault et al., 2020; Treves and Rudich, 2003). By select- The partition was studied for two representative atmo-
ing organic nitrates potentially relevant to atmospheric chem- spheric conditions: (i) under typical cloud/fog conditions
istry, as well as those mentioned in the literature, we listed with a LWC = 0.35 g m−3 (Fig. 7a) and (ii) under wet aerosol
49 compounds that were divided into seven categories de- conditions with a lower LWC = 3 × 10⁻⁵ g m−3 (Fig. 7b)
pending on their functionalization and chemical structure: 6 (Herrmann et al., 2015). The aerosol mass concentration
alkyl nitrates, 7 hydroxy nitrates, 7 ketonitrates, 5 aldehyde was set to Caer = 1 × 10⁻⁵ g m−3 with a Maer = 200 g mol−1
nitrates, 5 nitrooxy carboxylic acids, 7 other polyfunctional and T = 298 K. The values of KH were calculated using the
nitrates containing more than one oxygenated group, and 12 SAR developed by Raventos-Duran et al. (2010), and the
vap
terpene nitrates corresponding to highly oxidized organic ni- values of PX were calculated with the group contribution
trates formed by the oxidation of terpenes, such as α- and method by Nannoolal et al. (2004, 2008). Both values were
β-pinene, limonene, and myrcene. Table S5 appends all the taken from the GECKO-A website (http://geckoa.lisa.u-pec.
studied molecules and their chemical structures and proper- fr/generateur_form.php, last access: 16 May 2020). The ac-
ties under the scenarios studied below. tivity coefficient was assumed to be 1 due to the lack of ex-
Inspired by the work of Epstein and Nizkorodov (2012), perimental or simulated data, while, in a real organic aerosol,
considering various aqueous-phase scenarios from cloud/fog γX can range from 0.8 to 10 (Wania et al., 2014). It is worth
https://doi.org/10.5194/acp-21-4915-2021 Atmos. Chem. Phys., 21, 4915–4937, 20214928 J. M. González-Sánchez et al.: Atmospheric loss of organic nitrates by aqueous-phase qOH oxidation
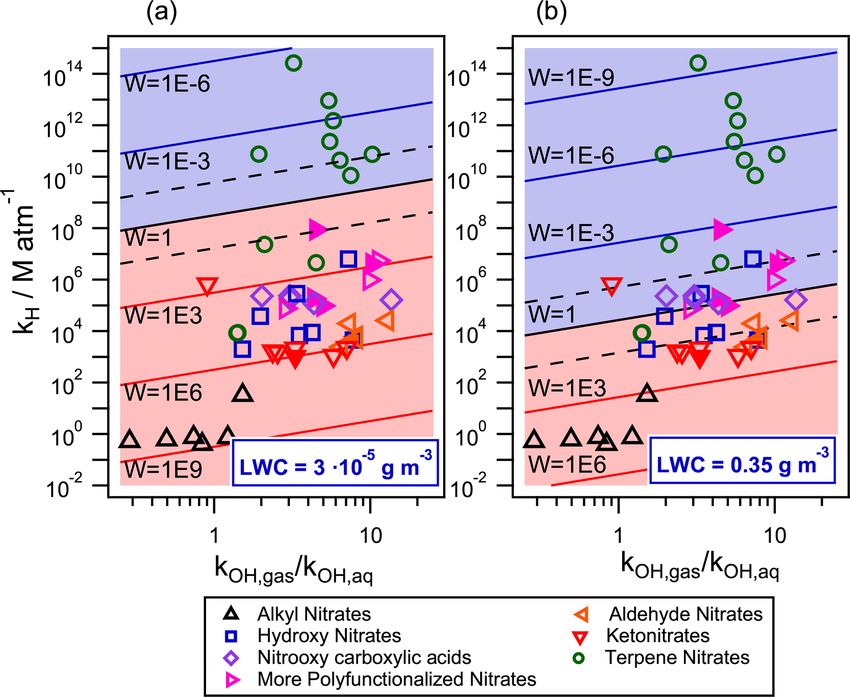
Figure 7. Partition of atmospherically relevant organic nitrates in the aqueous phase (blue), the gas phase (red), and the aerosol phase (green)
for two different air parcels with (a) LWC = 0.35 g m−3 (cloud/fog conditions) and (b) LWC = 3.5 × 10⁻⁵ g m−3 (wet aerosol conditions).
The temperature was set to 298 K and the aerosol mass concentration to Caer = 1 × 10⁻⁵ g m−3 with a Maer = 200 g mol−1 . The dashed
lines represent the limits where the concentration of one compound exceeds 95 % in each phase. Filled markers represent organic nitrates
derived from isoprene.
noting that, in the atmosphere, the equilibrium may not be to the aerosol phase is observed under these conditions. Un-
instantaneous. In their kinetic flux model, Shiraiwa and Se- der wet aerosol conditions (LWC = 3×10⁻⁵ g m−3 , Fig. 7b),
infeld (2012) demonstrate that equilibrium is achieved on the small organic nitrates are only present in the gas phase (red).
order of seconds or minutes for the phase partitioning of rela- High-molecular-mass compounds such as terpene nitrates
tively high volatility organic compounds into liquid particles, equally partition between the aqueous (blue) and the aerosol
while the equilibration timescale ranges from hours to days phases (green).
for semisolid viscous particles, low volatility species, or large These results show that, depending on their reactivity, the
particle sizes and thus can be subject to equilibrium shifts by compounds which mainly partition into the aqueous phase
faster chemical reactions in each phase. However, these con- may show a different atmospheric lifetime compared to the
siderations are beyond the scope of the study, as the goal was one assessed if only the gas-phase reactions are considered.
to determine how aqueous-phase chemistry can affect the fate
4.2 qOH-oxidation multiphase lifetimes of organic
of organic nitrates even at very low LWC. Thus, Eq. (12) was
used to understand if the partition into the aerosol phase is nitrates
important compared to the aqueous phase and the gas phase,
under the two investigated conditions. The atmospheric reactivity of each of the 49 organic nitrates
Figure 7 shows the partition of the selected 49 relevant with qOH radicals in the gas phase was compared to the
organic nitrates in the three phases. Under cloud/fog con- aqueous-phase one using the W value defined in Eq. (13):
ditions (LWC = 0.35 g m−3 , Fig. 7a), all compounds parti- dnX,gas
tion between the aqueous phase (blue) and the gas phase dt ρW kOH,gas [OH]gas
W= dnX,aq
= , (13)
(red). The presence of terpene nitrates in the aqueous phase LWC KH RT kOH,aq [OH]aq
dt
is highly significant: 10 out of the 12 studied molecules
are present in the aqueous phase in proportions higher than where kOH,gas and kOH,aq are the gas-phase and aqueous-
95 %. Under the same conditions, small functionalized ni- phase qOH-oxidation rate constants, respectively (in
trates (with five carbons or less) partition in both phases de- mol L−1 s−1 , with L being the volume unit of air and
pending on their functionalization. No significant partition atmospheric water for kOH,gas and kOH,aq , respectively).
[OH]gas and [OH]aq (in mol L−1 of air and mol L−1 of
Atmos. Chem. Phys., 21, 4915–4937, 2021 https://doi.org/10.5194/acp-21-4915-2021You can also read


