A review of demand prospects for LNG as a marine transport fuel
←
→
Page content transcription
If your browser does not render page correctly, please read the page content below

June 2018

        A review of demand prospects for LNG
                     as a marine transport fuel

OIES PAPER: NG 133                                Chris N Le Fevre
                             Senior Visiitng research Fellow, OIES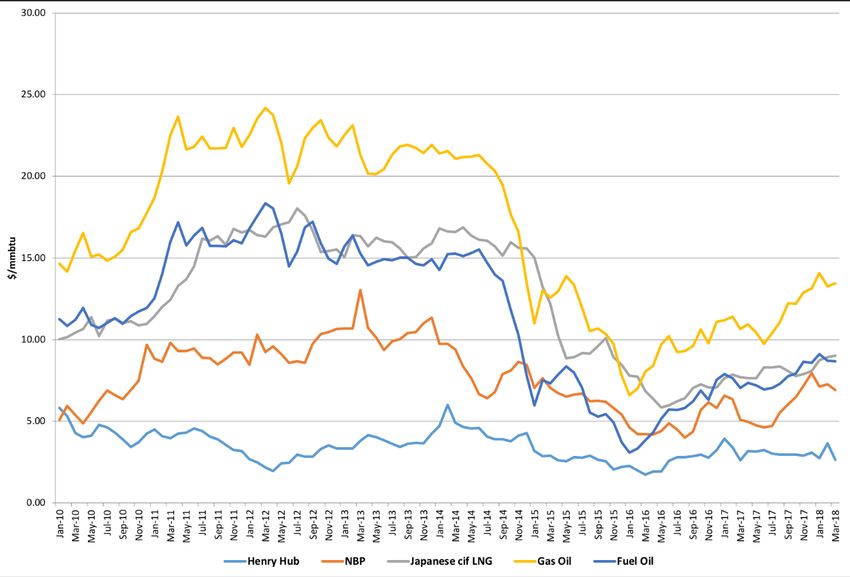
The contents of this paper are the author's sole responsibility. They do not
         necessarily represent the views of the Oxford Institute for Energy Studies or any of
                                            its members.

                                        Copyright © 2018
                               Oxford Institute for Energy Studies
                                (Registered Charity, No. 286084)

  This publication may be reproduced in part for educational or non-profit purposes without special
permission from the copyright holder, provided acknowledgment of the source is made. No use of this
  publication may be made for resale or for any other commercial purpose whatsoever without prior
                  permission in writing from the Oxford Institute for Energy Studies.

                                      ISBN 978-1-78467-114-3

                           DOI: https://doi.org/10.26889/9781784671143

                                                                                                  i
Acknowledgements
I would like to record my thanks for the help I have been given by many individuals in writing this
paper. I received much valuable input from experts in the use of natural gas as a transport fuel
working for sponsors of Oxford Institute for Energy Studies Gas Programme. I am also most grateful
to colleagues at the OIES who have provided many valuable insights and suggestions, especially Jim
Henderson, Howard Rogers and David Ledesma. I would also like to thank Liz Henderson for editing
the final document and Kate Teasdale for formatting and layout. Any remaining errors are fully my
own.

                                                                                                 ii
Contents
Acknowledgements ................................................................................................................................. ii
Contents ................................................................................................................................................. iii
Figures and Maps .................................................................................................................................. iv
1. Introduction and background .......................................................................................................... 1
2. A review of the factors underpinning the case for LNG in transportation .................................. 1
2.1 The environmental case for LNG .................................................................................................. 2
2.3 Barriers and uncertainties ............................................................................................................. 6
3. The global marine fuels market ....................................................................................................... 7
4. What drives the decision to switch to LNG and in which shipping sectors is it likely? ......... 11
4.1 The present LNG fleet ................................................................................................................. 11
4.2 The key factors supporting the use of LNG ................................................................................. 13
4.3 The most promising sectors for LNG ........................................................................................... 14
5. Forecast levels of LNG marine fuel usage ................................................................................... 17
6. LNG marine refuelling infrastructure ............................................................................................ 20
7. LNG in land-based transport.......................................................................................................... 22
8. Conclusions ..................................................................................................................................... 23
References ............................................................................................................................................ 25
Thinkstep (2017), Greenhouse Gas Intensity from Natural Gas in Transport, A study for the Natural
Gas Vehicles Association http://ngvemissionsstudy.eu/ ....................................................................... 26
Glossary ................................................................................................................................................ 27
Appendix A ............................................................................................................................................ 29
List of Tables
Table 1: Emission factors for marine fuels (g/g of fuel) .......................................................................... 2
Table 2: Well-to-Wake GHG emissions for different fuels ...................................................................... 3
Table 4: Global ship fuel consumption (million tonnes) .......................................................................... 8
Table 5 Global shipping fleet by category and tonnage for 2017 ........................................................... 9
Table: 6 Global fuel consumption by ship type in 2015 (bottom up) ..................................................... 10
Table 7: LNG fuelled vessels in use or under construction as at 1 May 2018 ...................................... 13
Table 8: Major container shipping lines ................................................................................................ 15
Table 9: Number of LNG vessels in operation or ordered/under construction ..................................... 17
Table 10: Forecasts of LNG consumption in the marine sector (mtpa) ................................................ 18
Table 11: LNG shipping new build requirement to meet 2030 forecasts of LNG consumption in the
marine sector ........................................................................................................................................ 19
Table 12: Approximate fuel consumption for the LNG tanker fleet ....................................................... 19
Table 13: LNG refuelling infrastructure in Europe ................................................................................ 21
Table A1: Container ships ..................................................................................................................... 29
Table A2: Bulk carriers .......................................................................................................................... 29
Table A3: Oil tankers............................................................................................................................. 30
Table A4: Cruise ships .......................................................................................................................... 30
iiiFigures
Figure 1: Total Fuel Cycle emissions per trip using modeled outputs .................................................... 3
Figure 2: Marine fuel price (NW Europe) comparisons with regional gas prices .................................... 4
Figure 3: Marine fuel price differentials with regional gas prices (Negative differential means gas is
cheaper) .................................................................................................................................................. 5
Figure 4: Global ship fuel consumption by fuel type (million tonnes LNG eq) .......................................... 9
Figure 5: Percentage global fuel consumption by ship type in 2015 (based on LNG eq, bottom up) ..... 11
Figure 6: LNG-fuelled vessels in use or under construction ................................................................. 12
Figure 7: Number of LNG fuelled ships required to be built per annum to meet a demand level of 20
mtpa LNGeq by 2030 for “average” and “high” consumption assumptions. ......................................... 18
iv1. Introduction and background
In 2014, OIES published a paper on the prospects for gas in the transportation sector with particular
focus on Europe. The paper concluded that prospects for gas were most promising in the marine
sector where environmental restrictions were pushing ship owners and operators to consider
alternatives to fuel oil.
Since then activity has certainly increased with a growing number of LNG bunkering sites and LNG
fuelled vessels being built. Growing concerns over air pollution from diesel road vehicles has also
given added impetus to land based applications for gas. The potential for significant volume growth in
natural gas demand seems greatest in marine, although in both sectors there is still much uncertainty
over pace and scale.
This study builds on the earlier report but specifically focuses on the overall prospects for LNG in
marine transport. The main focus is on the marine fuels market and a separate report, to be published
later in 2018, will look at the road and rail sectors for both LNG and CNG market. The reasons for
treating the two markets separately are:
Marine LNG is developing due to specific circumstances surrounding the International Maritime
Organisation (IMO) restrictions on fuel oil
The structure and operation of the marine market is very different to that pertaining in land
transport
Aside from the IMO-driven change in fuel standards the amount of state intervention in promoting
alternative marine transport solutions (with one or two notable exceptions) is relatively limited.
The decision to switch to LNG is therefore driven by a different set of metrics
A decision to switch to LNG by one or two large operators could lead to a rapid and significant
growth in demand that could have consequences for the global LNG market.
This paper aims:
To assess the most promising sectors for LNG in marine transportation in global shipping
markets.
To derive a set of metrics that could be used to generate forecasts of LNG demand in the marine
sector and to assess the validity of current forecasts
To assess the current state and planned state of LNG refuelling infrastructure and its impact on
market development
To briefly mention the comparative prospects for LNG in land-based transport.
As a precursor to this, the reader is reminded of the reasons why the case for LNG’s use as a
transport fuel has developed.
2. A review of the factors underpinning the case for LNG in transportation
The advantages of LNG over other transportation fuels was covered extensively in the earlier report
(Le Fevre 2013). This chapter briefly reviews these factors and updates the picture based on recent
operational and commercial developments. Some of the major barriers and uncertainties to LNG
adoption are also reviewed.
The two critical considerations are environmental factors and comparative fuel prices.
12.1 The environmental case for LNG
Natural gas has some significant environmental advantages over traditional petroleum products. This
is most notable in the use of LNG as a marine fuel rather than heavy fuel oil or marine diesel. LNG
typically produces lower emissions of carbon dioxide (CO 2) and virtually no nitrogen oxides (NOx),
particulate matter (PM), or sulphur oxides (SO x). A comparison of the emission factors for marine
fuels is shown in Table 1.
Table 1: Emission factors for marine fuels (g/g of fuel)
Emission HFO MDO LNG
SOx* 0.049 0.003 trace
CO2 3.114 3.206 2.750
CH4 trace trace 0.051
NOx 0.093 0.087 0.008
PM 0.007 0.001 trace
Source: IMO (2014)
*2012 figure based on average HFO sulphur content of 2.51 per cent
This latter feature is particularly important in the context of the IMO limits on sulphur in fuel oil. These
are presently 0.1 per cent in the mandated emission control areas (ECAs) in N America and the Baltic
and North Seas in Europe and 0.5 per cent globally from 2020. Today the global limit on sulphur
content is 3.5 per cent and 2016 figures from the IMO show that the yearly average sulphur content of
the residual fuel oils tested in 2016 was 2.58 per cent. The worldwide average sulphur content for
distillate fuel in 2016 was 0.08 per cent 1 so there could be significant disruption to traditional marine
fuel supply chains once the new limit comes into law, impacting on fuel suppliers, traders,
wholesalers, and users.
There are also NOx emissions standards for ship engines based on the year of installation on a
vessel. The application of these standards is also linked to the ECAs 2.
The attractions of LNG in terms of reduced SO x, Nox, and particulate matter are evident. LNG’s
advantages in terms of greenhouse gases (GHG) - CO2 and methane (CH4) - are less apparent
particularly when full cycle emissions and the impact of methane slip (the incomplete combustion of
natural gas during the utilisation stage) are included. Methane is a much more potent GHG than CO 2
though the methods for measuring its impact are subject to much debate 3.
The full cycle effects refer to the GHG emissions resulting from moving the gas from its source to the
vessel and then arising from its combustion. This approach - often referred to Well-to-Wake (WTW)
emissions – captures the environmental impact of gas production, transportation, and liquefaction
including the effects of methane emissions. Thomson et al (2015) have analysed the life-cycle
emissions of natural gas compared to traditional petroleum-based fuels in the marine sector and the
results for one of their simulations (a container ship travelling between Los Angeles and Honolulu and
back) is shown in Figure 1. From this evidence it is clear that LNG’s advantages in terms of air
pollution (SOx and PM) are not as great when compared with other fuels with regard to overall GHG
emissions.
1
http://www.imo.org/en/MediaCentre/HotTopics/GHG/Documents/2020%20sulphur%20limit%20FAQ%202018.pdf
2
See http://www.imo.org/en/OurWork/Environment/PollutionPrevention/AirPollution/Pages/Nitrogen-oxides-(NOx)-
%E2%80%93-Regulation-13.aspx
3
See Le Fevre 2017 for a detailed explanation of the impact of methane emissions
2Figure 1: Total Fuel Cycle emissions per trip using modeled outputs
.
Source: Thomson et al (2015)
A more recent study by Thinkstep (2017) for the Natural Gas Vehicles Association has assessed the
total WTW emissions for transport usage in the EU for both CNG and LNG. The results for LNG in
marine are summarised in Table 2 showing the proportion of CO2eq emissions that are due to
methane.
Table 2: Well-to-Wake GHG emissions for different fuels
Mode Fuel Oil Marine LNG 4- Of which LNG 2- Of which
diesel stroke methane stroke methane
Marine CO2eq/kwh 742 750 662 120 589 49
Source: Thinkstep (2017) - Note figures for LNG are based on dual fuel engines.
One growing area of potential emissions is ‘methane slip’ in the transport sector where gas-fired
engines are not able to fully combust all the methane which then escapes to the atmosphere.
Anderson et al (2015) measured the amount of methane in the exhaust of an LNG-fuelled ferry in the
Baltic Sea. This study reported around 7g per kg LNG at higher engine loads, rising to 23–36g at
lower loads – 0.7 per cent to 3.6 per cent. Thinkstep (2017) estimates methane slip to be in the region
of 0.13 - 0.16 per cent of the mass of gas consumed. The authors expect that this amount should be
reduced as engine designs are adapted specifically for natural gas as a fuel 4 , though dual fuel
engines are still likely to be susceptible to some degree of methane slip. The same study estimates
methane emissions of 0.05 - 0.2 per cent during fuel dispensing.
The use of biogas as a source for LNG would, of course, improve the fuel’s environmental
performance very significantly. Using biomass as a feedstock for LNG is a technical possibility though
significant financial support is necessary. There are a small number of projects under consideration,
4
The use of catalysts could significantly reduce the amount of unburned methane – see http://marigreen.eu/projects/lng-
methan-catalyst-for-lng-engines/
3mostly targeted at road transport 5. For marine, given the volumes required there are probably other
biofuel options that would be preferred.
2.2 The economic case for LNG
The cost of fuel is often a key consideration for ship operators and can represent between 60 and 80
per cent of total operating costs, with rising oil prices making fuel costs an even greater concern.
Marine fuels are generally sold free of any tax so price comparisons are relatively straightforward
though proxies have to be used for LNG as there are no published prices at present.
The most appropriate proxy for using LNG as a fuel in a particular market would be the associated
trading hub: Henry Hub for east coast US, and TTF or NBP for NW Europe. The two LNG markets are
different, however. In the US, the LNG price should be at a premium to HH as it will include the cost of
liquefaction and, in circumstances when the global LNG market tightens, include a further premium
reflecting this tightness (see Bros 2018). LNG prices in Europe on the other hand should, other things
being equal, be at a discount to TTF or NBP as they will exclude the costs of regasification and
network entry. In effect LNG users will be buying the fuel at a FOB price in the US Gulf of Mexico and
a DES price at Grain or Rotterdam. For Asian markets the published imported price of LNG to Japan
is probably the most appropriate proxy at the moment.
These complications may not be particularly relevant for buyers for as is noted below the trend would
appear to be for sellers to offer LNG at a fixed discount to published oil product prices. Nevertheless
the existence of differentials will still be important as it demonstrates that there is a margin to be
exploited from shifting to LNG.
Figure 2: Marine fuel price (NW Europe) comparisons with regional gas prices
Source: Argus
5
https://www.lngworldnews.com/snam-bhge-agree-micro-lng-infrastructure-development/
4Figure 3: Marine fuel price differentials with regional gas prices (Negative differential means
gas is cheaper)
Source: Argus
Figure 2 shows the evolution of the key prices in $/MMBtu. The commodity price of natural gas has
generally been cheaper than gasoil in Europe and the US whereas the differential between LNG and
fuel oil in Japan is generally narrower, which is to be expected given that the price of most Japanese
LNG is still linked to crude oil prices. Asian gasoil prices are typically 50 per cent higher than fuel oil
prices.
Figure 3 shows the differential with gasoil in the emission control areas of North America and Europe
and with fuel oil in Asian markets. The differentials have tended to narrow between 2015 and 2017
with the fall in oil prices.
Nevertheless, the discount of LNG over gas oil remains at least $5/MMBtu and this is likely to be the
most relevant differential once the IMO restrictions are introduced worldwide in 2020.
There are also operating cost advantages of using LNG compared to fuel oil as the cleaner fuel
means that engines and associated equipment will need less maintenance and last longer 6 though
the cost of conversion to adapt existing vessels, estimated at around $6 million, means LNG
retrofitting is unlikely to be practical7.
There is, of course, no guarantee that existing differentials will be maintained once the IMO
restrictions are introduced. The sudden excess of heavy fuel oil needing expensive sulphur-reducing
treatment coupled with a shortage of diesel (Young, 2018) could lead to major and unpredictable
swings in the relative spreads between gas oil and fuel oil.
6
See interview with Angus Campbell of the Schulte Group in https://www.platts.com/latest-news/shipping/singapore/interview---
-schulte-group-sees-distillates-as-26951772
7
https://www.drewry.co.uk/maritime-research-opinion-browser/maritime-research-opinions/lng-fuel-of-the-future Drewry have
assumed three cases for retrofitting in the existing fleet: 5%,10% and 15%
52.3 Barriers and uncertainties
Whilst LNG has some clear advantages over other fuels it is not the only solution. Ship operators
looking at the alternatives to fuel oil have two other options: low sulphur marine diesel, or sulphur
scrubbers with a further, as yet unpriced, possibility of low sulphur fuel oil 8.
Whilst sulphur scrubbers may be an attractive short -term option in some circumstances, they may not
represent a realistic long term option. Analysis from Drewry quotes a cost of $4 million to install
scrubbers which indicates that high sulphur fuel oil has to be at least $200/tonne cheaper than 0.5 per
cent low sulphur fuel oil or 0.1 per cent marine gasoil to justify the installation of scrubbers. However,
there are likely to be growing restrictions on the disposal of the sulphur-rich wash water and a
shortage of onshore facilities to handle it 9. It is reported that a number of large shipping operators
including Maersk and Teekay have already ruled out this option for this reason. Furthermore whilst
the IMO has agreed to exempt vessels with scrubbers from restrictions on the transport of non-
compliant fuels, local rules may make the handling and carrying of high sulphur fuels increasingly
difficult and expensive. This view is borne out by the evidence that only 300 vessels had installed
scrubber systems by March 201810 although more may convert as the 2020 deadlines nears.
The shipping market is still in the doldrums with an overhang of capacity despite some recent high
profile bankruptcies11. The IMO restrictions will be introduced worldwide in 2020 and this will add to
the market’s financial problems. Platts has estimated that a switch from fuel oil to diesel could cost a
typical container fleet operator an extra $1.5 billion annually, equivalent to an increase of
$93.75/TEU12. Maersk has predicted an increase in marine fuel costs of $10 billion for the container
sector and $50 billion for the shipping industry as a whole13. Many ship operators are reluctant to risk
significant investments in this climate and have adopted a “wait and see” approach.
The prevailing commercial and regulatory framework also reinforces this conservative approach. For
example, ship owners usually charter their vessels to operators and so do not benefit from any fuel
cost savings from switching to LNG.
The major LNG suppliers are likely to play an important role in helping ship operators overcome the
uncertainty over fuel price differentials by offering long term contracts with oil related prices. Such an
approach would mean that ship operators are locking in a fixed discount to a product they are already
buying whilst removing any risk associated with price spikes in the gas trading hubs. These contracts
could also include guarantees regarding physical delivery which removes another uncertainty in the
mind of the buyer whilst enabling the seller to recover the cost of infrastructure.
These pricing arrangements will also reduce the risk for LNG sellers, many of whom are paying for
some or all of their LNG at prices linked to oil. For example, of the 21 BCM per annum of LNG bought
by Gas Natural, 7 BCM comes from the US at prices linked to Henry Hub with the remainder related
to crude or oil product prices.14 Gas Natural has recently concluded a contract with ferry operator
Balearia to supply LNG for eleven years. Elsewhere a major seller is understood to be offering a 30
per cent discount to MGO for some long-term agreements.
8
For a comprehensive description of the alternatives available see Sharples J, forthcoming.
9
See https://ec.europa.eu/transport/sites/transport/files/acceptability_of_discharges_of_scrubber_wash_water.pdf
10
John D'Ancona of Clarksons Platou, speaking at the S&P Global Platts 5th Annual Asian Refining Summit in Singapore,
March 2018.
11
Hanjin container
12
Based on an operator shipping 16 million TEUs and buying 7.5 million mt of fuel annually, paying $200 per ton extra for fuel.
Figures quoted during Shipping and Bunker webinar, 6 September 2017.
http://s911.t.en25.com/e/er?utm_campaign=17BR02EMWBPM_Bunker%20Cross%20Sell%20Webinar_T7&utm_medium=ema
il&utm_source=Eloqua&s=911&lid=73907&elqTrackId=9d71225aa32d48c9b33449c214fc2675&elq=add6a7287ec84d07bc818
cd8e60d16de&elqaid=45684&elqat=1
13
https://www.platts.com/latest-news/shipping/singapore/marine-fuel-sulfur-cap-to-raise-costs-ban-non-10384957
14
Article in Natural gas World, March 2018, Vol 3 ,issue 6
6The willingness of the gas majors to make a proactive commitment to LNG marketing is therefore an
important component in overcoming some of the barriers and uncertainties. So far they appear to be
adopting a range of strategies. Shell and Total have demonstrated some major commitments. Shell
purchased 100 per cent of Norwegian LNG marketer GasNor in 2012 and Total has announced plans
to acquire Clean Energy, a California-based LNG supplier. Total has also purchased the LNG assets
of Engie, which after making much of the early running in Europe is now gradually withdrawing from
the downstream LNG market. In April 2018 it sold its LNG marketing business in Belgium and the
Netherlands to Titan15.
A further barrier has been the inconsistency between (and sometimes within) countries regarding the
licensing and control of LNG re-fuelling. Harmonising standards and operations across all prospective
markets is making progress. Organisations such as the Society for Gas as a Marine Fuel (SGMF) and
SEALNG have contributed significantly to the development of standardised approaches to safe
handling, custody transfer, and competency assessment 16.
Nevertheless LNG is still a new fuel for many port authorities and a lack of understanding of the key
differences with oil products is important. In volume terms LNG tanks need to be 80 per cent bigger
than those for high sulphur fuel-oil. More crucially, as a super-cooled fuel, stored LNG will continue to
evaporate until it is used. This means that it cannot be stored for extended periods without proactive
management. In many ways it is more akin to a perishable product than oil. Sizing of terminals can
also be quite complicated given the need to maintain sufficient reserves and heel volumes.
Accordingly logistical arrangements must be organised to reflect these points and develop a
comprehensive cryogenic supply chain. It will be harder to do this without a strong base-load
demand17.
There is also some uncertainty over the commercial regulatory framework governing LNG
infrastructure with some participants arguing that outlets should be regulated. DNV (2017) suggests
that there could be many providers of LNG storage and bunkering services making the market
potentially contestable. On the other hand the actual number and size of facilities may be limited, for
example, due to operational or physical constraints at ports or the relatively limited extent of total
demand. In these circumstances there may be a case for regulation of facilities including access and
capacity allocation rules.
A final barrier for gas is that it is not a zero carbon solution unless biogas is the source. As noted
above, this is unlikely to be the case for LNG though there are examples of biogas in the transport
supply chain for CNG fuelled cars and trucks.
Despite these uncertainties there is a clear level of interest from a number of major ship operators in
switching to LNG. In order to try and quantify what this might mean it is necessary to first gain a
clearer picture of the marine fuels market.
3. The global marine fuels market
This chapter analyses the global marine fuels market at the existing levels and types of LNG-fuelled
ships planned or in operation. It also considers typical levels of fuel usage for a variety of key vessel
types. In order to provide a meaningful basis for comparison, wherever possible fuel consumption
15
https://www.lngworldnews.com/titan-rolande-acquire-engie-lng-
solutions/?utm_source=emark&utm_medium=email&utm_campaign=daily-update-lng-world-news-2018-04-16&uid=21190
16
https://www.sgmf.info/shop
17
Some rules of thumb are a limit of 1500 nautical miles on the transportation of LNG by small tanker or 2500 km by truck
(Wartsila, 2018) and a maximum six weeks storage in smaller vessels (though in practice will probably be just one or two days).
7numbers have been converted to LNG equivalent (LNGeq) tonnes using appropriate conversion
factors18.
Data on marine bunkers is not always accurate due to differences in data classification and collection
methods. The IEA publishes global ship fuel consumption figures broken down by fuel type, for
example fuel oil and marine gas oil. These numbers are based on fuel sales data. Other researchers
have developed estimates of fuel consumption using the so-called bottom-up method. This approach
was adopted by UCL (IMO, 2014) on behalf of the IMO to calculate CO 2 emissions using Automatic
Identification System (AIS) data which tracks shipping activity on an hourly basis to develop a high
resolution dataset of fuel consumption 19. This work was updated in 2017 in a report published by the
International Council on Clean Transportation (ICCT) (Olmer et al 2017).
Both studies show that the bottom-up approach generates higher estimates of fuel consumption than
that produced by the IEA. Table 4 illustrates the difference. Whilst this shows that the gap is
decreasing as the accuracy of the two approaches improves, there are still some data issues and the
IMO is planning a fuel monitoring exercise to identify where the gaps might lie.
The top down estimates from the IEA do not distinguish between different categories of vessels.
Understanding fuel consumption by vessel type is an important consideration when determining the
prospects for LNG as different sectors display very different fuel consumption characteristics. The
ICCT study provides a much greater degree of granularity in terms of consumption by shipping type
and so these numbers are used for the analysis in this report.
Table 4: Global ship fuel consumption (million tonnes)
Source Method 2007 2009 2011 2013 2015
IEA Top down 258 246 264 254 265
IMO Bottom up 352 313 327 291 298
Source: ICCT (2017)
Figure 4 shows the breakdown of consumption by fuel category for the period from 2013 to 2015
illustrating the dominant share of fuel oil. A small amount of fuel -consumption - approximately 6.5
million tonnes - is classified as LNG of which around 97 per cent in consumed by LNG carriers,
presumably in the form of boil-off gas. The following section looks at the number of vessels already
using LNG.
18
Where 1 tonne of LNG contains 52 MMbtu, 1 tonne of fuel oil 40.7MMbtu and 1 tonne of marine gasoil 43.3MMbtu
19
For a description of how AIS works see Ricardo (2017)
8Figure 4: Global ship fuel consumption by fuel type (million tonnes LNG eq)
Source: ICCT
The United Nations Conference on Trade and Development (UNCTAD) classifies vessels into five
principal categories:
Oil Tankers
Bulk Carriers
General Cargo ships
Container ships
Other – this category includes gas carriers (28 per cent of DWT in this category), chemical
tankers (21 per cent), offshore vessels (37 per cent), ferries and passenger ships (3 per cent) and
other (11 per cent).
Table 5 shows the number of vessels by category and tonnage for 2017.
Table 5 Global shipping fleet by category and tonnage for 2017
Category Number of DWT (million) % of total Average
vessels DWT DWT/Vessel
Oil Tankers 10,152 535 28 52,685
Bulk Carriers 10,884 797 43 73,188
General Cargo 19,601 75 4 3,817
Container ships 5,154 246 13 47,654
Other 47,370 210 12 4,433
Total 93,161 1862 100 19,985
Source: UNCTAD 2017
9Analysis of the detailed spreadsheets accompanying the ICCT report makes it possible to calculate
fuel consumption in LNG equivalent terms and the average consumption for the different types of
vessel. The following graphs and tables provide this information.
The main categories are shown in Table 6 and Figure 5 in terms of total and average fuel
consumption.
Table: 6 Global fuel consumption by ship type in 2015 (bottom up)
Category Fuel consumed (million Number of Average consumption
tonnes LNG eq) vessels (tonnes LNG eq)
Container 52.5 5,009 10,491
Bulk carrier 43.6 10,650 4,097
Oil tanker 31.6 6,395 4,938
Chemical tanker 14.2 4,720 2,999
General cargo 13.2 10,973 1,202
LPG/LNG tankers 12.7 1,687 7,509
Cruise 9.6 477 20,170
Ferry (ro-ro and pax) 10.2 5,288 1,933
Vehicle/ro-ro 11.4 2,236 5,658
Service 8.8 25,317 397
Refrigerated 3.8 4,876 779
Offshore 3.5 785 4,477
Other + Unclassified 23.0 21,021 1,094
Total 238.1 99,434 2,393
Source: ICCT (columns 1 and 2) and author’s calculations (column 3) - Note conversion is on the following basis:
1 tonne of LNG contains 52 MMbtu, 1 tonne of fuel oil 40.7MMbtu and 1 tonne of marine gasoil 43.3MMbtu
10Figure 5: Percentage global fuel consumption by ship type in 2015 (based on LNG eq, bottom up)
Source: ICCT and author’s calculations
It is clear from Table 6 that the largest fuel consuming vessels are most likely to be oil tankers,
containerships, and bulk carriers though as noted below there are some sectors in the ‘other’ category
such as passenger ships that are of interest.
Within each sector there is a wide range of vessel types and therefore of consumption. For example
there are eight different categories of container ships classified in terms of their carrying capacity in
twenty-foot equivalent units (TEUs). The largest category are those ships with a capacity in excess of
14,500 TEUs. There are 68 vessels recorded on the ICCT database with an estimated average
annual consumption per vessel of nearly 30,000 tonnes of LNG equivalent. Appendix 1 presents
some greater detail on how consumption varies in these categories.
Fuel is not only consumed for propulsion but also for auxiliary engines. These vary by vessel
category: for bulk carriers 84 per cent of consumption is for the main engine, while for cruise ships it is
only 76 per cent. (Ricardo 2017).
4. What drives the decision to switch to LNG and in which shipping sectors is
it likely?
4.1 The present LNG fleet
There are a number of LNG-fuelled vessels (other than LNG carriers) already in operation or on order.
In gross tonnage terms the share of LNG-capable vessels delivered has grown from 1.4 per cent in
2010 to 5.7 per cent in 2017 (UNCTAD, 2017). This proportion rises to 13.5 per cent for those vessels
ordered and due to be delivered from 2018 onwards.
11Figure 6: LNG-fuelled vessels in use or under construction
Source DNV, 2018
According to DNV statistics, as at 1 May 2018 there were 122 LNG-fuelled ships in operation and 132
in construction or confirmed orders. The breakdown of these numbers by category is shown in Figure
6 and Table 7 with the latter providing some indicative fuel consumption numbers based on the ICCT
averages. Average numbers for the four shipping categories (container ships, oil and chemical
tankers, cruise ships, and ferry/ro-ro vessels) with the largest potential consumption have been split to
show the average consumption across all ship sizes, and average consumption if only the larger
vessel sizes are used. So for example in the case of container ships, average LNG consumption is
10,491 tonnes of LNGeq per annum if all vessel sizes are included. This average increases to 25,388
tonnes of LNGeq per annum if only vessels with a size in excess of 12,000 TEU are assessed. The
potential LNG consumption from those vessels in operation and under construction is therefore
assessed to be in the range of 1.3 to 3.0 million tonnes of LNG eq per annum. It should be noted that
these numbers exclude conventional LNG carriers and the liquefied gas tankers in the table refer to
multi-purpose product carriers20 primarily operating in the Baltic and North Sea.
20
See https://evergas.net/fleet/fleet-list-overview/ for examples of the type of ships
12Table 7: LNG fuelled vessels in use or under construction as at 1 May 2018
Proportion Potential LNG
In Under of total consumption
Operation construction fleet (‘000 tonnes)
Container 3 21 0.48% 251.8 to 609.3
Oil + Chemical tanker 10 33 0.40% 176.9 to 553.2
Bulk carrier 3 3 0.06% 24.6
Ferry & ro-ro 41 25 0.98% 149.8 to 466.9
General cargo 4 2 0.05% 7.2
Liquefied gas tanker 18 0 1.07% 135.2
Service/tug/psv 31 9 0.13% 16.3
Cruise 0 18 4.82% 463.9 to 1,154.7
Vehicle 2 2 0.49% 31.1
Other 9 17 0.12% 16.4
Total 121 135 0.26% 1,273 to 3,015
Source: DNV, ICCT, and author’s calculations
4.2 The key factors supporting the use of LNG
The use of gas as a marine fuel is most likely where some or all of the following economic and
legislative conditions are met:
The vessels operate primarily or exclusively in areas subject to the IMO limit on sulphur of 0.1 per
cent – the Emission Control Areas in N America and the Caribbean, and the Baltic and North
Sea21. Whilst all vessels will be subject to the 0.5 per cent cap from 2020, the existing 0.1 per
cent cap will make LNG an even more favourable option.
The vessels are large and so fuel requirements are high - this enables fixed infrastructure costs
to be more easily recovered and makes the vessels themselves a promising marketing prospect
Fuel costs represent a relatively high proportion of total operating costs so any savings from a
discount to gas oil will be material
The vessels have regular and predictable journey patterns. This is important as it will be easier to
plan for LNG refuelling on the assumption that facilities will not be as widespread as fuel oil,
particularly in the early stages of development. It also implies high levels of utilization which will
be important given the “perishable” nature of LNG.
Operators are also owners of their vessels. This means that the benefits arising from the
additional investment in LNG will be directly recouped by the owner rather than having to be
reflected in higher charter rates which may be harder to recover – particularly if the shipping over-
supply persists.
Vessels follow routes that allow easy access to LNG fuelling facilities.
21
http://www.imo.org/en/OurWork/Environment/SpecialAreasUnderMARPOL/Pages/Default.aspx
13 There is a relatively high level of vessel turnover – in other words, a high frequency of new build
or major re-fits. Whilst some vessels may be retro-fitted to use LNG, most are expected to be new
builds.
There is a relatively high level of auxiliary power demand and/or the vessel spends a relatively
long time docked rather than at sea – a particular characteristic of cruise ships. Many ports are
introducing rules on shore-to-ship power to reduce noise and environmental pollution, and studies
have suggested that LNG presents a credible alternative to shore-based electricity (see Burgio
and Pattichio, 2016)
The sector is characterised by a number of large companies with extensive world-wide
operations, for example container shipping and cruise lines. Larger companies are more likely to
be prepared to make a strategic commitment to invest in a new fuel source such as LNG and will
in turn represent a more attractive prospect for LNG marketers.
There are high levels of government support for new investment favouring vessels using LNG.
These requirements are not “must haves” and their relative importance will vary. For example 50 per
cent of the existing LNG vessels are operating in Norway. These ships represent a wide range of
usage segments and, in this case, demonstrate the importance of state involvement which has been
very proactive in the case of Norway22. Elsewhere there has been relatively limited direct state
support for LNG shipping although in September 2017 Germany announced that Eur 278 million
would be made available to 2020 to subsidise the conversion and construction of ocean-going vessels
to LNG23, and South Korea has indicated it will provide around 10 per cent of the cost of new LNG-
fuelled bulk carriers24.
4.3 The most promising sectors for LNG
The conditions outlined in the previous section suggest that the most promising markets would be
large container vessels, cruise ships, bulk carriers, and ferries together with most types of vessels
spending all or most of their time operating in the Baltic/North Sea region or coastal North America.
Other categories that might fit some of the foregoing conditions include tugs and dredgers in ports
with LNG bunkering facilities. The main sectors are examined in more detail below.
Container ships
The container shipping sector is the largest in terms of fuel consumption and, arguably, the key
bellwether for shipping. It is characterised by high and growing levels of concentration with the top ten
carriers providing 75 per cent of shipping capacity in 2017 compared to 62 per cent in 2011 25. Recent
mergers include the combination of COSCO and China Shipping, Hapag Lloyd with United Arab
Shipping, and Maersk’s takeover of Hamburg Sud. The major players are shown in Table 8.
22
See for example https://www.maritime-executive.com/article/norway-launches-green-shipping-project#gs.VRfYtPI
23
http://www.bmvi.de/SharedDocs/DE/Anlage/G/erster-foerderaufruf-lng.pdf?__blob=publicationFile
24
https://www.lngworldnews.com/south-korea-confirms-push-to-revitalize-lng-
bunkering/?utm_source=emark&utm_medium=email&utm_campaign=daily-update-lng-world-news-2018-05-18&uid=21190
25
https://crucialperspective.com/global-container-shipping-outlook-2017/
14Table 8: Major container shipping lines
Company Domicile Market share (2017 Number of vessels
approx)
Maersk Denmark 16% 621
MSC Switzerland 14.6% 469
CMA CGM France 11.1% 441
COSCO China 8.0% 277
Hapag Lloyd/UASC Germany 7.9% 236
NYK/MOL/K-Line Japan 7.1% 243
Total 64.7% 2,287
Source: UNCTAD 2017, DHL26
Despite the wave of mergers and consolidation plus the bankruptcy of Hanjin Shipping, over-supply
persists. This means that the tendency for high levels of new vessel turnover has reduced with Platts
reporting an orderbook-to-fleet ratio of 12 per cent in 2017 compared to a peak of 64 per cent in
200727. The outlook for the sector is further clouded by concerns of a global trade war and a return to
regionally based manufacturing.
Despite these negative factors the prospects for LNG shipping in this sector appear promising with
the DNV monitor (2018) showing 21 vessels on order. These include those being built by French
container shipping company CMA CGM which has announced that all of its new vessels will be
equipped to run on LNG. Total has agreed to supply these ships with around 300,000 tonnes/year of
LNG bunker fuel for ten years from 202028. In April 2018 Maersk said it had no plans to build any new
container vessels though if it were to order new ships it “would definitely consider having LNG-fuelled
ones”29. The company has ruled out sulphur scrubbers and LNG retro-fit for its existing vessels and
will use ULSFO and MGO.
Bulk Carriers
Bulk carriers account for the vast majority of international seaborne trade in terms of tonnes loaded.
The main commodities carried are iron ore (29 per cent of tonnes loaded in 2017), coal (23 per cent),
grain (10 per cent), steel (8 per cent) and forest products (7 per cent) (UNCTAD 2017). In 2015 a
50,000 DWT LNG-fuelled carrier was commissioned to transport limestone for South Korean
steelmaker POSCO. Larger (180,000 and 250,000 DWT) carriers are being designed by South
Korean shipbuilders for deep water traffic such as iron ore shipments from Australia. Analysis of ICCT
data indicates that the largest category of vessel consumes around 10,000 tonnes/year of LNG on an
equivalent fuel basis.
Oil, Gas, and Chemical tankers
Tankers can include crude oil, oil products, chemicals, and gas – both LNG and LPG. Crude oil
accounts for 60 per cent of shipments in terms of tonnes loaded in 2016 and oil products a further 28
per cent (UNCTAD 2017). Crude oil tankers may not however present a particularly promising market
for LNG. The proportion of owner-operators is less than in some other sectors and the existing fuel
supply arrangements are likely to be easily adapted to take lower sulphur fuel oil. For example,
26
https://globalmaritimehub.com/wp-content/uploads/2018/05/dhl-ocean-freight-market-update-apr2018.pdf
27
https://www.platts.com/latest-news/shipping/singapore/marine-fuel-sulfur-cap-to-raise-costs-ban-non-10384957
28
http://www.lngworldnews.com/cma-cgm-picks-lng-fueled-engines-for-its-
newbuilds/?utm_source=emark&utm_medium=email&utm_campaign=daily-update-lng-world-news-2017-11-08&uid=21190
29
https://www.platts.com/latest-news/shipping/singapore/marine-fuel-sulfur-cap-to-raise-costs-ban-non-10384957
15Teekay Shipping has indicated that it will be opting for a distillates-based solution for most of its fleet
as retrofitting for sulphur scrubbers or LNG is too expensive 30.
Although LNG tankers only account for 9 per cent of tanker shipments they are clearly important in
this context due to the significant use of boil-off LNG as a fuel. As Rogers (2018) has recently pointed
out, there has been a switch from traditional steam turbine propulsion to more efficient duel-fuel diesel
engines (DFDE). A fully laden DFDE vessel can sail using only LNG from natural boil-off – though in
order to optimize fuel consumption at the required vessel speed, a mix of LNG and fuel oil is usually
consumed31.
Cruise Ships
The cruise shipping sector is not large in terms of its proportion of total vessels though individual
ships are big with very high fuel consumption. For example, vessels in excess of 100,000 gross
tonnes are calculated to have an average fuel consumption of around 60,000 tonnes/year of LNG on
an equivalent fuel basis. Furthermore, the nature of cruise shipping means that operators are more
exposed than most other sectors to scrutiny regarding their environmental footprint. As a
consequence a number of operators have committed to using LNG and in March 2017 97 cruise ships
were on order, of which 13 were to be dual-fuelled by LNG. This represented around 25 per cent of
the gross tonnage on order in the cruise ship sector suggesting that larger ships are more favoured
for LNG usage32.
The largest player in the sector, Carnival Cruise Lines, has seven LNG-fuelled cruise ships on order
with delivery dates between 2020 and 2022. When operational, these could have a combined LNG
fuel requirement of 300,000 tonnes of LNG per annum. It should be noted that the company has a
total annual fuel usage of 3.2 million tonnes, 78 per cent of which was HSFO in 2016, and so could,
alone, represent a very significant long-term market for LNG33. In 2017 the company announced a
framework agreement with Shell to supply LNG for its two new North American cruise ships to be
delivered in 2020 and 2022 34 . Another important factor is that on average, a cruise ship spends
around 40 per cent of its operating time in a port. Some ships are already using LNG for their energy
requirements at this time35.
Ferries and associated sectors
With their regular and intensive journey patterns it is unsurprising that large ro-ro ferries, particularly
those operating in ECAs such as the Baltic, have been early adopters of LNG as a fuel. A typical
example is Fjord Line which has been operating LNG-fuelled ferries between Norway and Denmark
since 2013. Other examples include the Megastar ferry sailing between Tallinn and Helsinki and US
operator TOTE which has converted two of its ships to dual-fuel operation on LNG36.
A separate but similar category of ships is car carriers: these are a specialised form of ro-ro vessel
that ship passenger cars. United European Car Carriers (UECC) operates two dual-fuelled car and
truck carriers between Southampton and St. Petersburg. Another company, SIEM, is introducing two
similar vessels in 2019 to ship VW cars from Europe to the USA.
30
Singapore (Platts)--19 Mar 2018 310 am EDT/710 GMT
31
An example of this technology is the so-called MEGI engine (M-type, Electronically Controlled Gas Injection) – see
https://www.flexlng.com/megi-propulsion/
32
http://www.passengership.info/news/view,lng-rapidly-accelerates-in-cruise-sector_47023.htm
33
See http://carnivalsustainability.com/download-files/2016-carnival-sustainability-full.pdf p 80
34
https://www.lngworldnews.com/shell-to-fuel-carnivals-lng-powered-cruise-
ships/?utm_source=emark&utm_medium=email&utm_campaign=daily-update-lng-world-news-2017-11-09&uid=21190
35
https://www.aida.de/en/aida-cruises/responsibility/aida-cares-2016/environment.33010.html
36
http://www.lngworldnews.com/tote-contracts-man-for-lng-engine-
conversions/?utm_source=emark&utm_medium=email&utm_campaign=daily-update-lng-world-news-2017-11-10&uid=21190
165. Forecast levels of LNG marine fuel usage
This chapter provides a review of recent forecasts of LNG uptake in the marine sector and suggests
some metrics for assessing these forecasts as the market evolves.
Earlier expectations of rapid growth in demand have not materialised. In 2012 DNV forecast that there
would be over 1,000 LNG fuelled vessels by 2020. This was revised to between 400 and 600 in 2015
and the latest numbers suggest a fleet of below 300 by that time.
Lower oil prices and a slower than expected development of infrastructure were cited as the main
reasons, though uncertainty over the evolving regulatory scene and the general downturn in new ship
building are also likely factors. Indeed, the continued overhang of shipping capacity in most sectors
could persist for some years37.
Forecasting LNG’s share of the maritime market is complicated by the dynamics of overall demand
and supply in the shipping sector. Global demand for shipping capacity is expected to grow though
how this translates into fuel requirements will depend on how fuel efficiency (both through more
efficient engines and larger ships) evolves and operational factors such as vessel utilisation and
average speeds.
The situation is further complicated by tightening environmental regulations which will generate a
range of responses. For existing vessels a range of abatement technologies are available and ship
operators have the choice of switching fuels, installing scrubbers, or retrofitting to utilise LNG. As the
2020 deadline draws closer, more clarity on fuel availability options is starting to emerge. Platts
reports 38 that a number of refiners have announced plans to produce 0.5 per cent sulphur fuels
though arriving at a common standard for such fuels will be challenging and a range of products are
likely to emerge.
As noted earlier, retrofitting for LNG is an unlikely option in the majority of cases. Consequently LNG
demand in the sector will primarily be driven by new builds and so the number of LNG-fuelled vessels
under construction is a useful leading indicator. Furthermore there are relatively few sectors where a
switch to LNG will have a major impact of consumption volumes.
Table 9 shows how the number of LNG-fuelled vessels has evolved in recent years and as in Table 7,
indicates a fleet of around 250 vessels which could equate to an annual consumption of between 1.2
and 3 million tonnes excluding consumption by LNG tankers. The total fleet continues to grow though
the rate of growth shows no particular signs of accelerating.
Table 9: Number of LNG vessels in operation or ordered/under construction
LNG fuelled Jan May
2010 2012 2014 2016
vessels 2018 2018
In operation 21 35 56 77 119 122
Ordered/under
n/a n/a n/a 85 125 132
construction
Total 21 35 56 162 244 254
Source: DNVi
37
http://www.shipfinance.dk/media/1764/shipping-market-review-november-2017.pdf
38
http://blogs.platts.com/2018/04/02/uncertainty-looms-marine-fuel-sulfur-limit/
17Table 10 shows some recent forecasts for LNG demand in the maritime sector. Again this excludes
consumption by LNG tankers39.
Table 10: Forecasts of LNG consumption in the marine sector (mtpa)
Source 2025 2030 2035 2040
IEA - Sustainable
Development 11.6 18.8 26.8 37.0
IEA - New Policies 23.9 29.7 36.2 41.3
ENGIE/PWC 24-30
Lloyds Register 8-30 10-40 15-45 20-65
Source: IEA WEO 2017, PWC, Lloyds Register 2017
The broad consensus is of a demand level between 20 and 30 mtpa (28 and 40 bcm) per annum by
2030. The Lloyds Register study has a wider range which in part reflects a more extensive range of
alternative scenarios in which hydrogen and biofuels also feature.
The forecast range for 2030 is a significant increase on today’s levels and whilst it is quite feasible, it
will require an increase in the trend of new builds. Table 11 shows that to reach 20 mtpa would
require between 170 and 400 new shipping builds every year to 2030. An indication of how this level
of activity compares with the number of new builds to date is shown in Figure 7. In this chart the “high
consumption” assumption means that fewer ships need to be built to reach the same level of demand.
Figure 7: Number of LNG fuelled ships required to be built per annum to meet a demand level
of 20 mtpa LNGeq by 2030 for “average” and “high” consumption assumptions.
Source: DNV, ICCT and author’s calculations
We have seen that the major consuming vessels are container ships and cruise lines. These are
clearly good prospects for the LNG market and a relatively small number of vessels can make a big
difference to the level of demand. If we assume that 80 per cent of the growth in demand comes from
such large vessels, the approximate number required to be built over the coming decade is shown in
39
The IEA forecasts do not explicitly exclude LNG carriers but this is assumed to be the case as the numbers quoted for LNG
consumption in the sector in 2016 are zero.
18Table 11. So to reach 80 per cent of the forecast of 20 mtpa would require 23 new large cruise ships
or 46 new large container ships to be built per annum. So an annual mix of, say, 5 new large cruise
ships plus 10 new large container ships plus 15 other large vessels such as bulk carriers, ferries, etc.
would meet the 20 mtpa forecast. On balance the view at present is that the forecast range is
reachable though challenging, and a demand level of around 15 mtpa by 2030 may be more realistic.
Furthermore given the lead times involved it will become apparent by the early 2020s if the targets
can be reached.
Table 11: LNG shipping new build requirement to meet 2030 forecasts of LNG consumption in
the marine sector
Demand level by 2030 20 mtpa 30 mtpa
Number of new builds per annum “average” consumption 400 600
Number of new builds per annum “high” consumption 170 255
Number of new large container ships built per annum* 46 69
Number of new large cruise ships built per annum* 23 34
Source: Author’s calculations
*Approximate number of new builds required to meet 80 per cent of the forecast level of demand
Some points to note:
An additional 111 LNG-ready vessels are under construction. These could be readily adapted to
use LNG so represent some potential upside.
The forecasts exclude LNG tanker consumption (see below).
Not all LNG demand will be met by the global LNG market as some will be sourced from locally
liquefied gas as in Norway and Denmark.
As noted above the forecasts exclude LNG tanker consumption and post 2020 it may make
commercial sense to increase the amount of fuel used as boil-off rather than high priced marine
diesel. Table 12 presents some very approximate estimates of the potential size of this market by
assuming that all LNG carriers were to switch exclusively to using LNG. Rogers (2018) has noted that
the amount of fuel used per vessel will vary depending on the engine configuration (steam turbine or
dual fuelled) and its average speed. Table 12 assumes that the LNG fleet grows in line with the IEA
(2017) forecast and the proportion of DFDE vessels grows over time. It can be seen that if all LNG
carriers were to use boil-off LNG only, this alone could represent around 17 mtpa of demand by 2030.
An LNG-only fuel policy is, however, unlikely as the trade-offs between total fuel costs and cruising
speed are likely to continue to make some oil product consumption economically attractive.
Table 12: Approximate fuel consumption for the LNG tanker fleet
LNG tankers Total fuel consumed
Year
Total fleet of which DFDE in MT LNGeq
2015 478 230 13
2020 550 302 14
2025 600 352 15
2030 750 502 17
2035 850 582 19
2040 950 632 22
Source: Author’s calculations derived from Rogers (2018) assuming: 55 Tonnes/day LNG equivalent for DFDE;
115 Tonnes/day LNG equivalent for ST – 300 days steaming /year at an average speed of 16.5 knots.
19There are also a number of factors that could reduce the longer term prospects for LNG. It is highly
likely that fuel oil and gas oil will still play a major role in marine transport – particularly if there is no
further tightening of the IMO restrictions. The industry is likely to recognize that the most effective way
of removing sulphur is to do so at the refining stage and as more LSFO becomes available it could be
very competitive with LNG.
Perhaps more importantly, LNG does not provide a long term and durable solution to low carbon
shipping. The IMO (2014) reports that emissions from shipping were in the region of 1 Gt per annum
in 2012. This equates to some 2.3 per cent of global emissions according to a report from Lloyds
Register (2017) which notes that given the lack of progress in decarbonizing, marine transport is likely
to become an increasing proportion of total global emissions over time. In April 2018 the IMO’s Marine
Environment Protection Committee (MEPC) set a target for reducing average CO 2 emissions from
international shipping by at least 50 per cent by 2050 40. In commenting on this decision, Smith (2018)
notes that from 2030 it is highly unlikely that new ocean-going vessels will be dependent on fossil
fuels and new builds in the 2020s will need to be able to switch to non-fossil fuels later on. This
knowledge will also impact on decisions made by insurers and shipping financiers and so could
severely restrict the growth in LNG usage post 2030.
The levels of emissions growth could be mitigated and in time reduced through adopting a range of
innovative technologies including batteries, ammonia, hydrogen, and biofuels. It is possible that in
some markets LNG from biogas may feature, though there are a range of other bio fuel options in
marine. These include biodiesel (from rapeseed oil or lignocellulose), bio fuel oil (from rapeseed oil),
bio-hydrogen, and bio-methanol (both from lignocellulose or wood biomass).
LNG would still have a role to play though whether long term growth can be sustained is open to
some doubt. Some players may see LNG as something of a cul-de-sac and decide to stick with oil-
based fuels until a fully zero-carbon option becomes viable.
6. LNG marine refuelling infrastructure
Lack of re-fuelling infrastructure has frequently been identified as one of the major barriers to the
development of this market. The capex requirements for bunkering are estimated by PWC (2018) at
Eur 30 - 60 million for a port storage facility with a capacity of 6,000 to 15,000 cubic meters, and Eur
30 – 40 million for a bunkering barge with a capacity of 3,000 to 10,000 cubic meters. This may
restrict smaller ports from providing marine bunkering facilities though road-based refuelling would
remain an option. The capital costs for road transportation are relatively lower at an estimated Eur
600,000 for a refuelling station.
These challenges of infrastructure development were often referred to as the “chicken-and-egg”
problem whereby market growth was constrained by the lack of LNG re-fuelling infrastructure and this
low growth was in turn inhibiting risk-based investments in the necessary infrastructure.
It is, however, arguable that this issue is unlikely to be a major constraint going forward. The evidence
from Europe suggests that if there is sufficient market potential, infrastructure provision will be
relatively rapid and will almost certainly exceed the build-up in demand capacity. This reflects:
Decisions to switch vessels to LNG have a relatively long lead time and re-fuelling infrastructure
can usually be made available relatively quickly, particularly where there are pre-existing LNG
handling facilities in place.
40
http://www.imo.org/en/MediaCentre/MeetingSummaries/MEPC/Pages/MEPC-72nd-session.aspx
20You can also read