Environmental fluctuation and shifting predation pressure contribute to substantial variation in early marine survival of steelhead
←
→
Page content transcription
If your browser does not render page correctly, please read the page content below
Vol. 662: 139–156, 2021             MARINE ECOLOGY PROGRESS SERIES
                                                                                                 Published March 18
https://doi.org/10.3354/meps13606               Mar Ecol Prog Ser

                                                                                                  OPEN
                                                                                                  ACCESS

 Environmental fluctuation and shifting predation
pressure contribute to substantial variation in early
           marine survival of steelhead
   Megan E. Moore1,*, Barry A. Berejikian1, Correigh M. Greene2, Stuart Munsch3
                       1
                        Environmental and Fisheries Sciences, National Marine Fisheries Service,
     National Oceanic and Atmospheric Administration, 7305 Beach Drive East, Port Orchard, Washington 98366, USA
      2
       Fish Ecology Division, National Marine Fisheries Service, National Oceanic and Atmospheric Administration,
                             2725 Montlake Boulevard East, Seattle, Washington 98112, USA
   3
    Ocean Associates Inc., Under Contract to National Marine Fisheries Service, 4007 North Abingdon Street, Arlington,
                                                   Virginia 22207, USA

      ABSTRACT: Steelhead Oncorhynchus mykiss smolts must migrate through distinct freshwater,
      estuarine, and coastal habitats, each with unique biological and physical characteristics, on their
      route from natal streams to the ocean to complete their life cycle. Fewer than 15% of steelhead
      smolts survived their migration from the Nisqually River through Puget Sound to the Pacific
      Ocean from 2006 to 2009 and in 2014. Rapid smolt migration coupled with evidence of smolt mor-
      tality at harbor seal Phoca vitulina haulouts during 2014 indicated that predation by pinnipeds
      was an important source of mortality. When Puget Sound temperatures increased with the North-
      east Pacific marine heat wave from late 2014 to 2016, steelhead smolt survival probabilities
      increased to 38% in 2016 and 2017, then decreased again as Puget Sound water temperatures
      cooled. Many ecological changes accompanied the increased marine temperatures, including the
      increased abundance of northern anchovy Engraulis mordax in Puget Sound. The years of lowest
      smolt mortality coincided with abundant larval and post-larval anchovy during the previous year;
      and we provide data from telemetered harbor seals and steelhead indicating that the resulting
      high abundance of age-1+ anchovy provided an alternative prey source for predators of migrating
      steelhead smolts. Identification of ecological mechanisms that drive patterns in the survival of
      Endangered Species Act-threatened steelhead provides critical understanding of the systems
      within which management strategies must operate.

      KEY WORDS: Climate · Predator−prey dynamics · Steelhead survival · Migration · Oncorhynchus
      mykiss

                 1. INTRODUCTION                               2009, Keister et al. 2011), including marine survival
                                                               patterns of anadromous Pacific salmon (Oncorhyn-
   Marine ecosystems are fundamentally influenced              chus spp.; Mantua et al. 1997, Hare et al. 1999, Mal-
by broad-scale climate patterns. Indices of ocean cli-         ick et al. 2017) and steelhead O. mykiss (Welch et al.
mate variability, such as the Pacific Decadal Oscilla-         2000, Sobocinski et al. 2020). Patterns of association
tion (PDO), El Niño−Southern Oscillation, and North            between salmon survival and ocean environmental
Pacific Gyre Oscillation, have been linked to fluctua-         conditions are inherently difficult to characterize,
tions in marine species at various trophic levels              because relationships between physical and biologi-
(Brodeur et al. 1985, Clark & Hare 2002, Menge et al.          cal ecosystem components can shift over time
                                                               Outside the USA © The US Government 2021. Open Access
*Corresponding author: megan.moore@noaa.gov                    under Creative Commons by Attribution Licence. Use, distribu-
                                                               tion and reproduction are unrestricted. Authors and original
                                                               publication must be credited.
                                                               Publisher: Inter-Research · www.int-res.com
140                                     Mar Ecol Prog Ser 662: 139–156, 2021

(Beamish et al. 2004, Kilduff et al. 2014, Litzow et al.    from acoustic tag detection patterns in large river
2018) and space (Mueter et al. 2002, Teo et al. 2009,       estuaries and at rocky haulouts in central and north-
Sharma et al. 2013). A single salmonid cohort en-           ern Puget Sound (Berejikian et al. 2016, Moore & Bere-
counters diverse marine ecosystems (i.e. estuary,           jikian 2017). A thorough predator assessment identi-
nearshore, continental shelf, open ocean), each with        fied harbor seals as a likely predator of steelhead
its own suite of physical and biological processes and      smolts in Puget Sound (Pearson et al. 2015), and scat
inherent climate−survival linkages. Ecosystem dynam-        analysis of Salish Sea samples confirm harbor seal
ics involving both bottom-up and top-down control of        consumption of steelhead during the steelhead outmi-
survival patterns near the point of ocean entry are         gration period (Thomas et al. in press). Other poten-
increasingly being considered as important compo-           tial warm-blooded predators of migrating steelhead
nents of the marine survival equation (Sydeman et al.       smolts include harbor porpoise Phocoena phocoena
2013, Wells et al. 2017, Sobocinski et al. 2020).           and a few avian predators that consume fish prey of
Understanding the influence of climate variation on         this size (cormorants [Phalacrocorax spp.], Caspian
interactions among living marine resources is vital to      terns Sterna caspia, and loons [Gavia spp.]).
proper consideration of ecosystem-based manage-                Increasing ocean temperatures associated with cli-
ment strategies.                                            mate change have diverse and profound effects on
   Declines in the abundance of several anadromous          the distribution and phenology of marine species
Pacific salmonid species within the ‘Salish Sea’ (the       (Doney et al. 2012, Poloczanska et al. 2016). Follow-
network of inland waters of British Columbia [Can-          ing the most recent assessment of early marine sur-
ada] and the state of Washington [USA] extending            vival of Puget Sound steelhead (2014 outmigrants;
from the northern Strait of Georgia to the southern         Moore & Berejikian 2017), the Northeast Pacific Ocean
boundary of Puget Sound) over the past 3 to 4 de-           experienced a marine heat wave, which began as a
cades appear linked with conditions they experience         large mass of warm water in late 2014 persisting
soon after marine entry. Intra-specific survival trends     through late 2015, followed by the strongest El Niño
for populations of coho salmon O. kisutch and steel-        on record that lasted through 2016 (Di Lorenzo &
head indicate greater coherence within Puget Sound          Mantua 2016, Jacox et al. 2018). Documented effects
than with population groups from other regions of           of the persistent warming on the California Current
the eastern Pacific, implicating local marine ecosys-       Large Marine Ecosystem at all trophic levels are
tem factors (Zimmerman et al. 2015, Kendall et al.          numerous (Cavole et al. 2016, Daly et al. 2017, Peter-
2017). Pink salmon O. gorbuscha, which migrate to           son et al. 2017, Du & Peterson 2018).
marine waters soon after emergence and at the                  One of the most ecologically significant changes
smallest size of any Pacific salmon, increasingly com-      associated with the marine heat wave was a substan-
prise a greater proportion of total salmon abundance        tial expansion in the spawning and abundance of
in Puget Sound (Losee et al. 2019), suggesting that         northern anchovy Engraulis mordax (hereafter an-
salmonids with different ecological requirements may        chovy) within the Salish Sea ecosystem (Duguid et al.
be differentially influenced by major changes in the        2019). During the heatwave, offshore anchovy repro-
Puget Sound ecosystem (Ruggerone & Goetz 2004).             duction that usually occurs in warm months (June
   Smolts of Puget Sound steelhead, listed as threat-       and July) expanded to include typically colder
ened under the Endangered Species Act (72 FR                months both earlier and later in the year (Auth et al.
26722), enter the marine environment in mid-spring          2018). Anchovy larval development and survival re-
at a relatively large body size (approximately 140−         quire warmer water temperatures (Brewer 1976)
220 mm fork length), migrate very quickly through           than are typical during Puget Sound winters. Similar
Puget Sound, prefer open water to nearshore envi-           expansions in spawn timing and increased abun-
ronments, and exhibit very consistent interannual           dance have occurred during previous anomalously
migratory behavior patterns (Moore et al. 2015). Pre-       warm periods in the early 1980s (Brodeur et al. 1985,
dation in the early marine environment has been             Doyle 1995) and in 2004 and 2005 (Brodeur et al.
identified as a predominant mortality mechanism             2006). During the marine heat wave, anchovies
based on consistently high mortality rates over a           moved northward, affecting food webs in the Pacific
short migratory time period, observed for popula-           Ocean (Leising et al. 2015). Predation pressure can
tions throughout the region over multiple years             shift dramatically when species occupy habitats in
(2006−2009 and 2014: Moore et al. 2015, Moore &             which they are typically absent or in low abundance
Berejikian 2017). During this period of high mortal-        (Thompson et al. 2012, Friedland et al. 2017), disrupt-
ity, harbor seal Phoca vitulina predation was evident       ing patterns of salmon survival observed under more

Moore et al.: Environmental influences on steelhead survival variability 141
typical ecological conditions (Wells et al. 2017). Data served effects of temperature on steelhead survival
from multiple independent sources indicate signifi- with respect to alternative prey availability (anchovy).
cant spikes in anchovy abundance in Puget Sound in Finally, we compared evidence of predation by har-
2016 and in other recent warm periods in the 20th bor seals in 2 years representing the highest and low-
century (Duguid et al. 2019). est documented early marine steelhead survival in
Correlations among abiotic environmental condi- the recent time series, providing evidence of possible
tions and salmon and steelhead survival are of much prey switching.
greater value where empirically linked to ecological
mechanisms. Here we assessed how changing envi-
ronmental conditions before, during, and after the 2. MATERIALS AND METHODS
North Pacific marine heat wave may have influenced
the early marine survival of steelhead by shifting the 2.1. Steelhead smolt tagging
predator−prey dynamics between harbor seals and
migrating steelhead. First, we updated the steelhead Wild steelhead smolts were captured at a rotary
smolt early marine survival time series, adding 6 screw trap at river kilometer (rkm) 19 in the Nisqually
additional years of data from the same wild steelhead River (Fig. 1) during the smolt outmigration periods
population and same acoustic telemetry network (April−June) of 2014 through 2019 (Table 1). Captured
previously documented (Moore et al. 2015). Second, smolts were anesthetized, weighed, measured (fork
we quantified the relationship between Pacific Ocean length) onsite, and implanted with a Vemco V7 2L
temperatures, Puget Sound temperatures, and steel- acoustic transmitter (7 × 15.5 mm, 69 kHz, 30−90 s
head early marine survival. Third, we evaluated ob- random ping interval) following surgical implantation
¯
EE
EEE
EE EE
EEE
EEE E EE
EEE EEE EEE
E E E EE E E EEE E
E E
EE E
E
EEEEE
EEE
EE
EEE
EE
EE
E
EE
EE
E
E
EE
EE
EE
EEE
EE
EE
EEE
EEE
E EEEE
EEE
E E EE
E
JDF E EEE
EEEEEEE
EEEEEEEE
EEEEEEE
EEEEEEE
E
EEE EEE
Strait of Juan de Fuca
ADM
48°
N !
>
Colvos Rocks
Puget
Sound
British
Columbia CPS
Orchard Rocks
> !
! >
Washington Blakely Rocks
47° 27‘ 0‘‘ N
P A C I F I C OCEAN
Gertrude Island
Oregon47
!
> NAR
!
>
Eagle Island
!
>
Nisqually R. 0 5 10 20 k m
47°
#^
124° W 123°
Fig. 1. Puget Sound and the Strait of Juan de Fuca, showing Nisqually River trap (black star), steelhead smolt release location
(black triangle), and all moored telemetry receiver array locations (open circles) at the Tacoma Narrows (NAR), Central Puget
Sound (CPS), Admiralty Inlet (ADM), and Strait of Juan de Fuca (JDF). Also shown are all harbor seal tagging locations (circle
with cross) and Skagit Bay tow-net survey sites (small black crosses)
142                                        Mar Ecol Prog Ser 662: 139–156, 2021

Table 1. Number of tags, mean (SE) steelhead smolt fork         PDO values were obtained from (https://oceanview.
length (FL), and migration year for steelhead smolts surgi-     pfeg.noaa. gov/ erddap/ tabledap/ cciea_ OC_ PDO.
cally implanted with acoustic telemetry transmitters in the
Nisqually River, Washington, USA. Dates are given as mo/d       htmlTable?time,PDO) for all years of the study (2005−
                                                                2019). Puget Sound temperature data were collected
                                                                from monitoring stations in Puget Sound, operated by
 Year    No. of    Mean FL       Mean body      Tagging
          tags      (mm)          mass (g)     date range       King County. Data from 10 stations (0−50 m depth)
                                                                between 47° 21’ 36’’ N and 47° 46’ 12’’ N were aver-
 2014     100     197.3 (26.5)   73.6 (34.0)   4/27−5/24        aged for each month and year. Mean annual PDO
 2015     103     199.7 (23.9)   75.1 (28.0)   4/29−6/4         and mean annual Puget Sound temperatures were
 2016     150     201.3 (24.1)   76.5 (28.9)   4/25−6/2
 2017     100     205.9 (15.7)   80.1 (18.5)   4/25−5/31
                                                                strongly and positively correlated during study years
 2018     210     210.1 (23.7)   90.5 (32.0)   4/28−6/6         (correlation analysis, r = 0.88, df = 13, p < 0.001; Fig. 2),
 2019     210     213.7 (24.9)   98.3 (35.2)   4/24−6/4         indicating strong coherence between ocean and in-
                                                                land water temperature patterns on an annual basis.
                                                                Correlations among temperature indices and anchovy
procedures outlined by Moore & Berejikian (2017).               abundance trends (see Section 2.4) were assessed to
All smolts were held for 18−24 h and then released at           investigate the influence of elevated temperature on
rkm 19. Similar handling, implantation, and release             steelhead mortality.
protocols were used for steelhead smolts tagged in
2006 through 2009 (see Moore et al. 2015).
                                                                               2.4. Anchovy abundance

          2.2. Fixed hydrophone locations                          Anchovy were sampled as part of a long-term mon-
                                                                itoring of salmon, forage fish, and jellyfish in Puget
  Fixed hydrophones (those not attached to harbor               Sound using a surface Kodiak trawl (Rice et al. 2011,
seals; see Section 2.5) were used to estimate survival          2012, Greene et al. 2015). Consistent anchovy abun-
and detect tag movement patterns indicating smolts              dance time series data from within Puget Sound are
had been consumed and were being carried by har-                scarce (Duguid et al. 2019), and fortunately a contin-
bor seals. The core array of 70 Vemco VR3 and VR4               uous dataset near the steelhead migration corridor
hydrophones was deployed before the 2014 smolt                  coincided with years in which steelhead mortality
migration and remained in place through the 2019                was quantified (Fig. 1). The monitoring consisted of
outmigration. This array included sub-arrays at the             Kodiak trawling using a spatially stratified design in
Tacoma Narrows (8 receivers; NAR), Central Puget                subtidal neritic waters of Skagit Bay (5−30 m depth).
Sound (19 receivers; CPS), Admiralty Inlet (13 re-              The design attempted to sample 19 sites during
ceivers; ADM), and Strait of Juan de Fuca (30 re-               monthly cruises between April and October. Among
ceivers; JDF; maintained by the Ocean Tracking
Network, Fig. 1). Six additional Vemco VR2W hydro-                  12.0
phones were deployed at the same locations in the
Nisqually estuary each year from 2014 to 2019.                      11.5

                                                                    11.0
            2.3. Environmental variables
                                                              PST

                                                                    10.5
  Two primary sources of temperature data were
compiled to establish the relationship between                      10.0
broad-scale climate patterns and local temperature
conditions in Puget Sound: (1) the PDO index (Man-
                                                                     9.5
tua et al. 1997; http://research.jisao.washington.edu/
pdo/PDO.latest.txt) and (2) temperature data collected
                                                                     9.0
by King County from conductivity-temperature-depth                             –1           0            1            2
(CTD) casts in CPS (http://green2.kingcounty.gov/                                           PDO
marine/Monitoring/OffshoreCTD). The PDO index                   Fig. 2. Annual mean Puget Sound temperature (PST) is
reflects large-scale sea surface temperature in the             strongly, positively correlated with annual mean Pacific
North Pacific Ocean (Mantua & Hare 2002). Monthly                       Decadal Oscillation (PDO) indices (r = 0.88)
Moore et al.: Environmental influences on steelhead survival variability                   143

years, the total number of sites sampled ranged from            pack that was glued to the pelage with quick-set
43 to 103, with variation occurring due to logistic con-        epoxy. Each pack contained (1) a Vemco mobile trans-
straints (e.g. poor weather, vessel repairs). At each site,     ceiver (VMT) receiver capable of detecting both the
the trawl was towed between the 2 vessels for 10 min            V7 tags (69 kHz) implanted in steelhead to quantify
at a consistent speed (~2 knots) among surveys. Al-             encounters, (2) a satellite-linked time depth recorder
though there was likely only minor variation in vol-            and Fastloc GPS tag (model MK10AF, Wildlife Com-
ume filtered, a flowmeter measured water volume fil-            puters, www.wildlifecomputers.com), and (3) a VHF tag
tered as a metric of sampling effort. Upon retrieval of         (164−165 MHz, Advanced Telemetry Systems; www.
the net, the crew measured abundance and biomass                atstrack.com) used for locating the instrument packs
of each species captured, as well as individual lengths         after they had been shed by the harbor seals. All 3 in-
of a sample of up to 25 randomly selected fish.                 struments were consolidated in a single floatation
   The vast majority (> 90% of catch) of captured an-           pack, which were attached to the seals along the dor-
chovy were in larval or post-larval stages (< 50 mm)            sal mid-line, on the anterior portion of the back. The
throughout the field season, although some age-1+               GPS receivers were programmed to transmit ARGOS
fish were infrequently captured. Anchovies in coastal           and GPS data and to store Fastloc GPS locations in the
waters off Washington and Oregon typically spawn                tag. In 2014, the Fastloc sampling interval was 30 min,
in summer months (Richardson 1973), but eggs and                so there were a maximum of 48 possible locations per
larvae can be found in the Salish Sea from April to             day, although the actual number was much lower be-
August (Duguid et al. 2019). Eggs hatch in 2−4 d,               cause the tags were programmed to a maximum of 4
depending on temperature (Bolin 1936). Adults can               failed transmissions (which occurs when the tag is un-
reach sexual maturity at age-1, when length aver-               derwater) per hour to conserve battery life (see Bere-
ages 107 mm, but most individuals mature after 2 yr             jikian et al. 2016). Transmissions were also suppressed
(Pike 1951). In surface-trawl survey catches from the           during haul-outs (i.e. when the pack was dry). In
Columbia River plume, age-1 anchovy ranged from                 2016, the maximum number of locations was in-
90 to 125 mm (Litz et al. 2008), and a multi-age sam-           creased to 144 d−1 and there was no limit on failed at-
ple of anchovies caught in a Puget Sound mid-water              tempts. These changes resulted in a greater number
trawl survey (April 2016) had a bimodal distribution            of positions in 2016 than in 2014, but did not affect the
with modes at 105 and 145 mm (Duguid et al. 2019).              capacity to detect steelhead (i.e. the steelhead tags
Year class strength of marine fish populations is               were identically sized and configured and the same
largely determined during early larval stages (Houde            VMT hydrophones were used in both years). Stored
1994, Bradford & Cabana 1997), so we used an abun-              data were downloaded from recovered VMTs (11 in
dance index (described in Section 2.6.2) of larval and          2014 and 15 in 2016, Table S1). To conserve battery
post-larval anchovies caught in Skagit Bay as an                life and ensure that transmissions would continue
indicator for abundance of age-1 anchovies in Puget             after the packs had separated from the seals, GPS
Sound in the following year.                                    data were only recorded once per week beginning on
                                                                1 July 2014 and 1 August 2016. Steelhead smolts com-
                                                                plete their early migration through Puget Sound
       2.5. Harbor seal tagging and locations                   sometime in June (Moore et al. 2015). In both years,
                                                                we used only Fastloc GPS positions that incorporated
  Harbor seal research activities were conducted un-            data from 5 or more satellites to minimize error (Hazel
der Marine Mammal Protection Act Research Permit                2009). We determined GPS locations by analyzing
13430 issued by the National Marine Fisheries                   archival GPS data from each tag using proprietary
Service (Office of Protected Resources, Silver Spring,          software from the manufacturer.
MD). Twelve adult harbor seals were captured at 3
haulouts (Colvos Rocks, Orchard Rocks, and Blakely
Rocks) in 2014, and 16 seals were captured at 5                                    2.6. Data analyses
haulouts (Colvos Rocks, Orchard Rocks, Gertrude Is-
land, Eagle Island, and Nisqually Estuary) in 2016                     2.6.1. Survival estimation and migration
(Fig. 1; Table S1 in the Supplement at www.int-res.                             behavior of steelhead
com/articles/suppl/m662p139_supp.pdf). Berejikian
et al. (2016) described the tagging and monitoring                Cormack-Jolly-Seber (CJS) mark−recapture models
procedures of harbor seals in 2014. Briefly, each seal          (Cormack 1964, Jolly 1965, Seber 1965), implemented
was weighed, measured, and fitted with an instrument            in the package ‘RMark’ (Laake 2013) in R version
144                                     Mar Ecol Prog Ser 662: 139–156, 2021

3.6.2 (R Core Team 2019), were used to estimate the         metric that was on the same time scale as survival
probability of detection (p) at each sub-array and the      (i.e. annual) and robust to interactions between fish
probability of smolt survival (ϕ) through each migra-       phenology and minor variation in sampling intensity
tion segment for 2014−2019. Nisqually steelhead             across months within years, minor variation in sam-
smolt survival probabilities from 2006 to 2009 were         pling intensity among tows, zero inflation (i.e. many
estimated using previously published analogous CJS          observations of zero individuals), and right-skewed
models (Moore et al. 2015). Segments included re-           count data, which are typical of fish-monitoring data,
lease (REL) to river mouth (RM), RM to NAR, NAR to          including ours. We used a hurdle model approach,
CPS, CPS to ADM, and ADM to the western portion of          which separately modeled fish presence and fish
JDF (Fig. 1). In 2018, detections were not available for    abundance when present to quantify fish abundance.
NAR, CPS, or ADM, but we were still able to estimate        We modeled fish presence π and counts when pres-
RM−JDF survival probability. The modeling approach          ent μ from net tow i in year t, month m, and volume
and survival estimation followed Moore et al. (2015).       filtered w as:
Briefly, a set of 36 models was constructed to test for
interactions between year and segment-specific ϕ,                        logit(πi,t,m,w) = λtX + f1 (m) + w      (2)
additive effects of year, length, and release week on                   logit(μi,t,m,w) = βtX + f2 (m) + w       (3)
segment-specific ϕ, and an interaction (year × seg-
ment) and additive effect of year on p. A value of          where the former is fit using a binomial error distri-
0.685 was fixed for p at JDF according to linear re-        bution, the latter is fit using a zero-truncated nega-
gression estimation methods detailed by Melnychuk           tive binomial error distribution, f(.) represents a
(2009). Model goodness-of-fit parameters were satis-        second-order random walk used to parameterize a
factory (Fletcher’s c-hat < 1.2; Fletcher 2012).            nonlinear function that accounts for phenology, and
   Segment-specific survival values (i.e. ϕRM-NAR, ϕNAR-    X is a binary variable describing whether an obser-
CPS, ϕCPS-ADM, and ϕADM-JDF) from the model with the        vation did (1) or did not (0) occur during a particular
most support (i.e. lowest Akaike’s information crite-       year t. There are no global intercepts so that year
rion corrected for small sample size, AICc) were mul-       effects (λt and βt) capture interannual differences in
tiplied to produce RM−JDF survival estimates for            fish abundance. The anchovy abundance index A in
each year from 2014 to 2019, and error was calcu-           year t is the product of anchovy probability of presence
lated using the delta method. Each ϕRM-JDF was con-         and anchovy counts when present for each year t:
verted to instantaneous mortality rate (M) to increase
                                                                                At = logit–1 (λt)eβt             (4)
normality and improve linearity of modeled relation-
ships (Ricker 1975) as:                                       In plain terms, this model asks how many fish we
                                                            expect to catch per tow in year t, filtering out effects
                      M = −ln(ϕ)                     (1)
                                                            of seasonality in fish abundance, and accounting for
  Travel times were calculated for each tagged steel-       zero-inflated, right-skewed fish counts and the ex-
head within a migration segment by subtracting the          pectation of greater fish counts when nets filter more
time of last detection at the first array from the time     water volume (raw counts compared to abundance
of first detection at the second array. Travel times        indices: Fig. 3).
were produced for each migration segment (REL−                Models were fit in the R package ‘INLA’ (Rue et al.
RM, RM−NAR, NAR−CPS, CPS−ADM, ADM−JDF),                     2009, Lindgren & Rue 2015).
and then averaged and summed to estimate total mi-
gration time. Marine migration was defined as RM−
JDF (i.e. excluded REL−RM). A linear model was              2.6.3. Relationships among environmental variables
used to determine whether average Puget Sound                              and steelhead mortality
temperatures had an effect on RM−JDF travel time.
                                                              We tested support for the overall hypothesis that
                                                            increased water temperatures associated with the
          2.6.2. Anchovy abundance index                    marine heat wave improved conditions for anchovy,
                                                            reduced predation pressure on steelhead, and re-
  We used statistical models to describe annual lar-        duced steelhead mortality. To do so, we constructed 6
val and post-larval anchovy abundance (hereafter            models to assess the strength of relationships be-
‘anchovy abundance’) across Skagit Bay. The pur-            tween (1) Puget Sound temperatures and steelhead
pose of these models was to generate an abundance           mortality (Models 1 and 2), (2) anchovy abundance
Moore et al.: Environmental influences on steelhead survival variability 145
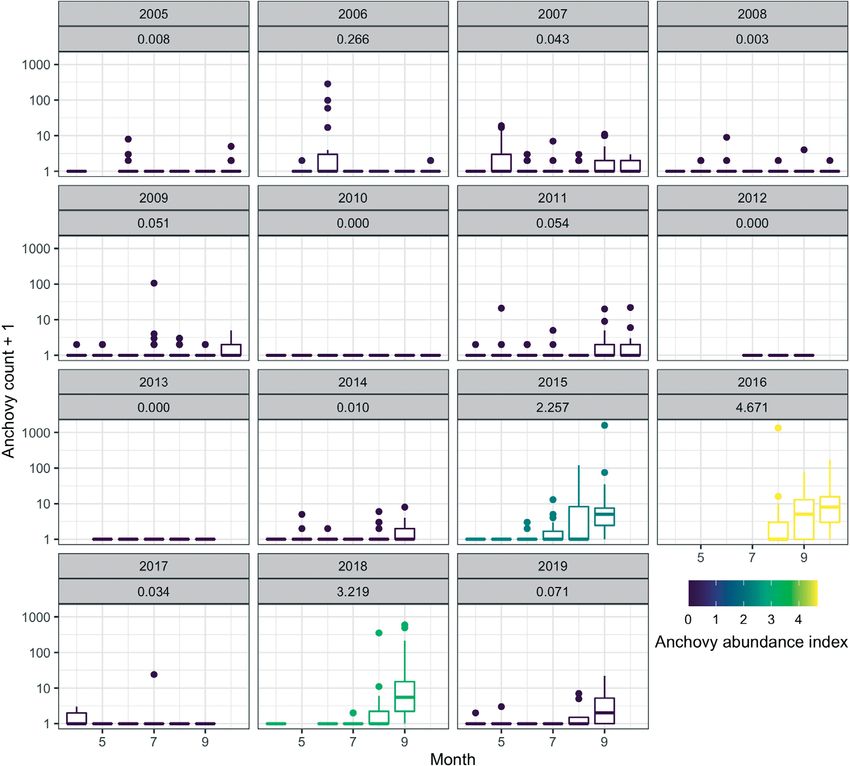
Fig. 3. Raw counts of anchovy across years and months compared to annual abundance indices. Numbers at the top of the panel
and colors correspond to anchovy abundance index. In the boxplots: upper and lower hinges: first and third quartiles; mid-line:
median; whiskers: points within 1.5× interquartile range; dots represent data outside of 1.5× interquartile range
index and Puget Sound temperature and PDO (Mod- PST in the year of migration (Model 2) using the base
els 3 and 4), and (3) anchovy abundance index and function ‘lm’ in R version 3.6.2 (R Core Team 2019).
steelhead mortality (Models 5 and 6), then compared We used PST rather than PDO to assess the strength
pairs of models to understand mechanisms. Lastly, we of these relationships, because mortality was esti-
compared evidence of predation by harbor seals in 2 mated within Puget Sound, and because the 2 tem-
years representing the highest (2014) and lowest perature indices were highly correlated (Fig. 2). The
(2016) estimates of steelhead mortality. annual mean PST for the entire year preceding steel-
To determine whether temperature during or prior head migration (t − 1) was calculated to test for ‘pre-
to migration might affect observed steelhead mortal- conditioning’ effects (i.e. temperature influences on
ity patterns, we modeled instantaneous steelhead larval and post-larval anchovy). The annual mean
mortality (M) in each year (t) as a linear function of PST during the year of migration (t) was calculated
the Puget Sound temperature (PST) during the year for the 6 mo preceding and including the migration
prior to migration (Model 1) and M as a function of period (January to June):
146                                      Mar Ecol Prog Ser 662: 139–156, 2021

(Model 1)          Mt = β0 + β1PSTt–1                (5)     by Berejikian et al. (2016). All steelhead tags detected
                                                             by seal-mounted VMT in 2016 were subjected to the
(Model 2)           Mt = β0 + β1PSTt                 (6)
                                                             same criteria to determine whether any 2016 tags
  We then tested the hypothesis that annual anchovy          were consumed by harbor seals. Seal consumption
abundance in Puget Sound is temperature-dependent.           (hereafter ‘haulout mortality’) of tagged steelhead
Abundance of anchovy could be the consequence of             smolts was quantified at 3 haulout locations (Colvos
processes within Puget Sound or at larger spatial            Rocks, Orchard Rocks, and Blakely Rocks; Fig. 1) in
scales due to transport of larvae produced offshore,         Puget Sound based on repeated tag detections by
so we examined 2 temperature-dependent models.               seal-mounted VMTs near the haulouts, plus at least
First, we fit the natural log of the anchovy abundance       one of the following: (1) detection patterns on tidal or
index (A) as a function of the annual mean PST               temporal cycles indicative of harbor seal movements
(Model 3). To evaluate whether anchovy contribution          and never detected further along the migration path,
to Puget Sound was more likely to have resulted from         (2) tag subsequently detected stationary after the smolt
resident anchovies or offshore reproduction, we com-         outmigration period, (3) no evidence that tags were
pared the relationship established in model 3 with           later detected migrating to the ocean (see Berejikian
that between anchovy abundance and the monthly               et al. 2016 for further details). Additional interactions
PDO (Model 4) mean (across all 12 mo):                       between seal-mounted VMTs and tagged steelhead
(Model 3)         ln At = β0 + β1PSTt                (7)     quantified throughout the study area included ‘sur-
                                                             vivors’ and ‘stationary tags’. A tagged steelhead was
(Model 4)         ln At = β0 + β1PDOt                (8)     categorized as a survivor when it was detected at least
  Anchovy abundance in the year prior to steelhead           once on a seal-mounted VMT and then subsequently
migration (t − 1) may predict age-1 anchovy abun-            detected on a receiver array further along the migra-
dance during the year of migration, when anchovies           tion path. We defined a tag as stationary when it had
are of a size (90−125 mm; Litz et al. 2008) large            more than 1 detection (separated by at least 24 h) by
enough to attract predators that also prey on steel-         a seal-mounted VMT at the same location. Haulout
head smolts. We tested support for the hypothesis            mortalities, survivors, and stationary tags only within
that steelhead mortality rate in year t was negatively       the area covered by the range of instrumented seals
correlated with anchovy abundance in the year prior          in both 2014 and 2016 (within Puget Sound, between
to migration (t − 1; Model 5):                               latitudes 47° 27’ 0’’ N and 48° 0’ 0’’ N; Fig. 1) were in-
                                                             cluded in the annual comparison. Segment-specific
(Model 5)         Mt = β0 + β1 ln At–1               (9)
                                                             survival probabilities (see Section 2.6.1) were used to
   Lastly we compared the fit of Model 5 to the rela-        determine the number of smolts remaining at the end
tionship between steelhead mortality rate and an-            of each segment by multiplying the survival rate by
chovy abundance in the year of migration (Model 6).          the number of fish entering the specific segment.
Steelhead mortality in year t was predicted to be less
strongly correlated with post-larval anchovy abun-
dance in year t, because post-larval anchovies are                                 3. RESULTS
unlikely prey for predators of steelhead.
                                                                   3.1. Early marine survival and behavior
(Model 6)          Mt = β0 + β1 ln At               (10)
                                                                                of steelhead
  We compared support for each pair of models
(Models 1 and 2, Models 3 and 4, Models 5 and 6)               Nisqually steelhead smolt RM−JDF survival proba-
with support for the null model using AICc in the            bility ranged from 0.06 in 2014 to 0.38 in 2016 and
package ‘MuMIn’ for R (Barton 2020). A second set of         2017. 2015 was the first year in which survival prob-
parallel models was constructed to test for effects of       abilities exceeded estimates during the earlier 2006−
the same variables using a CJS framework (Text S1            2009 time period (range = 0.05−0.13) (Fig. 4). Sur-
in the Supplement).                                          vival probabilities decreased to 0.24 in 2018 and 0.19
                                                             in 2019 (Fig. 4). The CJS model with the lowest AICc
                                                             included only a segment × year effect on ϕ, indica-
            2.6.4. Predation by harbor seals                 ting support for unique estimates for each migration
                                                             segment within each year, and an additive effect of
  Consumption of tagged steelhead by harbor seals in         year on p (ΔAICc = 2.06 over second best model,
2014 was determined using several criteria described         weight = 0.49).
Moore et al.: Environmental influences on steelhead survival variability 147
50
0 JDF
2014
2015
Distance from JDF (km)
Survival probability (%)
40 50 2016
2017
2018
2019
30 100 ADM
150 CPS
20
200
NAR
10 River mouth
250 Rkm 19
no survival estimates
0 0 2 4 6 8 10 12 14 16 18
06
07
08
09
10
11
12
13
14
15
16
17
18
19
Travel time (d)
20
20
20
20
20
20
20
20
20
20
20
20
20
20
Fig. 5. Average annual travel time (± SE) between release at
Fig. 4. Steelhead survival probability estimates (± SE) from
river kilometer (Rkm 19) and the river mouth (RM), RM and
river mouth to the Strait of Juan de Fuca derived from mark−
the Tacoma Narrows (NAR), NAR and Central Puget Sound
recapture models using acoustic telemetry detection data.
(CPS), CPS and Admiralty Inlet (ADM), and ADM and the
Survival probabilities from 2014−2019 estimated in this
Strait of Juan de Fuca array (JDF), plotted by distance of
study were combined with previously published early marine
each array to JDF
survival probabilities from the same Nisqually River steel-
head population (Moore et al. 2015)
conditions nor migration behavior explain interan-
nual differences in survival. Also, travel time was not
In most years, steelhead REL−RM and RM−NAR correlated with April−June average PST (r = −0.48,
survival probabilities were similar; the lowest REL− df = 6, p = 0.23).
RM survival was estimated in 2016 (Table 2). In 2014,
steelhead survival probability through central and
north Puget Sound (NAR−CPS and CPS−ADM) was 3.2. PST and associated anchovy abundance
much lower than survival probability through the increase
same segments in 2015−2017. Interannual variability
in survival from ADM to JDF was lower than through The instantaneous mortality rate of steelhead in
segments in the main basin of Puget Sound (NAR− Puget Sound was negatively related to annual mean
CPS and CPS−ADM; Table 2). PST during the year prior to migration (Model 1, r2 =
Travel times through the entire Puget Sound migra- 0.75, p = 0.001, Fig. 6a). The 2 years of lowest steel-
tion (RM−JDF) ranged from 8.6 d in 2015 to 12.1 d in head mortality rates (2016 and 2017) were preceded
2017 (Fig. 5). Nearly indistinguishable segment- by the 2 warmest years in the dataset (2015 and
specific travel rates were observed between the 2016). January−June PST in the year of migration
years of lowest (2014) and one of the highest (2016) was only weakly and negatively related to steelhead
steelhead RM−JDF survival (Fig. 5), indicating that mortality rate (Model 2, r2 = 0.31, p = 0.09; Fig. 6b),
differences in neither time exposed to Puget Sound and did not predict steelhead mortality patterns as
Table 2. Segment-specific estimates of Nisqually steelhead smolt survival probability (ϕ) ± SE for release (REL) to river mouth
(RM), RM to Tacoma Narrows (NAR), NAR to central Puget Sound (CPS), CPS to Admiralty Inlet (ADM), and ADM to the Strait
of Juan de Fuca (JDF) from 2014 to 2019. −: Detection data from NAR, CPS, and ADM were unavailable in 2018. Segment-
specific estimates from mark−recapture models using 2006−2009 detection data are published in Moore et al. (2015)
Year REL−RM RM−NAR NAR−CPS CPS−ADM ADM−JDF RM−JDF
2014 0.94 ± 0.02 0.59 ± 0.07 0.45 ± 0.09 0.26 ± 0.10 0.87 ± 0.31 0.06 ± 0.18
2015 0.90 ± 0.03 0.60 ± 0.06 0.85 ± 0.09 0.74 ± 0.12 0.43 ± 0.13 0.16 ± 0.11
2016 0.70 ± 0.04 0.71 ± 0.05 0.83 ± 0.05 0.82 ± 0.07 0.78 ± 0.11 0.38 ± 0.02
2017 0.90 ± 0.03 0.65 ± 0.05 0.77 ± 0.06 0.85 ± 0.06 0.90 ± 0.12 0.38 ± 0.07
2018 0.92 ± 0.02 − − − − 0.24 ± 0.04
2019 0.93 ± 0.02 0.69 ± 0.04 0.54 ± 0.05 0.70 ± 0.07 0.71 ± 0.11 0.19 ± 0.04148 Mar Ecol Prog Ser 662: 139–156, 2021
3.5 Table 3. Results of Akaike’s information criterion corrected for
a small sample size (AICc) model comparison analysis to under-
2009 stand: (A) whether average Puget Sound temperature (PST)
3.0 2014 during the year prior to migration (t − 1) is a strong predictor of
2008 steelhead mortality (M) relative to average PST during the year
2.5 of migration (t), (B) the relative strength of annual average PST
2007 as a predictor of anchovy abundance (A) in Puget Sound com-
2.0 2006 pared to the strength of annual PDO indices, and (C) whether
2015 anchovy abundance during the year prior to migration is better
Instantaneous steelhead mortality (M)
than anchovy abundance in the year of migration as an indicator
1.5 2018 2019 of steelhead mortality
1.0 2017 2016
Model Model Model AICc ΔAICc Weight
comparison number
0.5
9.5 10.0 10.5 11.0 11.5 12.0 A 1 Mt = PSTt–1 17.1 0.00 0.984
Puget Sound temperature (°C) at (t – 1) Null1, 2 Mt = 1 26.5 9.39 0.009
2 Mt = PSTt 27.1 9.94 0.007
3.5 B 3 ln A = PSTt 44.9 0.00 0.924
b 4 ln A = PDOt 50.9 6.09 0.044
2009
3.0 Null3, 4 ln A = 1 51.6 6.71 0.033
2014
C 5 Mt = At–1 23.2 0.00 0.710
2008
6 Mt = At 26.2 3.00 0.158
2.5 Null5, 6 Mt = 1 26.5 3.37 0.132
2007
2006
2.0
2015
2019 tion (Model 5, r2 = 0.57, p = 0.01, Fig. 8a), indicating
1.5 2018 that high projected abundance of age-1 anchovy
contributed to reduced mortality of migrating steel-
2017 2016
1.0 head. The relationship between steelhead mortality
and anchovy abundance in the year of migration was
0.5 not as strong (Model 6, r2 = 0.37, p = 0.06; Fig. 8b,
8.0 8.5 9.0 9.5 10.0 10.5 Table 3, model comparison C; Table S2).
Puget Sound temperature (°C)
Fig. 6. (a) Steelhead mortality rate is strongly related to an- 3.3. Harbor seal predation
nual mean Puget Sound temperatures during the year be-
fore migration (r2 = 0.75, p = 0.001). (b) Mean of January−
June Puget Sound temperatures are also negatively related Evidence of harbor seal predation on steelhead
to steelhead mortality rate, although the relationship is was substantial in 2014, when steelhead survival
weaker (r2 = 0.31, p = 0.09). Lines represent the linear fit of rates were lowest, whereas we observed little evi-
Model 1 (a) and Model 2 (b)
dence of harbor seal predation in 2016, when steel-
head survival was highest (Fig. 4). In 2014, 6 haulout
well as PST in the year prior to migration (Table 3, mortalities (17% of tagged steelhead surviving to
Model comparison A; Table S2 in the Supplement). CPS) were detected at CPS haulout sites (Orchard
Anchovy abundance was positively related to PST and Blakely Rocks) and 1 (10% of tagged steelhead
(Model 3, r2 = 0.67, p = 0.004; Fig. 7a). Two of 3 years surviving to ADM) in north Puget Sound (Colvos
of highest anchovy abundance coincided with annual Rocks; Fig. 9a). In 2016, no mortality events were
mean PST exceeding 11.0°C, which only occurred in observed at CPS harbor seal haulouts, and 1 mortal-
2015 and 2016 within our time series (Fig. 7a). An- ity (2% of tagged steelhead surviving to ADM) was
chovy abundance was also positively related to the recorded at the north Puget Sound haulout (Fig. 9b).
PDO (Model 4, r2 = 0.36, p = 0.07; Fig. 7b), as ex- The percentage of available smolts consumed by
pected given the strong correlation between PDO harbor seals reflects only those predation events
and PST (Fig. 2), although the relationship was not as identified at the monitored haulouts, so represents a
strong as that between anchovy abundance and PST minimum percentage and is not a predation rate.
(Table 3, model comparison B; Table S2). Additional harbor seal predation may have occurred
Steelhead mortality rate was negatively related to throughout other areas of Puget Sound (see Fig. 1 for
anchovy abundance during the year prior to migra- additional locations of major haulouts). Not includedMoore et al.: Environmental influences on steelhead survival variability 149
4 3.5
a a
2009
2 2016 3.0 2014
2018 2015
2008
0 2.5
2006 2007
2006
-2 2019 2.0
2009 2007 2015
2017 2019
1.5 2018
–4
Instantaneous steelhead mortality (M)
2014
2008 2016 2017
–6 1.0
ln (anchovy abundance)
–8 0.5
9.5 10.0 10.5 11.0 11.5 12.0 –16 –14 –12 –10 –8 –6 –4 –2 0 2 4
Puget Sound temperature (°C) ln (anchovy abundance [t – 1])
4 3.5
b b
2009
2 2016 3.0 2014
2018
2015 2008
0 2.5
2006
2007 2006
–2 2019 2.0 2015
2009 2019
2017
2007 2018
–4 2014 1.5
2008 2017 2016
–6 1.0
–8 0.5
–2 –1 0 1 2 –8 –6 –4 –2 0 2
PDO ln (anchovy abundance)
Fig. 7. (a) Anchovy abundance increases with increasing an- Fig. 8. (a) Steelhead mortality rate decreases with increases
nual mean Puget Sound temperatures (r2 = 0.67, p = 0.004), a in anchovy abundance in the year prior to migration (r2 =
stronger positive relationship than (b) the increase in an- 0.57, p = 0.01), a stronger relationship than (b) the relation-
chovy occurrence related to annual mean Pacific Decadal ship between steelhead mortality and anchovy occurrence
Oscillation (PDO) (r2 = 0.36, p = 0.07). Lines represent the in the same year (r2 = 0.37, p = 0.06). Lines represent the linear
linear fit of Model 3 (a) and Model 4 (b) fit of Model 5 (a) and Model 6 (b)
in the percentages were 3 additional stationary tags late 2014 and continuing through 2016. During the
observed in 2014 within close proximity (2 within years of this study, variability in steelhead smolt mor-
4 km and 1 within 8 km) to 1 of the monitored haul- tality was strongly correlated with PST in the year
outs that represent possible additional harbor seal prior to migration, and less so with annual mean tem-
predation events. No stationary tags were located peratures averaged over the months preceding migra-
near monitored haulouts in 2016. Spatial coverage tion. The relationship between anchovy and PST pro-
of instrumented harbor seals did not differ substan- vides one possible mechanism by which steelhead
tially between years and therefore could not account benefit from increased water temperatures during
for the difference in recorded mortality events (Fig. 9). the year prior to migration. Warmer temperatures
appear to favor anchovy abundance in the Salish Sea
and northern California Current (Leising et al. 2015,
4. DISCUSSION Auth et al. 2018, Duguid et al. 2019), and tempera-
ture was correlated with larval anchovy abundance
Steelhead smolt mortality through Puget Sound in Puget Sound. Anchovies can be an important prey
varied substantially from 2006 to 2019 and decreased item for harbor seals (Lance et al. 2012), including in
in response to the marine heatwave that affected the Puget Sound during the timeframe of our study
North Pacific Ocean and Puget Sound beginning in (Thomas et al. in press), and are likely exploited by150 Mar Ecol Prog Ser 662: 139–156, 2021
ADM ADM
a b
48°
N
#
!
(D !
(
D
CPS CPS
# #
^
!
(D ^ !
(
D
!
(
D
D
D !
(
¯ ¯
5
47°
^ #
30’
0 5.5 11 km 0 5.5 11 km
122° 30’ W 122° 30’ W
Fig. 9. Tagged harbor seal GPS fastloc location range in (a) 2014 and (b) 2016. Green shading represents areas where positions of
instrumented seals were recorded more than 2 times per km2. Steelhead mortalities at haulouts (black ✕s within circles), steelhead
mortalities away from haulouts (M), and steelhead survivors detected by harbor seals (Q), were quantified using detection pat-
terns recorded on harbor seal VMTs and fixed arrays ( ; see Section 2), only within 2014 and 2016 coverage areas (i.e. areas
with location densities > 2 km−2) that completely overlapped (gray box). ADM: Admiralty Inlet; CPS: Central Puget Sound
other opportunistic predators in the Salish Sea. We (highest estimate). During these 2 years, evidence of
hypothesize that the large anchovy pulse that oc- harbor seal predation on steelhead was greater during
curred during the marine heatwave provided a sub- 2014 and lower during 2016, suggesting that predation
stantial alternative prey resource, lessening the preda- pressure on steelhead was somewhat alleviated dur-
tion pressure on steelhead smolts. Between 62 and ing a year of peak anchovy abundance. Other oppor-
94% of steelhead smolts died each year (see Table 2) tunistic predator species may have similarly shifted
during the 8−12 d migration, suggesting that preda- feeding to atypically abundant anchovy, further alle-
tion was the most likely cause of mortality. Other viating predation pressure on migrating steelhead.
potential sources of mortality such as disease, starva- The high mortality rates experienced by Nisqually
tion, or contaminants, would be more likely to cause River steelhead from 2006 to 2009 and in 2014 corre-
mortality over longer time periods than steelhead sponded to similarly high mortality rates observed in
smolts were present in Puget Sound (Puget Sound several other steelhead populations in Puget Sound
Steelhead Marine Survival Workgroup 2018). Similar (Moore et al. 2015) and in the Strait of Georgia (Mel-
travel times among years provide an indication that nychuk et al. 2014). Predation was identified as a ma-
steelhead behavior does not explain interannual jor cause of high steelhead mortality in Puget Sound
variation in survival rates. (Berejikian et al. 2016, Moore & Berejikian 2017) and
The greatest contrast in steelhead survival rates speculated as such in other areas within the Strait of
occurred between 2014 (lowest estimate) and 2016 Georgia (Balfry et al. 2011, Melnychuk et al. 2013).Moore et al.: Environmental influences on steelhead survival variability 151 Warm ocean temperatures contributed to major environments inhabited by the central and southern changes in species distribution and abundance, re- subpopulations (Baja California to San Francisco) sulting in what appears to be shifting predation pres- that provide a different range of thermal conditions. sure that ultimately reduced mortality of steelhead. Cooler northern waters may limit anchovy recruit- Elsewhere, similar complex ecological interactions ment processes or inhibit overwinter survival in most have been shown to influence marine survival rates, years, such that in very warm years, anchovy may be and have the potential to substantially impact the capable of range expansion and increases in repro- productivity and likelihood of recovery of depressed ductive success or larval survival in northern areas. salmonid populations. For example, Wells et al. (2017) PST was a slightly better indicator of anchovy occur- documented how oceanographic conditions mediated rence in Puget Sound than PDO, suggesting that common murre Uria aalge predation on Chinook Puget Sound anchovies were spawned from resident salmon Oncorhynchus tshawytscha outmigrants when populations and were responding to local rather than low preferred prey (rockfish Sebastes spp.) availabil- oceanic conditions. Some spawning within Puget ity caused murres to shift predation pressure to Sound was evident in the consistent larval anchovy anchovy aggregations that overlapped with Chinook catches in the Skagit tow-nets throughout spring and ocean entry locations. Additionally, decreased sur- summer months. Lengths of larval anchovies caught vival of Atlantic salmon Salmo salar was attributed to in August and September of 2018 were as small as 22 shifts in ocean temperatures as cod predators occu- and 26 mm, respectively (C. Greene unpubl. data). It pied new northern habitats that overlapped with remains unclear whether apparent increases in salmon smolt migration corridors (Friedland et al. anchovy abundance result from protracted or more 2017). Increased variability in ocean climate patterns successful resident anchovy spawning under warmer is leading animal distribution and phenology to shift conditions, or a combination of resident spawning in response (Sydeman et al. 2013, Munsch et al. 2019), and transport of larvae or eggs from the North Pacific changing the ecological dynamics controlling salmon Ocean. Increases in mean monthly PSTs above 11°C marine survival, and placing new emphasis on coincided with increased anchovy abundance in understanding biological−physical links. Puget Sound, and patterns in the annual anchovy Anchovy are native to the Salish Sea ecosystem, abundance data show very low levels in years with although occurrence has typically been somewhat cooler average temperatures. This observation is rare in recent years, prior to the marine heat wave supported by empirical studies showing a distinct (Greene et al. 2015). In 2015 and 2016, however, increase in the percentage of normal larval develop- widespread reports of large numbers of anchovies ment and survival of anchovy exposed to tempera- throughout the Salish Sea prompted a historical tures warmer than 11°C relative to groups reared in analysis of anchovy abundance trends by Duguid et 10.5°C or cooler water (Brewer 1976). Larval anchovy al. (2019). These authors used qualitative and quanti- densities off the US West Coast were anomalously tative data from 1940 to 2016 to describe the episodic high during the 2014−2016 marine heat wave due to nature of anchovy fluctuations in the Salish Sea and both expanded distribution and prolonged spawning the tendency of anchovy abundance to respond posi- (Auth et al. 2018), increasing the potential for trans- tively to warm Salish Sea and Pacific Ocean temper- port into the Salish Sea. Both transport from offshore atures. Along the US West Coast, Brodeur et al. (1985) and production within Puget Sound are plausible, documented high abundance of anchovies associated although it appears that some level of resident with warm, low-salinity waters of the strong 1983 El spawning did take place during the years following Niño event. Similarly, abundant anchovies coincided the onset of the 2014−2016 marine heat wave. with anomalous ocean conditions in the northern Mid-trophic level fish species, or ‘forage fish’, are California Current ecosystem in 2005 (Brodeur et al. subject to variability in physical ocean processes and 2006) and during the recent marine heat wave (Auth can have a strong effect on marine ecosystem dynam- et al. 2018). Not all reported relationships between ics, because they are important prey for a variety of anchovy productivity and temperature are positive taxa (Rice 1995, Bakun 2006). Major declines in pop- (see Chavez et al. 2003 and Lindegren et al. 2013), ulations of some forage fish species (e.g. Pacific her- but the relationship may depend on latitude of the ring Clupea pallasii, Siple & Francis 2016; surf smelt considered subpopulation. The Salish Sea is located Hypomesus pretiosus, Greene et al. 2015) over the near the northern limit of the northern subpopulation last 3 to 4 decades have coincided with significant range (northern California to British Columbia) and increases in human population size and associated may limit anchovy productivity, in contrast to warmer urbanization in the Puget Sound region. At the same
152                                    Mar Ecol Prog Ser 662: 139–156, 2021

time, harbor seal populations increased to apparent        areas throughout the rest of the study area. Thomas
carrying capacity by 1999 (Jeffries et al. 2003). Re-      et al. (2017) found that juvenile steelhead co-occurred
ductions in forage fish abundance may have increased       with other salmon in scat samples collected from
exposure of migrating steelhead to predation by pin-       Strait of Georgia haulouts and made up an average
nipeds and resulted in reduced marine survival rates       2.5% of harbor seal diets based on DNA quantifica-
over the past 3 decades (Kendall et al. 2017). Episodic    tion techniques. Bioenergetics-based simulations of
increases in anchovy abundance during the 1980s            harbor seal predation effects on Puget Sound Chi-
(Duguid et al. 2019) associated with very high marine      nook salmon demonstrate that a small diet fraction
survival rates and abundances of Puget Sound steel-        coupled with high predator abundance can translate
head (Kendall et al. 2017) suggest that anchovies          into a large number of consumed outmigrating
may now provide a periodic source of alternative           smolts (Chasco et al. 2017). Steelhead smolts are
prey for harbor seals and other higher trophic level       even less abundant than other Pacific salmon species
species, and reduce predation pressure on steelhead        and require higher marine survival rates than other
and possibly on other salmon.                              salmon to maintain positive population growth rates.
   Harbor seals are generalist predators that exploit      Thus, even a small percentage of steelhead in harbor
seasonally and regionally available prey resources         seal diet may represent a significant limiting factor
(Olesiuk 1993) and tend to target small, energy-rich       on steelhead productivity.
fish species (Lance et al. 2012). Harbor seals are            Changes in abundance or distribution of 2 other
highly mobile, with core foraging radii of approxi-        important species may have had significant ecologi-
mately 20 km (Peterson et al. 2012), but sometimes         cal impacts over the course of this study. First, the
make long-distance trips away from core haulout areas      West Coast Transient (marine mammal eating; i.e.
to exploit seasonal prey resources (Brown & Mate           not the endangered resident population) killer whale
1983, Lowry et al. 2001). Most harbor seal detections      Orcinus orca population experienced growth in
recorded in this study occurred within only a few kilo-    recent years, and visited the Salish Sea more fre-
meters of their capture site, although we did observe      quently between 2011 and 2017 than during the pre-
some individuals moving more extensively between           vious 7 yr (Houghton et al. 2015, Shields et al. 2018).
Puget Sound regions, and even into Canada. Harbor          Transient killer whales have the potential to tem-
seal mobility allows them to forage in a wide variety      porarily influence the behavior and distribution of
of habitats. Anchovies are present throughout mar-         marine mammals, and under some circumstances,
ine habitats of the Salish Sea but are more likely         have been estimated to consume substantial num-
encountered in nearshore, shallow waters of the            bers of harbor seals (London 2006). However, tran-
Strait of Georgia (Duguid et al. 2019), whereas steel-     sient-sightings data from Puget Sound (Olsen et. al
head are more likely detected further away from            2019) indicate that the largest increase in transient
shorelines in the surface waters of mid-Puget Sound        visits occurred in 2015 and 2016, followed by marked
channels (M. Moore unpubl. data). It is possible that      decreases in 2017 and 2018. This pattern does not
harbor seals may have vacated habitat used by mi-          correspond with the steelhead survival patterns dur-
grating steelhead to target large aggregations of          ing that timeframe. Pacific hake Merluccius produc-
anchovies.                                                 tus is a bentho-pelagic fish species and a favored
   The documented steelhead mortalities at harbor          prey resource for Salish Sea harbor seals (Thomas et
seal haulouts in 2014 suggest that harbor seals may        al. in press). Hake abundance estimates from bottom
constitute a substantial source of mortality under cer-    trawl surveys consistently conducted in Puget Sound
tain ecological conditions. Recent harbor seal diet        from 2008 to 2018 increased well above the
analyses, combined with bioenergetic estimates, have       2008−2016 average in 2017 and were dramatically
provided increasing evidence that pinniped preda-          higher than average in 2018 (D. Lowry unpubl. data).
tion can account for substantial numbers of outmi-         Hake catch did not increase in 2015 when steelhead
grating juvenile salmon in the Salish Sea (Chasco et       mortality began to decrease, and was highest in 2018
al. 2017, Thomas et al. 2017). The present study col-      when steelhead mortality began to increase, but the
lected data from only a few monitored harbor seals at      abundant hake available to harbor seals in 2017 and
each of 3 most prominent harbor seal haulout areas         2018 may still have reduced predation pressure on
along the steelhead migration corridor. We did not         steelhead and added to the buffering effect of an-
attempt to expand the number of detected predation         chovy. Predation impacts from transient killer whales
events to account for non-monitored seals foraging in      on harbor seals and the increases in hake abundance
different areas or to represent other, smaller haulout     may have had undocumented impacts on harbor
Moore et al.: Environmental influences on steelhead survival variability                         153

seals, but did not correspond directly to the steelhead       dent survival, for example, may outweigh or offset
survival patterns presented in this study.                    the benefits of reduced predation pressure due to
   Generally, cool Pacific Ocean temperatures (nega-          abundant alternative prey.
tive PDO indices) are associated with lower marine               Long-term ocean biological data sets are essential
mortality rates for Pacific salmon (Mantua et al. 1997,       for understanding climate change impacts on marine
Daly & Brodeur 2015). However, ocean temperature              ecosystems. Anchovy population dynamics in the
effects on Puget Sound steelhead smolt-to-adult re-           Salish Sea may be shifting from episodic to more sus-
turn (SAR) rate appear to be opposite in sign, with           tained as a result of continued warming, just one
warm-phase PDO years corresponding to lower steel-            example among other ecological changes that are
head mortality in marine waters, although large-              likely to affect early marine survival of steelhead and
scale ocean indicators are not strong indicators of           other salmonids. Anchovies in Puget Sound persisted
Puget Sound survival trends (Sobocinski et al. 2020).         into 2018 even though the marine heat wave techni-
Recent evidence suggests that conditions within               cally subsided in 2016, likely because Puget Sound
Puget Sound have a strong influence on steelhead              remained sufficiently warm to support anchovy
SAR trends (Kendall et al. 2017), including a strong          spawning and recruitment. The shifting predator−
negative association of harbor seal population abun-          prey dynamics and physiological processes caused
dance and weak positive associations of the PDO and           by warming marine temperatures will affect different
sea surface temperature in the Salish Sea (in the year        species in unpredictable ways. Some species will
of ocean entry) with Puget Sound smolt-to-adult steel-        benefit from these shifts, while others may have less
head survival rates (Sobocinski et al. 2020). Early           success under new conditions. By documenting the
marine survival of Puget Sound steelhead may be               interacting environmental and trophic mechanisms
driven by forage fish abundance and associated                governing steelhead survival and productivity in a
predator−prey dynamics, while Columbia River Chi-             fluctuating ecosystem, informed management and
nook salmon, for example, gain important survival             targeted recovery strategies can be developed to
benefits from availability of energy-rich prey re-            benefit threatened Puget Sound steelhead popula-
sources in the early ocean environment during cool            tions. Ecosystem-based management, specifically
years (Daly & Brodeur 2015). It is likely that different      focused on healthy forage fish populations and re-
ecological processes dominate in each unique habi-            duced predator impacts, will be important to con-
tat encountered throughout salmonid migration, and            sider as recovery actions are developed for Puget
that the pressures exerted by these different ecolog-         Sound steelhead.
ical processes contribute unequally toward the total
survival rate.                                                Acknowledgements. We greatly appreciate the efforts of all
   Other species of salmon (e.g. Chinook, coho) may           those who helped with planning and executing hydrophone
also be affected by the same anchovy-related re-              deployments and retrievals, fish tagging, and seal capture
ductions in predation pressure that we observed in            and tagging, namely Rob Endicott, Iris Kemp, Dyanna Lam-
                                                              bourn, Josh Oliver, Jed Moore, Sayre Hodgson, Chris
steelhead. Net-pen raised coho salmon smolts re-              Ellings, Walker Duval, Tom Friedrich, Rene Bracero, Emil-
leased in south Puget Sound were detected leaving             iano Perez, Sammy Stepetin, Scott Steltzner, Matt Klungle,
Puget Sound at the JDF array at a much higher rate            Chris Frazier, Justin Miller, Matt Pollack, and Katy Doctor.
(12%) in 2016 when anchovy abundance was high                 In addition to leading the seal tagging efforts, Steve Jeffries
                                                              provided the seal data in Table S1. Surface trawling in
relative to the detection rate (0%) of the same popu-         Skagit Bay was funded through the Skagit Intensively Mon-
lation released in 2006 when anchovies were not ob-           itored Watersheds Project by the Washington State Recre-
served in high numbers (S. Steltzner unpubl. data).           ation and Conservation Office. We thank the many staff and
To our knowledge, early marine survival rates of              volunteers who supported the long-term monitoring effort,
                                                              particularly Casey Rice, Anna Kagley, Dan Lomax, Josh
other salmon species have not been quantified in              Chamberlin, Jason Hall, and Craig Wollum. Special thanks
Puget Sound for annual comparison, making it diffi-           to the Salish Sea Marine Survival Project Steelhead Techni-
cult to speculate on the impact of anchovy on other           cal Team for critical discussion and project support. This is
                                                              Publication Number 49 from the Salish Sea Marine Survival
species. Chinook smolts may benefit from some
                                                              Project: an international, collaborative research effort
degree of reduced predation, but the relationship             designed to determine the primary factors affecting the sur-
may be more complicated because this species oc-              vival of juvenile Chinook salmon, coho salmon, and steel-
cupies marine habitat in Puget Sound for a much               head in the combined marine waters of Puget Sound and
                                                              Strait of Georgia (marinesurvivalproject.com). Finally, we
longer period than the 2 wk period observed for
                                                              appreciate the time and insight of 4 anonymous reviewers,
steelhead (Duffy et al. 2005). Other ecological inter-        whose feedback greatly improved the clarity and quality of
actions, including competition and density-depen-             this paper.
You can also read