THE WORLD OVARIAN CANCER COALITION ATLAS
←
→
Page content transcription
If your browser does not render page correctly, please read the page content below
THE WORLD OVARIAN
CANCER COALITION ATLAS
GLOBAL TRENDS IN INCIDENCE, MORTALITY
AND SURVIVAL

April 2018

This report has been produced and funded by the World Ovarian Cancer Coalition
© World Ovarian Cancer Coalition 2018

Study Director: Frances Reid
Expert Advisory Panel Co-Chairs: Professor Neerja Bhatla and Annwen Jones
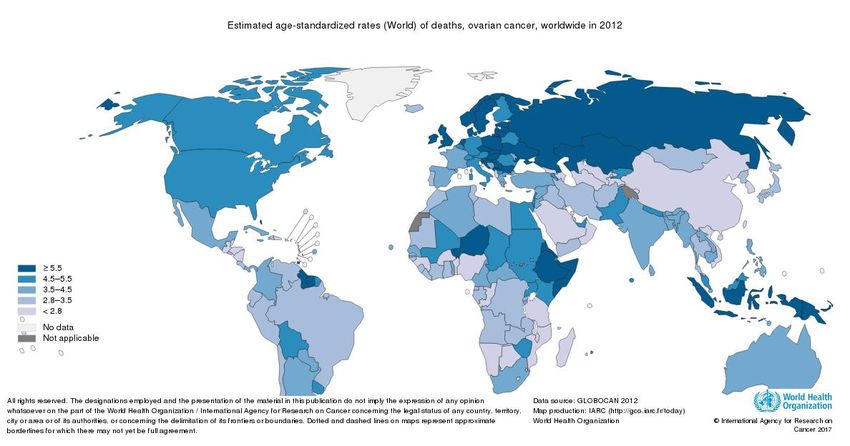
TABLE OF CONTENTS
EXECUTIVE SUMMARY ........................................................................................................... 4

   KEY FINDINGS .................................................................................................................................. 4
   RECOMMENDATIONS TO THE WORLD OVARIAN CANCER COALITION .......................... 6

GLOBAL CANCER STATISTICS (ALL CANCERS) ................................................................ 7

OVARIAN CANCER GLOBAL STATISTICS .......................................................................... 10

   OVARIAN CANCER AS A PRIORITY IN TERMS OF WOMEN’S CANCER........................... 12

OVARIAN CANCER – VARIABLE FACTORS ....................................................................... 13

   VARIATIONS IN INCIDENCE AND MORTALITY RATES, AND BURDEN OF DISEASE .... 13
   VARIATION BY TYPES OF TUMOUR ......................................................................................... 15
   VARIATION BY RACE .................................................................................................................... 16
   VARIATION IN AGE PROFILE ...................................................................................................... 16
   FAMILY HISTORY ........................................................................................................................... 17
   TRENDS IN MORTALITY RATES ................................................................................................. 18
   SUMMARY ....................................................................................................................................... 19
SURVIVAL RATES FOR OVARIAN CANCER ....................................................................... 20

   STAGE OF DIAGNOSIS ................................................................................................................. 20
   SHORT-TERM MORTALITY AND EMERGENCY PRESENTATION ...................................... 21
   TUMOUR DEVELOPMENT ........................................................................................................... 21
   LOCAL VARIATIONS - DIAGNOSIS............................................................................................. 22
   LOCAL AND NATIONAL VARIATIONS IN SPECIALIST SURGERY ...................................... 22
   VARIATION IN SURVIVAL RATES BETWEEN COUNTRIES .................................................. 23
   SUMMARY ........................................................................................................................................ 28
   DATA ON OVARIAN CANCER PATIENT EXPERIENCE ......................................................... 29

IN CONCLUSION ..................................................................................................................... 30

RECOMMENDATIONS ............................................................................................................ 30

REFERENCES ......................................................................................................................... 32

THE WORLD OVARIAN CANCER COALITION ATLAS ©The World Ovarian Cancer Coalition 2018                                                                   2
THE EXPERT ADVISORY PANEL
Our sincere thanks go to the members of our Every Woman Study Expert Advisory
Panel for their oversight and input.

CO-CHAIRS

   •   Professor Neerja Bhatla, Department of Obstetrics and Gynecology, All India
       Institute of Medical Sciences, New Delhi and Chairperson, FIGO Committee
       for Gynecologic Oncology.
   •   Annwen Jones, Vice-Chair of the World Ovarian Cancer Coalition and Chief
       Executive of Target Ovarian Cancer, UK.

MEMBERS

   •   Dr Tracey Sheridan Adams, Groote Schuur Hospital, Cape Town, South
       Africa.
   •   Amanda Benites, patient representative, Brazil.
   •   Dr Stephanie Blank, Professor at the Icahn School of Medicine at Mount Sinai
       in New York and Director of Women’s Health, Mount Sinai Downtown
       Chelsea Centre, USA.
   •   Robin Cohen, Executive Director of the Sandy Rollman Ovarian Cancer
       Foundation; oncology nurse specialist in Philadelphia; board member of the
       World Ovarian Cancer Coalition; and of the Ovarian Cancer Research Fund
       Alliance, USA.
   •   Diane Gardiner AM, patient representative, Australia.
   •   Sylvia Gregory, patient representative, Italy.
   •   Dr Amit Oza, Professor of Medicine at the University of Toronto, and Medical
       Director of the Cancer Clinical Research Unit, Princess Margaret Cancer
       Centre, Toronto, Canada.
   •   Makiko Suzuki, patient representative, Japan.

THE WORLD OVARIAN CANCER COALITION ATLAS ©The World Ovarian Cancer Coalition 2018    3
EXECUTIVE SUMMARY
The mission of the World Ovarian Cancer Coalition is to ensure the best possible
chance of survival, and the best possible quality of life for every woman with ovarian
cancer, wherever she lives.
The World Ovarian Cancer Coalition’s Every Woman Study aims to bring together an
authoritative evidence base that speaks to the views of women with ovarian cancer
across the globe: evidence that will enable us to formally highlight gaps, challenges,
opportunities and good practice in order to set out what needs to be done to make
our mission a reality. The study will also be informed and strengthened by
contributions from the wider ovarian cancer community including patient advocacy
organisations as well as world leaders in ovarian cancer research and clinical
practice and will provide strong call to actions.
As part of the World Ovarian Cancer Coalition’s Every Woman Study, this report
presents the results of desk research exploring the latest global ovarian cancer
statistics, their potential purpose, accuracy and validity, and trends over time.
Reasons for variations between countries as far as they are understood are
explored, implications for the Every Woman Study are discussed, and a number of
calls to action made.
KEY FINDINGS
• It was estimated that in 2012 there were 239,000 cases, and 152,000 deaths
worldwide from ovarian cancer, with some 600,000 women living within five
years of a diagnosis.
• It is estimated that by 2035, incidence will increase to 371,000 a year (55%)
and deaths will increase by 67% to 254,000.
• In terms of gynecological cancers, the greatest burdens are cervical cancer
(less developed countries) and endometrial cancer (more developed
countries), but the overall poor survival rates for ovarian cancer, which are
considerably worse than those for cervical or endometrial cancers, provide a
consistent imperative to seek improvements globally.
• There are major challenges in dealing with global cancer statistics, mainly
due to huge variations in registration of cancer incidence and mortality. A
country is considered to have high quality data when it records more than
50% of cases. For a considerable number of countries, statistics are
estimated rather than based on fact. It is thought this may lead to
underestimation of cases and an overestimation of survival rates.
• Although the risk of developing and dying from ovarian cancer is almost twice
as high in developed countries when compared to less developed countries,
the actual burden (number of cases) is much higher in less developed
countries, due to population sizes. For example, China has the largest
THE WORLD OVARIAN CANCER COALITION ATLAS ©The World Ovarian Cancer Coalition 2018 4number of diagnoses per year (34,575), followed by India (26,834), then the
USA (20,874).
• Risk of developing ovarian cancer rises as a country becomes more
developed, and as areas become more urbanised. This means the three
drivers of cancer burden (increasing populations, increased longevity, and
increases in risk because of environmental factors) will mean ovarian cancer
becomes even more of an issue in developed, and less developed countries.
• There are also many other variants affecting risk and mortality rates, including
ethnicity, tumour types, and age profiles.
• There have been improvements in the mortality rates in recent years but vary
according to country. One major factor has been the use of the oral
contraceptive pill. The largest declines were in the USA and parts of Europe
where early and widespread uptake of the oral contraceptive occurred,
possibly also where there has been a reduction on hormone therapy use for
middle-aged women. Increasing obesity amongst populations though is seen
as having a negative effect.
• Ovarian cancer survival rates vary widely. Different studies can vary in what
types of ovarian cancer are included, the level of cancer registration, and
background mortality calculations, so comparisons between studies are not
advised. The latest five-year survival rates largely fall between 30% and 50%
and in general have begun to improve over the last 20 years. There are in
depth studies looking at higher income countries to determine why these
variances exist, including stage at diagnosis, awareness of symptoms, patient
delay seeking help, delays in diagnosis, access to tests, role of family doctors
as gatekeepers, and access to treatments. In other countries (often less
developed) issues are more fundamental including attitudes to cancer, lack of
general physicians let alone those trained in oncology, lack of equipment and
access to tests. For example, in Uganda, excluding breast cancer cases, the
overall five-year survival rate for cancer was just 13%. This compares to the
overall five-year survival rate in Australia, for all cancers, of 68%. 1
• In recent years a focus on specialist care (in particular surgery) is seen as a
way to improve survival.
• Developments in understanding genetic mutations (germline and somatic)
offer new hope in terms of targeted treatments, and primary prevention.
• There is a need for good data to drive research and understanding for
different communities and tumour types.
• There is a paucity of patient experience data, and certainly none on a global
level, and almost none at a national level. Where academic research has
been done it tends to focus on the psychological impact of a diagnosis, or on
symptoms leading to diagnosis. Charities and pharmaceutical companies
have undertaken some of their own research.
THE WORLD OVARIAN CANCER COALITION ATLAS ©The World Ovarian Cancer Coalition 2018 5RECOMMENDATIONS TO THE WORLD OVARIAN CANCER
COALITION
• The World Ovarian Cancer Coalition has an important role to play in providing a
call to action to address globally low survival rates.
• The opportunity to provide patient experience insight on a global level would
strongly support the call to global action.
• The World Ovarian Cancer Coalition should seek to support global initiatives to
improve cancer registration and efforts to develop and sustain infrastructure
(training, retention of staff, appropriate equipment).
• The World Ovarian Cancer Coalition should look to work with other global cancer
projects such as the Union for International Cancer Control (UICC), the
International Agency for Research on Cancer (IARC) and initiatives within the
World Health Organisation (WHO) where goals correspond. For example,
supporting the following targets for 2025 from the UICC’s World Cancer
Declaration (2013) 2.
o Target 2: Population-based cancer registries and surveillance systems will
be established in all countries to measure the global cancer burden and
the impact of national cancer control programmes.
o Target 5: Stigma associated with cancer will be reduced and damaging
myths and misconceptions about the disease dispelled.
o Target 6: Population based screening and early detection programmes
will be universally implemented, and levels of public and professional
awareness about important cancer warning signs and symptoms will have
improved.
o Target 7: Access to accurate cancer diagnosis, quality multimodal
treatment, rehabilitation, supportive and palliative care services, including
the availability of affordable essential medicines and technologies will
have improved.
o Target 9: Innovative education and training opportunities for healthcare
professionals in all disciplines of cancer control will have improved
significantly, particularly in low and middle-income countries.
• The World Ovarian Cancer Coalition should look to other site-specific
global coalitions to share information and find common action points.
• The World Ovarian Cancer Coalition should continue its efforts to balance the
focus between more and less developed nations.
• The World Ovarian Cancer Coalition should periodically review this report and
update when required.
THE WORLD OVARIAN CANCER COALITION ATLAS ©The World Ovarian Cancer Coalition 2018 6GLOBAL CANCER STATISTICS (ALL
CANCERS)
According to estimates from the World Health Organisation (WHO) in 2015 3, deaths
from cancer along with deaths from coronary heart disease and deaths from stroke
are the leading causes of mortality worldwide. It is projected that the number of new
cases of cancer each year will increase by 70% between 2012 and 2030 4, rising from
14 million new cancer cases to over 22 million, with an ever-increasing burden on
low and middle-income countries5.
Michel Coleman describes the three engines of escalating cancer burden as being
on the move: rapid population growth, ageing populations and an increase in cancer
risk (lifestyle/environment) at each age 6. With the associated strain on economies,
timely and accurate statistics are imperative to provide evidence and impetus for
identifying and developing cancer control strategies at a national level.
Within this report, the following terms are used:
• Incidence – the number of cases of the disease.
• The incidence rate is the percentage of the population who will develop the
disease within given boundaries, for example 7 women per 100,000 female
population might develop the disease each year.
• Mortality – the number of deaths from the disease. The mortality rate is the
percentage of the population who will die from the disease within given
boundaries, for example 3 per 100,000 female population might die from the
disease each year.
• 5-year prevalence is the number of people living with 5 years of a diagnosis.
• Survival rates – the percentage of those affected by the disease who are alive
at a certain time point beyond diagnosis, for example, 5-year survival rate is
the percentage of women alive 5 years after their diagnosis.
Commonly reported cancer statistics include incidence and mortality, however only
34/194 WHO member states report high quality national mortality data, and 68/134
reporting high quality incidence data. In some countries, such as Norway, cancer
reporting is a legal requirement, and data is then linked with the cause of death
registry. For 2001-2005 data, Norway’s cancer data was 98.8% complete, with
93.8% verified by biopsy samples under a microscope7.
Incidence data derives from population-based cancer registries (PBCR). Although
PBCRs may cover national populations, more often they cover smaller, subnational
areas, and particularly in countries undergoing development, only selected urban
areas. In 2006, about 21% of the world population was covered by PBCR, with
sparse registration in Asia (8% of the total population) and in Africa (11%) 8. In these
instances where there is a paucity of cancer data, national incidence and mortality
data is often estimated from datasets of regional registries, or neighbouring
countries.
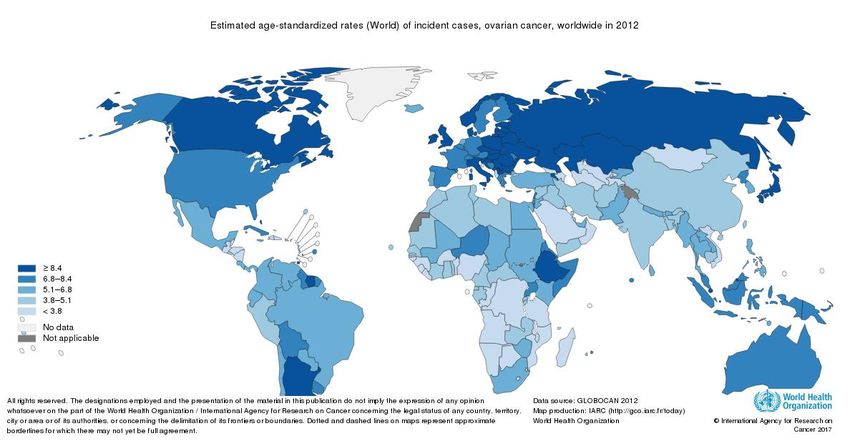
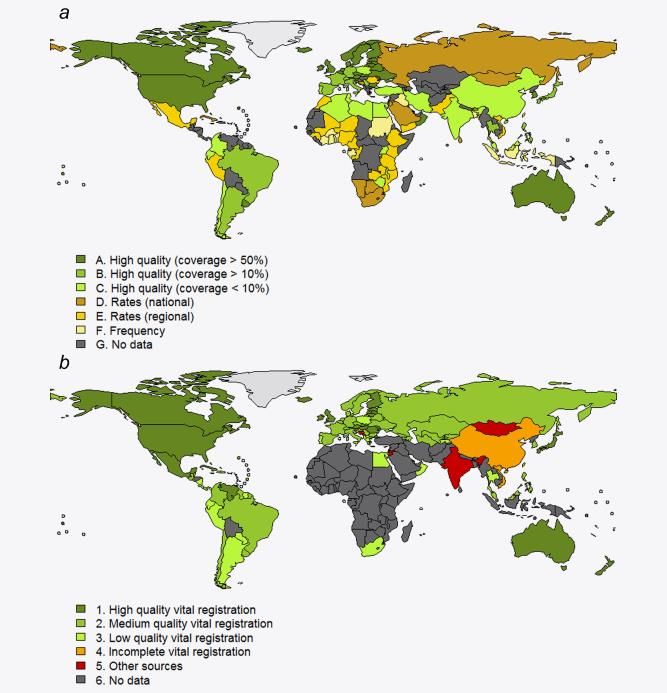
THE WORLD OVARIAN CANCER COALITION ATLAS ©The World Ovarian Cancer Coalition 2018 7For the purposes of this report, figures will largely relate to those produced by the Globocan project.9The aim of the project is to provide contemporary estimates of the incidence, mortality and prevalence for major types of cancer, at a national level in 184 countries. The latest figures are the estimates for 2012. Because methodology has been adapted between different publications of Globocan it is not possible to highlight trends. In an assessment of the Globocan methods by Antoni et al 10 they highlight that the lack of high-quality data could undermine the estimates, and that efforts should be made on an on-going basis to develop and improve the methods used; in addition, support should be given to the Global Initiative for Cancer Registry Development (GICRD)11. GICRD say that only one in five low and middle-income countries currently have the necessary data to drive policy and reduce the burden and suffering due to cancer. By 2035 they estimate that 70% of the cancer burden will fall on under-resourced regions least equipped to provide patient care from basic treatment to palliation. Charts from the Globocan 2012 report show the quality of the data available for cancer incidence (Chart 1a) and mortality (Chart 1b). The Cancer Today website (http://gco.iarc.fr/today/data-sources-methods) indicates resources used for the calculations by country and pulls together the Globocan data. As an example, in Africa, the countries with the best registration for incidence (high- quality but less than 10% coverage) are Algeria, Libya, Tunisia, Egypt, Uganda, Zimbabwe and Malawi. Large sections of central Africa have no data whatsoever. In terms of mortality data, South Africa and Egypt have low-quality vital registration, but the rest of Africa has no data. In the Globocan study for example, mortality is estimated from incidence data and modelled survival rates. THE WORLD OVARIAN CANCER COALITION ATLAS ©The World Ovarian Cancer Coalition 2018 8
QUALITY OF GLOBAL CANCER DATA ON 1a) INCIDENCE, and 1b MORTALITY 12

THE WORLD OVARIAN CANCER COALITION ATLAS ©The World Ovarian Cancer Coalition 2018   9
OVARIAN CANCER GLOBAL STATISTICS
Ovarian cancer is the 7th most common cancer, and 8th most common cause of
death from cancer in women in the world.

In 2012 the Globocan study estimated there were 239,000 cases, and 152,000
deaths (representing 3.6% of cancer cases, and 4.3% of cancer deaths). Worldwide
there are almost 600,000 women living within five years of an ovarian cancer
diagnosis (5-year prevalence).

The Globocan study predicts that by 2035 there will be a worldwide increase of 55%
in incidence to 371,000, and an increase in deaths of 67% to 254,000 13. These
figures were calculated using UN World Population Prospects (2012 revision) and
applying Age Standardised Rates in the corresponding populations.

In terms of numbers affected by continent, the figures are as follows for 2012.

  OVARIAN CANCER        INCIDENCE 2012         MORTALITY 2012        5-YEAR
                                                                     PREVALENCE
  ASIA                  111,887                66,215                276,073

  EUROPE                65,584                 42,749                157,198

  NORTH AMERICA         23,529                 16,995                58,702

  LATIN AMERICA         17,921                 11,471                48,439
  AND CARIBBEAN

  AFRICA                17,755                 13,085                41,052

  OCEANIA               2,043                  1,402                 5,160

On the next page is a list of countries with the highest number of cases, together with
the number of deaths, and five-year prevalence (women living within five years of
diagnosis).

THE WORLD OVARIAN CANCER COALITION ATLAS ©The World Ovarian Cancer Coalition 2018    10
5yr prevalence China
incidence
deaths India
USA
Russian Federation
Indonesia
Japan
UK
Germany
Italy
Brazil
France (Metropolitan)
Poland
Ukraine
Pakistan
Mexico
Spain
Bangladesh
Thailand
Canada
0 20000 40000 60000 80000 100000
COUNTRIES WITH THE LARGEST NUMBER OF WOMEN WITH OVARIAN CANCER
(source Globocan)
THE WORLD OVARIAN CANCER COALITION ATLAS ©The World Ovarian Cancer Coalition 2018 11OVARIAN CANCER AS A PRIORITY IN TERMS OF WOMEN’S
CANCER
By far the most common ‘women’s cancer’ is breast cancer. In 2012, there were
estimated to be 1,671,149 cases, and 521,907 deaths. There were thought to be 6.2
million women living within five years of a diagnosis. All figures are taken from
Globocan.
When considering the most common gynecological cancers, the burden is affected
by the development status of a country but differs according to the cancer site.
Cervical cancer is a much greater issue in less developed parts of the world, largely
due to lack of screening, vaccination and poor sexual health. Uterine cancer is
strongly linked to body mass index and has seen a steep rise in incidence in more
developed parts of the world in recent years. As such, different countries will place
differing priorities in terms of gynecological and more generally women’s cancer
control.
GYNECOLOGICAL CANCER INCIDENCE (2012)
800,000
700,000
151,746
600,000
500,000 uterine
400,000
444,546 cervical
300,000
167,859 ovarian
200,000
83,078
100,000
99,752 138,967
0
more developed less developed
GYNECOLOGICAL CANCER MORTALITY (2012)
400,000
350,000
41,440
300,000
250,000
uterine
200,000 230,158
cervical
150,000
34,720 ovarian
100,000
35,514
50,000 86,103
65,904
0
more developed less developed
THE WORLD OVARIAN CANCER COALITION ATLAS ©The World Ovarian Cancer Coalition 2018 12OVARIAN CANCER – VARIABLE FACTORS
The term ‘ovarian cancer’ is not a singular diagnosis, rather it is an umbrella term for
a multitude of different types of cancer that affect the ovaries, fallopian tubes, and the
primary peritoneal cavity. It is estimated that there are more than 30 different types
of ovarian cancer, and there is a very wide variation in terms of incidence of the
different types, and outlook for women diagnosed with differing forms.
As the following section outlines, there are certain factors that increase a woman’s
risk of developing ovarian cancer:
• Age.
• Family history.
• Where she lives in the world.
• Hormonal and reproductive factors.
Where a woman lives, her ethnicity, and whether or not she has a family history not
only has a bearing on her overall risk but can affect the type of ovarian cancer she
may develop, and the age at which it starts.
VARIATIONS IN INCIDENCE AND MORTALITY RATES, AND
BURDEN OF DISEASE
Age standardised incidence rates (ASR) from 2012 are highest in more developed
regions, with rates in these areas exceeding 7.5 per 100,000, and lowest in Sub-
Saharan Africa with rates below 5 per 100,000. For explanations of the terminology
see Appendix 1. The average risk of dying from ovarian cancer before the age of 75
is twice as high in more, rather than less developed regions, with deaths from the
disease ranking as the 5th most common among women in more developed
regions14.
INCIDENCE (ASR) PER MORTALITY (ASR)
100,000 PER 100,000
LESS 5.0 3.1
DEVELOPED
MORE 9.2 5.0
DEVELOPED
WORLD 6.1 3.7
AVERAGE
However, as can be seen from the following chart, in terms of actual numbers of
women affected by ovarian cancer, the majority live and die in less developed parts
of the world because of population sizes.
THE WORLD OVARIAN CANCER COALITION ATLAS ©The World Ovarian Cancer Coalition 2018 13INCIDENCE MORTALITY 5 YEAR PREVALENCE
2012 2012
LESS 138,967 86,013 341,206
DEVELOPED
MORE 99,752 65,904 245,418
DEVELOPED
TOTAL 238,719 151,917 586,624
To view the global map of Age Standardised Incidence Rates for ovarian cancer go
to https://gco.iarc.fr/today/online-analysis-map then select heatmap, incidence,
global, ASR, ovary (from drop down menu).
To view the global map of Age Standardised Mortality Rates for ovarian cancer follow
the link above but select Mort. etc.
THE WORLD OVARIAN CANCER COALITION ATLAS ©The World Ovarian Cancer Coalition 2018 14Rates of incidence and mortality, as already shown, are higher in more developed countries. As countries undergo development, ovarian cancer rates appear to rise, particularly in urban areas. This has been demonstrated in studies in China and Egypt, where incidence rates are almost twice as high in urban areas as opposed to rural areas15. In China, incidence and mortality is rising to the extent that authors have called for it to be recognised as a significant public health problem in Chinese women. An Asian wide study found a significant positive correlation between the Human Development Index (which measures the socio-economic status of people living in different countries) and the standardised incidence rate of ovarian cancer16. The paper also points out the impact of a falling birth rate and better life expectancy resulting in increasingly older populations will mean that non-communicable diseases such as cancer will increasingly place a significant burden in the future, particularly in developing countries. The authors point to genetic and environmental factors, such as socioeconomic conditions, and lifestyle affecting risk. VARIATION BY TYPES OF TUMOUR Limited evidence suggests that there is a difference in the balance of types of ovarian cancer, depending on the level of development in a country. In developed countries, 90% of ovarian cancer cases are epithelial in origin, with germ cell tumours accounting for 2-3% of cases, and sex cord stromal tumours accounting for 5-6%. However in Africa and Asia, it appears that germ cell tumours account for between 10 and 15% of cases 17. These tumours are more treatable and occur in younger women. THE WORLD OVARIAN CANCER COALITION ATLAS ©The World Ovarian Cancer Coalition 2018 15
VARIATION BY RACE
Variations have been described between different races in other studies 18. Morris et
al.19 reported that ovarian cancer incidence was higher in White (12.8/100,000) than
Black (9.8/100,000) women. Yet, when compared with White women, the African-
American women were more likely to have higher mortality, the authors say
potentially due to the lack of sufficient diagnostics and sophisticated treatments,
meaning women presented with later stage disease and had shorter disease-free
survival. Additionally a study in California over 10 years, showed that among
patients with advanced-stage ovarian cancer, African American race, low social
economic status, and treatment by low volume providers are significant and
independent predictors of receiving no surgery, no debulking surgery, no
chemotherapy and non-standard treatment sequences20. It is clear that optimum
cancer diagnosis and care is not accessible to all.

A study in the US showed that the median age for diagnosis for Asian women was
56, vs. 64 for white women21. Asian women were more likely to undergo primary
surgery, have an earlier stage of disease, have a diagnosis of a non-serous histology
and have lower grade tumours. 5-year disease specific survival was higher
compared to whites (59.1% vs 47.3% p
gynecological cancers in a Ghanaian teaching hospital23, showed the mean age seen
for women with ovarian cancer was 46 years old, but there was little or no
commentary or comparative data. Here, average life expectancy is 63.9 for women.
In the Jiangsu province of China, age specific incidence peak appears to peak aged
60-64, with age specific mortality highest in the 65-69 age group (average life
expectancy is 77.6 for women).

FAMILY HISTORY
For generations, it has been clear that in some families, ovarian cancer is more
prevalent than in the general population. A major breakthrough came in 1994 when
it was discovered that faults in the BRCA1 and 2 genes could increase a woman’s
risk of developing breast or ovarian cancer. Tests were developed afterwards to
identify germline mutations (i.e. those passed on from generation to generation) that
could then identify women at risk. With a mutated BRCA1 gene, a woman has a risk
of 44% of developing ovarian cancer by the age of 80, and a 17% risk with a mutated
BRCA2 gene24. Mutations in other genes such as TP53 and RAD51c can also play a
role in raising the risk of ovarian cancer, but the impact is nowhere near as significant
as the BRCA genes.

Germline (inherited) BRCA mutation is associated in ovarian cancer with distinct
clinical behaviour: earlier age of diagnosis, improved survival, visceral distribution of
liver disease, higher response rates to platinum and non-platinum agents, and
sensitivity to PARP inhibitors. It is increasingly apparent that a proportion of sporadic
ovarian cancers also share the pathological and clinical traits of BRCA mutation, but
in the absence of a germline mutation. This has been called ‘BRCAness’–
homologous recombination (HRD) DNA repair defect is present in the absence of a
germline mutation, a term first used by the team at the Institute of Cancer Research
in London but now being redefined as understanding increases 25. A study by the
Cancer Genome Atlas Research Network has shown 9% BRCA1, 8% BRCA2, 3%
somatic (i.e. acquired) mutation of the BRCA genes. HRD is present mostly (but not
exclusively) in high grade serous ovarian cancers 26. The study authors conclude that
the benefits of new PARP treatments go beyond germline mutations, therefore
access to BRCA Somatic Mutational Analysis in routine clinical practise is needed,
either by archived specimen or new biopsy.

Up until recently, tests were only carried out on women who had several close blood
relations affected by ovarian and/or breast cancer. However, the now recognised risk
of ovarian cancer patients, even those with no known family history, harbouring a
mutation in BRCA1/2, together with the first poly adenosine diphosphate ribose
polymerase inhibitors (PARPi; Olaparib [Lynparza]; Niraparib; Rucaparib) being
licenced for the treatment of BRCA-mutated ovarian cancer has led to
reconsideration of referral criteria for ovarian cancer patients 27.

THE WORLD OVARIAN CANCER COALITION ATLAS ©The World Ovarian Cancer Coalition 2018     17
The potential to test more women with ovarian cancer will help in two important
areas:

   •   To determine the most appropriate individualised treatments

   •   To find those at increased risk (beyond those with a clear family history). If
       managed correctly with appropriate support and counselling for those
       undergoing testing, the prospect of increased primary prevention is a
       significant one, potentially reducing the impact of this deadly disease in future
       years.

There is still much more work to be done, in different populations, to identify where
mutations occur within the BRCA1 and 2 genes. For example, in women of
Ashkenazi Jewish descent, founder mutations occur mainly in three sites 28, whereas
in different populations mutations can occur at many different points. A recent study
by Rebbeck et al has shown that the risks may vary by type and location of BRCA
mutation29.

TRENDS IN MORTALITY RATES
A recent paper by Malvezzi et al 30 in 2016 examines the trends in mortality rates.
Their findings are laid out below:

While ovarian cancer incidence rates continue to rise, age adjusted ovarian cancer
mortality rates have levelled or even declined over the last 2 decades. However, the
authors highlight there are persisting and substantial differences in ovarian cancer
patterns and trends:

   •   In the EU, age-adjusted ovarian cancer mortality rates decreased 10%
       between 2002 and 2012, to 5.2 per 100,000. The decline was 16% in the
       USA, to 4.9 per 100,000 in 2012. Latin American countries had lower rates,
       and declines were observed in Argentina and Chile. Likewise, modest
       declines (2.1%) were observed in Japan, whose rate remained low (3.2 per
       100,000 in 2012). Australia had a rate of 4.3 per 100,000 in 2012, and a 12%
       decline.
   •   The falls were larger in young women, rather than in middle or old age.
       Recent rates at age 20–49 were higher in Japan than in the EU and the USA.
       Predictions to 2020 indicate a further 15% decline in the USA and 10% in the
       EU and Japan. The authors attribute some of the progress to the long-term
       protective effect of the Oral Contraceptive Pill (OCP) (decreasing risk),
       particularly in countries of Northern Europe and the USA where uptake of the
       OCP was early and more widespread.
   •   These authors say a recent decrease in menopause hormone use may also
       partly explain the fall in rates for middle aged and elderly women in countries
       like Germany, the UK or the USA, where the use of menopausal hormones
       was more common. Part of the falls in these countries may be due to the fact
       that they had the highest ovarian cancer rates in the past.
   •   They argue that delays in the adoption of recent advancements in diagnosis
       and management may have unfavourably affected mortality in central and
       eastern European countries in ovarian as other cancers, and say

THE WORLD OVARIAN CANCER COALITION ATLAS ©The World Ovarian Cancer Coalition 2018     18
improvements in ovarian cancer management are however likely limited,
apart from advancements in the treatment of ovarian germ cell tumours,
which account for less than 10% of all ovarian cancers. The authors say it is
difficult to explain the persisting high rates in central and Eastern Europe.
They suggest fertility has been relatively low in that area over the last
decades, and multiple parity and breastfeeding reduce ovarian cancer risk.
However, they say the substantial differences are unlikely to be explainable
by differences in fertility alone. Other environmental factors, including obesity
and diet, have been related to ovarian cancer risk. The quantification of their
effect on national mortality rates remains undefined.
• Finally, the authors say it is also difficult to explain the low rates in Japan and
Korea. Diet and leanness in the past may partly account for them, but parity
and OC use were relatively low in those countries. Thus, hormonal and
reproductive features cannot account for their low rates. Recent trends in
these countries have not been declining appreciably, suggesting a future
global levelling of ovarian cancer mortality, as confirmed by the recent rates
higher in young Japanese women compared with western countries.
SUMMARY
In summary the following complex factors have been shown to be, or potentially
linked to the risk for an individual woman of developing ovarian cancer and the
chance of her dying from the disease:
RISK FACTOR OUTLINE NOTES
AGE In general increased age
increases risk of developing
ovarian cancer
GEOGRAPHIC Increased risk in more Risk can be altered by
LOCATION/SOCIO- developed countries, and more moving
ECONOMIC STATUS developed parts of countries
RACE/ETHNICITY Risk varies according to Affects age profile, and
race/ethnicity types of tumour
FAMILY HISTORY Increases risk Affects age profile and
types of tumour
HORMONAL OR Use of oral contraceptive pill, Applies around the world,
REPRODUCTIVE number of pregnancies and but cultural factors
FACTORS duration of breastfeeding affect determine effect
risk (positively)
THE WORLD OVARIAN CANCER COALITION ATLAS ©The World Ovarian Cancer Coalition 2018 19SURVIVAL RATES FOR OVARIAN CANCER
Comparing survival rates between countries, and between cancer types is a near
impossible task, as they are measured in many different ways, using different criteria,
and including or excluding certain data. The figures contained in this section should
only be used within the context that they are cited and not taken as applicable in
other situations. Usually they are cited in terms of one or five-year survival and
indicate the proportion of women diagnosed with ovarian cancer, who are likely to be
alive at one year, and five years post diagnosis. For an individual woman, of course
it is impossible to estimate this likelihood with any certainty. However, for many
women (but certainly not all) they would like to know what the possibilities are.
For the purpose of comparing ovarian cancer survival statistics with those of breast,
cervical or endometrial cancer, these figures have been extracted from a study
looking at 10, 5 and 1-year survival amongst common types of cancer in people
diagnosed in England and Wales over a period of 40 years 31 up until 2011.
BREAST ENDOMETRIAL CERVICAL OVARIAN
5-YEAR 87% 79% 67% 46%
SURVIVAL
STAGE OF DIAGNOSIS
It is accepted that both one- and five-year survival rates for ovarian cancer are very
much determined by the stage at which it is diagnosed, i.e. the extent to which it has
spread. The chart below is taken from the Office for National Statistics Statistical
Bulletin: Cancer survival by stage at diagnosis for England: Age-standardised 1-year
net survival (%) for women (aged 15 to 99 years) diagnosed with ovarian cancer in
2015, followed up to 2016, 32
Figures from the National Cancer Institute SEER Database, for patients diagnosed
between 2004 and 2010 in the United States gave the following 5-year survival rate
for epithelial ovarian cancer 33:
THE WORLD OVARIAN CANCER COALITION ATLAS ©The World Ovarian Cancer Coalition 2018 20FIGO STAGE 5 YEAR RELATIVE SURVIVAL (EPITHELIAL OVARIAN
AT DIAGNOSIS CANCER) – U.S
I 90%
II 70%
III 39%
IV 17%
SHORT-TERM MORTALITY AND EMERGENCY PRESENTATION
A report by the National Cancer Registration and Analysis Service (NCRAS) in
England highlighted short-term ovarian cancer mortality as a particular issue, with
15% of women with ovarian cancer dying within 2 months of their diagnosis 34. Three
risk factors were identified for death within a year of diagnosis:
• Emergency presentation (56% died in first year).
• Advanced age - 43% of those aged 70-79 died in first year, and 70% of over
80s.
• Tumour morphology – those who had ‘unclassified epithelial ovarian cancer’
or ‘miscellaneous or unspecified ‘morphology.
Women who had more than one of these risk factors had an even higher chance of
dying quickly.
A study in the US concluded for a sample of over 9,000 women with either stage III
or IV disease that 43% died within the first year, 26% of the cohort within the first 90
days. Older age, increased co-morbidity, stage IV disease, lack of a visit to a
gynecologic oncologist and surgery were all associated with an increase in 90-day
mortality35.
It is clear that there is a very significant proportion of women with ovarian cancer, for
whom their diagnosis comes too late, where their performance status is such they
cannot receive treatment, or that emergency presentation means an increased risk of
non-assessment by a multi-disciplinary team and surgery by a non-specialist where
surgery is required as a matter of urgency.
TUMOUR DEVELOPMENT
With ovarian cancer it is becoming apparent that there can be fundamental
differences between early and later stage tumours, with suggestions there may not
always be a linear and predictable connection (ie start at FIGO stage I and progress
through II, III, IV). Lengyel in 2010 described ovarian tumours as developing in any
of 3 potential sites (the surface of the ovary, the fallopian tube, or the mesothelium
lined peritoneal cavity) 36. He then says there is either a stepwise mutation from slow
growing borderline tumour to well differentiated carcinoma (type 1), or there evolves
a genetically unstable high-grade serous carcinoma that spreads rapidly (type 2). In
particular, this type may be very hard to detect at an early point.
THE WORLD OVARIAN CANCER COALITION ATLAS ©The World Ovarian Cancer Coalition 2018 21LOCAL VARIATIONS - DIAGNOSIS This uncertainty however should not delay attempts to improve the speed and stage of diagnosis for women with ovarian cancer. The imperative is not just moral, but financial too. Analysis of costs in England showed potential for significant savings, if all Clinical Commissioning Groups (CCGs) who organise health services in a particular area were able to achieve the levels of early diagnosis of the best performing CCGs for ovarian cancer, then £16m per annum could potentially be saved, and 1,400 patients would benefit37. To put this figure into context, the National Cancer Research Institute partners (U.K) spent a total of £8.5m on ovarian cancer research in 2015-638. On those figures, if the money saved was diverted, the ovarian cancer research spend in the UK could be almost trebled. LOCAL AND NATIONAL VARIATIONS IN SPECIALIST SURGERY Following the Calman-Hine report in the UK (1995), national guidance was introduced on commissioning cancer services. “Improving outcomes in gynecological cancers – The Manual 1999” provided a focus for the creation of specialist cancer centres, where women were treated by subspecialty trained surgeons and received multidisciplinary team care39. However, progress towards centralisation and specialistion of care was slow. A study published in 2015 showed that by 2009 many women were still not receiving specialist surgery, and the majority were not being operated on by General Medical Council accredited gynecologic oncologists, and there was considerable regional variation40. Anecdotal evidence in the UK more recently is that the situation has improved, but it is included here to demonstrate that shifting towards surgery in specialist centres is not necessarily straightforward or timely. The focus on specialist surgery has been of interest around the world. In 2009 Bristow et al showed that after controlling for other factors, ovarian cancer surgery performed by a high-volume surgeon was associated with a 69% reduction in the risk of in-hospital death, while high-volume care was associated with increased likelihood of cytoreduction, shorter length of stay and lower hospital related costs of care41. Another study in California in 2014 led by Bristow, showed that among patients with advanced stage ovarian cancer, the provider combination of high- volume hospital and high-volume physician is an independent predictor of improved disease specific survival. However, it highlighted that access to high-volume ovarian cancer providers is limited, and the barriers are more pronounced for patients with low socioeconomic status, Medicaid insurance and racial minorities 42. An observation study in Tokyo, Japan, led by Shinichi Tate and Makio Shozu tracked the implementation of an aggressive surgery protocol for 5 years. They studied 106 patients. They underwent training for 9 months prior to beginning the service. They confirmed that implementing such a regime did not cause a significant increase in mortality, and they saw increases in median progression free survival (from 14.6 to 25 months), and overall survival (38 months to 68 months) 43. THE WORLD OVARIAN CANCER COALITION ATLAS ©The World Ovarian Cancer Coalition 2018 22
VARIATION IN SURVIVAL RATES BETWEEN COUNTRIES
Although it is often hard to provide direct comparisons between survival rates, a
number of studies discuss variation between different countries. It is inadvisable to
take the results from one study and compare them to another study’s results.

The CONCORD Studies
The CONCORD-2 study published in 2015 aimed to initiate a worldwide surveillance
of cancer survival as a metric of the effectiveness of health systems44. Previous
studies (ICBP, Eurocare, and SurvCan) all adopted different methods, and so results
cannot be brought together. Their most recent study (CONCORD-3) which was
published in 2018 is discussed below 45. Reasons for differences may include:

   •   Time lag in collection of data from around the world means comparative data
       is often older than that currently being used in a specific country.
   •   Differences may occur in which morphology codes are or are not included.
   •   Researchers construct life tables to estimate background mortality in a given
       country or region. Variations in the type of data used to construct these tables
       will result in variations in the resulting survival rates 46.

The CONCORD-3 analysis of data from 71 countries in 18 cancer types, revealed
very wide differences in survival that are likely to be attributable to differences in
access to early diagnosis and optimum treatment. Results for ovarian cancer were
based on data from over 865,000 women in 61 countries diagnosed 2010-2014, and
overall was of a higher quality (i.e. more complete) than CONCORD-2 which the
authors note may be driving any improvements or worsening of figures.

The data was collected for ovarian cancer and included fallopian tube, uterine
ligaments, and adnexa, as well as the peritoneum and retroperitoneum where high
grade serous carcinomas are often detected.

The results by country are included in the Appendix.

For women diagnosed during 2010–14, 5-year survival was in the range 40–49% in
24 countries: in Canada and the USA; seven countries in Asia (Singapore [south
Asia]; China, Korea, Japan, and Taiwan [east Asia]; and Israel and Turkey [west
Asia]); 14 European countries (Denmark, Estonia, Finland, Iceland, Latvia, Norway,
and Sweden [northern Europe]; Portugal and Spain [southern Europe]; and Austria,
Belgium, France, Germany, and Switzerland [western Europe]); and Australia.

Survival was in the range 30–39% in 19 countries: four in Central and South America
(Argentina, Brazil, Ecuador, and Puerto Rico); Kuwait and Thailand; 12 European
countries (Ireland, Lithuania, and the UK [northern Europe]; Croatia, Italy, and
Slovenia [southern Europe]; Bulgaria, the Czech Republic, Poland, Russia, and
Slovakia [eastern Europe]; and the Netherlands [western Europe]); and New
Zealand.

Survival was less than 30% in Malta and less than 20% in India (Karunagappally;
table 7).

THE WORLD OVARIAN CANCER COALITION ATLAS ©The World Ovarian Cancer Coalition 2018       23
Survival trends between 1995–99 and 2010–14 were fairly flat in most countries.
However, 5-year survival rose by 5–10% in the USA; Israel, Korea, and Taiwan; 11
European countries (Denmark, Iceland, Ireland, Norway, and Sweden [northern
Europe]; Portugal and Spain [southern Europe]; Bulgaria and Poland [eastern
Europe]; and France and Switzerland [western Europe]); and Australia. Survival
increased by more than 10% in Estonia and Latvia, and by 20% in Japan.
International Cancer Benchmarking Partnership Study
The International Cancer Benchmarking Partnership Study (ICBP) has been working
to track and analyse survival rates for breast, bowel, lung and ovarian cancers in
high-income countries (or states within). Canada (Alberta, British Columbia,
Manitoba, Ontario), Australia (New South Wales, Victoria), the United Kingdom
(England, Scotland, Wales, Northern Ireland), Norway, Sweden, and Denmark are
the participating countries. They have been considered suitable for comparison due
to their level of cancer registration and spend on healthcare. There are five modules
looking at:
• Cancer survival.
• Population awareness and beliefs about cancer.
• Attitudes, behaviours and systems in primary care.
• Delays in diagnosis and treatment and the causes thereof.
• Treatments, co-morbidities and other factors.
Results to date have shown that variation is quite wide, and they are beginning to
inform cancer policy in order to improve cancer survival. Whilst survival for all the
cancers studied has improved in the period 1995-2007, the gap between best
performing (Australia, Canada, Sweden) and lowest performing (UK and Denmark)
has remained largely unchanged other than for breast cancer, where it has
narrowed.
In terms of ovarian cancer for Denmark and the UK, it is apparent that poor one-year
survival rates drive the overall survival rates, pointing to issues with diagnosis and
initial treatment. This is particularly so for the UK, where five-year survival rates for
women, if they survive the first year are the second highest. Sweden did not
participate in the ovarian module. Norway and Canada had the best results overall.
OVARIAN CANCER SURVIVAL – INTERNATIONAL CANCER BENCHMARKING
PARTNERSHIP STUDY (ICBP)
DIAGNOSED 2005- AUSTRALI CANADA DENMARK NORWAY UK
2007 A % % % %
%
1 YR SURVIVAL 73.5 75.6 70.6 75.2 65.0
5 YR 37.5 41.9 36.1 39.7 36.4
5 YR SURVIVAL IF 48.7 54.4 48.8 50.9 53.8
SURVIVED 1ST
YEAR
THE WORLD OVARIAN CANCER COALITION ATLAS ©The World Ovarian Cancer Coalition 2018 24ICBP SURVIVAL TRENDS FOR FOUR CANCERS For ovarian cancer, different stages of diagnosis account for some but not all variability47. The UK and Denmark had the lowest one-year survival. Denmark had the lowest proportion of diagnoses at an early stage, but overall, the UK had a similar proportion to the other countries. However, the UK was worst in terms of recording stage at diagnosis, with 30% of data missing, compared to 10% in Norway. Survival was worse for those whose stage was not recorded. The paper highlights the need for routine recording and transferral of stage data to Cancer Registries and calls for a global consensus to make stage data in Cancer Registries more consistent. In the UK survival for women diagnosed with later stage disease was worse, potentially THE WORLD OVARIAN CANCER COALITION ATLAS ©The World Ovarian Cancer Coalition 2018 25
implying access to treatment is worse in the UK for this group, or that diagnosis of
advanced stage disease is later. There was also some discussion that there may be
differences in tumour biology contributing to the differing figures.

Awareness of ovarian cancer symptoms and beliefs about cancer were examined. In
the UK, perceived barriers to symptom presentation were highest with 34% of people
believing they would be wasting the doctor’s time, and people had less knowledge of
age and other risk factors. This compared to 9% in Sweden. Knowledge of the
symptoms of ovarian cancer (in particular persistent bloating) was consistently low
across all participating countries 48.

The ICBP Study has also shown a correlation between primary care physician’s
willingness to act and cancer survival in that jurisdiction. And while there are
differences say in access to advice on whether or not to refer to secondary care, and
access to diagnostic tests, no consistent reasons for this variation in willingness have
yet been found for the cancers studied as a whole, and further work is being carried
out. However, the authors of the study concluded that some jurisdictions might
consider lowering the thresholds for primary care physicians to investigate cancer
either directly, or by specialist referral to improve outcomes.

The study is on-going, but already in the UK and in Denmark, results are already
helping focus efforts to improve cancer survival at a national level, with moves to
improve access to diagnostic tests, improve family doctors’ knowledge, improve
awareness of symptoms, and improve cancer registration. For example, the creation
of multi-disciplinary diagnostic centres for patients with vague symptoms (“one-stop
shops” has been successfully rolled out in Denmark and is currently being piloted in
the UK49.

Eurocare
The Eurocare 5 study (2015) which looked at cancer survival across Europe for
people diagnosed between 2000 and 2007 concluded that despite increases over
time, survival for women’s cancers remained poor in Eastern Europe, likely due to
advanced stages of diagnosis, and or suboptimum access to adequate care. Low
survival for women living in the UK/Ireland and Denmark, it suggested was possibly
due to late detection and delays in referral. Overall the study highlighted poor
survival for ovarian cancer across the continent and over time and suggested the
need for major research effort to improve the prognosis for this common cancer 50.

Lower income countries
In lower income countries, the challenges can be starker and more obvious.
Developing countries are still coping with huge burdens of communicable disease,
poor infrastructure and very limited health budgets. Michel Coleman however
describes the three engines of escalating cancer burden as being on the move:
rapid population growth, an ageing population and increase in cancer risk at each
age51. Consequently, these lower income countries will be increasingly challenged
coping with the cancer burden.

Sankaranarayan et al evaluated 300,000 cancer deaths in Africa, Asia and Central
America between 1990 and 2001 in Lancet Oncology52. The project called SurvCan

THE WORLD OVARIAN CANCER COALITION ATLAS ©The World Ovarian Cancer Coalition 2018     26
showed that just 22% of cancer patients in Gambia survived 5 years, and in Uganda
(excluding breast cancer patients) the figure was even lower at 13%. The authors
concluded that it was not surprising there was a huge stigma surrounding a cancer
diagnosis. They highlighted that variations in survival correlated with early detection
initiatives and level of development in health services. They also concluded that wide
variation in cancer survival between regions emphasises the need for urgent
investments in improving awareness, population-based cancer registration, early
detection programmes, health-services infrastructure, and human resources.

A position paper produced by the African Organisation for Research and Training in
Cancer in 2016, highlighted particular issues 53:

   •   Lack of early and accurate diagnosis is a challenge to appropriate care. More
       than 80% of patients in Africa are diagnosed at advanced stages of cancer.
       Inadequate pathology leads to wrong diagnosis and patients may receive
       inappropriate treatment. Scarcity of care providers and researchers is a
       problem in pathology training, and many countries have less than one
       pathologist for every million.

   •   Access to healthcare - cancer is often seen as a disease caused by spiritual
       curses, and as such cancer cases are often referred to healers or shamans
       for traditional or spiritual treatment. Health care providers in rural areas lack
       training on cancer, often misdiagnosing cancer as other illness. Lack of data
       on cancer prevalence and trends in Africa and historical focus on
       communicable diseases decrease government efforts on cancer research
       and treatment.

   •   Availability of treatment modalities - high quality treatment is difficult due to
       limited healthcare sources and low affordability. The current number of
       physicians practicing in Africa (145,000) represents 5% of the European total
       (2,877,000). Treatment access is also limited: Approximately 22% of the 54
       African countries have no access to anti-cancer therapies. Barriers to
       treatment include significant out-of-pocket expenses. Out-of-pocket health
       expenditure is estimated to push many people globally into dire poverty when
       treatment costs are substantially higher than income.

   •   Finally, there is a constant threat to the clinician pool due to ‘brain drain’.
       More than half of 168 medical schools surveyed reported losing between 6 to
       18% of teaching staff to emigration in the last 5 years. It will be critical to
       attract African health care personnel to more attractive settings with better
       salaries, working conditions, career paths and support.

In 2013 a report in Lancet Oncology entitled ‘Status of radiotherapy resources in
Africa’ showed a huge variation in accessibility to machines, with South Africa and
Egypt having over 60% of the equipment 54.

At the American Society for Clinical Oncology annual meeting in 2015, Dr Gilberto
Lopes MD, MBA, FAMS explored reducing the global economic burden of cancer.
Having examined data from the Union for International Cancer Control 55 he
highlighted that while the economic burden of each cancer case in the US, UK, and

THE WORLD OVARIAN CANCER COALITION ATLAS ©The World Ovarian Cancer Coalition 2018      27
Japan ranged from $183 - $460 per patient every year, in South America, India and
China it ranged from a paltry $0.54 to $7.92 per patient. Overall, high-income
regions spent 5-10 times more on cancer control on a per capita basis, than low or
middle-income countries.
SUMMARY
In summary, the reasons for variations in survival rates between countries are
complex, and still to a considerable extent, not yet understood. Whilst the balance of
tumour types in any country may differ, and may impact on survival rates, there are
many other known and suspected reasons for variation as the table below indicates.
KNOWN OR POTENTIAL OUTLINE NOTES
FACTORS FOR
VARIATION IN SURVIVAL
RATES
DELAYS IN DIAGNOSIS - Low awareness
- Delays seeking help
- Stigma surrounding
cancer preventing
women seeking help
DELAYS IN INITIAL - Doctors not realising Diagnosis following an
INVESTIGATIONS symptoms may indicate emergency presentation
ovarian cancer is a key driver for early
deaths
- Access to tests
- Willingness of doctor to
investigate
- Lack of referral to
specialist care
LACK OF DOCTORS In some low-income
(GENERAL) countries
DIFFERENCES IN STAGE Varies between different In particular, looking at 1
AT DIAGNOSIS countries. Some influence of and 5-year survival rates
balance of tumour types and can provide an indicator
behaviour but may indicate of whether there are
prolonged diagnosis. issues with treatment or
diagnosis.
LACK OF SPECIALIST Trained in gynecologic oncology Particularly in low-
STAFF income countries but not
exclusively
ABILITY TO RETAIN Issue in lower income
SPECIALIST STAFF countries in particular
THE WORLD OVARIAN CANCER COALITION ATLAS ©The World Ovarian Cancer Coalition 2018 28You can also read