Socioeconomic status determines COVID-19 incidence and related mortality in Santiago, Chile - Science
←
→
Page content transcription
If your browser does not render page correctly, please read the page content below
RESEARCH ARTICLES

                                                                                                                                Cite as: G. E. Mena et al., Science
                                                                                                                                 10.1126/science.abg5298 (2021).

Socioeconomic status determines COVID-19 incidence and
related mortality in Santiago, Chile
Gonzalo E. Mena1†*, Pamela P. Martinez2,3,4,5†*, Ayesha S. Mahmud2,6, Pablo A. Marquet7,8,9,10,11,
Caroline O. Buckee2‡, Mauricio Santillana2,12,13‡
1Department of    Statistics, University of Oxford, Oxford, UK. 2Center for Communicable Disease Dynamics, Department of Epidemiology, Harvard T.H. Chan School of Public
Health, Boston, MA, USA. 3Department of Microbiology, University of Illinois at Urbana-Champaign, Urbana, IL, USA. 4Department of Statistics, University of Illinois at
Urbana-Champaign, Champaign, IL, USA. 5Carl R. Woese Institute for Genomic Biology, University of Illinois at Urbana-Champaign, Urbana, IL, USA. 6Department of
Demography, University of California, Berkeley, CA, USA. 7Departamento de Ecología, Facultad de Ciencias Biológicas, Pontificia Universidad Católica de Chile, Santiago,
Chile. 8Instituto de Ecología y Biodiversidad (IEB), Santiago, Chile. 9The Santa Fe Institute, Santa Fe, NM, USA. 10Instituto de Sistema Complejos de Valparaíso (ISCV),
Valparaíso, Chile. 11Centro de Cambio Global UC, Pontificia Universidad Católica de Chile, Santiago, Chile. 12Computational Health Informatics Program, Boston Children’s
Hospital, Boston, MA, USA. 13Department of Pediatrics, Harvard Medical School, Boston, MA, USA.
†These authors contributed equally to this work. ‡These authors contributed equally to this work.

                                                                                                                                                                            Downloaded from http://science.sciencemag.org/ on May 15, 2021
*Corresponding author. Email: gonzalo.mena@stats.ox.ac.uk (G.E.M.); pamelapm@illinois.edu (P.P.M.)

The current COVID-19 pandemic has impacted cities particularly hard. Here, we provide an in-depth
characterization of disease incidence and mortality, and their dependence on demographic and
socioeconomic strata in Santiago, a highly segregated city and the capital of Chile. Our analyses show a
strong association between socioeconomic status and both COVID-19 outcomes and public health capacity.
People living in municipalities with low socioeconomic status did not reduce their mobility during
lockdowns as much as those in more affluent municipalities. Testing volumes may have been insufficient
early in the pandemic in those places, and both test positivity rates and testing delays were much higher.
We find a strong association between socioeconomic status and mortality, measured either by COVID-19
attributed deaths or excess deaths. Finally, we show that infection fatality rates in young people are higher
in low-income municipalities. Together, these results highlight the critical consequences of socioeconomic
inequalities on health outcomes.

The coronavirus disease 2019 (COVID-19) pandemic is an ongo-                           health care access– on fatality and disease burden, remains a
ing public health crisis. While many studies have described the                        particularly important open question (10) for cities with signifi-
transmission of SARS-CoV-2 –the virus that causes COVID-19–                            cant economic disparities.
in North America, Europe, and parts of Asia (1–5), the character-                          Here, we analyzed incidence and mortality attributed to
ization of the pandemic in South America has received less at-                         SARS-CoV-2 infection and its association with demographic
tention, despite the severe impact in many countries during the                        and socioeconomic status across the urban metropolitan area
Southern Hemisphere winter season. While confirmed COVID-                              of the capital of Chile, known as ‘Greater Santiago’. Unlike
19 cases are an important public health measure to estimate the                        many other countries, Chile set up a remarkably thorough re-
level of spread of infections caused by SARS-CoV-2, they may not                       porting system and made many key data sets publicly availa-
be a reliable indicator of incidence because of biases due to pop-                     ble. To understand spatial variations in disease burden, we
ulation-level health-seeking behavior, surveillance capacities,                        estimated excess deaths and infection fatality rates across this
and the presence of asymptomatic individuals across regions (6).                       urban area. To understand disparities in the health care sys-
Analyses of COVID-19-related deaths as well as excess mortality                        tem, we analyzed testing capacity and delays across municipal-
provide an alternative and potentially less biased picture of epi-                     ities. We then demonstrate strong associations of these health
demic intensity (7, 8). This is in part because ascertainment bi-                      indicators with demographic and socioeconomic factors. To-
ases may be less pronounced for deaths than for confirmed                              gether, our results show that socioeconomic disparities explain
cases, as people dying from COVID-19 are more likely to have                           a large part of the variation in COVID-19 deaths and under-
experienced severe symptoms and thus, more likely to have been                         reporting, and that those inequalities disproportionately af-
documented as COVID-19 positive cases by health surveillance                           fected younger people.
systems. Age specific death data may also help explain the het-
erogeneity in COVID-19 burden and COVID-19 attributable                                Association between socioeconomic status and disease
deaths in different countries (9). However, the role of other fac-                     dynamics
tors, such as socioeconomic status – which is correlated with                          The Greater Santiago area is composed of 34 municipalities

First release: 27 April 2021                                            www.sciencemag.org                 (Page numbers not final at time of first release) 1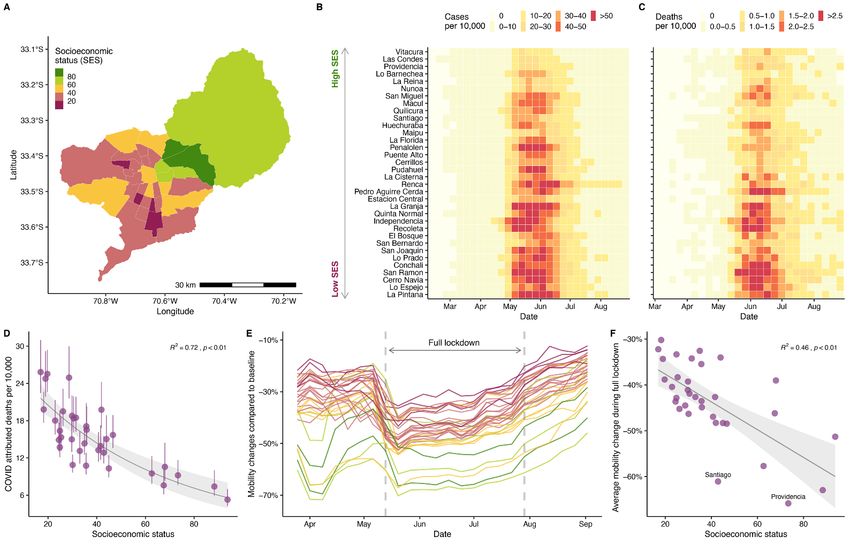
–defined as having more than 95% of its area urbanized– and       of infected individuals that is 5 to 10 times larger than the
is home to almost 7 million people. While this urban center       reported values.
accounts for 36% of the country’s population, it has reported         The reconstructions also reveal important differences in
55% of the confirmed COVID-19 cases and 65% of the COVID-         the inferred number of infections during March of 2020, the
19 attributed deaths prior to epidemiological week 36 (end of     month in which the virus was introduced in Chile by travel-
August 2020). Socioeconomic status (SES) in the municipali-       lers from affluent municipalities. We analyzed the number of
ties varies widely, with Vitacura having the highest value        tests performed between March 8th and April 9th, and find a
(SES = 93.7) and La Pintana the lowest one (SES = 17.0; Fig.      significantly higher number of tests performed in municipal-
1A), and this difference is reflected in the impact of the pan-   ities with high SES (Fig. 2B), especially during the first two
demic during the Southern Hemisphere winter of 2020. The          weeks of March (Fig. 2D). In addition, an early peak of re-
maximum incidence in Vitacura was 22.6 weekly cases per           ported cases was only observed in high SES municipalities
10,000 individuals during the middle of May, while La Pin-        during middle March (Fig. 2C), despite the fact that several
tana reported a maximum of 76.4 weekly cases per 10,000 in-       COVID-19 deaths, which are lagged with respect to infection
dividuals during the first week of June (Fig. 1B). As shown in    by up to several weeks, were reported in low SES municipal-
Fig. 1C and fig. S1, the attributed COVID-19 deaths follow a      ities during the same period. These findings suggest that an

                                                                                                                                       Downloaded from http://science.sciencemag.org/ on May 15, 2021
similar (yet lagged) temporal pattern to the number of re-        early first wave of infections occurred during March and
ported COVID-19 cases. For instance, the highest rate of 4.4      quickly spread through the rest of the city without being cap-
weekly deaths per 10,000 individuals is observed in San Ra-       tured by the official counts. Our RmMAP estimates at the mu-
mon, a municipality with a SES of 19.7, while Vitacura re-        nicipality level support this claim, as they capture a high
ported a maximum of 1.6 weekly deaths per 10,000 in June.         volume of early infections in most municipalities (Fig. 2E), a
These social inequalities impact the overall COVID-19 mor-        scenario that largely deviates from the official tallies (Fig.
tality rates as shown in Fig. 1D.                                 2C).
    Changes in human mobility –a proxy for physical distanc-          To further validate the hypothesis of an early under-re-
ing– during lockdown periods follow a similar trend. Using        porting in low SES municipalities, and to rule that these early
human mobility indicators, inferred from anonymized mo-           activity estimates are not an artifact of our method, we per-
bile phone data obtained from the Facebook Data for Good          formed experiments on a synthetic elementary model of two
Initiative, we show that the two municipalities with highest      peaks of different sizes separated in time (supplementary ma-
socioeconomic status exhibited a reduction in mobility by up      terials). These experiments confirm that RmMAP is capable
to 61% during the full lockdown (dark green, Fig. 1E), com-       of recovering this bi-modal phenomena, while other methods
pared to the ones with lowest SES, which, on average, re-         fail to do so; they over-smooth the true signal and the earlier
duced their mobility to 40% during the this period (dark          peak is typically not recovered. This early under-reporting
pink, Fig. 1E). This relationship between reductions in mobil-    signal suggests that the patterns of mortality and testing ob-
ity and SES was present during all time-periods considered        served across the Greater Santiago are partially explained by
for this study (Fig. 1F) and supports the hypothesis that peo-    an early failure of healthcare systems in informing the popu-
ple in poorer regions cannot afford to stay at home during        lation with sufficient situational awareness about the real
lockdowns. Our result is consistent with analyses of New          magnitude of the threat (15).
York City neighborhoods (11) and with findings from other
studies conducted in Santiago that used different socioeco-       Excess deaths match COVID-19 attributed deaths
nomic and mobility metrics (12–14).                               Excess deaths –defined as the difference between observed
                                                                  and expected deaths– can provide a measure of the actual im-
Epidemic reconstruction reveals early transmission                pact of the pandemic in mortality by quantifying direct and
dynamics                                                          indirect deaths related to COVID-19 (7, 8, 16). We estimated
In order to examine the possible bias present in the incidence    the expected deaths for 2020 by fitting a Gaussian process
data, we reconstructed SARS-CoV-2 infections over time by         model (17) to historical mortality data from the past twenty
implementing a method called regularized mortality MAP            years, and used them to identify the increased mortality dur-
(RmMAP). RmMAP back calculates the most likely infection          ing to the pandemic, controlling for population growth and
numbers given the temporal sequence of deaths, the onset-         seasonality. As shown in Fig. 3A, the number of deaths ob-
to-death distribution, and the demography-adjusted infec-         served between May and July 2020 is more than 1.73 [1.68,
tion fatality rate (IFR). Figure 2A shows the outcomes of this    1.79] times the expected value, with a peak surpassing 2110
inference process, where the reconstructions from our ap-         death counts in epidemiological week 24 (first week of June,
proach and other methods are able to capture the main peak        2020) compared to an expected value of 802 deaths and an
observed in May and June, with an estimate of the number          average number of deaths of 798 between 2015 and 2019.

First release: 27 April 2021                          www.sciencemag.org       (Page numbers not final at time of first release)   2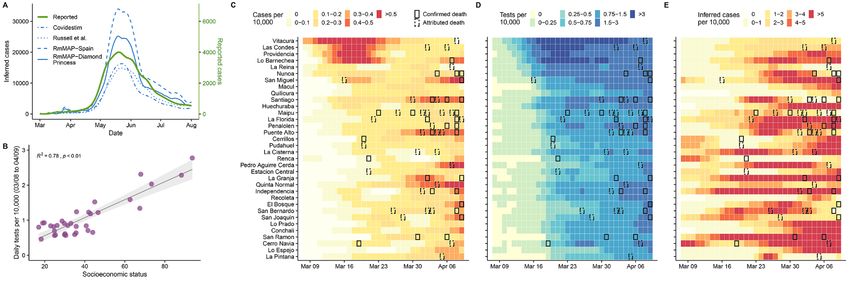
When comparing the number of deaths by age in the year          fewer cases of respiratory viruses have been detected in Chile
2020 with our model’s predictions we observe striking pat-          during the 2020 season (supplementary materials). A de-
terns. Although people younger than 40 years old have an            crease in the number of cancer attributed deaths can be ex-
overall lower mortality rate than those from older age groups       plained by mortality displacement (19, 20), but additional
as expected, they still exhibit a nearly two-fold increase in the   analyses need to be conducted to establish this hypothesis.
total deaths with a peak in the observed deaths occurring 2         Alternative explanations for changes in all-cause mortality
weeks earlier than for those older than 60 years old (Fig. 3B).     should also consider possible changes in external and behav-
For the age groups 40-60, 60-80, and older than 80, the ob-         ioral causes of mortality. We do not observe a substantial con-
served deaths are 2.8, 3.2, and 2.4 times higher than expected,     tribution from these causes (see supplementary materials,
respectively. Even though the age group 80+ exhibits the            along with additional detailed analyses).
highest expected mortality values for 2020, the group that
contains people between 60 and 80 years old displays the            More testing with lower waiting times in wealthy areas
highest weekly count (936 during epidemiological week 24),          To further understand the consequences of insufficient early
the biggest deviation from the predicted values, and the high-      testing, we conducted a deeper analysis of different testing
est values of excess deaths (645 more deaths than expected,         metrics at the municipality level. We first looked at testing

                                                                                                                                         Downloaded from http://science.sciencemag.org/ on May 15, 2021
Fig. 3B).                                                           capacity measured as weekly positivity rates, the fraction of
    COVID-19 attributed deaths for the entire Greater Santi-        tests that are positive for SARS-CoV-2. Our results show that
ago area fall withing the credible intervals of excess deaths       the positivity signal tracked the course of the epidemic, peak-
until late June, when the attributed deaths increase to rates       ing at times of highest incidence between May and July, and
that are even higher than the excess deaths, suggesting that        suggesting a highly saturated health-care system during this
under-reporting in COVID-19 attributed deaths is unlikely           period across the entire city (Fig. 4A). A strong negative asso-
(Fig. 3C). COVID-19 confirmed deaths –those with a PCR-             ciation between positivity and SES (Fig. 4B) further denotes
confirmed SARS-CoV-2 test– follow a similar temporal pat-           difficulties in access to health care that is even more pro-
tern, and the difference between confirmed and COVID-19 at-         nounced in lower SES municipalities. Despite changes in pos-
tributed deaths gets smaller toward the end of August,              itivity rates over time, this testing metric also significantly
indicative of an improved testing capacity. This pattern is         correlated with number of cases (Fig. 4C) and number deaths
consistent when compared to normalized deaths by popula-            (Fig. 4D).
tion size for each municipality (Fig. 3D), which also shows             Our findings on the number of tests conducted show a ra-
COVID-19 attributed deaths higher than the excess deaths in         ther paradoxical association with SES and mortality. Many
most of the cases. The anomalies in the observed versus pre-        months into the epidemic, the early positive association be-
dicted deaths for 2020 across different age groups also dis-        tween tests per capita and SES (Fig. 2B) reversed (Fig. 4E),
play a significant negative association with socioeconomic          indicative of an improvement in testing capacity over time,
status, except for the 80+ group (Fig. 3E), suggesting a higher     so that more tests were performed in the most affected areas.
death burden in lower SES municipalities, independent of            Similarly, the number of tests started to positively correlate
their age composition. Furthermore, the two municipalities          with deaths (Fig. 4F), suggesting that the number of tests are
with SES higher than 80 (Las Condes and Vitacura) had z-            strong predictors of mortality.
scores of much smaller magnitude (with the exception of the             We also analyzed testing capacity by estimating the delays
oldest age group) indicating that there patterns of mortality       in obtaining test results. We inferred the distribution of the
did not deviate much from what would have been expected             delay between onset of symptoms and report of the results,
on a normal year in people younger than 80 years old.               from which we obtained the proportion of cases that are pub-
    Although the observation that COVID-19 attributed               licly reported within one week since the onset of symptoms
deaths are greater than the estimated excess deaths might be        or timeliness (21). As shown in Fig. 4G, timeliness follows a
counterintuitive (Fig. 3D), it may indicate the presence of         similar temporal course as test positivity during May and
changes in overall mortality patterns due to other causes, in-      part of June, but in the opposite direction. This metric is as-
cluding a lower number of deaths due to reduction in the mo-        sociated with SES, suggesting that municipalities with low
bility. In addition, lower numbers of deaths were reported for      SES, on average, get their test results later than the ones with
respiratory infectious diseases such as influenza and pneu-         high SES (Fig. 4H). Timeliness also negatively correlates with
monia, and cancer during July and August of 2020 compared           number of cases (Fig. 4I), total number of deaths (Fig. 4J),
to the period 2015-2019 (Fig. 3F). Changes in mortality from        and with positivity (Fig. 4K). When looking at tests per death,
respiratory diseases can be explained by a mild influenza sea-      a metric that can be used as a faithful proxy of testing capac-
son in the Southern Hemisphere during the winter of 2020            ity (22), we observe a positive correlation with socioeconomic
(18), which is consistent with our observation that much            status (Fig. 4L), indicating that testing disparities persisted

First release: 27 April 2021                            www.sciencemag.org       (Page numbers not final at time of first release)   3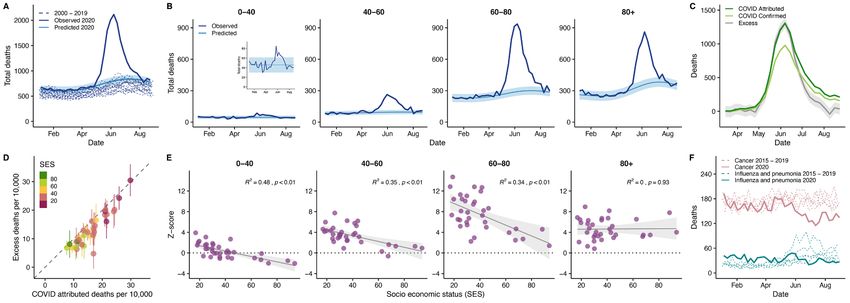
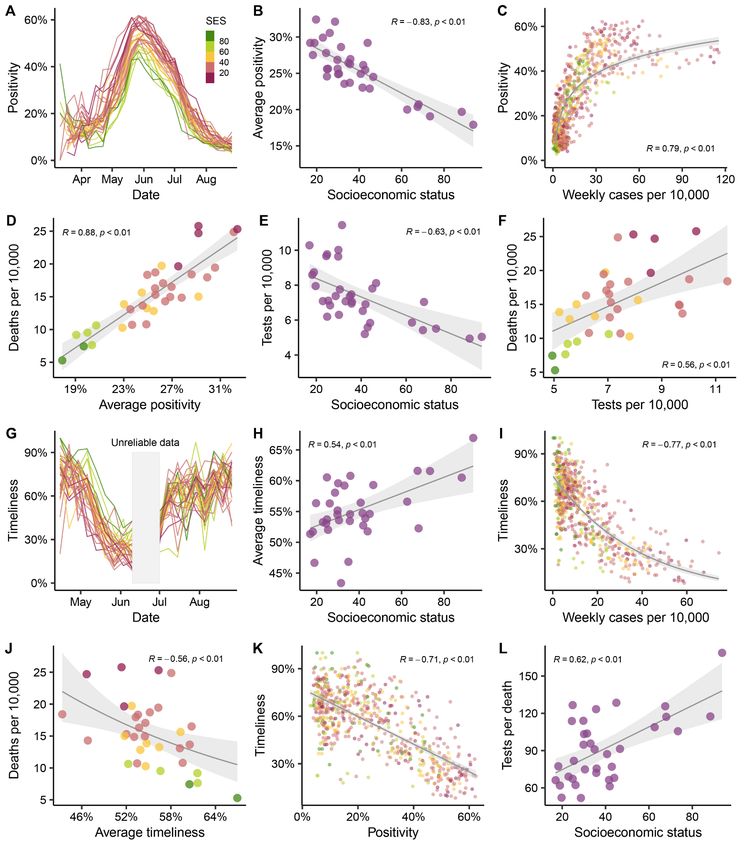
during the epidemic, with low SES areas being affected the         the burden of epidemics (24, 25). Mounting evidence suggests
most. In the supplementary materials we further discuss the        that such differences have also manifested in the context of
associations between our metrics and case counts.                  the COVID-19 pandemic (26, 27). Since the pathways modu-
                                                                   lating these differential outcomes are not well-understood,
Infection fatality rate depends on socioeconomic status            comprehensive accounts are urgently needed (28), so that
In the absence of serological surveys, a direct inference of an    more resilient and socially-aware public-health strategies can
infection fatality rate (IFR) is challenging. The degree of as-    be planned in advance of future pandemics. In Chile, recent
certainment depends on many factors, including testing ca-         studies have suggested a link between SES and effectiveness
pabilities and the likelihood of having symptomatic                of non-pharmaceutical interventions such as stay-at-home or-
infections. Also, unlike deaths, age information of reported       ders (12, 13, 29). Our work further explores this topic by
cases is not available at the municipality level, making this      providing an holistic perspective about how the interplay be-
inference more challenging. To address these hurdles and to        tween behavioral, social, economic, and public-health factors,
have estimates of the IFR, we implemented a hierarchical           modulates the observed heterogeneity in infection incidence
Bayesian model that considers the relationship between             and mortality. Along with the main findings, we also intro-
deaths, observed cases, and true infections across location,       duced several methodological innovations. Our Bayesian

                                                                                                                                        Downloaded from http://science.sciencemag.org/ on May 15, 2021
time, and age group. We first estimated the case fatality rate     method for joint inference of infection fatality rates and un-
(CFR) by assigning total cases into age groups in a simple way     der-reporting is a new contribution in this field. We show
that projects the overall age-distribution of cases to particu-    that it may not be necessary to have complete epidemiologi-
lar municipality demographics (Fig. 5A, see supplementary          cal data sets (here, age) to draw valid inferences, as long as
materials for details). With the exception of the oldest age       the solution space is constrained enough by meaningful pri-
group, case fatality rate shows a negative association with so-    ors and demographic structure.
cioeconomic status. Similarly, our resulting IFR estimates             Our results show a strong link between socioeconomic
once corrected for under-ascertainment display a similar pat-      and demographic factors with COVID-19 outcomes and test-
tern (Fig. 5B) but on an order of magnitude lower than the         ing capacity of COVID-19 in Santiago. This association is
CFR estimates. We then grouped the municipalities into four        manifested as a reinforcing feedback loop, as highlighted by
categories of similar sizes and label them as low, mid-low,        our findings. First, our analysis of human mobility indicates
mid-high, and high socioeconomic category. When compar-            that municipalities with lower socioeconomic status were less
ing the IFR ratio between the low and the high SES catego-         compliant with stay-at-home orders, possibly because people
ries, the results show significantly higher infection fatality     from lower SES areas are unable to work from home, leaving
rate in the low SES group in people younger than 80 years          them at a higher disease risk. Second, our analyses revealed
old (Fig. 5C). The age groups 60-80 and 40-60 exhibit an IFR       an under-reporting of infections in low income areas at the
that are 1.4 and 1.7 times higher respectively in the low SES      start of the outbreak. Since public-health measures were
category, compared to the high SES one. The difference is          taken in response to nominal case counts, these places were
even more pronounced in the younger age group (0-40 years          under prepared, with a poor health-care response that re-
old), which shows values of IFR that is 3.1 times higher for       sulted in higher death counts. Third, anomalies in the overall
the municipalities with the lowest socioeconomic status. Al-       excess deaths are higher in low SES areas, particularly in peo-
together, these results are in line with the analyses of excess    ple younger than 80 years old, suggesting that more vulnera-
deaths presented in Fig. 3E. The lack of association between       ble municipalities were hit the hardest. Fourth, the analyses
IFR and SES in the oldest age group can be attributed to a         of test positivity rates, timeliness, and tests per death indicate
lower life expectancy (23), which in fact is factored in the es-   an insufficient deployment of resources for epidemiological
timation of SES (see methods for details) and that elderly         surveillance. Higher positivity rates in health care centers
people might be, in general, healthier enough to survive until     suggest the need for greater testing and detection. At the
that age.                                                          same time, slower turnaround in test results can lead to
                                                                   greater potential for transmission, since even small delays be-
Discussion                                                         tween onset of symptom, testing, and final isolation, signifi-
In order to understand the true burden of COVID-19, it is crit-    cantly hinder the capability of public health systems to
ical to consider demographic and socioeconomic factors and         contain the epidemic (30). Finally, infection fatality rates
their consequences for the public health response. Here, we        were higher in lower SES municipalities, especially among
analyzed data from the capital of Chile, a highly segregated       younger people.
city. Our results align with the recent literature on uneven           We propose two complementary explanations for the as-
health risks globally, which has highlighted how socially and      sociation between infection fatality rate and socioeconomic
economically deprived populations are more vulnerable to           status. First, a higher IFR may reflect limited access to health

First release: 27 April 2021                           www.sciencemag.org       (Page numbers not final at time of first release)   4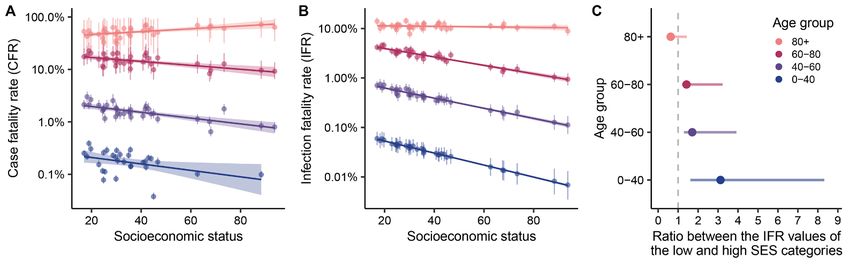
services during the pandemic, and the strong association be-     thus, municipalities with lower SES have higher social prior-
tween the number of tests per death and SES supports this        ity. The SPI index equally weights three components: (i) in-
claim. We also show in supplementary materials that the          come and poverty, (ii) access and quality of education, and
South and West zones (based on health coverage division)         (iii) health factors such as access to healthcare and life expec-
have 4 times fewer beds per 10,000 people and 4 times lower      tancy. For each component, the values are standardized on a
proportion enrolled in the private health system than the        common scale from 0 to 100, where the value 100 represents
East zone, which contains all the municipalities with an SES     the worst relative situation (highest priority) and 0 the best
of 60 or higher. Strikingly, more than 90% of the COVID-19       situation (least priority).
attributed deaths in the South and West zone occurred in
places other than healthcare facilities, compared to 55% in      COVID-19
the East. Second, more vulnerable communities may experi-        At the end of January 2020, the Chilean government deter-
ence a higher prevalence of the comorbidities (31) that are      mined that all suspected cases of COVID-19 must be notified
associated with more severe presentations of COVID-19. Peo-      in a mandatory and immediate manner to the respective
ple in low SES municipalities are more likely to be overweight   Health Epidemiology Unit and the Ministry of Health,
and to live in overcrowded conditions (supplementary mate-       through the specific form on the EPIVIGILA platform. In ad-

                                                                                                                                      Downloaded from http://science.sciencemag.org/ on May 15, 2021
rials), factors that ultimately can put these populations at     dition to the suspected cases that are identified in healthcare
higher disease risk. The interaction of these two explanations   facilities, the government also implemented an active testing
can lead to a high disparity among different socioeconomic       surveillance program to identify asymptomatic and pre-
groups.                                                          symptomatic cases. The criteria for the active testing are: i)
    Our findings need to be considered in light of the follow-   people who have not been identified yet as confirmed or sus-
ing limitations. Mobility data from mobile phones are likely     pected COVID-19 or (ii) living in vulnerable areas, and (iii)
to be biased due to differential mobile phone ownership in       individuals who live in institutions for a long time such as
different demographic groups. While Facebook mobility data       jails, nursing homes, the National Service for Minors, among
can be biased in this way, our results are consistent with       others. Symptoms onset dates are reported by the patient to
other studies in Santiago that used different socioeconomic      a physician, in the case that the person attended a health in-
and movement measurements [see (12–14) and supplemen-            stitution, or by the volunteers that are conducting surveil-
tary materials]. Our methods depend on several assumptions.      lance in the community through a survey.
The back-calculated RmMAP estimates rely on a choice of the          The Chilean Ministry of Science, Technology, Knowledge,
infection-to-death distribution and assume that the IFR do       and Innovation has made possible the access to aggregated
not change over time, and the excess mortality estimates de-     data collected through the EPIVIGILA platform, which are
pend on the choice of a kernel. Our IFR estimates are derived    available in the format of multiple reports. These reports also
from a complex Bayesian model and are based on assump-           contain data on population projections for 2020, testing, pos-
tions regarding reporting rates and age distribution of infec-   itivity, and other metrics used in the study. One of the reports
tions. Extensive sensitivity analyses suggest that our results   tracks the number of cases whose onset of symptoms started
are stable to deviations from these assumptions (supplemen-      at a given epidemiological week, for each municipality. Given
tary materials).                                                 that they are published twice a week (typically Monday and
    To conclude, this study highlights major consequences of     Friday), we were able to analyze the history of such reports
healthcare disparities in a highly segregated city, and pro-     to estimate the delays. Timeliness is thus defined as the prob-
vides new methodologies, that account for incomplete data,       ability of getting a retrospective delay smaller than 7 days,
for studying infectious disease burden and mortality in other    based on the Monday’s reports. More details can be found in
contexts.                                                        the supplementary materials.

Materials and methods                                            Mortality
Data                                                             The Vital Statistics System in Chile is continuous, mandatory,
Socioeconomic status                                             and centralized. It is composed of the Civil Registry and Iden-
We define the Socioeconomic status index (SES) as SES = 100      tification Service (CRIS), the National Institute of Statistics,
− SPI, where SPI is the Social Priority Index (or ‘Indice de     and the Ministry of Health through the Department of Health
Prioridad Social’ in Spanish) estimated for 2019. The SPI in-    Statistics and Information (DHSI). When a person dies, a
dex varies between 0 and 100, and has been reported yearly       medical death certificate is generated by the CRIS and dis-
since 1995 by the Chilean Ministry of Social Development and     tributed to health institutions. The mortality database is built
Family. The SPI value denotes the priority of each municipal-    with the death certificates, which are subjected to a rigorous
ity for the social programs of the regional government, and      validation process, to guarantee the reliability and validity of

First release: 27 April 2021                         www.sciencemag.org       (Page numbers not final at time of first release)   5
the information. The DHSI standardizes the clinical terms in 1 Dt Tt − s
I snew = Iˆsnew ∑ (3)
the format of the International Statistical Classification of
Diseases (ICD-10). Since March 2020, the DHSI has imple-
∑ t Tt − s t
∑ T ′ Iˆnew
s′ t − s ′ s
new
mented the recommendations of the WHO for coding the By scaling the final series I by the inverse IFR we ob-
deaths resulting from COVID-19. In this study, confirmed tain the inferred values of infected individuals over time. A
COVID-19 deaths correspond to deaths in which the virus has detailed discussion of this method along with sensitivity anal-
been identified with a positive PCR test and have been coded ysis and comparison with existing methodology are pre-
as U07.1. Similarly, attributed COVID-19 deaths correspond sented in the in the supplementary materials.
to deaths in which the virus was not identified but clinically
diagnosed as probable or suspected COVID-19 case, and have Estimation of excess deaths
been coded as U07.2. We used Gaussian Processes (GP) regression (17) to estimates
excess deaths for 2020. GPs can be understood as an infinite
Human movement dimensional Bayesian regression: in the finite dimensional
Facebook’s Data for Good has provided access to their Geoin- =
case one fits yi ∑ i wi xi + i where i are Gaussian inde-
sights portal in response to COVID-19 crisis, from where it is pendent identically distributed errors, xi are covariates and
Downloaded from http://science.sciencemag.org/ on May 15, 2021
possible to obtain aggregated data of their users (32). These
data sets are anonymized and contain information of Face- wi coefficients sampled from a prior p ( w ) . Likewise, with
book users that have a smartphone with the location services =
GPs we fit yi f ( xi ) + i where f is a function sampled from
enabled. The movement vector from tile i to j (with i ≠ j) at
a prior over functions p ( f ) . GPs are appealing because the
time t is defined as the transition from the modal location i
at the preceding 8-hour bin to the modal location j in the cur- level of complexity is automatically adjusted by the complex-
rent 8-hour bin. Facebook also provides a baseline value, de- ity of data, and because they are computationally tractable.
fined as the average number of users who transit from tile i Priors over f are specified through a kernel K, which en-
to j at a given day of week and time of day during a baseline codes the correlational structure of data so that K ( x, x′ ) is
period. The baseline period corresponds to the 45 days prior simply the prior covariance between f ( x ) and f ( x′ ) . K de-
to the initiation of the movement data for that particular lo-
cation (for Chile, the data collection was initialized on pends on a finite number of unknowns θ (so K = K θ ) that
03/25/2020). Using this data set, we calculated the percent- have to be inferred as well.
age change compared to baseline for each i to j transition at We used a GP to account for both long-term trends in
a given 8-hour period, and then estimated the average per- mortality as well as seasonality. As in (17), we consider ker-
centage change for each municipality and epidemiological nels of the form
week. We only used the starting location (municipality) for K=θ K θ1 + K θ2 (4)
the average percentage change estimation. The size of the where K θ1 is an exponential kernel representing the long-
side of the tile is approx. 2.4 km.
term variation, and is given by
Models ( x − x′) 2
K θ1 (=
x, x′ ) θ12 exp − (5)
Inference of SARS-CoV-2 infections with RmMAP 2θ 22
We aim to estimate the number of infected individuals over
and K θ2 is a periodic times exponential kernel representing
time I s given a series of observed COVID-19 attributed
seasonal variation
deaths Dt and a known onset-to-death distribution T. We use
( x − x′) 2 2sin 2 ( π ( x − x′ ) )
a Poisson deconvolution model for deaths given I and T: K ( x, x ) =θ3 exp −
2
′ 2
− (6)
θ
2θ 24 θ52
Dt | T , I ∼ Poisson (∑ T
s
I
t −s s ) (1)
We considered an additional source of unstructured ran-
where= (T s ) is the probability that the onset-to-death
Ts P=
domness through the term i ∼ ( 0, σ 2 ) . We performed
equals s days. Estimates of I maximizing Eq. 1 can be obtained
with an expectation maximization algorithm (6, 33–35), but Bayesian inference (MCMC) over the joint distribution pa-
the outcome is typically unstable (36). RmMAP overcomes rameters ( θ, σ 2 ) and death counts for each time period of the
this issue by adding a quadratic penalty to the log-likelihood. 2020 year, based on 2000-2019 all-cause mortality data and
The iterations of RmMAP write as suitable priors for the parameters. In the supplementary ma-
1 terials we comment on more specific aspects, and provide an
Iˆ new = 1 + 8λI old − 1 (2)
4λ extensive evaluation of our model.
First release: 27 April 2021 www.sciencemag.org (Page numbers not final at time of first release) 6Infection fatality rates logit ( IFRm , a ) =α 0 + ( α1 + ηa ) × SES m + δ a (12)
We deployed a hierarchical Bayesian joint model for report-
A comprehensive explanation of this hierarchical Bayes-
ing rates (and hence, IFR) per age group (a taking values 0 –
ian methodology, including a discussion of its assumptions
40, 40 – 60, 60 – 80 and 80 +) and municipality m, collapsing
and several sensitivity analysis and robustness check to mis-
over the temporal dimension. We infer the number of in-
specification of our assumptions appear in the supplemen-
fected individuals (and hence, IFR) based on reported cases
tary materials.
C, positivity rates over time (t, month), and municipality, and
total and COVID-19 attributed deaths D. The main appeal of REFERENCES AND NOTES
this framework, is that although most of the components are 1. S. Chang, E. Pierson, P. W. Koh, J. Gerardin, B. Redbird, D. Grusky, J. Leskovec,
Mobility network models of COVID-19 explain inequities and inform reopening.
not identifiable (e.g., if reporting rates and true cases are both Nature 589, 82–87 (2021). doi:10.1038/s41586-020-2923-3 Medline
unknown, the same observed case counts can be achieved by 2. M. U. G. Kraemer, C.-H. Yang, B. Gutierrez, C.-H. Wu, B. Klein, D. M. Pigott, L. du
multiplying both by the same factor) (37), we can borrow Plessis, N. R. Faria, R. Li, W. P. Hanage, J. S. Brownstein, M. Layan, A. Vespignani,
from better known quantities (e.g., rough estimates of preva- H. Tian, C. Dye, O. G. Pybus, S. V. Scarpino, Open COVID-19 Data Working Group,
The effect of human mobility and control measures on the COVID-19 epidemic in
lence, reporting, etc) to enhance identification while propa- China. Science 368, 493–497 (2020). doi:10.1126/science.abb4218 Medline
gating the appropriate levels of uncertainty over the 3. G. Pullano, E. Valdano, N. Scarpa, S. Rubrichi, V. Colizza, Evaluating the effect of
Downloaded from http://science.sciencemag.org/ on May 15, 2021
parameters. demographic factors, socioeconomic factors, and risk aversion on mobility during
Specifically, the reporting rate rm ,t links to the observed the COVID-19 epidemic in France under lockdown: A population-based study. The
Lancet Digital Health 2, e638–e649 (2020). doi:10.1016/S2589-7500(20)30243-
positivity rates posm ,t (in log-scale) through a logistic-linear 0
4. M. Chinazzi, J. T. Davis, M. Ajelli, C. Gioannini, M. Litvinova, S. Merler, A. Pastore Y
relation (with parameters β), and we have include random Piontti, K. Mu, L. Rossi, K. Sun, C. Viboud, X. Xiong, H. Yu, M. E. Halloran, I. M.
effects m ,t to represent unobserved causes of reporting Longini Jr., A. Vespignani, The effect of travel restrictions on the spread of the
2019 novel coronavirus (COVID-19) outbreak. Science 368, 395–400 (2020).
logit ( rm ,t ) = β 0 + β1 × posm ,t + m ,t (7) doi:10.1126/science.aba9757 Medline
5. S. Lai, N. W. Ruktanonchai, L. Zhou, O. Prosper, W. Luo, J. R. Floyd, A. Wesolowski,
Total infections by municipality and age I m , a are a frac- M. Santillana, C. Zhang, X. Du, H. Yu, A. J. Tatem, Effect of non-pharmaceutical
tion pm of the total population Pm , a , i.e. interventions to contain COVID-19 in China. Nature 585, 410–413 (2020).
doi:10.1038/s41586-020-2293-x Medline
I m , a ∼ Binomial ( Pm , a , pm ) (8) 6. F. S. Lu, A. T. Nguyen, N. B. Link, J. T. Davis, M. Chinazzi, X. Xiong, A. Vespignani, M.
Lipsitch, M. Santillana, Estimating the cumulative incidence of COVID-19 in the
An implicit assumption in Eq. 8 is the existence of an un- United States using four complementary approaches. medRxiv
derlying municipality-specific proportion infected pm so that 2020.04.18.20070821 [Preprint]. 7 August 2020;
https://doi.org/10.1101/2020.04.18.20070821.
on each age group, the number of infected people is (on av- 7. D. M. Weinberger, J. Chen, T. Cohen, F. W. Crawford, F. Mostashari, D. Olson, V. E.
erage) pm × Pm , a . We also assumed the following relation for Pitzer, N. G. Reich, M. Russi, L. Simonsen, A. Watkins, C. Viboud, Estimation of
excess deaths associated with the COVID-19 pandemic in the United States,
pm March to May 2020. JAMA Intern. Med. 180, 1336–1344 (2020).
logit ( pm=
) p0 + μ m (9) doi:10.1001/jamainternmed.2020.3391 Medline
8. R. J. Acosta, R. A. Irizarry, Monitoring health systems by estimating excess
where p0 represents a baseline of the proportion infected mortality. medRxiv 2020.06.06.20120857 [Preprint]. 9 June 2020;
https://doi.org/10.1101/2020.06.06.20120857.
and μ m is a municipality-specific random effect. 9. M. O’Driscoll, G. Ribeiro Dos Santos, L. Wang, D. A. T. Cummings, A. S. Azman, J.
We use parameters γ m ,t ∈ [ 0,1] to represent the temporal Paireau, A. Fontanet, S. Cauchemez, H. Salje, Age-specific mortality and immunity
patterns of SARS-CoV-2. Nature 590, 140–145 (2021). doi:10.1038/s41586-020-
spread of infections; ∑γ t m ,t = 1 so that I m , a ,t = γ m ,t I m , a . Infec- 2918-0 Medline
10. J. M. Feldman, M. T. Bassett, The relationship between neighborhood poverty and
tions, cases, attributed deaths and age-stratified population COVID-19 mortality within racial/ethnic groups (Cook County, Illinois). medRxiv
sizes are linked through a cascade of binomial models. We 2020.10.04.20206318 [Preprint]. 6 October 2020;
relate infections, cases and reporting rates through https://doi.org/10.1101/2020.10.04.20206318.
11. S. M. Kissler, N. Kishore, M. Prabhu, D. Goffman, Y. Beilin, R. Landau, C. Gyamfi-
Cm ,t ∼ Binomial ( I m ,t , rm ,t ) (10) Bannerman, B. T. Bateman, J. Snyder, A. S. Razavi, D. Katz, J. Gal, A. Bianco, J.
Stone, D. Larremore, C. O. Buckee, Y. H. Grad, Reductions in commuting mobility
Infection fatality rates IFRm , a relate to infections and correlate with geographic differences in SARS-CoV-2 prevalence in New York City.
deaths through another binomial model Nat. Commun. 11, 4674 (2020). doi:10.1038/s41467-020-18271-5 Medline
12. A. Carranza, M. Goic, E. Lara, M. Olivares, G. Y. Weintraub, J. Covarrubia, C.
Dm , a ∼ Binomial ( I m , a , IFRm , a ) (11) Escobedo, N. Jara, L. J. Basso, The social divide of social distancing: Shelter-in-
where the IFRs follow a stratified logistic-linear relation with place behavior in Santiago during the COVID-19 pandemic. SSRN 3691373
[Preprint]. 12 September 2020; http://dx.doi.org/10.2139/ssrn.3691373.
socioeconomic status (SES) and age mediated by parameters 13. M. Bennett, All things equal? Heterogeneity in policy effectiveness against COVID-
α, η, δ: 19 spread in chile. World Dev. 137, 105208 (2021).
doi:10.1016/j.worlddev.2020.105208 Medline
First release: 27 April 2021 www.sciencemag.org (Page numbers not final at time of first release) 714. N. Gozzi, M. Tizzoni, M. Chinazzi, L. Ferres, A. Vespignani, N. Perra, Estimating the Health 57, 844–848 (2003). doi:10.1136/jech.57.11.844 Medline
effect of social inequalities in the mitigation of COVID-19 across communities in 32. P. Maas et al., in Proceedings of the 16th International Conference on Information
Santiago de Chile. Nat. Commun. 12, 2429 (2021). doi:10.1038/s41467-021- Systems for Crisis Response and Management, València, Spain, May 19-22, 2019
22601-6 (ISCRAM Association, 2019), vol. 19, p. 3173.
15. M. Lipsitch, M. Santillana, “Enhancing situational awareness to prevent infectious 33. L. A. Shepp, Y. Vardi, Maximum likelihood reconstruction for emission
disease outbreaks from becoming catastrophic” in Global Catastrophic Biological tomography. IEEE Trans. Med. Imaging 1, 113–122 (1982).
Risks, T. V. Inglesby, A. A. Adalja, Eds. (Current Topics in Microbiology and doi:10.1109/TMI.1982.4307558 Medline
Immunology, vol. 424, Springer, 2019), pp. 59–74. 34. Y. Vardi, L. A. Shepp, L. Kaufman, a statistical model for positron emission
16. M. V. Kiang, R. A. Irizarry, C. O. Buckee, S. Balsari, Every body counts: Measuring tomography. J. Am. Stat. Assoc. 80, 8–20 (1985).
Mortality from the COVID-19 pandemic. Ann. Intern. Med. 173, 1004–1007 (2020). doi:10.1080/01621459.1985.10477119
doi:10.7326/M20-3100 Medline 35. E. Goldstein, J. Dushoff, J. Ma, J. B. Plotkin, D. J. D. Earn, M. Lipsitch,
17. C. K. Williams, C. E. Rasmussen, Gaussian Processes for Machine Learning (MIT Reconstructing influenza incidence by deconvolution of daily mortality time
Press, 2006), vol. 2. series. Proc. Natl. Acad. Sci. U.S.A. 106, 21825–21829 (2009).
18. S. J. Olsen, E. Azziz-Baumgartner, A. P. Budd, L. Brammer, S. Sullivan, R. F. Pineda, doi:10.1073/pnas.0902958106 Medline
C. Cohen, A. M. Fry, Decreased influenza activity during the COVID-19 pandemic- 36. P. P. B. Eggermont, V. N. LaRiccia, V. LaRiccia, Maximum Penalized Likelihood
United States, Australia, Chile, and South Africa, 2020. Am. J. Transplant. 20, Estimation (Springer, 2001), vol. 1.
3681–3685 (2020). doi:10.1111/ajt.16381 Medline 37. G. Papadopoulos, J. Santos Silva, Identification issues in some double-index
19. A. Banerjee, L. Pasea, S. Harris, A. Gonzalez-Izquierdo, A. Torralbo, L. Shallcross, models for non-negative data. Econ. Lett. 117, 365–367 (2012).
M. Noursadeghi, D. Pillay, N. Sebire, C. Holmes, C. Pagel, W. K. Wong, C. doi:10.1016/j.econlet.2012.06.001
Downloaded from http://science.sciencemag.org/ on May 15, 2021
Langenberg, B. Williams, S. Denaxas, H. Hemingway, Estimating excess 1-year 38. N. M. Linton, T. Kobayashi, Y. Yang, K. Hayashi, A. R. Akhmetzhanov, S. M. Jung,
mortality associated with the COVID-19 pandemic according to underlying B. Yuan, R. Kinoshita, H. Nishiura, Incubation period and other epidemiological
conditions and age: A population-based cohort study. Lancet 395, 1715–1725 characteristics of 2019 novel coronavirus infections with right truncation: A
(2020). doi:10.1016/S0140-6736(20)30854-0 Medline statistical analysis of publicly available case data. J. Clin. Med. 9, 538 (2020).
20. J. M. Aburto, R. Kashyap, J. Schöley, C. Angus, J. Ermisch, M. C. Mills, J. B. Dowd, doi:10.3390/jcm9020538 Medline
Estimating the burden of the COVID-19 pandemic on mortality, life expectancy 39. T. W. Russell, J. Hellewell, C. I. Jarvis, K. van Zandvoort, S. Abbott, R. Ratnayake,
and lifespan inequality in England and Wales: a population-level analysis. J. S. Flasche, R. M. Eggo, W. J. Edmunds, A. J. Kucharski, CMMID COVID-19 Working
Epidemiol. Community Health 10.1136/jech-2020-215505 (2021). Group, Estimating the infection and case fatality ratio for coronavirus disease
doi:10.1136/jech-2020-215505 (COVID-19) using age-adjusted data from the outbreak on the Diamond Princess
21. O. Stoner, T. Economou, G. Drummond Marques da Silva, A hierarchical framework cruise ship, February 2020. Euro Surveill. 25, 2000256 (2020).
for correcting under-reporting in count data. J. Am. Stat. Assoc. 114, 1481–1492 doi:10.2807/1560-7917.ES.2020.25.12.2000256 Medline
(2019). doi:10.1080/01621459.2019.1573732 40. R. Pastor-Barriuso, B. Pérez-Gómez, M. A. Hernán, M. Pérez-Olmeda, R. Yotti, J.
22. D. K. Kennedy, A. Seale, D. Bausch, “How experts use data to identify emerging Oteo-Iglesias, J. L. Sanmartín, I. León-Gómez, A. Fernández-García, P. Fernández-
COVID-19 success stories,” Our World in Data, 30 June 2020; Navarro, I. Cruz, M. Martín, C. Delgado-Sanz, N. Fernández de Larrea, J. León
https://ourworldindata.org/identify-covid-exemplars. Paniagua, J. F. Muñoz-Montalvo, F. Blanco, A. Larrauri, M. Pollán, ENE-COVID
23. U. Bilal, M. Alazraqui, W. T. Caiaffa, N. Lopez-Olmedo, K. Martinez-Folgar, J. J. Study Group, Infection fatality risk for SARS-CoV-2 in community dwelling
Miranda, D. A. Rodriguez, A. Vives, A. V. Diez-Roux, Inequalities in life expectancy population of Spain: Nationwide seroepidemiological study. BMJ 371, m4509
in six large Latin American cities from the SALURBAL study: An ecological (2020). doi:10.1136/bmj.m4509 Medline
analysis. Lancet Planet. Health 3, e503–e510 (2019). doi:10.1016/S2542- 41. M. H. Chitwood, M. Russi, K. Gunasekera, J. Havumaki, V. E. Pitzer, J. A. Salomon,
5196(19)30235-9 Medline N. Swartwood, J. L. Warren, D. M. Weinberger, T. Cohen, N. A. Menzies,
24. O. P. Ottersen, J. Dasgupta, C. Blouin, P. Buss, V. Chongsuvivatwong, J. Frenk, S. Reconstructing the course of the COVID-19 epidemic over 2020 for US states and
Fukuda-Parr, B. P. Gawanas, R. Giacaman, J. Gyapong, J. Leaning, M. Marmot, D. counties: results of a Bayesian evidence synthesis model. medRxiv
McNeill, G. I. Mongella, N. Moyo, S. Møgedal, A. Ntsaluba, G. Ooms, E. Bjertness, 2020.06.17.20133983 [Preprint]. 6 April 2021;
A. L. Lie, S. Moon, S. Roalkvam, K. I. Sandberg, I. B. Scheel, The political origins of https://doi.org/10.1101/2020.06.17.20133983.
health inequity: Prospects for change. Lancet 383, 630–667 (2014). 42. T. W. Russell, N. Golding, J. Hellewell, S. Abbott, L. Wright, C. A. B. Pearson, K. van
doi:10.1016/S0140-6736(13)62407-1 Medline Zandvoort, C. I. Jarvis, H. Gibbs, Y. Liu, R. M. Eggo, W. J. Edmunds, A. J. Kucharski,
25. E. R. Meara, S. Richards, D. M. Cutler, The gap gets bigger: Changes in mortality CMMID COVID-19 working group, Reconstructing the early global dynamics of
and life expectancy, by education, 1981–2000. Health Aff. (Millwood) 27, 350– under-ascertained COVID-19 cases and infections. BMC Med. 18, 332 (2020).
360 (2008). doi:10.1377/hlthaff.27.2.350 Medline doi:10.1186/s12916-020-01790-9 Medline
26. B. Burström, W. Tao, Social determinants of health and inequalities in COVID-19. 43. G. Mena, P. Martinez, A. Mahmud, P. Marquet, C. Buckee, M. Santillana,
Eur. J. Public Health 30, 617–618 (2020). doi:10.1093/eurpub/ckaa095 Medline Socioeconomic status determines COVID-19 incidence and related mortality in
27. R. Laxminarayan, B. Wahl, S. R. Dudala, K. Gopal, C. Mohan B, S. Neelima, K. S. Santiago, Chile. Zenodo (2021); https://doi.org/10.5281/zenodo.4699403.
Jawahar Reddy, J. Radhakrishnan, J. A. Lewnard, Epidemiology and transmission 44. N. G. Becker, L. F. Watson, J. B. Carlin, A method of non-parametric back-
dynamics of COVID-19 in two Indian states. Science 370, 691–697 (2020). projection and its application to AIDS data. Stat. Med. 10, 1527–1542 (1991).
doi:10.1126/science.abd7672 Medline doi:10.1002/sim.4780101005 Medline
28. Z. Wang, K. Tang, Combating COVID-19: Health equity matters. Nat. Med. 26, 458 45. E. Levitan, G. T. Herman, A maximum a posteriori probability expectation
(2020). doi:10.1038/s41591-020-0823-6 Medline maximization algorithm for image reconstruction in emission tomography. IEEE
29. Y. Li, E. A. Undurraga, J. R. Zubizarreta, Effectiveness of localized lockdowns in the Trans. Med. Imaging 6, 185–192 (1987). doi:10.1109/TMI.1987.4307826 Medline
COVID-19 pandemic. medRxiv 2020.08.25.20182071 [Preprint]. 30 March 2021; 46. R. L. White, in Instrumentation in Astronomy VIII, D. L. Crawford, E. R. Craine, Eds.
https://doi.org/10.1101/2020.08.25.20182071. (International Society for Optics and Photonics, 1994), vol. 2198, pp. 1342–1348.
30. M. E. Kretzschmar, G. Rozhnova, M. C. J. Bootsma, M. van Boven, J. H. H. M. van 47. P. J. Green, Bayesian reconstructions from emission tomography data using a
de Wijgert, M. J. M. Bonten, Impact of delays on effectiveness of contact tracing modified EM algorithm. IEEE Trans. Med. Imaging 9, 84–93 (1990).
strategies for COVID-19: A modelling study. Lancet Public Health 5, e452–e459 doi:10.1109/42.52985 Medline
(2020). doi:10.1016/S2468-2667(20)30157-2 Medline 48. A. C. Miller, L. Hannah, J. Futoma, N. J. Foti, E. B. Fox, A. D’Amour, M. Sandler, R.
31. S. V. Subramanian, I. Delgado, L. Jadue, J. Vega, I. Kawachi, Income inequality and A. Saurous, J. A. Lewnard, Statistical deconvolution for inference of infection time
health: Multilevel analysis of Chilean communities. J. Epidemiol. Community series. medRxiv 2020.10.16.20212753 [Preprint]. 20 October 2020;
First release: 27 April 2021 www.sciencemag.org (Page numbers not final at time of first release) 8https://doi.org/10.1101/2020.10.16.20212753. (CC BY 4.0) license, which permits unrestricted use, distribution, and
49. B. W. Silverman, M. C. Jones, J. D. Wilson, D. W. Nychka, A smoothed Em approach reproduction in any medium, provided the original work is properly cited. To view
to indirect estimation problems, with particular reference to stereology and a copy of this license, visit https://creativecommons.org/licenses/by/4.0/.
emission tomography. J. R. Stat. Soc. B 52, 271–303 (1990). doi:10.1111/j.2517- This license does not apply to figures/photos/artwork or other content included
6161.1990.tb01788.x in the article that is credited to a third party; obtain authorization from the rights
50. M. Titsias, in Proceedings of the Twelfth International Conference on Artificial holder before using such material.
Intelligence and Statistics, D. van Dyk, M. Welling, Eds., vol. 5 of Proceedings of
Machine Learning Research (PMLR, 2009), pp. 567–574. SUPPLEMENTARY MATERIALS
51. A. Gelman, X.-L. Meng, H. Stern, Posterior predictive assessment of model fitness science.sciencemag.org/cgi/content/full/science.abg5298/DC1
via realized discrepancies. Stat. Sin. 6, 733–807 (1996). Materials and Methods
52. R. E. Barlow, Ed., Statistical Inference Under Order Restrictions: The Theory and Supplementary Text
Application of Isotonic Regression (Wiley Series in Probability and Mathematical Figs. S1 to S59
Statistics, no. 8, Wiley, 1972). Tables S1 to S4
53. P. Gustafson, Bayesian Inference for Partially Identified Models: Exploring the References (44–62)
Limits of Limited Data (CRC Press, 2015), vol. 140. MDAR Reproducibility Checklist
54. D. Fisman, S. J. Drews, A. Tuite, S. O’Brien, Age-specific SARS-CoV-2 infection
fatality and case identification fraction in Ontario, Canada. medRxiv 12 January 2021; accepted 22 April 2021
2020.11.09.20223396 [Preprint]. 12 November 2020; Published online 27 April 2021
https://doi.org/10.1101/2020.11.09.20223396. 10.1126/science.abg5298
Downloaded from http://science.sciencemag.org/ on May 15, 2021
55. P. de Valpine, D. Turek, C. J. Paciorek, C. Anderson-Bergman, D. T. Lang, R. Bodik,
Programming with models: Writing statistical algorithms for general model
structures with NIMBLE. J. Comput. Graph. Stat. 26, 403–413 (2017).
doi:10.1080/10618600.2016.1172487
56. M. Plummer et al., in Proceedings of the 3rd International Workshop on Distributed
Statistical Computing (Vienna, Austria, 2003), vol. 124, pp. 1–10.
57. J. A. Hoeting, D. Madigan, A. E. Raftery, C. T. Volinsky, Bayesian model averaging:
A tutorial (with comments by M. Clyde, David Draper and E. I. George, and a
rejoinder by the authors). Stat. Sci. 14, 382 (1999). doi:10.1214/ss/1009212519
58. Y. Yao, A. Vehtari, D. Simpson, A. Gelman, Using stacking to average Bayesian
predictive distributions (with discussion). Bayesian Anal. 13, 917 (2018).
doi:10.1214/17-BA1091
59. A. Gelman, J. Hwang, A. Vehtari, Understanding predictive information criteria for
Bayesian models. Stat. Comput. 24, 997–1016 (2014). doi:10.1007/s11222-013-
9416-2
60. A. Wilson, R. Adams, in Proceedings of the 30th International Conference on
Machine Learning (PMLR, 2013), pp. 1067–1075.
61. L. Wasserman, Bayesian model selection and model averaging. J. Math. Psychol.
44, 92–107 (2000). doi:10.1006/jmps.1999.1278 Medline
62. V. Kontis, J. E. Bennett, T. Rashid, R. M. Parks, J. Pearson-Stuttard, M. Guillot, P.
Asaria, B. Zhou, M. Battaglini, G. Corsetti, M. McKee, M. Di Cesare, C. D. Mathers,
M. Ezzati, Magnitude, demographics and dynamics of the effect of the first wave
of the COVID-19 pandemic on all-cause mortality in 21 industrialized countries.
Nat. Med. 26, 1919–1928 (2020). doi:10.1038/s41591-020-1112-0 Medline
ACKNOWLEDGMENTS
We would like to thank Marc Lipsitch, Oliver Stoner, Nick Link, Patricio Vargas, Jorge
Perez, and Alonso Silva for insightful comments. We thank the Chilean Society of
Intensive Medicine (SOCHIMI) and the School of Medicine of the Finis Terrae
University (Chile) for making it possible to obtain the data on deaths recorded in
health facilities. Funding: G.E.M was partially supported by a Harvard Data
Science Initiative fellowship, P.P.M. by U54GM088558, C.O.B. by Schmidt
futures award, and M.S by R01GM130668. The content is solely the
responsibility of the authors and does not necessarily represent the official views
of the National Institutes of Health. Author contributions: G.E.M. and P.P.M.
designed the study, conducted the analyses, and wrote the manuscript. A.S.M.
and P.A.M assisted with the analyses and conceptualization. C.O.B. and M.S.
designed and oversaw the study. All authors edited the manuscript. Competing
interests: The authors declare no competing interests. Data and materials
availability: Socioeconomic status data are available at
www.desarrollosocialyfamilia.gob.cl/documentos/metropolitana. COVID-19
data are available at https://github.com/MinCiencia/Datos-COVID19 in the
format of multiple reports. Mortality data are available at https://deis.minsal.cl.
Mobility data are available upon request at https://dataforgood.fb.com. All code
and data to reproduce the figures in the main text are available at Zenodo (43).
This work is licensed under a Creative Commons Attribution 4.0 International
First release: 27 April 2021 www.sciencemag.org (Page numbers not final at time of first release) 9Downloaded from http://science.sciencemag.org/ on May 15, 2021
Fig. 1. Socioeconomic status, COVID-19 cases and deaths, and mobility data in Greater Santiago.
(A) Municipalities that are part of the Greater Santiago are colored according to their socioeconomic
status (SES), where a lower score is indicative of a lower SES. (B) COVID-19 cases normalized by
population size per municipality. Municipalities are sorted by SES starting with the one that has the
highest SES at the top. (C) COVID-19 attributed deaths normalized by population size per
municipality. (D) Age-adjusted adjusted COVID-19 attributed death rates and its association with
SES. The dots and the whiskers represent the median and the 95% confidence intervals respectively,
reflecting uncertainty on the standard population used for weighting. (E) Daily reduction in mobility
by municipality colored by its SES value. (F) Average reduction in mobility during the full lockdown
period and its association with SES. The urban and the business centers, Santiago and Providencia
respectively, experienced a greater reduction in mobility than expected based just on their
socioeconomic profile.
First release: 27 April 2021 www.sciencemag.org (Page numbers not final at time of first release) 10You can also read