Genome-wide strand asymmetry in massively parallel reporter activity favors genic strands
←
→
Page content transcription
If your browser does not render page correctly, please read the page content below
Downloaded from genome.cshlp.org on November 13, 2021 - Published by Cold Spring Harbor Laboratory Press

Research

Genome-wide strand asymmetry in massively parallel
reporter activity favors genic strands
Brian S. Roberts,1,2 E. Christopher Partridge,1 Bryan A. Moyers,1 Vikram Agarwal,3
Kimberly M. Newberry,1 Beth K. Martin,4 Jay Shendure,4,5,6 Richard M. Myers,1
and Gregory M. Cooper1
1
  HudsonAlpha Institute for Biotechnology, Huntsville, Alabama 35806, USA; 2Department of Biological Sciences, The University
of Alabama in Huntsville, Huntsville, Alabama 35899, USA; 3Calico Life Sciences LLC, South San Francisco, California 94080, USA;
4
  Department of Genome Sciences, University of Washington, Seattle, Washington 98195, USA; 5Howard Hughes Medical
Institute, Seattle, Washington 98195, USA; 6Brotman Baty Institute for Precision Medicine, University of Washington, Seattle,
Washington 98195, USA

        Massively parallel reporter assays (MPRAs) are useful tools to characterize regulatory elements in human genomes. An as-
        pect of MPRAs that is not typically the focus of analysis is their intrinsic ability to differentiate activity levels for a given
        sequence element when placed in both of its possible orientations relative to the reporter construct. Here, we describe per-
        vasive strand asymmetry of MPRA signals in data sets from multiple reporter configurations in both published and newly
        reported data. These effects are reproducible across different cell types and in different treatments within a cell type and are
        observed both within and outside of annotated regulatory elements. From elements in gene bodies, MPRA strand asymme-
        try favors the sense strand, suggesting that function related to endogenous transcription is driving the phenomenon.
        Similarly, we find that within Alu mobile element insertions, strand asymmetry favors the transcribed strand of the ancestral
        retrotransposon. The effect is consistent across the multiplicity of Alu elements in human genomes and is more pronounced
        in less diverged Alu elements. We find sequence features driving MPRA strand asymmetry and show its prediction from se-
        quence alone. We see some evidence for RNA stabilization and transcriptional activation mechanisms and hypothesize that
        the effect is driven by natural selection favoring efficient transcription. Our results indicate that strand asymmetry is a per-
        vasive and reproducible feature in MPRA data. More importantly, the fact that MPRA asymmetry favors naturally tran-
        scribed strands suggests that it stems from preserved biological functions that have a substantial, global impact on gene
        and genome evolution.

        [Supplemental material is available for this article.]

Spatiotemporal and quantitative control of transcript levels is a                   plasmid libraries (for review, see Klein et al. 2020). These libraries
crucial aspect of essentially all biological processes in humans                    are then transfected into cells that are subsequently subjected to
(Plank and Dean 2014; Schoenfelder and Fraser 2019). As such,                       high-throughput sequencing.
finding the sequence elements that regulate transcription in hu-                          One version of an MPRA, self-transcribing active regulatory
man genomes and understanding the rules governing their effects                     region sequencing (STARR-seq), places sequence elements within
are fundamental goals in human biology. For decades, these goals                    the 3′ UTR portion of a gene in a plasmid construct that also in-
have driven a large amount of work, including both technology                       cludes a promoter (Arnold et al. 2013). The transcriptional enhanc-
development (Dekker et al. 2002; Johnson et al. 2007;                               er effects of a given element, in a location that is downstream from
Patwardhan et al. 2009; Kwasnieski et al. 2012; Arnold et al.                       the transcription start site (TSS) of the reporter DNA, can be
2013; Gordon et al. 2020) and applications of those technologies                    directly quantified as each one contributes to its own abundance
to systematically find regulatory elements, including promoters,                    within the pool of plasmid-derived RNA. Another mode of
enhancers, silencers, and insulators (Ashe et al. 1997; Bell et al.                 MPRA, “survey of regulatory elements” (SuRE), involves placement
1999; Visel et al. 2009a; The ENCODE Project Consortium 2012;                       of sequence elements in an upstream location relative to a gene in
Moore et al. 2020).                                                                 a promoter-free plasmid (Van Arensbergen et al. 2019). These ele-
      One key technological advance has been the development of                     ments are linked to barcodes within the transcribed reporter, and
“massively parallel reporter assays” (MPRAs), in which numerous                     their effects are quantified by measuring the abundance of their
sequence fragments are assayed in a single experiment for their                     transcribed barcodes.
ability to alter transcript levels. MPRAs take a variety of forms                         MPRAs of various types, including STARR-seq and SuRE, are
but typically include the cloning of a diverse collection of short                  primarily designed to identify “active” sequences that increase
(∼200-bp to ∼1.5-kb) DNA elements into transcriptional reporter                     transcription of the reporter. However, the “strandedness” of the

                                                                                    © 2021 Roberts et al. This article is distributed exclusively by Cold Spring Har-
                                                                                    bor Laboratory Press for the first six months after the full-issue publication date
Corresponding authors: rmyers@hudsonalpha.org,                                      (see https://genome.cshlp.org/site/misc/terms.xhtml). After six months, it is
gcooper@hudsonalpha.org                                                             available under a Creative Commons License (Attribution-NonCommercial
Article published online before print. Article, supplemental material, and publi-   4.0 International), as described at http://creativecommons.org/licenses/
cation date are at https://www.genome.org/cgi/doi/10.1101/gr.270751.120.            by-nc/4.0/.

31:1–11 Published by Cold Spring Harbor Laboratory Press; ISSN 1088-9051/21; www.genome.org                                         Genome Research                 1
                                                                                                                                       www.genome.org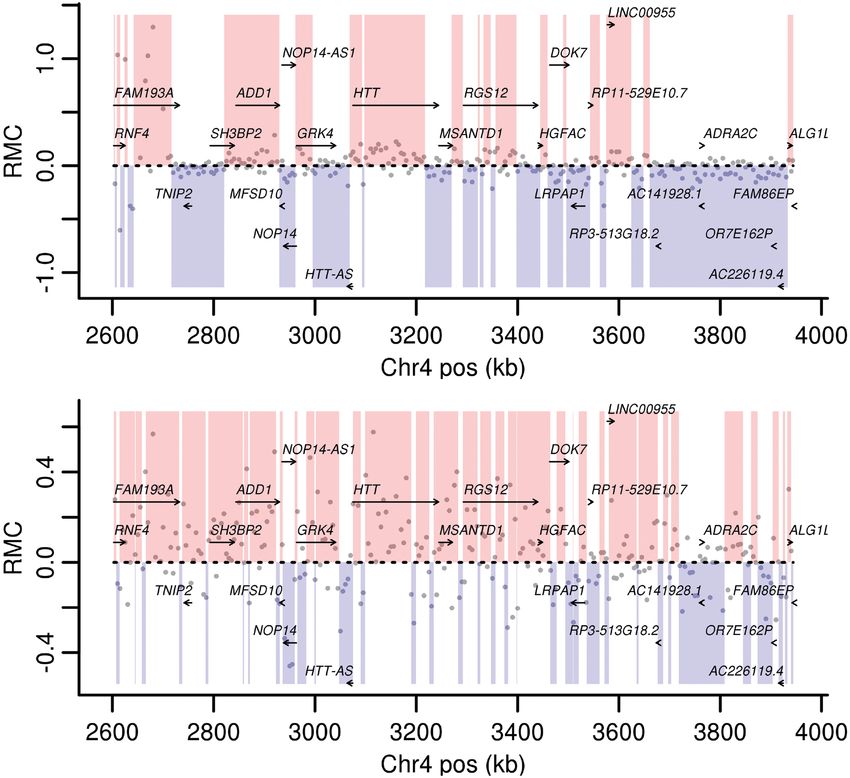
Downloaded from genome.cshlp.org on November 13, 2021 - Published by Cold Spring Harbor Laboratory Press

Roberts et al.

test elements, namely, their 5′ -3′ orientation relative to the tran-         For the three STARR-seq experiments, we aligned and pro-
scribed reporter, is a potential contributor to the activity level of   cessed the FASTQ files retaining both the alignment position and
any given element. In experiments using libraries built from frag-      the strand orientation using a uniform pipeline (Methods; Fig. 1).
mented genomic DNA, for instance, fragments representing the            Because of the complexity of associating test elements to barcodes
same genomic location will randomly be cloned into individual re-       in the Van Arensbergen et al. data from FASTQ files, we instead ob-
porter plasmid molecules in both orientations at a near equal rate.     tained stranded signal values from the bigWig files provided by the
These experiments then yield activity measurements for both ori-        investigators (NCBI Gene Expression Omnibus [GEO; https://www
entations separately. Thus, with sufficiently complex libraries,        .ncbi.nlm.nih.gov/geo/] accession GSE128325). All data sets were
such that each orientation is sampled at a given location multiple      then mapped to a common set of 290-bp bins spanning the auto-
times, and deep sequencing, such that the functional effects of any     somes (Methods). To avoid ambiguity from terms such as “plus”
given element are measured robustly, even relatively subtle differ-     or “minus” and to avoid confounding genic strands with reference
ences in activities between the two possible orientations of a given    strands, we defined signal derived from reads matching the human
element might be detectable.                                            genome reference strand as “Reference” and those aligning to the
      Potential asymmetric sequence effects are often largely ig-       reference reverse complement as “Complement.” From these sig-
nored or assumed to impact only a limited number of loci                nals, we calculated a value termed “Reference minus Complement
(Muerdter et al. 2015; Liu et al. 2017; Barakat et al. 2018; Schöne     (RMC)” (Fig. 1A). We derived RMC by calculating the read-depth
et al. 2018; Wang et al. 2018; Sun et al. 2019; Ramaker et al.          normalized RNA to read-depth normalized DNA ratio for the Refer-
2020). However, the case for strand asymmetry of DNA function           ence strand and for the Complement strand separately. We then
within MPRAs is, in general, strong. Indeed, gene transcription,        subtract the Complement RNA-to-DNA ratio from the Reference ra-
perhaps the most fundamental of all biological functions encoded        tio to obtain a simple measure of asymmetric strand signal.
in DNA, is inherently stranded. Promoter activity is often direc-             We noticed that the RMC from BAC-derived data in the HTT
tional, and even in cases in which the activity is bidirectional,       locus was consistent across the four cell types (Fig. 1B). We ex-
there is generally a bias toward one strand (Almada et al. 2013;        plored whether this effect was pervasive across this data set and
Andersson et al. 2015; Duttke et al. 2015). Other properties, such      the others, including those spanning the whole genome, as well
as mutational correction, have also been shown to be strand-biased      as the BAC-derived library targeting the SORT1 locus. For each ex-
(Green et al. 2003). Furthermore, MPRAs may have features within        periment group (treatment, cell type, replicate) within each data
their designs that predispose to strand asymmetry from nonregu-         set, we calculated the reporter signal from the two strands sepa-
latory effects. For example, in STARR-seq, the tested regulatory el-    rately. We then calculated, within a data set, the correlation be-
ement is itself transcribed, implying that any sequence elements        tween all strand–experiment group pairs (Methods). Finally, we
with strand-specific effects on RNA stability will lead to strand       clustered stranded reporter signal correlations for each data set
asymmetry in the data.                                                  (Fig. 2). The strand of the signal segregated with the first cluster
      Thus, we hypothesized that asymmetry would exist in MPRAs         clade, before even cell type (Fig. 2A,C), technical replicates (Fig.
and be widely distributed. We sought to analyze both previously         2A; Supplemental Fig. 1), dexamethasone treatment duration
published and newly generated MPRA data from multiple reporter          (Fig. 2B), or genome donor (Fig. 2C). We ruled out that biases in in-
configurations and in multiple cell types. We also sought to test       put reporter construct pools could be responsible for the strand
whether strand asymmetry is reproducible for specific sequences         asymmetry by comparing the sequenced DNA counts assigned to
or correlated with genomic features. Such asymmetry might reflect
both the sensitivity and power of MPRAs and point to features rel-
evant to both sequence function and genomic evolution.                      A

Results
                                                                            B
Strand asymmetry is pervasive in MPRA signal
We considered four MPRA data sets in our analyses. We generated a
STARR-seq (Arnold et al. 2013) library with a super-core promoter
(SCP) (Addgene 71509) from sonicated bacterial artificial chromo-
somes (BACs) spanning an ∼1.2-Mb locus around the HTT gene
(Supplemental Table 1). We assayed this library in four cell types:
A549, BE(2)-C, HepG2, and K562 (Methods). We also generated
a STARR-seq library using the promoter-less STARR-seq vector
(Addgene 99296) from BACs in the SORT1 gene locus in HepG2
cells (Methods).
      In addition to these experiments conducted in our laborato-
ries, we also obtained data from the NCBI Sequence Read                 Figure 1. Derivation and example of RMC data. (A) DNA test elements
                                                                        from either BACs or whole-genome fragmentation are cloned downstream
Archive (SRA; https://www.ncbi.nlm.nih.gov/sra) for a STARR-            from or upstream of the TSS in different experiments. After transfection in
seq experiment using a fragmented whole-genome library in               one or more cell types, reporter-derived RNA and DNA are harvested and
A549 cells treated with dexamethasone for various durations             sequenced. The reads are mapped retaining strandedness and the normal-
(Johnson et al. 2018). Lastly, we obtained SuRE data from a report-     ized signal Reference strand signal minus the Complement strand signal
                                                                        (RMC) is calculated (created with BioRender.com). (B) RMC data from
er with the test element upstream of a promoter-less gene using li-     four cell lines are shown on a 20-kb portion of Chromosome 4 (hg38 co-
braries from four fragmented whole genomes in HepG2 and K562            ordinates). The arrows mark gene bodies and the direction of stable
cells (Van Arensbergen et al. 2019).                                    transcription.

2    Genome Research
       www.genome.org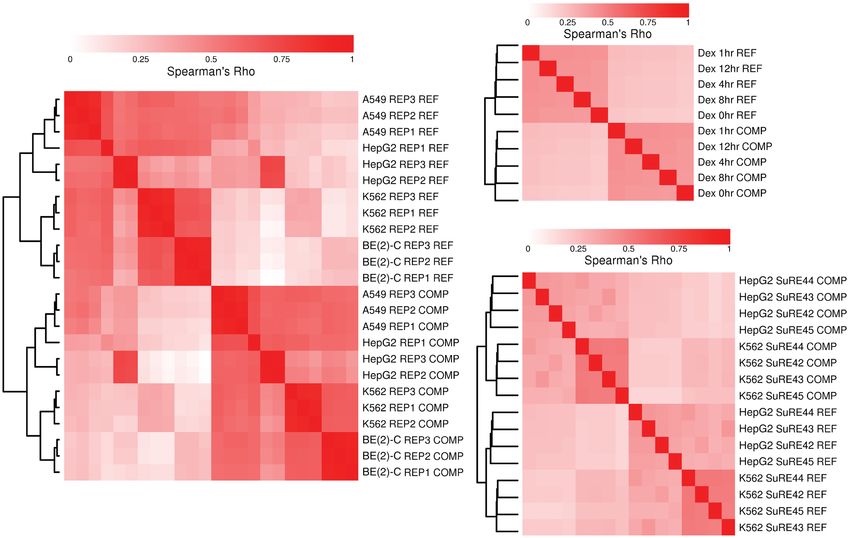
Downloaded from genome.cshlp.org on November 13, 2021 - Published by Cold Spring Harbor Laboratory Press

                                                                                    MPRA strand asymmetry from gene bodies and Alus

           A                                                                      B

                                                                                  C

Figure 2. Clustering of MPRA signal by strand. Hierarchical clustering of Spearman’s correlation coefficients is shown for MPRA signal from (A) a pooled
BAC-derived STARR-seq library spanning HTT gene in four cell types, (B) a whole-genome-derived STARR-seq library in A549 cells from Johnson et al., and
(C) whole-genome libraries from four donors in a promoter-less reporter system with an upstream test element in two cell types from Van Arensbergen et al.
All comparisons were made from binned data (see Methods).

the two strands, finding high correlation (Supplemental Fig. 2).               bodies. For example, RMC should be positive in Reference genes
Thus, strand asymmetry is the predominant feature driving global               (transcript sense to reference) and negative in Complement genes.
patterns of similarity of signals from MPRA data sets, being more              To evaluate this, we divided autosomes into Reference gene bodies,
prominent than any other technical (e.g., replicates) or biological            Complement gene bodies, intergenic regions, or regions where
(e.g., cell type) factor.                                                      transcripts from both strands overlap (Methods). By using linear
      In the Johnson et al. data, dexamethasone treatment is pro-              regression, we found significant enrichment for positive RMC val-
posed to activate regulatory regions, namely, glucocorticoid re-               ues in Reference gene bodies and negative values in Complement
sponse elements. We observed the same strand-driven clustering                 gene bodies compared with intergenic regions across the three ge-
behavior both within and after excluding likely regulatory regions             nome-wide data sets (all P < 2.2 × 10⁻¹⁶) (Table 1; Supplemental
defined by activating histone marks (Supplemental Fig. 3A,B).                  Fig. 5A–C). We found no significant difference between regions
Although the Van Arensbergen et al. reporter aims to find promoter             with transcripts on both strands and intergenic regions.
activity, we similarly observed strand-driven clustering in this data               To further explore the association of MPRA strand asymmetry
set both within and after excluding promoter regions, defined as               with gene bodies, we tested whether a segmentation of the ge-
−2000 to +500 bp from annotated TSSs (Supplemental Fig. 4). We                 nome by RMC would be consistent with gene bodies. We used
were not able to find any genome segmentation, based on features               the HMMSeg tool (Day et al. 2007), segmenting into high
like histone marks, promoters, or gene bodies, that removed the                (Reference-like) and low (Complement-like) states, at a range of
strand-driven clustering in either of the whole-genome data sets.              transition probabilities, in all of the considered data sets
In fact, a randomly selected set of 1 million bins shows the same              (Methods). The resulting segmentations appear visually consistent
clustering pattern in both data sets (Supplemental Figs. 3E, 4C).              with gene bodies across multiple data sets and cell types in the HTT
                                                                               locus (Fig. 3A,B; Supplemental Fig. 6A–C) and in the SORT1 locus
                                                                               (Supplemental Fig. 6D).
MPRA strand asymmetry correlates with gene bodies                                   To robustly evaluate the agreement with gene bodies ge-
Given the pervasiveness of the MPRA strand asymmetry, we                       nome-wide, we compared the HMMSeg-derived autosome seg-
sought to compare it with other genomic features displaying                    mentations from the Johnson et al. and Van Arensbergen et al.
strand-specific effects. We first considered, as the most obvious              data sets to gene bodies using a conditional entropy approach
stranded genomic feature, gene bodies (defined by GTEx v8, in-                 (Methods) (Haiminen et al. 2007). All data sets produced segmen-
cluding noncoding transcripts). Although the MPRA signal con-                  tations more similar to gene bodies than 1000 randomly shuffled
tinues to cluster by strand both within and after excluding gene               segmentations across a range of transition probabilities (Table 1;
bodies (Supplemental Fig. 3C,D), we hypothesized that RMC val-                 Supplemental Fig. 7). Although the segmentations did not match
ues would tend to favor a gene’s transcribed strand within gene                gene bodies perfectly, they classified a high fraction of Reference

                                                                                                                            Genome Research             3
                                                                                                                              www.genome.org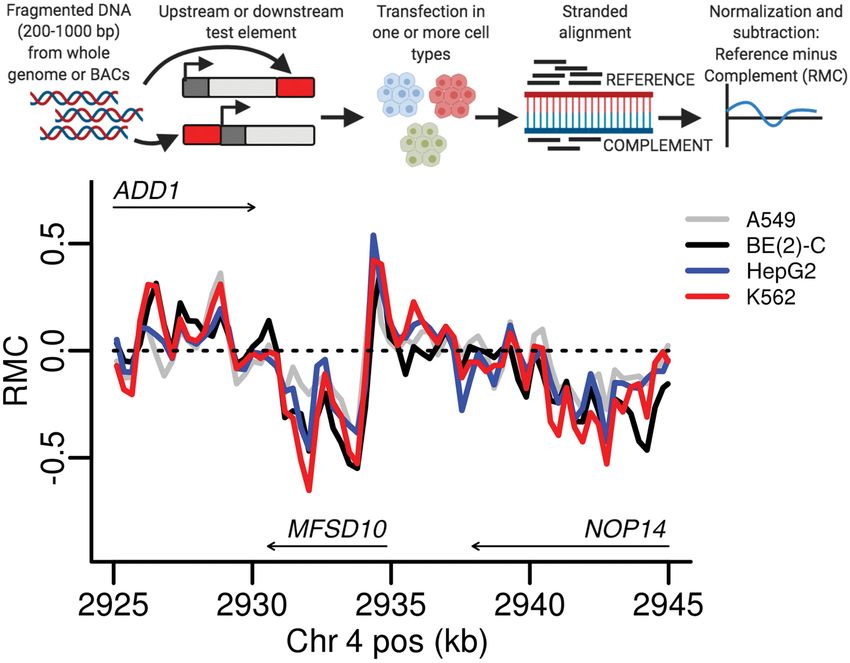
Downloaded from genome.cshlp.org on November 13, 2021 - Published by Cold Spring Harbor Laboratory Press

Roberts et al.

Table 1. MPRA strand asymmetry shows significant and concordant association with gene body types

Gene region type                               Mean                            SD                       P (regression)                     P (segment)

RMC in A549 cells from Johnson et al.
 Complement                                 −0.022                           0.266
Downloaded from genome.cshlp.org on November 13, 2021 - Published by Cold Spring Harbor Laboratory Press
MPRA strand asymmetry from gene bodies and Alus
nature of RMC within Alus. Younger, less divergent Alus are more
similar to one another, and thus show more consistent effects, in
contrast with older, more divergent, and dissimilar Alus.
We also applied this analysis to data sets derived from two cell
types from Van Arensbergen et al. We did not see the effect of Alu
orientation and ancestral sequence conservation in data from
K562 cells, with most data points scattering near zero
(Supplemental Fig. 8A). In HepG2 cells, test elements that are high-
ly similar to ancestral Alu sequence do display RMC concordant
with Alu orientation similar to that seen in the Johnson et al.
data (Supplemental Fig. 8B). However, test elements with more di-
verged Alu sequence also have near zero RMC in the HepG2 data.
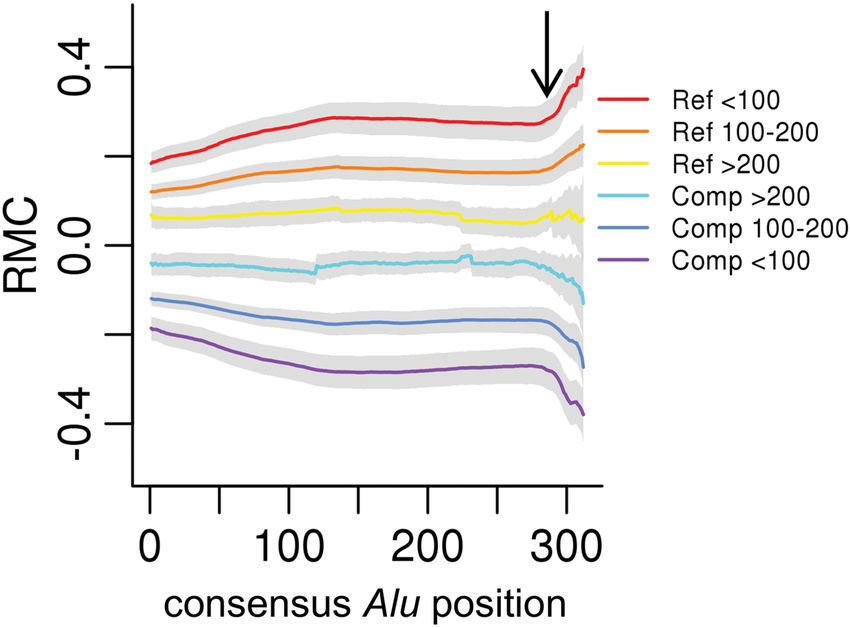
Figure 4. Alu divergence level effects strand asymmetry. From the Furthermore, the A-tail appears to have opposite effects in both
Johnson et al. data, the genome-wide median RMC (y-axis) for each anno- Van Arensbergen et al. data sets compared with the Johnson
tated Alu consensus position (x-axis) is plotted for Reference (Ref)- or et al. data. We present and discuss the differing effects of very A-
Complement (Comp)-oriented Alu insertions, grouped by levels of diver- rich test elements in the Johnson et al. versus Van Arensbergen
gence (indicated in respective colors) measured by milliDiv units (e.g.,Downloaded from genome.cshlp.org on November 13, 2021 - Published by Cold Spring Harbor Laboratory Press
Roberts et al.
corresponding RMC data on Chromosome 2 (all P < 2.2 × 10⁻¹⁶) and dimers. We speculate that because the test element is tran-
(Fig. 5A–C). Next, we used a sequence-based predictive model of scribed in the Johnson et al. MPRA configuration, the oligo(dT)
transcriptional activity using convolutional neural networks, beads used in RNA enrichment in their protocol may preferentially
Xpresso (Agarwal and Shendure 2020), to the HTT locus. We chose bind these transcripts, enriching them over their reverse comple-
this smaller locus owing to computational practicality. Xpresso- ment. However, our analysis indicates this only appears to occur
predicted values significantly correlate to RMC data in that locus in these very A-rich test elements and does not affect the vast ma-
in four cell types (R 2 = 0.11 to 0.46) (Supplemental Fig. 9). Lastly, jority of the data (Supplemental Fig. 12).
we used gkmSVM analysis (Ghandi et al. 2014, 2016) to subsets We annotated significantly predictive octamers by compari-
of the Johnson et al. and Van Arensbergen et al. data sets son to RNA-binding protein (RBP) and transcription factor (TF)
(Methods). The generated models significantly predicted RMC motifs using FIMO (Grant et al. 2011). We found significant
from sequence inputs (Pearson R 0.27 − 0.40, all P < 2.2 × 10⁻¹⁶) matches to RBP and TF motifs for some highly RMC-predictive
(Supplemental Fig. 10). We also present the hyperplane distances octamers (Supplemental Data 2). However, motif matches were
of the 1000 k-mers most distal from the SVM hyperplane from not found for most significantly predictive octamers.
each of the three whole-genome data sets (Supplemental Data 3).
Consistent with the strand asymmetry in RMC, a given
k-mer’s reverse complement should have an equal but opposite ef-
Discussion
fect. As expected, in linear models trained on only a single k-mer’s In MPRA data generated from both fragmented whole-genome
frequencies, k-mer performance closely matched that of its reverse DNA or targeted BAC pools, in STARR-seq vectors with and with-
complement, in opposite directions for all three analyses out the SCP, and in SuRE vectors with an upstream, nontran-
(Supplemental Fig. 11). No palindromes yielded significant associ- scribed test element, we see pervasive and highly reproducible
ation, an important confirmation of the validity of the analytical strand asymmetry in reporter signal. The effect persists over multi-
techniques. ple cell types, from multiple donor genomes, and in differing drug
We sought to compare the k-mer regression results across the treatments. Strand asymmetry is the predominant driver of cluster-
three data sets that derive from upstream and downstream test el- ing in all these data sets (Fig. 2; Supplemental Figs. 1, 3, 4).
ement configurations and different cell types. Because reverse The presence of strand asymmetry might be considered as
complement pairs always have opposite and nearly equal effect siz- merely an artifact of MPRAs were it not for its correlation to well-
es, we consider the pairs to be reducible to a single data point. We established stranded genomic features. Test elements derived
used a sequence similarity clustering approach seeded by alphabet- from Reference-sense-strand genes have significantly positive
ical ordering to choose the representative sequence and effect di- RMC values, whereas the converse is true for Complement-sense-
rection (see Methods). strand genes in data sets derived from whole-genomic DNA
Among monomers, the A/T pair (represented by A) has a sig- (Table 1). Regions where stable transcription products are annotat-
nificant (P < 2.2 × 10⁻¹⁶) negative association with RMC in all three ed on both strands yield RMC values near zero, perhaps indicating
data sets (Supplemental Data 1). This means that the A monomer equilibrium between competing forces. Although MPRA strand
is associated with lower Reference strand signal compared asymmetry is pervasive, it appears to be organized coherently in
with Complement strand signal. The C/G pair (represented by C) gene bodies, allowing for segmentations via HMMSeg that
only has significant effects (P < 2.2 × 10⁻¹⁶) in the two Van are significantly similar to gene bodies (Fig. 3A,B; Supplemental
Arensbergen data sets, both with negative effect directions. The Figs. 6, 7).
dimer data largely reinforce this observation. Most A-containing Test elements derived from Alu sequence show pronounced
dimers (excluding palindromes) associate negatively with RMC MPRA strand asymmetry, especially in the Johnson et al. data
in all three data sets. The CC dimer associates negatively with (Fig. 4). In data from Van Arensbergen et al., we do not observe
RMC similar to the C monomer in the Van Arensbergen et al. the effect in K562 but do see it in elements with high similarity
data. In the Johnson et al. data, however, CC associates signifi- to ancestral Alu sequence in HepG2 (Supplemental Fig. 8). We
cantly positively with RMC (Supplemental Data 1). are not certain why the data sets differ. We believe that high
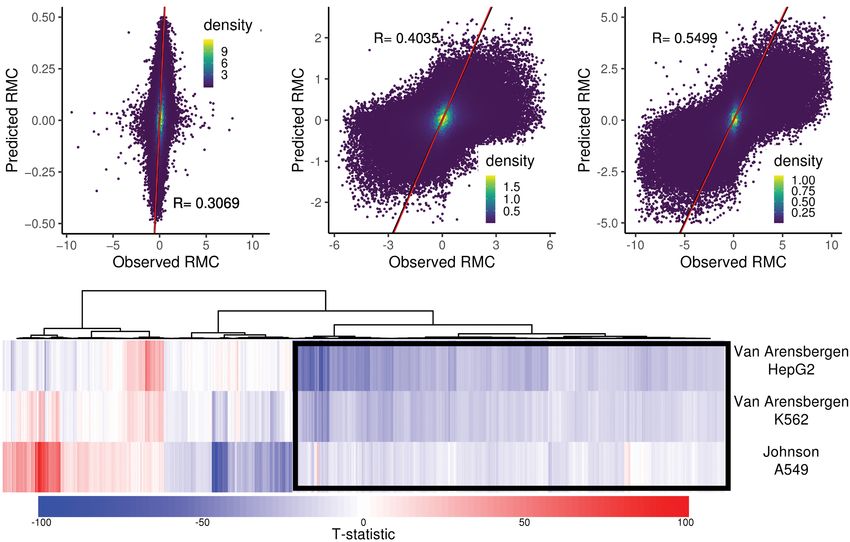
To explore more complex sequence features driving RMC in read coverage of the Alu positions is required to resolve the effect,
the data sets, we clustered the regression t-statistic (variance nor- which was present in the Johnson et al. data. For the Van
malized effect size) across the union of the top 2000 most signifi- Arensbergen et al. data, we obtained the strand signal from the pro-
cant octamers in each of the three data sets (3491 total octamers) vided bigWig files and did not measure the underlying read depth.
(Fig. 5D). Many of the octamers show agreement across all three We also observe opposing effects of the Alu A-tail in the Johnson
data sets. The Van Arensbergen K562 and Johnson et al. A549 et al. data versus that of Van Arensbergen et al. We believe that
data show the closest agreement, despite being from MPRAs with the oligo(dT) purification effect, which is only relevant to the
upstream and downstream test element configurations. Although Johnson et al. data, is likely to explain this discrepancy.
we extensively analyzed subclusters for octamer sequence com- Ancestral Alu sequence has active retrotransposon activity
monality, we were unable to find enrichment for any complex se- that depends on transcription and interaction with LINE-pro-
quence motifs. The cluster of common negative association of the duced proteins (Mills et al. 2007; Deininger 2011). As Alus tend
octamers with RMC (highlighted by black box in Fig. 5D) is com- to degenerate after insertion and accumulate fixed changes over
posed of A-rich octamers, consistent with the monomer and dimer evolutionary time, they provide a natural mutagenesis experiment
observations. by allowing simultaneous assessment of about 1 million indepen-
Though A-rich sequence is negatively associated with RMC in dently inserted and evolved sequence fragments. We find that
all three data sets, we observed that very A-rich octamers (eight or RMC values are clearly nonrandomly distributed with respect to
seven A’s) positively associate with RMC in the Johnson et al. data the transcribed Alu strand. Further, younger Alu elements, which
only (Supplemental Fig. 12). Octamers with six or fewer A’s have are more similar to the consensus, display a greater magnitude of
the negative association with RMC observed for A-rich monomers RMC at every Alu consensus position (Fig. 4).
6 Genome Research
www.genome.orgDownloaded from genome.cshlp.org on November 13, 2021 - Published by Cold Spring Harbor Laboratory Press
MPRA strand asymmetry from gene bodies and Alus
It is expected that the data from Van Arensbergen et al. dis- ment into the resultant transcript. Synthetic mutagenesis of
play strand asymmetry. The investigators intended to detect pro- strongly asymmetric sequences in multiple reporter configurations
moter activity in their experiments, and promoters are usually and locations may be helpful in future studies of specific mecha-
more active in one direction (Van Arensbergen et al. 2019). We nisms that may contribute to RMC.
also note that because we used their bigWig files instead of process- The SuRE assay used by Van Arensbergen et al. measures
ing FASTQs through the common pipeline used in all other pre- promoter-like activity, and in these data, the absolute value of
sented data sets, the Van Arensbergen et al. data may be less RMC strongly correlates with mean signal of the strands
comparable to the other data sets. Nevertheless, the Van (Supplemental Fig. 13B,C). This correlation means that as total sig-
Arensbergen et al. data show significant correlation with gene bod- nal in the SuRE assay increases, the magnitude of its asymmetry
ies similar to the Johnson et al. STARR-seq data despite the test el- also increases, as is expected given that many promoters are active
ement not being transcribed (Table 1). Also, segmentations by in only one direction. However, in the STARR-seq assay used by
HMMSeg of the Van Arensbergen et al. data are significantly sim- Johnson et al., the same correlation is much weaker, although still
ilar to gene bodies, showing comparable regional coherence to significant (P < 2.2 × 10⁻¹⁶) (Supplemental Fig. 13A). Thus, al-
that seen in the Johnson et al. STARR-seq data (Fig. 3B; though strand asymmetry is clearly present in STARR-seq-derived
Supplemental Figs. 6B, 7D,E). Furthermore, the Johnson et al. data, it tends to be a small fraction of the total signal at any given
data and Van Arensbergen et al. data show similar associations locus. As such, for enhancer sequences with high activity, the dif-
with sequence k-mers and RMC (Fig. 5D). We speculate that in ferences between the two orientations, although reproducibly
an upstream reporter configuration, gene body fragments increase detectable, are small relative to the total activity level of the ele-
the recruitment of RNA polymerase or other transcription initia- ment. This observation is consistent with the general hypothesis
tors in a manner matching their genomic orientation. Previous re- that enhancers are thought to be orientation independent
search has highlighted the similarities between enhancer activity, (Andersson et al. 2014) and the fact that many individual enhanc-
enhancer transcription, and promoter activity, and it is possible ers have been shown to be approximately equally effective in both
that the effects we describe here are related to these phenomena orientations in heterologous reporter assays (Visel et al. 2009b;
(Mikhaylichenko et al. 2018). Andersson et al. 2014; Dao et al. 2017; Mikhaylichenko et al.
Overall, we have shown that fragments of genomic sequence 2018; Klein et al. 2020). This is particularly true when considering
(∼200 bp to ∼1.1 kb in the presented data sets) from gene bodies or enhancer measurements from experiments, like luciferase reporter
Alus retain their strand asymmetry in an artificial reporter con- assays, in which technical precision in measuring activity is much
struct away from their native context of broader genomic organiza- lower than that afforded by MPRAs. Generally, although we be-
tion, chromatin structure, nuclear localization, and three- lieve that the processing of raw MPRA data should be performed
dimensional conformation. This strongly suggests that the strand in strand-aware fashion because of the added information ob-
asymmetry is driven by sequence, as no other information is car- tained from modestly more complex processing, ignoring strand
ried through to the reporters. Overall, A-rich sequence is associated asymmetry in STARR-seq data will not have a large effect on the
with lower Reference strand MPRA signal compared with that of measure of total enhancer activity for most loci.
Complement. C-rich sequence appears to affect upstream and Our results make clear that MPRA data detect a biological phe-
downstream MPRAs differently. However, we could not find nomenon that, although often subtle for a given sequence, is high-
more complex sequence motifs among the RMC-associated ly reproducible and pervasive across human genomes. The vast
octamers. We do find some octamers significantly similar to RBP multiplexing and deep sequencing inherent in MPRA technology
motifs and others to TF motifs (Supplemental Data 2). However, has enabled the robust measurements required to find these ef-
we found no “smoking gun” sequence element able to explain a fects. Although further characterization is required, the fact that
large portion of the effect. Applying Xpresso, a tool that accurately strand asymmetry is driven by primary sequence and correlates
predicts transcription level from genomic sequence only (Agarwal with gene body and Alu element orientation strongly suggests
and Shendure 2020), yields predictions significantly correlated that, whatever the underlying mechanisms are, they are factors rel-
with RMC (Supplemental Fig. 9). Also, gkmSVM analysis produces evant to gene and genome evolution.
significantly correlated predictions (Supplemental Fig. 10). All se-
quence-driven models that we tested, although highly significant,
are able to explain only a fraction of the total variance in RMC. Methods
We believe it is likely that both mechanisms that depend on
Targeted BAC-derived STARR-seq assays
the test element as a template for transcription (e.g., those related
to splicing, pre-mRNA stabilization, and poly(A) tail generation) We constructed STARR-seq libraries from 14 BACs spanning the
HTT locus (Supplemental Table 1). We grew each BAC separately
and those that depend on its ability to recruit and activate tran-
in Escherichia coli and purified BAC DNA separately according to
scriptional complexes are involved (Supplemental Data 2). The
standard BAC preparation protocols. We sheared each BAC DNA
strong strand asymmetry seen from the Alu sequence that contains
(5 μg) separately using a Biorupter pico (Diagenode) to a 100- to
both RNA stability and RNA polymerase promoter sequences is
500-bp size, then ran on 1% agarose gel, manually selected 250-
consistent with this hypothesis. Further, the concordance of
to 350-bp size, purified by Qiagen gel extraction, and eluted.
RMC between STARR and SuRE also supports this hypothesis. Each BAC fragment library separately underwent end repair, dA ad-
That said, it is possible that at least some portion of the test ele- dition, and paired-end adapter ligation (Illumina). Each BAC frag-
ments in SuRE may in fact be transcribed and thereby contribute ment library separately served as a template for PCR with primers
to some degree of mechanistic overlap, in terms of RMC, with FragF (5′ -TAGAGCATGCACCGGACACTCTTTCCCTACACGACG
STARR-seq. In particular, if test elements cloned into the SuRE plas- CTCTTCCGATCT-3′ ) and FragR (5′ -GGCCGAATTCGTCGACGGT
mid harbor promoter driving sequences within their most up- CTCGGCATTCCTGCTGAACCGCTCTTCCGATCT-3′ ), for seven
stream portions, transcription may begin in the middle of the or nine cycles, enough to generate a visible band at target size
element, leading to inclusion of a downstream portion of that ele- (∼400 bp). We purified the PCR amplicon libraries by Ampure
Genome Research 7
www.genome.orgDownloaded from genome.cshlp.org on November 13, 2021 - Published by Cold Spring Harbor Laboratory Press
Roberts et al.
SPRI beads (Beckman Coulter) and cloned by in-fusion cloning P7-StarrBAC-umi-r, 5′ -CAAGCAGAAGACGGCATACGAGATNNN
(Takara) into the pSTARR-seq_human (Addgene 71509) backbone NNNNNNNCAAACTCATCAATGTATCTTATCATG-3′ . This primer
digested with AgeI and SalI (NEB) according to the manufacturer’s also served as the reverse primer for PCR of both the cDNA and
protocols. We transformed assembled plasmids by electroporation prepped DNA. The forward primer was P5-StarrBAC-i#, 5′ -AAT
(Bio-Rad MicroPulser) into MegaX DH10B cells (Thermo Fisher GATACGGCGACCACCGAGATCTACAC##########TGTTGAAT
Scientific) in four electroporations for each BAC. After recovery, TAGATTGATCTAG-3′ , where “#” indicates an indexing sequence.
we combined the four cultures for each BAC and grew them over- We performed the first round of PCR for three cycles and purified
night in 500 mL LB broth. We purified plasmids by the Qiagen the reactions with Ampure XP beads (Beckman-Coulter). We then
plasmid maxi kit. We then pooled plasmid libraries representing performed a second round of PCR with primers targeting the
each BAC by size of BAC and DNA concentration for equal repre- P5 and P7 sequences only: P5, 5′ -AATGATACGGCGACCACC
sentation across the locus. GAGATCTACA-3′ , and P7, 5′ -CAAGCAGAAGACGGCATACGAG
We grew and maintained all cell lines according to ATCC AT-3′ , for 19 to 20 cycles. We sequenced the libraries on an
guidelines. For each technical replicate, we transfected 40 million Illumina NextSeq, generating paired-end 100-bp reads using the
cells with 133 µg of reporter plasmid pool. We performed three custom primers:
replicates per cell type. We used FuGENE (Promega) as the transfec-
tion reagent for the A549, BE(2)-C, and HepG2 cells. For K562 cells, StarrBAC-R1, 5′ -TGTTGAATTAGATTGATCTAGAGCATGCA
CCGGT-3′ ;
we used Lipofectamine PLUS (Invitrogen). After 48 h, we washed
StarrBAC-ind1, 5′ -GAGCAGACATGATAAGATACATTGATGA
the cells with PBS and lysed using RLT buffer (Qiagen). We extract-
ed RNA from the lysate using the total RNA purification kit GTTTG-3′ ;
StarrBAC-ind2, 5′ -ACCGGTGCATGCTCTAGATCAATCTAAT
(Norgen), using four spin columns per replicate and using a lysate
volume equivalent to 2 million cells per column. DNA was TCAACA-3′ ; and
StarrBAC-R2, 5′ TCATGTCTGCTCGAAGCGGCCGGCCGAAT
prepped in a similar manner using the DNeasy kit (Qiagen). We
TCGT-3′ .
purified mRNA from the total RNA preps using the DynaBeads
poly(A) selection kit (Invitrogen). We removed contaminating
DNA from the mRNA preps using TURBO DNase I (Ambion). We
performed targeted reverse transcription of reporter RNA using a Sequencing data processing and MPRA signal calculation
primer specific to the reporter sequence (5′ -CAAACTCATCAA We acquired raw FASTQ files from SRA from Johnson et al. (2018)
TGTATCTTATCATG-3′ ). Following RNase treatment, we per- (SRP144640), using SRA Toolkit (v2.9.6-1). We aligned raw paired-
formed junction PCR for 15 cycles targeting a splice created in end Illumina reads either to genome (hg38) subsets corresponding
the reporter mRNA with the following primers: F, 5′ -GGGC to the regions of BAC coverage for BAC-derived libraries or to the
CAGCTGTTGGGGTG∗ T∗ C∗ C∗ A∗ C-3′ , and R, 5′ -CTTATCATGTCT whole genome using Bowtie 2 (v 2.2.5) (Langmead and Salzberg
GCTCG∗ A∗ A∗ G∗ C-3′ , with asterisks indicating phosphorothioate 2012). For BAC-derived libraries, we also included the E. coli ge-
bonds. We prepared sequencing libraries using PCR with nome (K-12 MG1655) in the reference to filter out E. coli genomic
Illumina-compatible primers and the junction PCR product as a DNA contaminants and assess BAC prep purity. By using the align-
template. We generated DNA libraries in the same manner as for ment positions and flag sum in the aligned BAMs, we constructed
RNA except that the DNA entered after the reverse transcription BED files of the sequenced fragment, including its orientation to
step. We sequenced all libraries on the Illumina NextSeq platform reference using SAMtools v 1.8 (Li et al. 2009) and a custom Perl
using paired-end 50-bp reads, generating approximately 40 mil- script. We have included the scripts that take FASTQs to fragment
lion reads per replicate on average. BED files in the Supplemental Files. We refer to fragments aligning
For the SORT1 locus, we prepped two BACs (Supplemental to the reference as “Reference” and those to the reference reverse
Table 1) according to standard BAC protocols. We sheared the complement as “Complement.”
BAC DNA using a Covaris ultrasonicator, and each underwent We created a set of 290-bp nonoverlapping bins spanning the
end repair, dA addition, and ligation to custom adaptors: autosome using the R version 3.6.1 (R Core Team 2019) package
GenomicRanges v1.36 (Lawrence et al. 2013). We picked 290 bp
Left—Starr-adapt-3A, 5′ -TTGAATTAGATTGATCTAGAGCAT because it was the median fragment size of the BAC-derived librar-
GCACCGG∗ T-3′ , and Starr-adapt-3C, 5′ -CCGGTGCATGCTCTAG ies. For BAC-derived libraries, we reduced the bins to only those
ATCAATC-3′ ; that overlapped the BAC-covered regions to facilitate computa-
Right—Starr-adapt-2A, 5′ -ATGTCTGCTCGAAGCGGCCGGC tion. We converted the sequencing data fragment BED files to
CGAATTCG∗ T-3′ , and Starr-adapt-2C, CGAATTCGGCCGGCCG GenomicRanges objects using the R package rtracklayer v1.44.3
CTTCGAGC. (Lawrence et al. 2009). We found overlaps of Reference and
We size-selected ligated fragment on an agarose gel, aiming Complement fragments separately for each bin, generating bin
for 1-kb fragments. After gel extraction, we subjected the product counts from each strand. We supply the scripts for generating
to 14 cycles of PCR using Starr-adapt-3A and Starr-adapt-2A as bin counts in the Supplemental Files.
primers. We digested the STARR-seq ORI vector (Addgene 99296) Each experiment had DNA counts corresponding to reporter
with AgeI and SalI restriction enzymes (NEB) and inserted frag- input levels and RNA counts corresponding to transcripts derived
ments via NEBuilder HiFi assembly (NEB). For each BAC library, from the reporters. We normalized the raw counts of each pair of
we transformed into NEB 3020 electrocompetent cells and DNA and RNA versus strand by dividing by the sum of each count
prepped the entire transformation with a Chargeswitch midi kit type across all bins. We then calculated the reporter activity for
(Invitrogen). each strand by dividing the normalized RNA counts by the nor-
We transfected HepG2 cells with each BAC-derived library us- malized DNA counts. To measure strand asymmetry, we subtracted
ing Lipofectamine (Invitrogen). After 48 h, we harvested RNA and the Complement strand signal from the Reference strand signal to
DNA using the Qiagen AllPrep kit (Qiagen). We purified mRNA us- yield RMC.
ing the mRNA mini kit (Oligotex). We removed contaminating The reporter data from Van Arensbergen et al. used barcodes
DNA from the mRNA preps using TURBO DNase I (Ambion). associated by a separate sequencing run with upstream elements
For RNA, we performed reverse transcription adding a UMI with (Van Arensbergen et al. 2019). Because of the complexities of
8 Genome Research
www.genome.orgDownloaded from genome.cshlp.org on November 13, 2021 - Published by Cold Spring Harbor Laboratory Press
MPRA strand asymmetry from gene bodies and Alus
associating barcodes to test elements in an unfamiliar experimen- of these. To evaluate the similarity of the calculated segmentations
tal design we did not perform ourselves, we instead downloaded to gene body classes, we used a conditional entropy approach
the stranded reporter signal bigWigs from the metadata in the (Haiminen et al. 2007). We calculated the conditional entropy
GEO submission (GSE128325). These bigWigs are also hg19-refer- (H) of the HMMSeg segmentation (P) given a stranded gene body
enced, so we mapped, with the import function in rtracklayer, the class, for example, Reference genes (Q), based on the lemma
bigWig values to the autosome bin set that we had lifted from hg38 H(P|Q) = H(U) – H(Q) provided by Haiminen et al. (2007), where
to hg19 using the UCSC Genome Browser liftOver tool (Kent et al. U is the union of all segment borders in both P and Q. We then is-
2002). We assigned signal from the bigWigs labeled “plus” to the entropically shuffled P (maintaining the width and number of seg-
Reference strand and those labeled “minus” to the Complement ments but shuffling start positions) 1000 times and calculated
strand in accordance with the investigators’ description of their H(P|Q) of each shuffle. We evaluated significance by comparing
processing. After mapping, we back-converted to hg38 so that the actual value of H(P|Q) to the distribution of values from shuf-
these data would be comparable to the other data sets. We calculat- fles. We used the process separately to Reference and Complement
ed RMC for these data as above but noticed outliers of very high genes, considering both P-values in our evaluation of significance.
absolute RMC. HMMSeg assumes a Gaussian underlying distribu-
tion, and these outliers interfered with the segmentation calcula-
tions. Accordingly, we removed bins whose signal value in either Calculation of Alu sequence effect
strand was exactly zero and those that were above the 99th percen- We downloaded the complete BED file of RepeatMasker tracks
tile in signal intensity. This modest trimming of outliers produced from the UCSC Genome Browser (Kent et al. 2002). By using a cus-
RMC values that met HMMSeg assumptions. tom Perl script (Supplemental Files), we processed this file to pull
out Alu positions, creating a BED file of every Alu base with geno-
mic position, position within the Alu consensus sequence, strand,
Hierarchical clustering and association with gene bodies and divergence (in milliDiv units). To this Alu reference, we then
To create heatmaps of data hierarchically clustered by similarity, counted overlaps of the fragment BED files from the Johnson
we calculated Spearman’s correlation coefficient, rho, between et al. data in the same process used for the autosome bins. For
each sample within an experiment. We then calculated the the Van Arensbergen et al. data sets, we queried the signal
Euclidean distance between each sample and clustered using the bigWig files at each Alu base pair (1-bp-wide genomic ranges) using
R functions dist and hclust. We created heatmaps with the indicat- a custom R-script (Supplemental Files). Again, we filtered out val-
ed saturation color ranges. ues that were exactly zero and those above the 99th percentile.
For the Johnson et al. data, we observed agreement in strand RMC was calculated by subtracting the Complement base values
asymmetry across dexamethasone-treatment duration. To have from the Reference base values. Many (about 1 million) genomic
more accurate genome-wide data, we summed the sequencing positions map to each Alu consensus base. We split each consensus
bin counts across all dexamethasone-treatment durations to a sin- base into three blocks of divergence by milliDiv thresholds of less
gle RMC measurement for the data set. We filtered out bins with than 100, 100–200, and more than 200. Then we summed strand-
fewer than 57 summed DNA counts, which we calculated would ed counts from genomic positions to their Alu consensus position/
yield 10 RNA counts from each strand for a neutral test element, milliDiv group for the Johnson et al. data. In this case, we kept the
on average. For the Van Arensbergen et al. data, we noticed similar dexamethasone-treatment sets separate in order to estimate vari-
agreement across donor genomic DNA. For these data, we took the ance and because the subsequent collapsing to consensus se-
median signal across the donors and calculated a single RMC for quence yields sufficiently numerous counts. From these
each cell type. collapsed counts, we calculated median RMC at each Alu consen-
To compare these data to gene bodies, we constructed a sus position/milliDiv group set, as well as the standard deviation
GenomicRanges object for gene models obtained from GTEx v8 across dexamethasone-treatment durations. For the Van
without limiting to protein coding or any other filter. All regions Arensbergen et al. data, we took the median of signal across the ge-
of the autosome without an annotated gene model we labeled nomic positions to their Alu consensus position/milliDiv group.
“intergenic.” We labeled regions, calling sense transcripts match- We kept data from each donor genome separate in order to esti-
ing reference “Reference.” Those with sense transcripts matching mate variance. We calculated the RMC at each Alu consensus posi-
the reverse complement of reference we labeled “Complement.” tion/milliDiv group as well as the standard deviation across donor
Wherever there were annotated gene models on both strands, we genomes.
labeled them “opposite overlapping.” In this way, we divided the
entire autosome into four categories. To evaluate the correlation
of RMC with these gene body categories, we calculated the overlap Sequence-based modeling of MPRA asymmetry
of each autosome bin to each category. By using the category as the To build a linear model relating sequence content to RMC, we first
independent variable and the RMC as the dependent variable, we counted the frequency of all monomers, dimers, and octamers in
performed linear regression using the R function lm. Boxplots were each bin across the genome, allowing k-mer overlaps. For each k-
made in a similar fashion. mer, we then performed a genome-wide Spearman’s correlation
To create segmentations of the RMC values, we used a hidden for the Johnson et al. A549 data and the Van Arensbergen et al.
Markov model approach via the HMMSeg software package (Day K562 and HepG2 between RMC and k-mer count on three genome
et al. 2007). For all data, we used a two-state model. For the bin sets: All bins, the combination of top 1% and bottom 1% RMC
whole-genome data sets, the emission means and variances were bins, and the middle 80% RMC bins. To avoid overfitting and
calculated from the means and variances of the data in make a linear model computationally tractable, we reduced the
Complement and Reference genes, respectively. Because the set of octamers to fewer than 1000 octamers by selecting the stron-
BAC-derived data sets encompassed smaller regions containing a gest P-value between the three correlations for each octamer and
small number of gene models, we used the emission means and picking the 1000 most significant. We then used the counts for
variances of the Johnson et al. data in the segmentation models each of these octamers, all dimers, and all monomers (for a total
of these. For all data sets, we tested a range of transition probabil- of 956 k-mers) as predictor variables in a linear model of RMC ∼
ities from 0.05 to 0.5. We present data from a representative subset k-mer counts. The model was trained on all data from
Genome Research 9
www.genome.orgDownloaded from genome.cshlp.org on November 13, 2021 - Published by Cold Spring Harbor Laboratory Press
Roberts et al.
Chromosome 1 and tested on all data from Chromosome References
2. Additionally, we created a model for each individual k-mer using
Agarwal V, Shendure J. 2020. Predicting mRNA abundance directly from ge-
that k-mer’s count as the sole independent variable to determine nomic sequence using deep convolutional neural networks. Cell Rep 31:
individual r 2 values. For comparison to RBP and TF motifs within 107663. doi:10.1016/j.celrep.2020.107663
the Cis-BP database (Weirauch et al. 2014), we identified all Almada AE, Wu X, Kriz AJ, Burge CB, Sharp PA. 2013. Promoter directional-
octamers that were found significant in the linear model. We saved ity is controlled by U1 snRNP and polyadenylation signals. Nature 499:
360–363. doi:10.1038/nature12349
these octamers as a FASTA file and used the FIMO function (Grant
Andersson R, Gebhard C, Miguel-Escalada I, Hoof I, Bornholdt J, Boyd M,
et al. 2011) of the MEME suite (version 5.1.0), using default Chen Y, Zhao X, Schmidl C, Suzuki T, et al. 2014. An atlas of active en-
parameters. hancers across human cell types and tissues. Nature 507: 455–461.
We ran Xpresso using a pretrained convolutional neural net- doi:10.1038/nature12787
work model intended to predict median gene expression levels Andersson R, Chen Y, Core L, Lis JT, Sandelin A, Jensen TH. 2015. Human
gene promoters are intrinsically bidirectional. Mol Cell 60: 346–347.
across cell types (Agarwal and Shendure 2020; https://xpresso.gs doi:10.1016/j.molcel.2015.10.015
.washington.edu/). We computed the predicted RMC as the differ- Arnold CD, Gerlach D, Stelzer C, Boryń ŁM, Rath M, Stark A. 2013. Genome-
ence between the predicted value of Xpresso run on the Reference wide quantitative enhancer activity maps identified by STARR-seq.
versus Complement strand, centered upon the same intervals used Science 339: 1074–1077. doi:10.1126/science.1232542
Ashe HL, Monks J, Wijgerde M, Fraser P, Proudfoot NJ. 1997. Intergenic
to calculate RMC from MPRA data. transcription and transinduction of the human β-globin locus. Genes
We used gkmSVM (Ghandi et al. 2014, 2016) with the Dev 11: 2494–2509. doi:10.1101/gad.11.19.2494
Johnson et al. and Van Arensbergen et al. data sets. For each of Barakat TS, Halbritter F, Zhang M, Rendeiro AF, Perenthaler E, Bock C,
the three data sets, we identified all regions with RMC > 0 as a pos- Chambers I. 2018. Functional dissection of the enhancer repertoire in
human embryonic stem cells. Cell Stem Cell 23: 276–288.e8. doi:10
itive set and all regions with RMC < 0 as a negative set. We sampled
.1016/j.stem.2018.06.014
10,000 regions in each, as well as an additional, independent Bell AC, West AG, Felsenfeld G. 1999. The protein CTCF is required for the
20,000 regions as a test set from the full RMC data. We then ran enhancer blocking activity of vertebrate insulators. Cell 98: 387–396.
gkmsvm_kernel with addRMC = F, gkmsvm_trainCV with default doi:10.1016/S0092-8674(00)81967-4
parameters, and gkmsvm_classify with addRC = F. Dao LTM, Galindo-Albarrán AO, Castro-Mondragon JA, Andrieu-Soler C,
Medina-Rivera A, Souaid C, Charbonnier G, Griffon A, Vanhille L,
To compare k-mers across the three data sets, we found all Stephen T, et al. 2017. Genome-wide characterization of mammalian
pairs of reverse complements. Initially, we chose the sequence promoters with distal enhancer functions. Nat Genet 49: 1073–1081.
that was alphabetically first among the two to represent the pair. doi:10.1038/ng.3884
For octamers, we selected the top 2000 most significant for each Day N, Hemmaplardh A, Thurman RE, Stamatoyannopoulos JA, Noble WS.
2007. Unsupervised segmentation of continuous genomic data.
of the three data sets and took the union, resulting in 3491 Bioinformatics 23: 1424–1426. doi:10.1093/bioinformatics/btm096
octamers. We calculated the pairwise alignment score between Deininger P. 2011. Alu elements: know the SINEs. Genome Biol 12: 236.
all of these octamers (ShortRead R package). We then symmetri- doi:10.1186/gb-2011-12-12-236
cally clustered the octamers by pairwise alignment score using Dekker J, Rippe K, Dekker M, Kleckner N. 2002. Capturing chromosome
conformation. Science 295: 1306–1311. doi:10.1126/science.1067799
the R functions dist() and hclust(). We split the octamers into
Duttke SHC, Lacadie SA, Ibrahim MM, Glass CK, Corcoran DL, Benner C,
two subclusters and then chose the sequence to represent a reverse Heinz S, Kadonaga JT, Ohler U. 2015. Human promoters are intrinsically
complement pair by finding the one that produced the best mean directional. Mol Cell 57: 674–684. doi:10.1016/j.molcel.2014.12.029
alignment score to the other octamers in its subcluster. With each The ENCODE Project Consortium. 2012. An integrated encyclopedia of
octamer pair’s representative sequence chosen, we assigned t-sta- DNA elements in the human genome. Nature 489: 57–74. doi:10
.1038/nature11247
tistics to each pair based on the chosen sequence. These t-statistics Ghandi M, Lee D, Mohammad-Noori M, Beer MA. 2014. Enhanced regula-
were hierarchically clustered using the dist() and hclust() tory sequence prediction using gapped k-mer features. PLoS Comput Biol
functions. 10: e1003711. doi:10.1371/journal.pcbi.1003711
Ghandi M, Mohammad-Noori M, Ghareghani N, Lee D, Garraway L, Beer
MA. 2016. gkmSVM: an R package for gapped-kmer SVM.
Bioinformatics 32: 2205–2207. doi:10.1093/bioinformatics/btw203
Gordon MG, Inoue F, Martin B, Schubach M, Agarwal V, Whalen S, Feng S,
Data access Zhao J, Ashuach T, Ziffra R, et al. 2020. lentiMPRA and MPRAflow for
high-throughput functional characterization of gene regulatory ele-
All raw and processed sequencing data generated in this study have ments. Nat Protoc 15: 2387–2412. doi:10.1038/s41596-020-0333-5
been submitted to the NCBI Gene Expression Omnibus (GEO; Grant CE, Bailey TL, Noble WS. 2011. FIMO: scanning for occurrences of a
https://www.ncbi.nlm.nih.gov/geo/) under accession number given motif. Bioinformatics 27: 1017–1018. doi:10.1093/bioinformatics/
GSE156857. btr064
Green P, Ewing B, Miller W, Thomas PJ, Thomas J, Touchman J, Blakesley R,
Bouffard G, Beckstrom-Sternberg S, McDowell J, et al. 2003.
Transcription-associated mutational asymmetry in mammalian evolu-
tion. Nat Genet 33: 514–517. doi:10.1038/ng1103
Competing interest statement Haiminen N, Mannila H, Terzi E. 2007. Comparing segmentations by apply-
ing randomization techniques. BMC Bioinformatics 8: 171. doi:10.1186/
The authors declare no competing interests. 1471-2105-8-171
Johnson DS, Mortazavi A, Myers RM, Wold B. 2007. Genome-wide mapping
of in vivo protein–DNA interactions. Science 316: 1497–1502. doi:10
.1126/science.1141319
Johnson GD, Barrera A, McDowell IC, D’Ippolito AM, Majoros WH, Vockley
Acknowledgments CM, Wang X, Allen AS, Reddy TE. 2018. Human genome-wide measure-
ment of drug-responsive regulatory activity. Nat Commun 9: 5317.
We thank the Tim Reddy laboratory at Duke University and the Bas doi:10.1038/s41467-018-07607-x
van Steensel laboratory at the Netherlands Cancer Institute for Jurka J, Kapitonov VV, Klonowski P, Walichiewicz J, Smit AF. 1996.
their generation of high-quality MPRA data sets. This work was Identification of new medium reiteration frequency repeats in the ge-
supported by the CHDI Foundation grant A-15607 (to R.M.M.) nomes of Primates, Rodentia and Lagomorpha. Genetica 98: 235–247.
doi:10.1007/BF00057588
and the Leo Fund at HudsonAlpha and National Institutes of Kent WJ, Sugnet CW, Furey TS, Roskin KM, Pringle TH, Zahler AM, Haussler
Health (NIH) grants 1UM1HG009408 and 1R01HG009136 (to D. 2002. The human genome browser at UCSC. Genome Res 12: 996–
J.S.). J.S. is an investigator of the Howard Hughes Medical Institute. 1006. doi:10.1101/gr.229102
10 Genome Research
www.genome.orgYou can also read