Delhi air quality prediction using LSTM deep learning models with a focus on COVID-19 lockdown
←
→
Page content transcription
If your browser does not render page correctly, please read the page content below

Delhi air quality prediction using LSTM deep learning models with a focus on COVID-19
                                                                                lockdown

                                                                                       Animesh Tiwaria , Rishabh Guptab , Rohitash Chandrac
                                                                         a Department    of Civil Engineering, Indian Institute of Technology Guwahati, Guwahati, India
                                                                     b Department   of Geology and Geophysics, Indian Institute of Technology Kharagpur, Kharagpur, India
                                                                                    c School of Mathematics and Statistics, UNSW Sydney, NSW 2006, Australia

                                         Abstract
                                         Air pollution has a wide range of implications on agriculture, economy, road accidents, and health. In this paper, we use novel
arXiv:2102.10551v1 [cs.LG] 21 Feb 2021

                                         deep learning methods for short-term (multi-step-ahead) air-quality prediction in selected parts of Delhi, India. Our deep learn-
                                         ing methods comprise of long short-term memory (LSTM) network models which also include some recent versions such as
                                         bidirectional-LSTM and encoder-decoder LSTM models. We use a multivariate time series approach that attempts to predict air
                                         quality for 10 prediction horizons covering total of 80 hours and provide a long-term (one month ahead) forecast with uncertainties
                                         quantified. Our results show that the multivariate bidirectional-LSTM model provides best predictions despite COVID-19 impact
                                         on the air-quality during full and partial lockdown periods. The effect of COVID-19 on the air quality has been significant during
                                         full lockdown; however, there was unprecedented growth of poor air quality afterwards.
                                         Keywords: Deep learning, LSTM, air pollution, Delhi, COVID-19, prediction

                                         1. Introduction                                                                  shows that infected air is one of the prominent causes of pre-
                                                                                                                          mature deaths [14] and the average life span reduces due to in-
                                            The global human population has risen by more than four                       creasing rates of air contamination [15]. It is well known that
                                         times during the last century [1]. Research show that the major                  apart from industrial pollution, agricultural fires are one of the
                                         growth in population is attributed to the metropolitan areas in                  significant contributors of air pollution in Delhi [16].
                                         the less developed regions around the globe [2, 3]. The conse-                      Apart from strategies that focus on management of industrial
                                         quence of these increased levels of growth in poorly developed                   waste[17], it is important to model and forecast the air-quality
                                         states is low air quality. We note that 80% of global cities [3]                 both in short and long-term. Machine learning methods have
                                         and 98% of cities in middle-income countries surpass the pro-                    been promoting for forecasting temporal sequences and their
                                         posed levels of air quality [4, 5]. Increase in air pollution results            application to air-quality forecasting has gained attention re-
                                         in economic losses, reduced visibility, contributes to faster cli-               cently [18, 19, 20]. Forecasting models can be used to develop
                                         mate change that contribute to extreme weather conditions, mil-                  strategies to evaluate and alarm the general public for future
                                         lions of premature deaths annually [6]. The major factor in air                  hazardous levels of air quality index. Forecasting models for
                                         pollution is the anthropogenic fine particulate matter (PM); i.e.                air pollution concentrations can be broadly classified into two
                                         PM2.5 (particles with an aerodynamic diameter shorter than 2.5                   major categories; simulation based and data driven approaches
                                         micrometer) [7, 8, 9, 10]. Despite the concentrations of PM2.5                   such as statistical or machine learning methods. Simulation-
                                         being two to five times higher in developing countries, most of                  based method incorporates physical and chemical models for
                                         the air quality considerations and estimations are analyzed for                  generating meteorological and background parameters to simu-
                                         developed countries [11].                                                        late emission, transport and chemical transformation of air pol-
                                            Delhi is one of the most prominent in terms of growing cities                 lution [21, 22]]. However, they suffer from numerical model
                                         has an estimated population of more than 19.3 million [12]. The                  uncertainties and due to the lack of data, the parameterization
                                         population density and growth in the last few decades and rapid                  of aerosol emissions is restricted [23]]. Data driven approaches
                                         industrial expansion led to massive air pollution to hazardous                   exploit statistical and machine learning techniques to detect pat-
                                         levels and thus failed in providing people with one of the pri-                  terns between predictors and dependent variables in temporal
                                         mary life amenities, quality air. The World Economic Forum                       sequences [24, 25, 26, 27, 28]. Machine learning methods can
                                         recently reported India having 6 of the world’s 10 most pol-                     be used to identify the exposures relevant to health outcomes of
                                         luted cities with Delhi has one of most polluted [13]. Research                  interest within high-dimensional data [29]. Advances in deep
                                                                                                                          learning methods give further motivations for application to do-
                                                                                                                          main of air-quality prediction.
                                            Email addresses: animesh18a@iitg.ac.in (Animesh Tiwari),
                                         rishabhgupta05@gmail.com (Rishabh Gupta),                                           Recurrent neural networks (RNNs) are prominent deep learn-
                                         rohitash.chandra@sydney.edu.au (Rohitash Chandra)                                ing models [30] suited for modelling temporal sequences, espe-
                                         Preprint submitted to Environmental Modelling & Software                                                                           February 23, 2021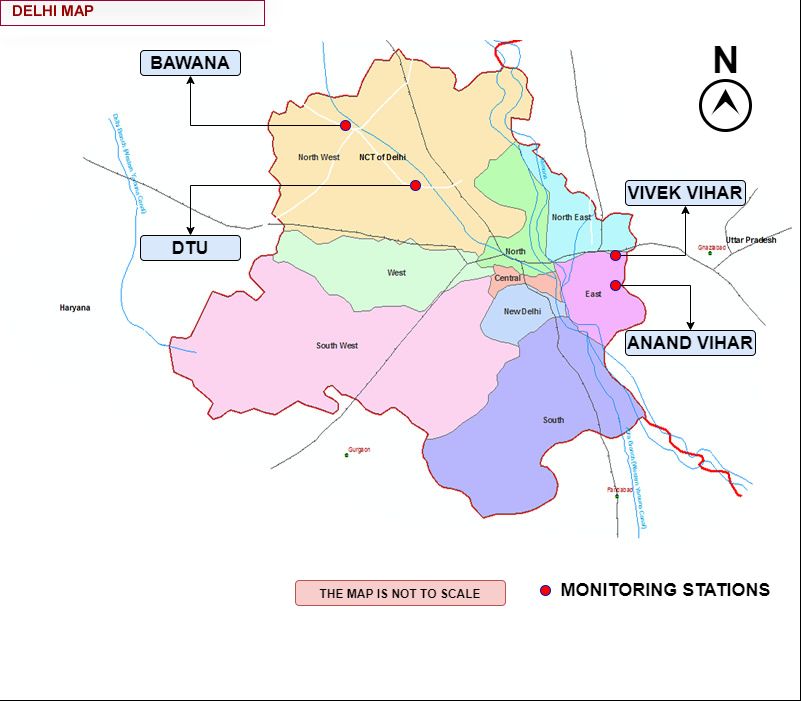
cially those involving long-term dependencies [31, 32, 33, 30,            2. Related Work
34]. Long Short Term Memory networks (LSTMs) were de-
veloped [33] to address limitations in learning long-term de-             2.1. COVID-19 and air pollution
pendencies in sequences by canonical RNNs [35, 36]. Gated
Recurrent Unit (GRU) [37, 38] networks are more simpler to                   There have been studies relating the effect of environment
implement but provides similar performance than LSTMs. Bi-                and air pollution on COVID-19 and vice versa [48, 49, 49].
directional RNNs connect two hidden layers of opposite direc-             Zhu et al. [50] found that there was a significant relationship
tions to the same output where the output layer can get informa-          between air pollution and COVID-19 infection in China. Ker-
tion from past and future states simultaneously [39]. This led            imray et al. [48] presented an assessment on the impact of
to bidirectional-LSTMs for phoneme classification [40] which              COVID-19 in large cities in Kazakhstan and found that the tem-
performed better than standard RNNs and LSTMs and has the                 poral reduction in pollution may not be directly attributed to the
potential to be used for forecasting air-pollution time series.           lockdown due to favorable meteorological variations during the
   The coronavirus disease 2019 (COVID-19) is an infectious               period, however the spatial effects of the lockdown on the pollu-
disease [41, 42, 43] which became a global pandemic [44] with             tion levels were clear. Moreover, other non-traffic based sources
major impact to our lifestyle. COVID-19 forced many countries             such as coal based power plants substantially contributed to the
to close their borders and enforce a partial or full lock down            pollution level. Dantas et al. [49] presented a study on the im-
with devastating impact on the world economy [45, 46, 47].                pact of COVID-19 partial lockdown on the air quality of the
There has been studies relating the effect of environment and air         city of Rio de Janeiro, Brazil. The authors reported that The
pollution on COVID-19 and vice versa [48, 49, 49] with studies            carbon-dioxide levels showed the most significant reductions
regarding China [50], Kazakhstan [48] and [49] Brazil. In some            during the partial lockdown while nitrogen-oxide decreased in
cases, COVID-19 lock-downs with reduced traffic showed to re-             a lower extent, due to industrial and diesel input. The air qual-
duce air pollution while in others, it did not make significant im-       ity index (with PM-10 concentration) was only reduced during
pact due to meteorological conditions and factors such as indus-          the first partial lockout week. Bao and Zhang [53] reviewed 44
trial pollutants [51, 49]. Although machine learning has been             cities in China to find if COVID-19 lockdowns had an effect
used for forecasting air-quality, there is scope in improving the         on air pollution. The authors showed that the lockdowns of 44
forecasts in using latest machine learning models, that feature           cities reduced human movements by 69.85 %, and the reduc-
deep learning models such as recurrent neural networks. Given             tion in the air quality index was mediated by human mobility.
this motivation, we focus on air-quality index of Delhi which             Li et al. [54] presented a study on air quality changes during
lately reached hazardous levels. We note that the air-quality             the COVID-19 lockdown over the Yangtze River Delta region
in Delhi has significantly improved post COVID-19 pandemic                in Northern China where the authors showed that the ozone did
[52], however this was due to lock-downs by the government                not show any reduction. Moreover, even during the lockdown
and the air-quality can deteriorate further when the restrictions         it was evident that background and residual pollution are still
are eased. Hence it is important to develop robust forecasting            high, which includes sources mostly from the industry. Dutheil
models, that are applicable even during lock-downs and eras of            and Naval [55] investigated COVID-19 as a factor influencing
lock-downs during the COVID-19 pandemic.                                  air pollution for China. The authors argued that COVID-19
   In this paper, use novel deep learning methods for long-term           pandemic might paradoxically have decreased the total number
air-quality prediction in selected parts of Delhi, India. Our             of deaths during the period by drastically decreasing the num-
deep learning methods comprise of Long Short Term Memory                  ber of fatalities due to air pollution, apart from positive benefits
(LSTMs) networks, bidirectional-LSTMs and encoder-decoder                 in reducing preventable non communicable diseases. Wang et
LSTMs. We use a multivariate time series approach that at-                al. [51] showed that in case of China, severe air pollution events
tempts to predict air quality for 10 prediction horizons covering         were not avoided by reduced activities during COVID-19 out-
a total of 80 hours with 8 hours for each prediction horizon. We          break due to adverse meteorological events. The authors high-
also provide a long-term (one month ahead) forecast with un-              light that large emissions reduction in transportation and slight
certainty quantification given feedback of predicted values into          reduction in industrial would not help avoid severe air pollution
the model. We first show visualisation of the air quality indi-           especially when meteorology is unfavorable.
cators before and during coronavirus (COVID) restrictions in                 There have been studies if there is another correlation with
Delhi. We investigate the impact of COVID-19 on air-quality               rise in COVID-19 infections to the weather change. Tosepu et
and the ability of the model to provide quality predictions be-           al. [56] presented a study regarding the correlation between
fore and during COVID-19. Our models feature data that con-               weather and COVID-19 pandemic in Jakarta, Indonesia tak-
siders major seasons, effect of COVID-19, and considers mul-              ing into account different temperature levels and percentage of
tivariate and univariate approach for predictions.                        humidity, and amount of rainfall. The authors reported that
   The rest of the paper is organised as follows. Section 2               only the average temperature was significantly correlated with
presents a background and literature review of related work.              COVID-19 pandemic. Ma et al. [57] presented a study on the
Section 3 presents the proposed methodology and Section 4                 effects of temperature variation and humidity on the death of
presents experiments and results. Section 5 provides a discus-            COVID-19 in Wuhan, China. The authors collected the daily
sion and Section 6 concludes the paper with discussion of future          death numbers of COVID-19 and meteorological parameters
work.                                                                     and air pollutant data and used generalized additive model to
                                                                      2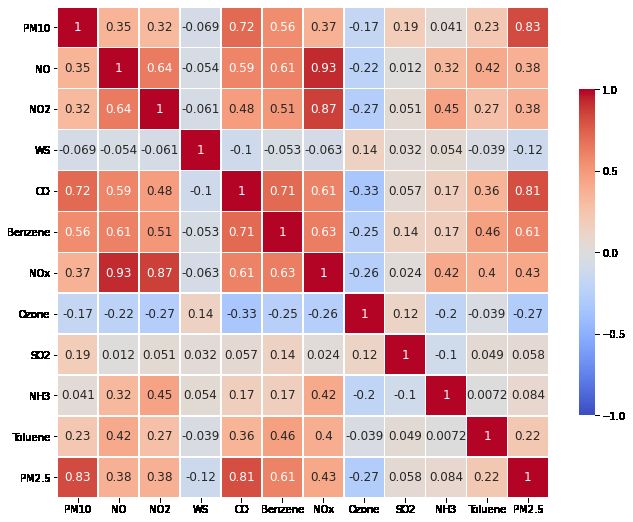
explore the effect of temperature, humidity and diurnal temper-            to air pollution during the daily commute in a systematic re-
ature range on the daily death counts of COVID-19. The au-                 view highlighted studies with schoolchildren’s exposure during
thors reported that the temperature variation and humidity may             commutes that are linked with adverse cognitive outcomes and
be important factors affecting the COVID-19 mortality.                     severe wheeze in asthmatic children[67]. Furthermore, Ambi-
                                                                           ent air pollution associated with reduction in lung functionality
2.2. Machine learning methods for forecasting air pollution                and other respiratory conditions among children [68].
                                                                              Apart from health, air pollution has taken a toll on various
   We review machine learning methods used for air quality
                                                                           other sectors, which includes agriculture. Industrial air pollu-
forecasting in the past decades. Machine learning methods
                                                                           tion has a drastic effect in agricultural production as shown by
have achieved tremendous success in a variety of areas for air
                                                                           a study in China with lower marginal products and further al-
quality forecasting [24, 25, 26, 27, 28]. Although neural net-
                                                                           ters the relationships of labour-capital and other factors [69].
works have advantages over traditional statistical methods in air
                                                                           Finally, air pollution has a drastic effect on development and
quality forecasting, they have room for improvements [58] due
                                                                           economy. A study on the relationship between air pollution and
to challenges that include computational expense, sub-optimal
                                                                           stock returns further showed that industrial air pollution signif-
convergence, over-fitting, and noisy data. Moreover, the chal-
                                                                           icantly reduces the technical efficiency of agricultural produc-
lenge is in configuration of the network topology and model
                                                                           tion [70].
parameters which affects the prediction performance. Corani
[59] used models to predict hourly PM-10 concentrations on
the basis of data from the previous day with feedforward and               3. Methodology
pruned neural networks. Jiang et al. [? ] explored multiple
models that feature physical and chemical model, regression                3.1. Delhi Situation Report and Data
model, and multiple layer perceptron on the air pollutant pre-
                                                                              According to the United Nations 2016 report, Delhi had an
diction task, and their results show that statistical models are
                                                                           estimated population of 26 million in greater metro area which
competitive with the classical physical and chemical models.
                                                                           is projected to rise to 36 million by 2030 and will remain sec-
   Machine learning is an active field of research and every
                                                                           ond most populated city after Tokyo [71]. The current popula-
now and then novel tools and techniques emerge for more re-
                                                                           tion density is also one of the worlds largest that will continue
fined modeling of a specific problem. Some recent works use
                                                                           to pose further challenges to air quality and health. According
straightforward approaches like box models, Gaussian models
                                                                           to a study by Indian Ministry of Earth Sciences in 2018, it was
and linear statistical models, which are easy to implement and
                                                                           shown that number of vehicles increases by four times since
allow for the rapid calculation of forecasts [60]. Fu et al. [61]
                                                                           2000 which has been a major factor for air pollution in India
applied a rolling mechanism and gray model to improve tradi-
                                                                           which includes PM2.5 and hazardous nitrogen-oxide [72]. In
tional neural network models. Chang et al. [62] used aggre-
                                                                           the past five years, the air quality index of Delhi has been gen-
gated LSTM networks and compared the results with support
                                                                           erally moderate (101–200) level between January to Septem-
vector regression, and gradient boosted tree regression. Karim-
                                                                           ber. The air quality index then drastically deteriorates to very
ian et al. [23] implemented three machine learning methods to
                                                                           poor (301–400), and further Severe (401–500) or Hazardous
forecast air quality given by PM-2.5 concentrations over dif-
                                                                           (500+) levels during October to December due to various fac-
ferent time intervals; these include multiple additive regression
                                                                           tors [73, 74]. The air pollution status in Delhi has undergone
trees, deep feedforward neural network, and a hybrid model
                                                                           many changes in terms of the levels of pollutants and the control
based on LSTM networks, where the LSTM model was most
                                                                           measures taken to reduce them. Sulian et al. [75] provides an
effective for forecasting and controlling air pollution. Xiao et al.
                                                                           evidence-based insight into the status of air pollution in Delhi
[63] parameterised non-intrusive reduced order model based on
                                                                           and its effects on health and control measures instituted.
proper orthogonal decomposition for model reduction of pol-
                                                                              The meteorological conditions, such as regional and synop-
lutant transport equations to provide rapid response urban air
                                                                           tic meteorology are significant in determining the air pollutant
pollution predictions and controls. Zhu et al. [64] focused on
                                                                           concentrations[76, 77, 78, 79]. Lower wind speed (weak dis-
refined modeling for predicting hourly air pollutant concentra-
                                                                           persion/ventilation) can result in higher concentrations of traffic
tions on the basis of historical meteorological and air pollution
                                                                           pollutants [80]. However, strong wind speed might form dust
data.
                                                                           storms and end up blowing the particles on the ground.[81].
                                                                           Higher humidity levels are associated with higher aggregates
2.3. Effect of air-pollution                                               of air pollutants like PM2.5, carbon monoxide (CO), nitrogen
   Data-driven machine learning methods present an opportu-                dioxide (NO2) and sulfur dioxide (SO2) [82]. In addition, high
nity to simultaneously assess the impact of multiple air pol-              levels of humidity often indicate precipitation events which
lutants on health outcomes. There is growing evidence that                 result in heavy wet deposition leading to the lowering of air
early-life exposure to ambient air pollution affect neuro devel-           pollutants[83]. The most important factors of attenuated visibil-
opment in children [65]. A study that showed that air pol-                 ity are the interactions of particle compositions and light [84?
lution is a potential risk factor for obesity with higher body-            ]. Thus, low visibility can be considered as a strong indicator
mass index in adults that warrants further investigation about             of high PM2.5 concentrations. Many a time, the formation of
other health effects[66]. Assessing schoolchildren’s exposure              some significant air pollutants like ozone (O3) is reduced by
                                                                       3
cloud cover as they absorb and scatter solar radiations [85, 86].
Therefore, these meteorological variables are importantly se-
lected to predict air quality and hence we take them into con-
sideration.
   We chose four most polluted areas in Delhi and several sur-
rounding districts known as the National Capital Region (NCR)
for our study. Bawana was the most-polluted area with an air
quality index of 497, followed by DTU-Delhi Technological                Parameter                 Range                 Mean and std
University (487), Anand Vihar (484) and Vivek Vihar (482) as             PM10                      13.00-1000.0          218.05 138.61
shown in Figure 3. There are 12 parameters that have been                Benzene                   0.03-40.86            4.96 4.20
considered for our study, the data is taken from the Central Pol-        Toluene                   10.37-238.50          43.02 9.18
lution Control Board, India [87] for 3 years in 8 hour interval.         Ammonia Gas(NH3)          0.18-300.65           25.84 20.60
The dataset consists of concentration levels of different param-         Nitric Acid(NO)           0.79-351.21           18.50 23.56
eters of air-pollution from four different monitoring stations in-       Nitrous Oxide(NO2)        2.00-265.82           38.45 26.99
                                                                         Nitrogen Oxides(NOx)      0.0-344.35            34.42 29.82
stalled by the government agency in Delhi-NCR region. Tables
                                                                         Wind Speed(WS)            0.23-6.24             0.69 0.37
[1, 2, 3, 4] show the range of values for different parameters in        Ozone                     1.66-186.68           51.60 30.84
our dataset between 1 January,2019 and 10 December, 2020 for             Sulphur Dioxide(SO2)      0.52-78.14            10.12 7.81
different monitoring stations. We find the monitoring station            Carbon Monoxide(CO)       0.0-7.54              0.90
at Bawana records the highest range of values and mean for               PM2.5                     9.17-948.29           111.29 98.01
PM2.5 concentration as compared to other monitoring stations.
                                                                                      Table 3: Details about features for DTU.

 Parameter                   Range(Min-            Mean and std
                             Max)
 PM10                        14.19-939.30          238.95 158.72
 Benzene                     0-30.82               3.86 3.41
 Toluene                     0-450.98              32.06 40.87
 Ammonia Gas(NH3)            0.10-136.30           44.78 23.78
 Nitric Acid(NO)             0.3-490.90            80.60 78.38
 Nitrous Oxide(NO2)          0.43-360.51           74.19 41.04
 Nitrogen Oxides(NOx)        0.13-472.48           107.19 80.08
 Wind Speed(WS)              0.3-4.43              0.86 0.68
 Ozone                       1.42-180.38           36.15 26.34
 Sulphur Dioxide(SO2)        0.50-94.36            13.57 9.50
 Carbon Monoxide(CO)         0.01-7.21             2.14 1.10
 PM2.5                       6.93-936.33           116.83 106.76

             Table 1: Details about features for Anand Vihar.
                                                                         Parameter                 Range                 Mean and std
                                                                         PM10                      50.00-994.00          211.11 137.77
                                                                         Benzene                   0.12-22.54            4.43 3.52
                                                                         Toluene                   3.17-340.20           44.48 42.43
                                                                         Ammonia Gas(NH3)          4.40-206.48           33.80 22.55
                                                                         Nitric Acid(NO)           0.38-440.74           18.19 37.06
 Parameter                   Range                 Mean and std          Nitrous Oxide(NO2)        0.20-130.12           33.49 19.25
 PM10                        6.88-941.00           227.86 146.87         Nitrogen Oxides(NOx)      4.29-428.66           32.73 35.49
 Benzene                     0.1-0.43              0.26 0.01             Wind Speed(WS)            0.20-15.0             1.69 1.35
 Toluene                     1.0-354.83            137.58 26.89          Ozone                     0.31-180.5            39.63 29.00
 Ammonia Gas(NH3)            0.03-127.2            36.45 15.99           Sulphur Dioxide(SO2)      2.08-108.51           22.14 11.63
 Nitric Acid(NO)             0.27-180.95           10.28 18.56           Carbon Monoxide(CO)       0.0-7.84              1.56 0.97
 Nitrous Oxide(NO2)          5.37-230.82           39.91 25.83           PM2.5                     3.54 907.00           109.69 104.16
 Nitrogen Oxides(NOx)        4.32-184.36           29.62 24.63
 Wind Speed(WS)              0.3-4.11              1.18 0.55                       Table 4: Details about features for Vivek Vihar.
 Ozone                       0.1-170.25            44.81 35.06
 Sulphur Dioxide(SO2)        0.56-58.02            12.76 8.29
 Carbon Monoxide(CO)         0.0-6.90              1.22 0.80
 PM2.5                       10.73- 994.00         123.37 109.30

               Table 2: Details about features for Bawana.

                                                                     4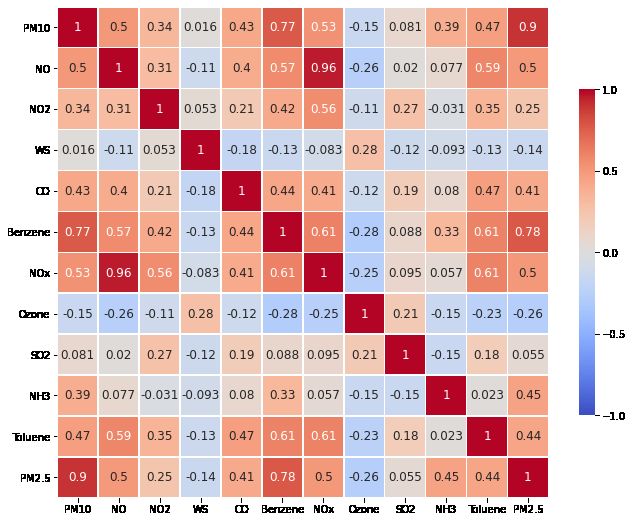
Figure 1: Framework diagram for selected monitoring base stations and selected pollutants showing the data collection from base stations, pre-processing and
feeding of pre-processed data into the deep learning models for predicting PM2.5 values with uncertainty. We use three deep learning models that include, LSTM,
BD-LSTM and ED-LSTM for multivariate and univariate models as shown.

3.2. LSTM network models                                                          RNNs are simply two independent RNNs together in a structure
   Recurrent Neural Networks (RNNs) are a class of artificial                     that allows the networks to have both backward and forward
neural networks which gained a lot of popularity in recent years.                 information about the sequence at every time step.
The Elman RNN [31, 88] is one of the earliest architectures and                      The combination of bidirectional RNNs with LSTM model
considered a prominent example of simple recurrent networks                       gives us bidirectional LSTM model (BD-LSTM), which have
trained by back-propagation through-time (BPTT) algorithm                         the ability to access long-range context in both input direc-
[32]. In the early days, there was much research for model-                       tions [95]. BD-LSTM are designed for specific input sequences
ing dynamic systems using simple RNNs and it was shown that                       whose starting and ending are known beforehand. They take
RNNs perform better than feed-forward networks in knowledge                       both the future and past states of each element of a sequence
representation tasks [89, 90, 91].                                                into consideration where one LSTM processes the information
   Backpropagation through time (BPTT) [32] features error                        from start to end of the sequence and the other from end to
backpropagation which uses the idea of training RNNs using                        start. Their combined outputs predict the corresponding labels
gradient descent in a way similar to feedforward neural net-                      if available at each time step [30]. This approach differs from
works. The major difference is that the error is back-propagated                  unidirectional approach in a way where information from the
for a deeper network architecture that features states defined by                 future and past LSTM model states combined; hence, it pre-
time; however, BPTT experiences the problems of vanishing                         serves information from both past and future at each time step.
and exploding gradients in case of learning tasks which involve                   BD-LSTM have been prominent in sequence processing prob-
long-term dependencies or deep network architectures. [92].                       lems such as phoneme classification [95], continuous speech
Long Short Term Memory(LSTM) network [33] was developed                           recognition [96], speech synthesis [97] and sentence classifica-
which was capable of overcoming the fundamental problems of                       tion [98].
deep learning [30]. LSTM networks addressed the issue with
much better capabilities in remembering the long-term depen-                      3.4. Encoder-Decoder LSTMs
dencies using memory cells and gates for temporal sequences.
                                                                                     A sequence to sequence model lies behind numerous systems
The memory cells are trained in a supervised fashion using an
                                                                                  which we face on a daily basis [99], and such models aim to
adaptation of the BPTT algorithm that considers the respec-
                                                                                  map a fixed-length input with a fixed-length output, where the
tive gates [33]. More recently, Adam optimiser which features
                                                                                  length of the input and output may differ. In multi-step and mul-
adaptive learning rate has been prominent in training LSTM
                                                                                  tivariate analysis, both the input and output are variable with
models via BPTT [93].
                                                                                  potentially different lengths. This problem is analogous to ma-
                                                                                  chine translation between natural languages, where a sequence
3.3. Bi-directional LSTMs                                                         of words in the input language is translated to a sequence of
   One shortcoming of conventional RNNs is that they are only                     words in the output language. Recently, it has been shown
able to make use of previous context in a sequence to predict                     how to effectively address sequence to sequence problem with
future states. Bidirectional RNNs [94] do this by processing the                  encoder-decoder LSTM networks (ED-LSTM).
data in both directions with two separate hidden layers, which                       ED-LSTM handles variable length inputs and outputs by first
are then feed forwards to the same output layer. Bidirectional                    encoding a given input sequence Xip = (x1 , x2 , ..xn ), one at a
                                                                              5
Figure 2: Diagram showing the conversion of 2-Dimensional(2-D) data to 3-Dimensional(3-D) data using M windows of size N and creation of feature set for both
univariate and multivariate model to give multi-step ahead predictions. For 2-D data, the window is highlighted in blue while the future prediction feature (PM2.5)
is highlighted in pink.

time using a latent vector representation for input of length n                     framework diagram for our experimental setup. We pre-process
and the output is a sequence Y = (y1 , y2 , ..ym ) of length m. In                  the dataset extracted from four different monitoring stations
the encoding stage, ED-LSTM creates a sequence of hidden                            in Delhi (Figure 3 with map adopted from website 2 ) for our
states for input sequence and then in decoding stage it defines                     proposed deep learning framework as shown in Figure 1. Af-
a distribution for output states given the input sequence. The                      ter collecting the data, we fill the missing values of a particu-
main goal of the model is to maximize the conditional proba-                        lar feature by the median of its available neighboring values.
bility P(Y|Xip ) of mapping input sequence to output sequence                       The missing values may be due to inconsistency in recording
while training. ED-LSTM have been previously used in a lot                          the pollutant values at different monitoring stations. In or-
of tasks, some of which include text simplification [100], auto-                    der to train LSTM models, we transform the two-dimensional
matic speech recognition [101] and grapheme to phoneme con-                         (2D) dataset of features and temporal sequences given by time-
version [102].                                                                      interval (eight hours) into a into a three-dimensional (3D) for-
                                                                                    mat [103] by a sliding window technique in which a window of
                                                                                    size N moves over the original 2D dataset of size (r,c); where
                                                                                    r represents the number of rows(features) and c represents the
                                                                                    number of columns in dataframe. This results in M windows fi-
                                                                                    nal dataset with dimensions (M,N,r) which is fed into the mod-
                                                                                    els to give Nout multi-step ahead prediction values as shown
                                                                                    in Figure 2. We break the dataset into a feature set Xi =
                                                                                    (x1 , x2 , x3 ....xr−1 ), i = 1...N for multivariate model and Xi = (xr )
                                                                                    for univariate model and labels Y j = (y1 , y2 , ..., yNout ), j = 1...M
                                                                                    as multi-step ahead predictions. The label value consists of PM
                                                                                    2.5 value and other meteorological values constitutes the fea-
                                                                                    ture vector for multivariate model while for univariate model
                                                                                    past PM2.5 values constitute the feature vector .
                                                                                       Our framework for the respective LSTM models is as fol-
                                                                                    lows. We use N f = 11 features (different pollutant values other
                                                                                    than PM2.5 as shown in Table 1) for our multivariate model
                                                                                    where we consider N = 5 a window that captures the number
                                                                                    of time steps in the past. The window determines how much
                                                                                    the LSTM model will unfold in time and the number of fea-
                                                                                    tures determines the number of input neurons in the respective
                                                                                    LSTM models. We define Nout = 10 as the number of output
Figure 3: Map of Delhi highlighting the location of four monitoring base sta-       neurons in the LSTM model which denotes the number of steps
tions in Delhi. (Note: The map is not to scale. )
                                                                                    ahead to predict PM2.5 concentration. We note that each step
                                                                                    ahead is denoted by 8 hour intervals and hence the respective
                                                                                    models would predict 80 hours ahead. Hence, we use 40 hours
3.5. Framework                                                                      (5 steps) of past information to predict 80 hours (10 steps) of
   The air-pollution dataset for four different monitoring sta-                     future trend of the time series. In the case of univariate model,
tions has been collected from Central Pollution Control Board                       we only use PM2.5 as a feature to predict its future trend and
(CPCB) [87], Government of India 1 . Figure 1 shows the                             hence, the respective LSTM models will feature 1 input neuron

   1 https://cpcb.nic.in/                                                              2 http://gismaps.in/prod/indiabasemaps/Delhi/Delhi.html

                                                                                6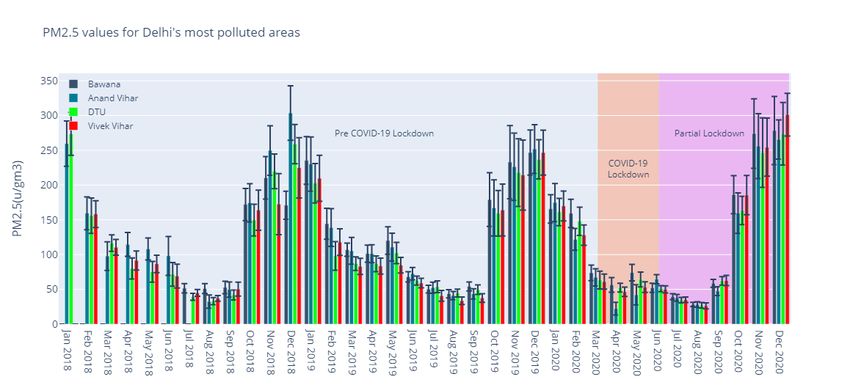
and 10 output neurons.                                                  COVID-19 lockdown. We test the model on respective months
                                                                        for 2020 which corresponds to the COVID-19 lockdown and
                                                                        partial lockdown periods, in this case we use 50 epoch of train-
4. Experiments and Results
                                                                        ing with our best LSTM model. Second, we use a univariate
   In our experiments, we compare the performance of three              time-series approach for multi-step ahead prediction of PM2.5
LSTM models as presented earlier for univariate and multivari-          values and test the performance using our best model. In this
ate prediction models. We first analyse the impact of COVID-            case, we use 1000 epochs of training with our best LSTM
19 lock-downs on the air quality and then evaluate the different        model. In all our experimental setup using different LSTM
models for multi-step ahead prediction of air quality (PM2.5).          models and FNN, we further split the test dataset into validation
Our experiments consider different data setup that features data        dataset for tuning the model during trial experiments and test
before and after COVID-19 in order to evaluate the effect on air        our model on the remaining portion for evaluating the models,
quality and model accuracy.                                             we split the test dataset in the ratio 1:1 for for all our respective
                                                                        experiments.
4.1. Experiment setup                                                      The prediction performance is measured by root mean
                                                                        squared error (RMSE) as follows
  The visualisations and experiments are organised as follows.
                                                                                                      v
                                                                                                      u
                                                                                                             N
                                                                                                      t
  • Provide analysis of concentration of PM2.5 for different                                              1 X
                                                                                           RMS E =              (yi − ŷi )2
    monitoring stations and for different time intervals includ-                                          N i=1
    ing the COVID-19 lockdown;
                                                                        where, yi and ŷi are the actual value and the predicted value,
  • Compare the performance of the three LSTM network                   respectively. N refers to the total length of the data. We report
    models using Adam optimizer;                                        the RMSE for different horizons and also the mean RMSE for
  • Create training data with different strategies, that includes       all prediction horizons.
    and exclude COVID-19 time-span and compare the per-                    We conduct 30 independent experimental runs with different
    formance of best LSTM model;                                        weight initialisation in the respective LSTM models and pro-
                                                                        vide mean and standard deviation in all our results.
  • Compare univariate and multivariate approach using the
    best LSTM model;                                                    4.2. Data visualisation
  • Provide one month forecast using best LSTM model                       We first provide data visualisation and analyse the effect of
    with uncertainty quantification with multiple experimen-            COVID-19 on air pollution in Delhi while comparing with pre-
    tal runs.                                                           vious years. Figure 5 presents PM2.5 values of stations in
                                                                        Anand Vihar, Bawana, Delhi Technical University and Vivek
   The technical details of our framework for the respective            Vihar from 1 January 2018 to 10 December 2020 that is used
LSTM models as follows. We considered different number of               as dataset for this study. We find some missing data in the ini-
hidden neurons and other hyper-parameters (such as learning             tial months of 2018 for some stations therefore we consider the
rate) in our trial experiments. We define the topology of differ-       data from 1 January 2019 to 10 December 2020 for building our
ent models in terms of input, hidden layers and output in Table         respective models and strategies. Table 6 presents a summary
5. We use Adam optimizer [93] with batch size of 20 for 200             of the visualisation in Figure 5 where the seasons are quantita-
epochs and rectifier linear unit (ReLu) activation in the hidden        tively highlighted. We observe higher values of PM2.5 value for
layers for the three LSTM models. We also compare our results           the months from October till February on a seasonal basis af-
with FNN which uses Adam optimiser.                                     ter which the value starts to descend starting from the month of
   In the respective experiments, we compare the performance            March. Although we find lower values of PM2.5 during March-
of different models for different time steps by using the train         June every year, we observe a significant decrease for months
data from Jan 2019 to May 2020 (pre-COVID-19 lockdown)                  of interest (March-June 2020), which belongs to the COVID-19
and the test data from June 2020 to Dec 2020 (during and par-           full lockdown period in India when compared to the respective
tial COVID-19 lockdown). We test our models by training with-           months in 2018 and 2019as shown in Table 6 and Figure 5.
out shuffling the time-series data window and also by shuffling         We find a similar decrease of PM2.5 values for all the monitor-
it. Shuffling the data here refers to randomly picking different        ing stations while Bawana records the highest values for 2019
training data windows (regions) comprising of past time steps           and 2020 among other stations. The partial lockdown period
and its corresponding output time steps. Hence, with shuffling,         include the months after June, 2020 as highlighted in Figure 5.
the training data would feature peak and off-peak regions of               Figure 4 shows Pearson’s correlation heatmaps for different
COVID-19 as different weeks can be featured in training data            features in our dataset for different monitoring stations. Higher
rather than taking consecutive weeks.                                   positive values of Pearson’s correlation between two particu-
   Furthermore, we test the best model in two different ways,           lar feature indicates a high positive dependence between them
first by training it on a seasonal data comprising of observa-          while a higher negative value indicates a high negative depen-
tions from February to September in 2019 which excludes the             dence between them and the values closer to zero indicates
                                                                    7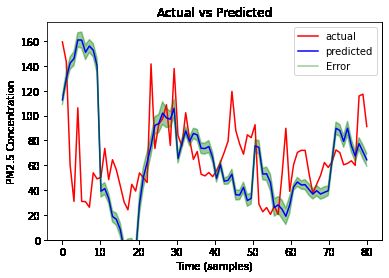
Input Dimension        Hidden Layers        Output      Comments
        FNN           N × N f = 55           2                    10          Hidden Layer sizes (h1 , h2 )= (64,32)
        LSTM          (N, N f ) = (5, 11)    1                    10          Hidden Layer of 50 cells.
        BD-LSTM       (N, N f ) = (5, 11)    1                    10          Forward and Backward layer of 50 Cells each.
        ED-LSTM       (N, N f ) = (5, 11)    4                    10          Two LSTM layers of 50 cells each, Repeat Vector and a Time
                                                                              distributed layer

                                                   Table 5: Topology of different deep learning models.

            (a) Feature correlation heatmap for Anand Vihar.                                      (b) Feature correlation heatmap for Bawana.

               (c) Feature correlation heatmap for DTU.                                         (d) Feature correlation heatmap for Vivek Vihar.

                 Figure 4: Correlation via heat-map for different features in the data collected from different monitoring stations in Delhi.

more independent feature sets. Higher positive correlation val-                   dependence. We also observe high positive correlation values
ues are represented as dark brown panels while higher nega-                       between PM2.5 and PM10 for all the monitoring stations which
tive correlation values are represented as dark blue panels in                    also indicates a good amount of correlation.
different correlation heatmaps. We observe higher correlation
values of NOx with NO and NO2 also which is expected be-
cause they are nitrogenous pollutants and show higher positive

                                                                              8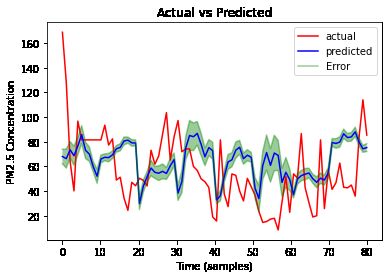
Figure 5: PM2.5 values of Anand Vihar, Bawana, Delhi Technical University, and Wazirpur from 1 Jan 2018 to 10 Dec 2020.

    Table 6: Mean with +/- 95% confidence interval for PM2.5 concentrations for March-June for three consecutive years over different monitoring stations.

                          Time Interval     PM2.5(Bawana)       PM2.5(Anand Vihar)       PM2.5(Vivek Vihar)     PM2.5(DTU)
                                            [mean, interval]    [mean, interval]         [mean, interval]       [mean,interval]
                          Mar-Jun(2018)     --                  104.59 10.47             89.55 7.39             85.98 8.05
                          Mar-Jun(2019)     99.38 7.41          97.62 8.48               77.65 5.59             84.81 6.13
                          Mar-Jun(2020)     64.31 5.44          49.11 6.45               52.78 4.08             57.94 4.74

4.3. Results: Modelling and Forecasting                                            confidence interval using 30 experimental runs. Note that lower
   We report the train and test performance (RMSE) mean and                        value of RMSE indicates better performance. We find that the
(±) 95% interval of the RMSE for different prediction horizons                     prediction RMSE in general increases across prediction hori-
for each model from 30 experimental runs. Table 6 shows the                        zons for all the models which is also natural as we use a speci-
mean and (±) 95% confidence interval for PM2.5 concentra-                          fied window size as input to predict the multi-step ahead values
tion for different monitoring stations for the months March to                     and the results deteriorate as the gap in the missing values in-
June in the years 2018, 2019 and 2020. We selected this par-                       creases with increasing prediction horizon. In Figure 6(b) and
ticular interval of months to show a comparison of PM2.5 con-                      Table 7, we find that the multivariate BD-LSTM performs the
centration in consecutive years for these COVID-19 lockdown                        best on train dataset generalizes well with test performance. We
months. We observe a significant decrease in PM2.5 concentra-                      find that ED-LSTM is the worst performer in this case with
tion in 2020 for all monitoring stations as compared to 2019 as a                  highest RMSE on both train and test dataset in comparison to
consequence of COVID-19 lockdown. In our first set of exper-                       other models. In Figure 6(a) and Table 7, we observe that mul-
iments, we compare the performance of different multivariate                       tivariate BD-LSTM generally has the best performance which
LSTM models (LSTM, ED-LSTM and BD-LSTM) where all                                  significantly improved for step sizes 6-10 when compared to
the models are trained using Adam Optimizer using the dataset                      other models.
collected from the monitoring station at Anand Vihar. We also                         Since all the monitoring stations belong to Delhi region, we
show results with canonical feedforward neural network (FNN-                       use the model which performs the best on dataset from Anand
Adam) with Adam optimiser. We also show results for case                           Vihar to analyse the performance on the dataset from other sta-
of shuffling the training data (BD-LSTM*), univariate (UBD-                        tions namely, Bawana, DTU and Vivek Vihar. Taking into ac-
LSTM) and seasonal (SBD-LSTM) at Anand Vihar. Note that                            count the results for Anand Vihar, we consider BD-LSTM as
all LSTM models are multivariate except for UBD-LSTM.                              our best model, and further apply it other monitoring stations.
   Figure 6(a) shows the prediction horizon RMSE for 10 step                       We also consider different strategies with BD-LSTM to train
ahead prediction, and Figure 6(b) shows the mean RMSE for                          and analyse the performance on dataset from different moni-
entire train and test datasets for Anand Vihar using different                     toring stations which includes shuffling the input window when
LSTM models. We show bar plots with mean and (±) 95%                               training BD-LSTM model (BD-LSTM*), univariate time-series
                                                                               9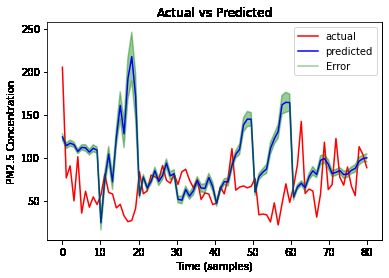
analysis using BD-LSTM model (UBD-LSTM) and training the
                                                                                    BD-LSTM model using seasonal data (SBD-LSTM).
                                                                                       In Figure 7(a) and Table 7 results for Anand Vihar, we find
                                                                                    that BD-LSTM performs better on train dataset in comparison
                                                                                    to BD-LSTM* with almost similar performance on test dataset
                                                                                    while UBD-LSTM has highest RMSE on both train and test
                                                                                    dataset with highest confidence interval(error) of prediction.
                                                                                    In Figure 7(b) and Table 8 results for Bawana, we find that
                                                                                    BD-LSTM performs the best on train dataset in comparison
                                                                                    to BD-LSTM* and UBD-LSTM while BD-LSTM* performs
                                                                                    the best on test dataset amongst them. We find a similar trend
                                                                                    as Anand Vihar for UBD-LSTM with highest RMSE on both
                                                                                    train and test dataset and highest confidence interval of predic-
                                                                                    tion. In Figure 7(c) and Table 9 results for DTU, we find that
                                                                                    UBD-LSTM performs better than BD-LSTM and BD-LSTM*
                                                                                    on train dataset while BD-LSTM* performs the best on test
                                                                                    dataset among these three, we observe a similar trend for UBD-
                                                                                    LSTM with highest confidence of prediction on both train and
                                                                                    test dataset. In Figure 7(d) and Table 10 results for Vivek Vihar,
                                                                                    we find that BD-LSTM* performs the best on train dataset in
                                                                                    comparsion to BD-LSTM and UBD-LSTM, while BD-LSTM
                                                                                    performs the best on test dataset among them. UBD-LSTM has
                                                                                    the worst performance on both train and test dataset with largest
                                                                                    confidence interval for the predictions.
                                                                                       In the seasonal model for the monitoring stations (SBD-
             (a) RMSE for different prediction horizons for Anand Vihar.
                                                                                    LSTM), we find least RMSE for both train and test dataset with
                                                                                    better performance on test dataset for Anand Vihar, Bawana
                                                                                    and DTU. For Vivek Vihar, we find that SBD-LSTM performs
                                                                                    the best on train dataset but it does not generalise well on test
                                                                                    dataset. We next evaluate the performance of SBD-LSTM in
                                                                                    the same plot for other models (BD-LSTM, BD-LSTM*,UBD-
                                                                                    LSTM). We cannot make a direct comparison between SBD-
                                                                                    LSTM and other models in terms of prediction accuracy, since
                                                                                    SBD-LSTM uses a subset of initial data (February-September,
                                                                                    2019) with lower range of PM2.5 values for these months as
                                                                                    shown in Figure 5.
                                                                                       Figure 8 provides a long-term (one month ahead) forecast
                                                                                    (11th December 2020 to 9th January 2021) of PM2.5 concentra-
                                                                                    tion values for different monitoring stations using UBD-LSTM
                                                                                    model. The plots provide mean and (±) 95% confidence inter-
                                                                                    val as uncertainty in predicted values for 30 experimental runs
                                                                                    for 8 hours interval for each day, covering a total of 720 hours
                (b) RMSE for different models for Anand Vihar.
                                                                                    for the entire month. Figure 9 shows a comparison between ac-
                                                                                    tual and predicted values of PM2.5 concentration for September
Figure 6: Performance evaluation of respective methods for Anand Vihar (mean        2020 in terms of mean and (±) 95% confidence interval in pre-
RMSE with (±) 95% confidence interval of 30 experimental runs as uncertainty        dicted values for 30 experimental runs for different monitoring
given by error bar).                                                                stations using SBD-LSTM model.

                                                                                    5. Discussion
                                                                                       In the respective experiments, we evaluated the performance
                                                                                    of different models on the time-series problem and studied the
                                                                                    effect of COVID-19 lockdown on prediction performance of
                                                                                    different models for different seasons. We find that BD-LSTM
                                                                                    is our best performer in terms of both train and test performance
                                                                                    with better generalization when compared to other LSTM based
                                                                                    models for Anand Vihar. This could be due to the BD-LSTM
                                                                               10
FNN-Adam LSTM ED-LSTM BD-LSTM BD-LSTM* UBD-LSTM SBD-LSTM
Train 1939.38± 30.79 2017.92± 33.34 2101.77± 34.16 1797.43± 32.68 1840.42± 28.45 2178.68± 76.78 1545.79± 34.30
Test 1821.29± 37.45 1797.96± 37.64 1871.46± 37.17 1808.26± 34.04 1810.86± 36.21 1822.95± 65.80 1477.35± 39.34
Step-1 1177.20± 21.02 1152.12± 19.25 1195.88± 26.43 1153.02± 22.00 1130.93± 19.09 317.40± 28.01 843.21± 27.57
Step-2 1397.96± 32.76 1390.28± 26.98 1512.29± 36.34 1494.42± 39.38 1504.22± 50.99 1451.15± 58.28 1034.96± 25.71
Step-3 1620.34± 37.52 1615.66± 39.30 1695.36± 37.67 1731.97± 49.72 1718.83± 56.19 1690.91± 71.69 1283.02± 51.79
Step-4 1782.44± 36.65 1713.78± 32.38 1810.73± 41.03 1776.68± 47.31 1736.79± 40.89 1863.03± 67.08 1425.18± 68.46
Step-5 1873.96± 42.76 1812.06± 31.15 1925.16± 41.85 1815.68± 25.61 1806.75± 46.08 2010.27± 62.85 1508.44± 67.65
Step-6 1956.12± 38.44 1923.46± 39.53 2000.59± 46.58 1894.14± 25.17 1894.19± 42.10 2205.94± 63.72 1675.28± 73.59
Step-7 2053.13± 41.38 2001.73± 41.10 2079.05± 46.45 1971.98± 32.10 1983.71± 43.13 2223.07± 65.43 1685.23± 56.25
Step 8 2064.14± 41.96 2069.54± 36.31 2128.60± 45.86 2020.71± 39.29 2054.23± 45.53 2174.59± 44.03 1718.71± 46.06
Step 9 2140.37± 46.04 2146.61± 45.23 2170.13± 45.64 2093.84± 35.45 2149.13± 37.42 2174.37± 59.44 1827.85± 48.45
Step 10 2147.23± 43.46 2154.41± 44.34 2196.85± 43.78 2130.20± 40.49 2129.89± 32.62 2118.77± 65.65 1771.62± 41.05
Table 7: Performance by RMSE (mean) and 95 % confidence interval(±) of 30 experimental runs for Anand Vihar.
BD-LSTM BD-LSTM* UBD-LSTM SBD-LSTM
Train 1949.35±31.17 2027.01±33.72 2081.15± 74.34 1708.78± 35.58
Test 1833.16±43.64 1732.85±40.63 1842.50± 71.36 1281.22± 35.57
Step-1 1100.56±26.64 1017.65±22.34 297.75± 25.75 683.00±29.18
Step-2 1385.24±37.23 1253.59±27.32 1297.76± 36.08 937.01±23.71
Step-3 1651.61±41.44 1534.16±24.59 1591.85± 40.72 1095.53± 36.70
Step-4 1721.90±37.51 1659.84±29.50 1834.38± 38.84 1173.04± 33.13
Step-5 1875.45±38.82 1835.25±25.71 2163.71± 52.14 1249.93± 38.67
Step-6 1919.22±45.39 1880.20±26.49 2323.89±63.87 1384.16± 37.51
Step-7 2027.93±60.23 1941.07±32.05 2479.18± 71.26 1465.01± 34.17
Step 8 2160.84±67.78 2040.73±42.58 2252.38± 61.94 1538.47± 35.68
Step 9 2235.11±72.46 2075.96±44.83 2112.08±49.15 1618.90± 32.90
Step 10 2253.73±70.02 2090.06±47.47 2072.01±43.98 1667.10±37.50
Table 8: Performance by RMSE (mean) and 95 % confidence interval(±) of 30 experimental runs using different BD-LSTM models for Bawana.
BD-LSTM BD-LSTM* UBD-LSTM SBD-LSTM
Train 1894.97±35.20 1867.04±34.88 1837.32±63.35 1394.28± 25.60
Test 1707.09±34.12 1655.13±34.73 1871.76± 68.03 1346.61±41.85
Step-1 1082.65±35.59 990.05±24.93 376.30± 46.39 661.50±26.35
Step-2 1412.94±37.73 1312.39±28.11 1368.83± 51.53 1009.89±22.47
Step-3 1595.74± 42.79 1541.37±36.48 1890.12± 98.02 1164.77± 26.02
Step-4 1702.60±51.73 1616.10±36.87 2030.47± 92.59 1165.97± 26.92
Step-5 1804.52±52.03 1728.34±42.14 2224.31± 92.41 1414.22± 42.56
Step-6 1841.11±57.09 1788.62±41.66 2272.49± 102.77 1462.59± 45.03
Step-7 1894.75±75.12 1816.18±38.03 2236.76± 90.09 1411.73± 54.63
Step 8 1946.97± 70.98 1929.45±41.18 2143.55±67.55 1743.37± 83.88
Step 9 1910.16±56.44 1953.05±36.84 2165.78± 79.03 1786.94±94.11
Step 10 1879.49±47.86 1875.75±37.62 2008.97± 57.63 1645.09±86.99
Table 9: RMSE (mean) and 95 % confidence interval(±) of 30 experimental runs using different BD-LSTM models for DTU.
11(a) RMSE(mean) with error bar for Anand Vihar. (b) RMSE(mean) with error bar for Bawana.
(c) RMSE(mean) with error bar for DTU. (d) RMSE(mean) with error bar for Vivek Vihar.
Figure 7: Performance by RMSE (mean) with (±) 95% confidence interval as error bar across 10 prediction horizons of 30 experimental runs using respective
BD-LSTM models. We show results for train and test datasets collected from different monitoring stations in Delhi.
architecture which features both forward and backward infor- ate models which uses a set of features as input that helps with
mation for a sequence at each time-step using two LSTM layers additional information for predicting future steps. The seasonal
[95]. We find that BD-LSTM performs the best for larger time model (SBD-LSTM) performs slightly better on test dataset for
steps (6-10) with better generalization as compared to other Anand Vihar, Bawana and DTU along with good generaliza-
models which indicates that BD-LSTM captures better infor- tion performance which indicates that the model is robust to the
mation for long-term ahead prediction. This could be due to effects of COVID-19 lockdown period. It is important to eval-
the combination of memory cells with two LSTM layers which uate the effect on performance of different models due to sea-
are able to capture salient features in a temporal sequence when sonal decrease of PM2.5 values during COVID-19 lockdown
compared to canonical LSTM models. Although BD-LSTM period when compared to previous years. We find that different
based models have been mainly used for different language LSTM models with different training strategies are quite robust
modelling, we find them promising for long-term time-series in modeling the effects of COVOD-19 lockdown for both dur-
prediction problems. ing and partial lockdown periods.
In the respective experiments, we also found that BD-LSTM Recent focus has been on studying effects of the lock downs
and BD-LSTM* perform well in predicting future PM2.5 val- imposed in different cities of India on the spatial patterns of air
ues for different monitoring stations which indicates that they quality both during pre-lockdown and during-lockdown phases.
are not affected much due to COVID-19 lockdown phase. The results have demonstrated a direct implication towards the
UBD-LSTM has the highest RMSE and confidence interval for decrease in the concentration of selected pollutants such as
test datasets which indicates that it is not robust. The poor per- PM2.5 and PM10, with maximum decrease(more than 50%)
formance which could be due to the fact that UBD-LSTM uses in comparison to the pre-lockdown phase [104]. There has
only one features to predict future steps in contrast to multivari- also been a significant decrease in the concentration of Nitro-
12BD-LSTM BD-LSTM* UBD-LSTM SBD-LSTM
Train 1820.40±41.58 1779.95±33.98 1994.93± 69.00 1434.41±31.50
Test 1643.59±40.90 1696.24±42.56 1742.39±59.96 1706.87± 55.33
Step-1 782.12± 14.33 792.82± 12.90 302.54±23.65 775.95±21.48
Step-2 1352.21±28.23 1392.97±24.17 1461.58± 34.56 1139.47± 32.01
Step-3 1548.57±32.00 1612.39±34.50 1640.58± 37.38 1398.11± 54.94
Step-4 1618.60±26.98 1643.44±31.46 1847.20± 53.83 1493.66± 47.42
Step-5 1689.86±31.89 1764.74±31.53 2012.07±57.44 1785.54± 53.64
Step-6 1752.82±27.40 1844.85±43.18 2038.00± 47.06 1936.81± 61.08
Step-7 1775.63±40.77 1881.67±50.28 2054.06±41.14 2013.61± 62.70
Step 8 1920.66±53.87 2002.18±56.76 2058.89± 41.50 2180.80±66.23
Step 9 2010.76±52.36 2061.93±56.88 2019.43± 34.69 2251.07± 68.98
Step 10 1984.70±47.81 1965.43±50.60 1989.56± 40.73 2093.66± 63.69
Table 10: RMSE (mean) and 95 % confidence interval(±) of 30 experimental runs using different BD-LSTM models for Vivek Vihar.
gen Dioxide(NO2) which has been a major pollutant in reputed in relation to forest fires around the world.
cities of India such as Delhi and Mumbai [105]. There is a
positive correlation between PM2.5 concentration and COVID-
19 for countries such as India and Pakistan [106]. Apart from 6. Conclusion and Future Work
the major air pollutants, there has been a significant decrease
In this paper, we applied deep learning via different LSTM
in aerosol optical depth (AOD) and lightning activities in many
models for univariate and multivariate modelling for short-term
urban and mining regions of India [107, 108].
and long term air quality prediction taking into account the four
There is a large effort by the Indian government to move to- base-stations from Delhi, India. Although we selected a subset
wards clean energy with a massive investment in solar and wind of the base stations, the methodology can be applied to rest of
energy which can have benefits [109, 110]. Moreover, India the base stations in Delhi or in other parts of the world. Our re-
also has plans to go fully electric in the transportation sector by sults show that multivariate bi-directional LSTM model shows
2030 [111]. Currently, India has began manufacturing electric best performance, and rest of the LSTM models have certain
vehicles with plans to have fully electric rail network by 2024 strengths and limitations which need to be evaluated prior to
[112]. Renewable energy is expected to rise from 27 % of total developing a system that provides rigours uncertainty quantifi-
energy demand in 2014 to around 43 % by 2040 [113]. In many cation in predictions. We also found that COVID-19 had a
developing countries, it is clear that an increase of population significant effect on the air quality during full lockdown im-
density increases the air pollution; however, this can change plemented for few months and afterwards, there was unprece-
with type of energy used. In a recent study, in the case of China, dented growth of poor air quality which has a seasonal effect as
it has been shown that the increase in population density will compared to previous years. We provide open source software
reduces air pollution which has been due to clean energy and framework and open data which can be used for further verifica-
public transportation [114]. A study on the effects of meteoro- tion and also application for studying or developing prediction
logical conditions and air pollution on COVID-19 transmission models in other places.
from 219 Chinese cities found that air pollution indicators were
positively correlated with new confirmed cases and increase in
cases were linked with air-quality index [115]. Such study in 7. Software and Data
case of India would be needed and prediction of air-quality in-
dicators could help in preventative measures. We provide Python based open source implementation along
with the data for different experiments and design of respective
In future work, Bayesian deep learning methods can be
method for further research 3 .
used to provide robust uncertainty quantification in predictions
which can extend Bayesian neural networks used for time series
prediction [116]. Other learning strategies such as multi-task References
and transfer learning in conjunction with Bayesian inference
can be used to develop improved models [117, 118] which can [1] H. R. Max Roser and E. Ortiz-Ospina, “World population growth,”
Our World in Data, 2013, https://ourworldindata.org/world-population-
take into account existing deep learning models for COVID-19 growth.
infections in India [119]. Moreover, we envision the application [2] U. Desa, “United nations department of economic and social affairs,
of the proposed framework in other parts of India and rest of the population division. world population prospects: The 2015 revision, key
world which has decline in air quality. A web-based framework findings and advance tables,” in Technical Report: Working Paper No.
ESA/P/WP. 241, 2015.
can be implemented by the respective authorities that can be
used to provide proper weekly and monthly planning, which
could involve the way traffic is managed for different seasons. 3 https://github.com/sydney-machine-learning/
The methodology can also be extended for air quality prediction airpollution_deeplearning
13(a) PM2.5 Concentration prediction for next one month for Anand Vihar. (b) PM2.5 Concentration prediction for next one month for Bawana.
(c) PM2.5 Concentration prediction for next one month for DTU. (d) PM2.5 Concentration prediction for next one month for Vivek Vihar.
Figure 8: PM2.5 Concentration prediction with Mean and (±) 95% confidence interval as error for next one month using UBD-LSTM model for different monitoring
stations.
[3] P. J. Taylor and B. Derudder, World city network: a global urban analy- contribution of outdoor air pollution sources to premature mortality on a
sis. Routledge, 2004. global scale,” Nature, vol. 525, no. 7569, pp. 367–371, 2015.
[4] WHO, “Air pollution levels rising in many of the world’s poorest cities,” [12] “Unique identification authority of India,” May 2020, [Online;
2016. accessed 16-July-2020]. [Online]. Available: https://uidai.gov.in/
[5] UNEP, “Status of fuel quality and vehicle emission standards latin amer- images/state-wise-aadhaar-saturation.pdf
ica,” 2016. [13] “6 of the world’s 10 most polluted cities are in In-
[6] S. L. Harlan and D. M. Ruddell, “Climate change and health in cities: dia,” August 2020, [Online; accessed 22-August-2020].
impacts of heat and air pollution and potential co-benefits from mitiga- [Online]. Available: https://www.weforum.org/agenda/2020/03/
tion and adaptation,” Current Opinion in Environmental Sustainability, 6-of-the-world-s-10-most-polluted-cities-are-in-india/
vol. 3, no. 3, pp. 126–134, 2011. [14] “7 million premature deaths annually linked to air pollution,”
[7] P. Gupta, S. A. Christopher, J. Wang, R. Gehrig, Y. Lee, and N. Kumar, August 2020, [Online; accessed 22-August-2020]. [Online]. Available:
“Satellite remote sensing of particulate matter and air quality assessment https://www.who.int/mediacentre/news/releases/2014/air-pollution/en/
over global cities,” Atmospheric Environment, vol. 40, no. 30, pp. 5880– [15] J. S. Apte, M. Brauer, A. J. Cohen, M. Ezzati, and C. A. Pope III, “Ambi-
5892, 2006. ent pm2. 5 reduces global and regional life expectancy,” Environmental
[8] Y.-L. Zhang and F. Cao, “Fine particulate matter (pm 2.5) in china at a Science & Technology Letters, vol. 5, no. 9, pp. 546–551, 2018.
city level,” Scientific reports, vol. 5, p. 14884, 2015. [16] D. H. Cusworth, L. J. Mickley, M. P. Sulprizio, T. Liu, M. E. Marlier,
[9] C. Liu, P.-C. Hsu, H.-W. Lee, M. Ye, G. Zheng, N. Liu, W. Li, and R. S. DeFries, S. K. Guttikunda, and P. Gupta, “Quantifying the influ-
Y. Cui, “Transparent air filter for high-efficiency pm 2.5 capture,” Nature ence of agricultural fires in northwest india on urban air pollution in
communications, vol. 6, no. 1, pp. 1–9, 2015. delhi, india,” Environmental Research Letters, vol. 13, no. 4, p. 044018,
[10] M. Franklin, A. Zeka, and J. Schwartz, “Association between pm 2.5 and 2018.
all-cause and specific-cause mortality in 27 us communities,” Journal of [17] W. Hogland and J. Stenis, “Assessment and system analysis of industrial
exposure science & environmental epidemiology, vol. 17, no. 3, pp. 279– waste management,” Waste Management, vol. 20, no. 7, pp. 537–543,
287, 2007. 2000.
[11] J. Lelieveld, J. S. Evans, M. Fnais, D. Giannadaki, and A. Pozzer, “The [18] V.-D. Le, T.-C. Bui, and S.-K. Cha, “Spatiotemporal deep learning
14You can also read