Addressing Greenhouse Gas Emissions from Business-Related Air Travel at Public Institutions: A Case Study of the University of British Columbia ...
←
→
Page content transcription
If your browser does not render page correctly, please read the page content below
Addressing Greenhouse Gas Emissions from
 Business-Related Air Travel at Public Institutions:
A Case Study of the University of British Columbia

                        July 2018

             Seth Wynes, Simon D. Donner
                  Department of Geography
                 University of British Columbia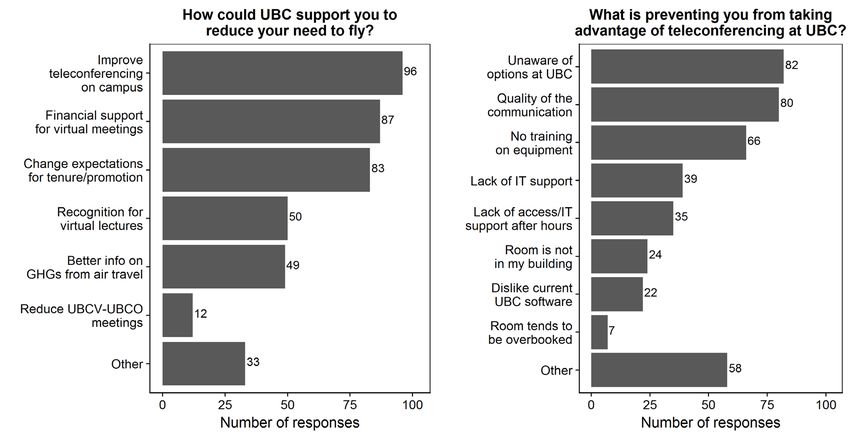
The Pacific Institute for Climate Solutions gratefully acknowledges the generous endow-
ment provided by the Province of British Columbia through the Ministry of Environment in
2008. This funding is enabling ongoing independent research aimed at developing innova-
tive climate change solutions, opportunities for adaptation, and steps toward achieving a
vibrant low-carbon economy.

PACIFIC INSTITUTE FOR CLIMATE SOLUTIONS
University of Victoria
PO Box 1700 STN CSC
Victoria, BC V8W 2Y2

Phone 250-853-3595
Fax 250-853-3597
E-mail pics@uvic.ca
Web pics.uvic.ca

Cover image source: Piper (flickr)
Pacific Institute for Climate Solutions

 TABLE OF CONTENTS

EXECUTIVE SUMMARY                                                                           4
1. INTRODUCTION                                                                             5
2. METHODS                                                                                  7
  2.1 Collecting Data from Travel Requisition (TR) Forms                                    7
  2.2 Emissions Calculator                                                                  8
  2.3 Survey on Air Travel Attitudes Among UBC Faculty                                      9
  2.4 Interviews                                                                            9
3. RESULTS                                                                                 9
    3.1 Drivers of Business-Related Air Travel Emissions                                  10
    3.2 Tests of Mitigation Measures                                                      12
    		 1. Requiring only economy class tickets                                            13
  		 Box A: Costs and benefits of different flight bookings                               13
         2. Reducing travel for lectures                                                  13
    		 3. Reducing brief, long distance travel                                            14
       Box B: UBC to UBC-Okanagan travel                                                  14
          4. Reducing single day return flights                                           14
          5. Choosing direct flights                                                      14
    3.3 Survey on Air Travel Attitudes                                                    15
4. CHALLENGES AND OPPORTUNITIES: INFORMATION AND
  COMMUNICATIONS TECHNOLOGY (ICT)                                                         17
  4.1 Information and Communications Technology at UBC                                    18
    Box C: ICT at UBC Medicine                                                            18
  4.2 Available and Emerging Technologies                                                 19
5. SUMMARY AND RECOMMENDATIONS                                                            20
   1: Implement a process for tracking air travel emissions into the financial
     management system                                                                    21
   2: Integrate a central information and communications technology strategy into
     climate action planning                                                              21
   3: Target easy, cost-saving actions, including requiring economy-class travel          22
   4: Develop a behavioural incentives program                                            23
   5: Consider employing offsets only if locally-based                                    24
ACKNOWLEDGEMENTS                                                                          25
REFERENCES                                                                                25
APPENDIX A: ROADMAP FOR ACTION ON BUSINESS-RELATED AIR
 TRAVEL EMISSIONS                                                                         27

                                                                                                          3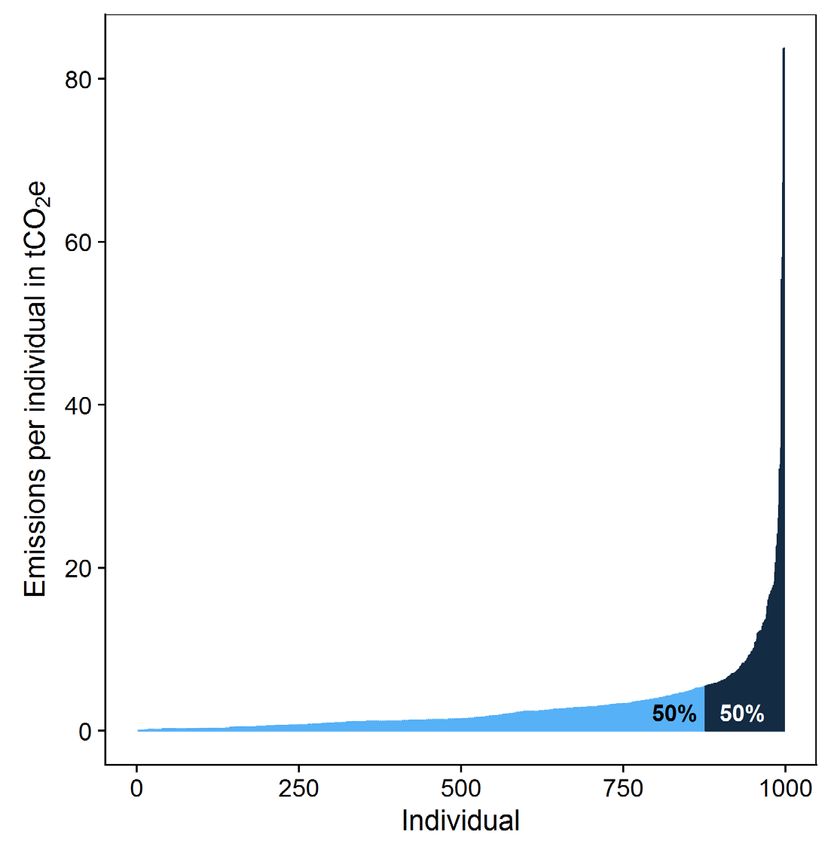
Pacific Institute for Climate Solutions

                 EXECUTIVE SUMMARY
             Aviation is one of the fastest growing sources of greenhouse gas emissions, yet is not addressed
             in most national-, regional-, municipal-, or institutional-level climate action plans. There is
             a tremendous opportunity for leadership in tracking and mitigating aviation emissions from
             business at universities and other public sector institutions. In this paper, we conduct a case study
             of business-related air travel and associated emissions at the Vancouver campus of the University
             of British Columbia (UBC) in order to develop a roadmap for action for UBC as well as other
             academic and public-sector institutions.

             In the case study, we present two analyses of business-related air travel emissions, one based on
             bottom-up data from eight units on campus (997 travellers) and another based on data collected
             by a central travel office via an online booking tool (3807 travellers), as well as a survey of faculty
             attitudes about business-related air travel, and an assessment of mitigation options including
             investment in Information and Communications Technology (ICT). The four key findings are:

             Air travel emissions are significant in relation to other institutional emissions: We estimate
             that business-related air travel emissions at UBC total 26,333- 31,685 tCO2e each year, equivalent
             to 63%-73% of the total annual emissions from the operation of the UBC campus. At a unit-by-
             unit level, emissions from business-related air travel in the Department of Psychology were similar
             to that from heating and providing electricity to the building housing the department. In the case
             of the Department of Geography, which recently switched to a more efficient heating system, the
             business-related air travel emissions were 30 times that of the building.

             A small fraction of people are responsible for the majority of air travel emissions: The flight-
             level data analysis indicates that 50% of emissions are produced by 8-11% of the population,
             depending on the sample. The comprehensive bottom-up analysis of travel data from eight units
             indicates that the majority of trips are short in duration (median length of five nights) and
             the most common purpose of travel is in-person conference attendance (representing 55% of
             emissions).

             Simple, cost-saving measures could lead to immediate emissions reductions: Using the
             bottom-up data from the eight units, we identify four cost-saving measures with the potential to
             collectively reduce emissions from business-related air travel at UBC by almost 12%: requiring
             economy class tickets and using ICT to replace same-day return trips, flights solely for lectures,
             and brief, long distance trips. More comprehensive policies are likely necessary to tackle the other
             88% of business air travel emissions at UBC.

             Improving ICT access is critical to shifting air travel behaviour: In a survey of air travel
             attitudes targeted at faculty members, the most common response to the question, “How could
             UBC support you to reduce your need to fly?” was to improve teleconferencing on campus (46%).
             Current obstacles to teleconferencing included a “lack of awareness of options” (39%) as well
             as “quality of the communication” (38%). The survey also showed that very few respondents
             purchase carbon offsets, citing cost and perceived lack of effectiveness as the primary obstacles.

             Based on the findings of this case study, we developed a five-step roadmap for public sector
             institutions looking to track and address greenhouse gas emissions from business-related air travel:

4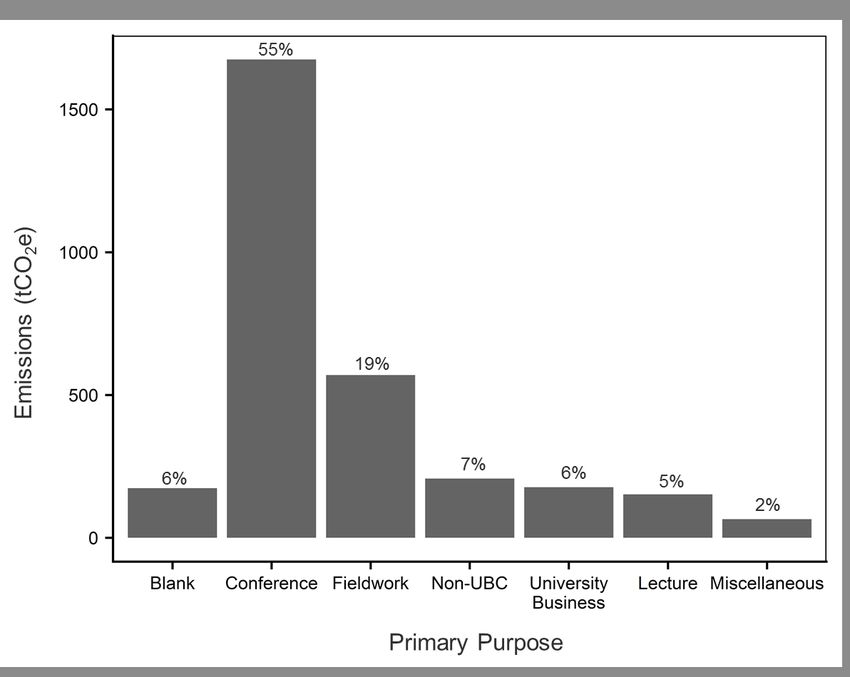
Pacific Institute for Climate Solutions

1) Implement a centralized air travel emissions accounting system that is integrated into the
financial management system

     • Utilize a comprehensive tracking system to monitor mitigation progress
     • Record relevant data as it is reported to avoid time-consuming retroactive date
       collection and reduce burden to staff and administrators
2) Integrate a central ICT strategy into climate action planning

     • Create a campus-wide committee to oversee innovation efforts which might include:
       reviewing and updating software licenses, developing distributed facilities with state
       of the art videoconferencing hardware, and offering matching funds to units or
       organizations that host events with virtual meetings in place of air travel
     • Improve teleconferencing facilities and promote institutions as leaders in developing
       virtual meeting technology and culture
3) Target easy, cost-saving actions, including requiring economy-class travel

     • Choosing a higher class of travel was responsible for 7.8% of emissions in our
       bottom-up sample
     • Addressing the “low hanging fruit” can build momentum towards more
       challenging, longer-term technological and behavioural changes
4) Develop a behavioural incentives program

     • A program integrated with the ICT strategy is necessary to encourage broader shifts
       in institutional culture and individual behaviour surrounding air travel decisions
     • Provide tailored, comparative feedback to travellers and to units on campus, and
       distribute information about how they can reduce their air travel
5) Consider employing offsets only if locally-based

     • Offsets can be part of a mitigation approach but our survey shows that
       understanding and support for offsets is limited
     • Implement a local offset scheme at the institution to increase transparency and
       employee support

   1. INTRODUCTION
“Aviation technology innovations have transformed the way we live. They helped get us to the moon.
Cutting emissions rapidly and making ourselves resilient to climate change is our generation’s moon
landing.” Christiana Figueres (Air Transport Action Group, 2015)

Aviation emissions account for roughly 3.5% of total human-caused warming of the planet
(Lee et al., 2009). These emissions are currently a small fraction of humanity’s contribution
to climate change, but the footprint of the aviation industry is expanding at a pace that could
jeopardize efforts to avoid the 2°C warming limit agreed to under the United Nations Framework
Convention on Climate Change (UNFCCC) (Bows-Larkin and Anderson, 2013).

Although the construction and operation of airport infrastructure and the manufacturing and
maintenance of aircraft all create greenhouse gases, the majority of emissions associated with
aviation comes from burning fuel to operate the aircraft (Chester and Horvath, 2012; Chester

                                                                                                                        5
Pacific Institute for Climate Solutions
and Horvath, 2009). The compounds released during combustion of jet fuel include not only
carbon dioxide (CO2), but also a variety of chemicals that can interact with the atmosphere
in complex ways, including: water vapour, nitrogen oxides, soot, hydrocarbons, and carbon
monoxide (Wuebbles et al., 2007). Some of these particles cause cooling of the atmosphere, while
others cause warming, but the net effect is an increase in radiative forcing, with a large degree of
uncertainty over exactly how much additional warming is caused (Lee et al., 2009).
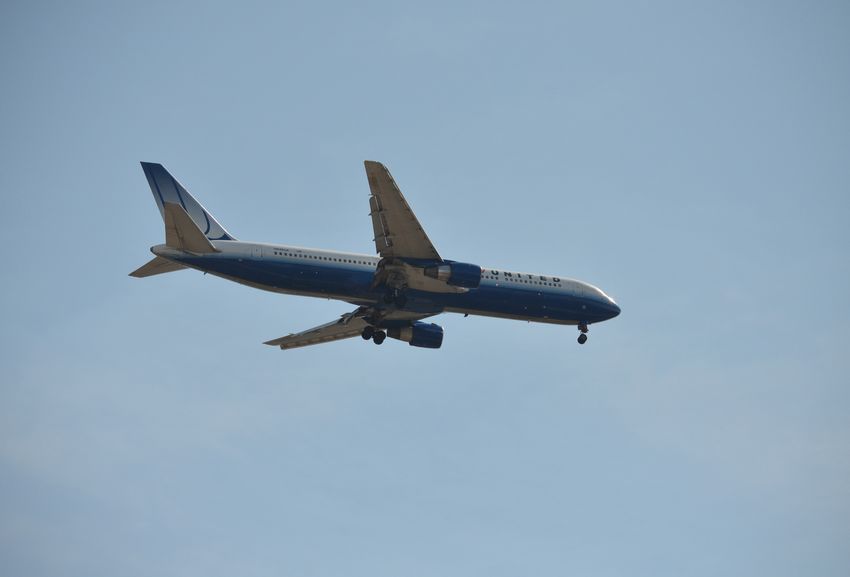
Ongoing improvements in aircraft efficiency offer limited hope for mitigating the climate
impacts of air travel. In terms of aircraft, the latest generation of Boeing’s 737 MAX delivers a
20% increase in fuel efficiency compared to the original generation - but this improvement has
taken nearly 20 years to achieve (ICAO, 2016). A number of other measures such as lightweight
materials, optimized routing, and electric taxiing are already being developed or implemented,
but these improvements in efficiency have a minor influence on total emissions (Air Transport
Action Group, 2015). More problematically, the number of aircraft in service may double in
the next twenty years, due to 4-5% annual growth in both passenger and freight demand, such
that assumed upgrades in technology will be unable to reduce either total emissions or radiative
forcing from aviation by 2050 (Grote et al., 2014)
The obstacles to achieving carbon neutral air travel are even more onerous than stabilizing
emissions. Airline carrier EasyJet claims that battery-powered aircraft could be operational within
a decade, although they would only be able to power short-haul flights, which are less than two
hours in duration (Monaghan, 2017). The CEO of Airbus has made similar predictions for hybrid
technology: aircraft powered by a battery paired with jet fuel will be able to perform short-haul
flights for 50-100 passenger aircraft by 2030 (Opperman, 2017). Two of the other more feasible
paths toward carbon neutral air travel include biofuels and liquid hydrogen fuels. However, liquid
hydrogen fuels will likely see uptake only if there is a more general move to a hydrogen-based
fuel economy (Lee et al., 2009). As for biofuels, there are formidable difficulties in sourcing
them sustainably given competition for land with agriculture (Tilman et al., 2009) and climate
mitigation (Smith et al., 2016). It is unsurprising therefore that researchers have concluded
that technological improvement in air travel without some shifts in demand are unlikely to be
consistent with achieving a 2°C climate target (Girod et al., 2013).
Yet, aviation emissions are not addressed in most existing climate policy frameworks. Emissions
from aviation and marine shipping are not covered by the UNFCCC and resulting protocols and
agreements, including the 2015 Paris Climate Agreement. As a consequence, aviation emissions
are generally excluded from accounting and reporting under province/state-, regional-, or
institutional-level climate action plans. For example, under British Columbia’s Greenhouse Gas
Reduction Target Act, provincial public sector organizations are required to annually report and
offset direct emissions from on-site combustion (Scope 1 emissions, according to the Greenhouse
Gas Protocol developed by the World Resources Institute and the World Business Council for
Sustainable Development) and indirect emissions from sources that are owned or controlled
by the institution (Scope 2), but not emissions from sources not directly owned or controlled
by the institution (Scope 3) like employee air travel or commuting (Ministry of Environment,
2016b). The province does require reporting and offsetting of business-related air travel emissions
for ministerial business, but not for other public sector institutions, including universities and
colleges, crown corporations, and health authorities.
There is a tremendous opportunity for leadership, both nationally and internationally, in
measuring and addressing emissions from business-related air travel at universities and other
public sector institutions. Programs to address business-related air travel emissions at universities,
6Pacific Institute for Climate Solutions
colleges, and other public institutions are currently rare. The few that do exist generally focus
on emissions accounting and/or carbon offset programs. Several universities have carbon offset
programs in place for their business-related air travel, including Cornell University, which
supports a local program that provides energy efficiency improvements for low to moderate-
income households in the area (Cornell University, 2017). While offsets are one way for an
institution to address emissions from air travel, an argument can be made that public institutions
should be leading the way on reducing demand – which means flying less. One example of
institutions tackling demand reduction is the Stockholm Resilience Center which, in addition
to offsetting all air travel, has attempted to minimize flights by installing meeting rooms with
videoconferencing systems (Stockholm Resilience Centre, 2017).
This report develops a framework for addressing business-related air travel emissions at academic
and public sector institutions in the province and beyond, through a case study at the Vancouver
campus of the University of British Columbia (UBC). It presents a ground-up analysis of air travel
emissions from units at UBC based on original travel requisitions, a survey of faculty attitudes
about business-related air travel, and an analysis of mitigation options including incentive-based
policies, information and communications technology (ICT), and offsetting based on the UBC
data. It concludes with a roadmap for action on business-related air travel emissions, including a
series of recommendations for tracking emissions, developing an ICT strategy, and implementing
a mitigation plan, which may apply to a wide range of academic and other public sector
institutions.
2. METHODS
In this study and in this report, “UBC” refers only to the Vancouver campus unless otherwise
specified. At present, UBC does not have a method to calculate, mitigate, or offset emissions
from all university-related air travel, referred to in this study as “business-related air travel”
(University of British Columbia, 2010). The university does, however, report an estimate of
Scope 3 emissions, including business-related air travel emissions, in its annual Carbon Neutral
Action Report (University of British Columbia, 2016, 2017a). Air travel emissions from flights
booked through Concur, UBC’s online air travel booking tool, are automatically estimated and
displayed in pounds (lbs) not kilograms (kg) of CO2. Total emissions from business-related air
travel purchased through UBC is then estimated using the ratio of the university’s total air travel
expenditures compared to the cost of flights booked though Concur.
For this analysis, we take a more comprehensive look at the drivers of business-related air travel
emissions from UBC using both the Concur air travel data and bottom-up data from air travel
requisitions (TR), collected from a series of administrative units, using a more detailed set of
emissions calculations. The initial objective of this project was to conduct a complete emissions
inventory for business-related air travel at UBC for the January 2015-June 2016 period (to cover
a fiscal and a calendar year) using both the bottom-up approach and the Concur data from the
UBC Travel Office. However, logistical challenges including the time-consuming nature of
bottom-up data collection (processing rate of approximately 14 TRs per hour), the unavailability
of some travel records, and resource limitations in the UBC Travel Office, made this goal
unrealistic. Instead, we focus on a subset of UBC administrative units, and only employ the 2016
Concur data from the UBC Travel Office.
7Pacific Institute for Climate Solutions
2.1. Collecting Data from Travel Requisition (TR) Forms
We conducted full audits of business-related air travel over the January 2015-June 2016 period
for the 8 units (of the 26 contacted) who volunteered to participate, including the Department
of Geography and the Department of Psychology. Relevant flight information was recorded by
an undergraduate research assistant. This information included: TR number, date, airport codes,
name (later anonymized), cost, ticket class, length of trip (in nights), primary and secondary
purpose of the trip, and additional flight information (e.g., the number of flight segments). The
costs of trips purchased in foreign currency were converted to Canadian dollars based on the
exchange rate on the date of the TR form. When missing data was encountered, we assumed that
flights without a stated ticket class were economy, since purchasing non-economy class tickets is
technically only possible with permission of the appropriate Dean or Vice-President (University
of British Columbia, 2017b). Although a “clear statement of the purpose” of the trip is required
under UBC Policy 83 (Procedure 1.2.1.1) (Board of Governors, 2010), the purpose could not be
discerned for some travel requisitions that we examined (4% were blank in this regard).
2.2 Emissions Calculator
We constructed a simple emissions calculator that functioned within an Excel spreadsheet. The
BC government uses 2015 emissions factors (Ministry of Environment, 2016a) developed by
the U.K. Department for Environment, Food & Rural Affairs (DEFRA). We employ similar
emissions factors but follow a more detailed U.K. government process, now under the Department
for Business, Energy & Industrial Strategy (BEIS), which has updated values for 2016. This more
detailed process results in higher emissions per distance flown. The calculator was applied to the
flight information collected via the bottom-up data collection and also to the 2016 Concur data
from the UBC Travel Office.
The values used by the BEIS for the average amount of greenhouse gases (in units of carbon
dioxide equivalent, CO2e) produced per passenger kilometer (pkm) by domestic, short and
long haul flights, accounting for average aircraft occupancy are shown in Table 1 (Ministry of
Environment, 2016a). We have altered these to short (3,700 km) flights, respectively, so that they are relevant outside of the U.K. context.
When calculating the distance travelled between airports, we find the great circle distance
between the geographical coordinates of the two airports, and then apply an 8% uplift factor
recommended by the BEIS to account for the additional flight length due to rerouting of planes,
holding patterns, etc.
Additionally, we add two details to the emissions calculation that are not used by the BC
government. First, we use the different BEIS emissions factors for economy, premium economy,
business, and first class flights in order to account for the average extra space occupied by higher
Table
1:
Emission
factors
for
business-‐related
air
travel
(kg
CO2e/passenger
km)
Class
Long
Haul
Medium
Haul
Short
Haul
Economy
0.14678
0.16508
0.27867
Economy
plus
0.23484
Business
0.42565
0.24761
First
0.58711
8
Pacific Institute for Climate Solutions

class seating. This approach assigns the additional emissions from a passenger occupying a
disproportionate amount of aircraft space to that passenger’s (i.e., UBC’s) emissions inventory.
Second, we include the literature-based radiative forcing multiplier of 1.9 to account for the
disproportionate warming influence of high-altitude em issions from aircraft (Lee et al., 2009;
BEIS, 2016). The value of 1.9 is the central estimate from the BEIS, and has large consequences
for accounting, nearly doubling total emissions compared to a calculation that ignores radiative
forcing.

Following standard emissions inventory practice, we account only for emissions from business-
related air travel purchased through UBC (e.g., billed to the university or to a grant or fund held
in a university account). Therefore, flights taken by non-UBC employees but paid for through
UBC (e.g., an invited speaker whose travel costs are covered by UBC or a UBC grant) are
included. Conversely, flights taken by UBC employees but paid for by an outside institution (e.g.,
another university paying for a UBC faculty member’s travel for a colloquium) are not included,
as they would be counted in the other institution’s inventory.

    2.3 Survey on Air Travel Attitudes Among UBC Faculty
We distributed an online survey, using UBC Faculty of Arts survey tool Qualtrics, to every
academic department and institute at UBC to assess faculty attitudes about business-related
air travel and mitigation options. The survey consisted of 13 questions and took respondents
approximately five minutes on average to complete. All data was anonymized with a numeric
key, although respondents were provided an option to permit linking their responses with
their individual business-related air travel emissions data (available through the bottom-up
data collection). The link to the survey was distributed to all units across campus by asking an
administrator or faculty member in each unit to distribute the survey to their unit’s listserv. The
survey and data collection process were approved by UBC’s Behavioural Research Ethics Board,
per university regulations.

    2.4 Interviews
To understand the various information and communications technology (ICT) (which includes
teleconferencing and videoconferencing) options currently available at UBC, interviews were
conducted with relevant UBC staff. These included interviews with a senior manager at UBC
Information Technology (IT), a digital media specialist in the Faculty of Arts, and an audiovisual
analyst in the Faculty of Medicine. A tour was also conducted of the videoconferencing facilities
in the Faculty of Medicine.

    3. RESULTS
The available air travel data suggests the business-related air travel emissions at UBC are between
26,333 and 31,685 tCO2e/yr (Table 2), equivalent to 63%-73% of the annual emissions from the
UBC campus for the 2015-2016 period1 (University of British Columbia, 2016, 2017a). The two
estimates for campus-wide air travel emissions are computed by multiplying the total emissions
from the study samples (UBC Travel office data and bottom-up data collection, respectively)
against the ratio of total campus-wide and total sample air travel expenditures. The estimated
campus-wide air travel emissions are 2.1 to 2.5 times greater than that reported in UBC’s Carbon
Neutral Action Reports, which similarly use expenditures to extrapolate from UBC Travel office

1
 This refers to the ‘offset-able’ emissions, which excludes biogenic emissions and emissions from off-campus
properties and the UBC properties trust.

                                                                                                                            9
Pacific Institute for Climate Solutions
data, because this study considers class of ticket and disproportionate warming influence of high-
altitude
emissions from aircraft.
To
lend further perspective to the magnitude of these emissions, air travel in the Department of
Psychology resulted in 415 tCO2e of emissions, while the energy use for the building that houses
Department of Psychology produced just slightly more (455 tCO e) over a similar 18 month
the 2
Table
2:
Comparison
of
the
two
sources
of
UBC
business-‐related
air
travel
Source
Bottom-‐up
Data
Collection
UBC
Travel
Office
Sample
All
flights
with
TR
forms
All
flights
purchased
through
an
submitted
to
one
of
eight
online
booking
tool
(45%
of
UBC
campus
units
air
travel
by
cost)
Time
period
Jan
2015
–
June
2016
Jan
2016
–
Dec
2016
Number
of
trips
1,769
trips
10,253
trips
Number
of
travellers
997
individuals
3,807
individuals
Air
travel
emissions
3,018.81
tCO2e
9,941.16
tCO2e
Emissions
per
travel
cost
1.65
kg
CO2e/$
1.42
kg
CO2e/$
UBC
air
travel
emissions1
31,685.05
tCO2e/yr
26,333.44
tCO2e/yr
UBC
offset
cost2
$792,126/yr
$658,336/yr
1
Estimate
based
on
emissions
per
travel
cost
X
total
annual
UBC
air
travel
expenditures
(2015-‐2016)
2
Based
on
UBC
air
travel
emissions
and
$25
per
tCO2e
price
in
the
provincial
system
period
from January 2016 to June 2017 (building emissions data were not available over the
2015
period due to missing data during renovations). Air travel in the Department of Geography
resulted in 454 tCO2e of emissions, while the Geography building (which has converted to a more
efficient heating system) was responsible for only 14.1 tCO2e. When buildings are heated and
powered by low-carbon energy, the emissions associated with the business-related air travel of the
occupants can dwarf the emissions from operation of the buildings in which they work.
3.1 Drivers of Business-Related Air Travel Emissions
A comparison of the two samples suggests important patterns in air travel behaviour and use
of the online booking tool. The emissions per trip were almost twice as high in the bottom-up
data collection (1.71 tCO2e/trip) than in the Concur bookings (0.97 tCO2e/trip). Conversely, the
emissions per traveller per year were higher in the Concur data (2.61 tCO2e/person in the Concur
sample and 2.02 tCO2e/person in the bottom-up sample) because travellers in the Concur data
took more than twice as many air travel trips per year (2.69 vs. 1.18 trips/year). These differences
reflect the different sample populations; staff and administration, who may fly more often than
faculty but over shorter distances, are more likely to use the Concur tool than faculty (e.g., staff
and administration represent 22% of travellers whose positions were identified in the Concur
sample, as opposed to 5% of travellers in the bottom-up sample). One implication is that data
from an institutional booking system (e.g., UBC’s Concur tool) may lead to an underestimate
of institution-wide emissions because of differences in travel behaviour and related emissions per
travel
cost between employees who use the booking system (e.g., staff and administration) and 1
those who book independently (e.g., faculty).
10Pacific Institute for Climate Solutions
Figure 1: Histogram of trip length. Note that a small number of trips longer than 40 nights are not shown.
Figure 2: Emissions associated with each primary purpose of trip in the bottom-up sample of eight UBC
campus units.
11Pacific Institute for Climate Solutions
The more comprehensive bottom-up dataset further illustrates air travel behaviour on campus.
In terms of length, only possible to calculate with the bottom-up data, most trips are short in
duration; the median trip is five nights long, with less than 4% of trips over 40 nights in length
(Figure 1). The emissions associated with conferences, which also includes workshops and other
meetings, dominate in the bottom-up data over emissions from trips for other purposes (Figure
2). Fieldwork, which may be distant from Vancouver, is also substantial, contributing more than
twice the emissions of university business or lectures. By contrast, UBC staff and administration
travel may be more likely to consist of domestic and short haul flights (63% of flights by
administration in the Concur sample were domestic compared to 42% for faculty).
Figure 3: Business-related air travel emissions for the 997 individual travellers (one third of the people in the 8
units did not fly during the sampling period). Light blue indicates those travellers responsible for the first 50% of
emissions and dark blue indicates those responsible for the second 50%
The datasets both indicate that UBC business-related air travel emissions roughly follow the
Pareto Principle, where a disproportionate fraction of the effects (80%) can be attributed to a
small fraction of causes (20%). We found that 36% of fliers were responsible for 80% of emissions
in the Concur sample. The top fliers were even more prolific: 11% of fliers were responsible for
half of all emissions. This analysis is unlikely to be skewed by only including members of the
UBC community who already fly. A comparison of the top emitters in the departments in the
bottom-up data to the air travel emissions from the entire department, which includes the many
individuals who did not fly during the study period, finds a similar result (Figure 3). Of the
approximately 1,509 individuals across the 8 departments in the sample during the study period
(includes graduate students, staff, administration, research staff, and faculty), 121 (8%) produced
half of all emissions and 377 individuals (25%) produced 80% of the emissions. Faculty are
especially likely to be in this group; they represent 39% of total emissions in the Concur data
sample and 47% of total emissions in the bottom-up data sample.
12
Pacific Institute for Climate Solutions
Table
3:
Measures
for
mitigation
Percent
Total
Reductions
Across
Savings
per
Mitigation
Measure
Reduction
Campus
(tCO2e)*
Tonne
Require
only
economy
tickets
7.8
1,723
-‐
Replace
flights
for
lectures**
4.0
884
$541
Replace
brief,
long
distance
trips
1.2
265
$652
Replace
single-‐day
return
flights
0.3
66
$2,221
All
measures
combined***
11.7
2,591
-‐
*
Calculated
by
applying
percent
reduction
found
in
bottom-‐up
sample
to
estimated
campus-‐wide
emissions
**
If
only
trips
of
2
nights
or
less
were
included,
the
reduction
is
8.88
tCO2e,
or
0.3%
of
total
emissions
***
Totals
are
smaller
than
the
sum
of
all
mitigation
measures
because
some
flights
were
removed
to
prevent
double-‐counting
(e.g.,
eleven
trips
were
both
lectures
and
non-‐economy
class
seating)
The total values are sensitive to the assumptions that inform our emissions calculator. For
instance, without applying higher emissions factors for first class, business, and economy plus
travel,
the total emissions from the bottom-up sample would decrease by 8% to 2,782.23 tCO2e.
Similarly, if we had not employed the radiative forcing factor of 1.9, the total emissions in our
bottom-up
sample would decrease by 47% to 1,588.85 tCO2e.
3.2. Tests of Mitigation Measures
We
used the bottom-up flight data, which
BOX A: COSTS AND BENEFITS OF
included
more information (length of trip,
DIFFERENT BOOKINGS
class,
purpose) than the Concur data, to test
the impact of various mitigation measures The differences in cost and emissions between
on
the total emissions from the sample. We direct, indirect, and higher class travel
focused on measures that could be taken is illustrated with a theoretical trip from
by the individual flier or the institution: Vancouver to New York’s JFK airport in
selecting direct flights, reducing brief long November 2017, based on data collected from
distance travel (one overnight), reducing the Skyscanner booking tool (www.skyscanner.
one-day travel, requiring only economy class com). A first class flight (direct) is associated
with four times the emissions of an economy
travel, and conducting invited lectures using
class flight and about ten times the cost. A
ICT (Table 3).
flight reduces emissions by 0.1 tCO e
direct 2
1.
Requiring only economy class tickets compared to an indirect flight, but the increased
cost
of $117 would be enough to purchase
Although purchasing non-economy class
almost 5 tCO2e of offsets at $25/t price in the
tickets at UBC is only possible with
provincial
system.
permission of the appropriate Dean or Vice-
President, there were 97 trips that included Percent
Total
Reductions
Across
Savings
per
at least one economy plus, business class, Reduction
Campus
(tCO2e)*
Tonne
7.8
1,723
-‐
or first class leg in the bottom-up sample of 4.0
884
$541
8 different academic units. We found that 1.2
265
$652
0.3
66
$2,221
replacing these with economy class tickets 11.7
2,591
-‐
would have resulted in a savings of 236.58
tCO2e, or 7.8% reductions. This may be a
1
conservative estimate as all tickets without a class description were assumed to be economy. The
cost savings per tonne of this mitigation measure could not be computed for all flights, but an
example is presented for a theoretical trip from Vancouver
to New York (see inset box).
13
Pacific Institute for Climate Solutions

             2. Reducing travel for lectures
                                                                  BOX B: UBC TO UBC-OKANAGAN
             Traveling for the sole purpose of giving             TRAVEL
             a lecture or colloquia presentation could
             potentially be replaced in many instances         There is frequent air travel between Vancouver
             with using ICT. In our sample, 56 trips were      and Kelowna due to the unique relationship
             coded as lectures, without any secondary          between UBC and UBC-Okanagan. There
             purpose provided. These trips accounted for       are 807 Vancouver-Kelowna flights in the
             120.43 tCO2e, which is 4% of total air travel     Concur sample during the 2016 calendar year,
             emissions, and had a total cost of $65,107.       including flights originating from UBC and
             However, this sub-sample includes many long       UBC-Okanagan, with a total cost of $249,374
             trips, which implies an unrecorded secondary      and 139.7 tCO2e in associated emissions.
             purpose (personal or professional). If only       Of the 807 flights, 515 (64%) were taken by
             trips of 2 nights or less were included, the      administrators.
             number decreases to 11 trips totalling 8.88
                                                               This frequent inter-campus travel represents
             tCO2e, or 0.3% of total emissions. These trips
                                                               an opportunity for mitigation. Reducing
             are examples of flights that could most likely
                                                               this travel by 50% through increased use
             be replaced as they were brief duration and
                                                               of videoconferencing or other technologies
             solely for the purpose of delivering a lecture
                                                               would result in an almost 1% reduction
             and any related quick interactions.
                                                               in total emissions (based on the Concur
             3. Reducing brief, long distance travel           data). Replacing a return flight with
                                                               intercity bus travel saves approximately
             Long flights where the entire trip is             0.31 tCO2e, based on the BC government’s
             completed with one overnight represent ideal      standard for intercity transit (Ministry of
             opportunities for mitigation using ICT.           Environment, 2016a). Mitigation measures
             An example might be a return flight from          could include incentivizing individuals to
             Vancouver to Toronto, with one overnight.         use videoconferencing, to travel by bus, or to
             The flight duration of at least four hours in     carpool between Vancouver and Kelowna, as
             each direction and airport transit time leaves    well as developing a semi-regular direct shuttle
             the flier with little time for work beyond        service between campuses.
             a face-to-face meeting or a single lecture.
             Yet the trip requires 7,226 km of travel
             and produces 1.2 tCO2e, equivalent to 6.0% of the annual footprint of the average Canadian
             (Environment and Climate Change Canada, 2017).

             In our bottom-up sample, there were 32 return flights of over 3,700 km round trip that included
             only 1 overnight. Eliminating these flights would result in emissions savings of 35.6 tCO2e, or
             a 1.2% reduction of emissions in the sample. The cost associated with these flights was $23,915,
             for a mitigation savings of $652 per tCO2e assuming no cost to the replacement virtual meeting.
             While videoconferencing equipment is expensive, much of the cost is in the initial upfront capital
             investment (see Discussion and Table 4) as opposed to flight costs which recur each meeting.

             4. Reducing single day return flights

             In the bottom-up sample, 53 flights had a departure and return flight scheduled for the same day.
             The extremely short duration of these trips implies that it might be possible to accomplish the goal
             of these trips without flying. These flights produced 8.23 tCO2e, which would translate to a 0.3%
             reduction in emissions from our sample if they were eliminated. The costs associated with these
             flights was $18,281, so once again assuming no increased cost from the added use of technology,
             this results in a mitigation savings of $2,221 per tCO2e.

14
Pacific Institute for Climate Solutions
5. Choosing direct flights
Booking direct rather than indirect flight routings has been promoted as a way to reduce air travel
emissions (David Suzuki Foundation, 2017; Schlossberg, 2017) because direct flights cover less
distance and avoid taking off and landing multiple times which requires disproportionate fuel
(Lewis, 2013). Direct flights are already convenient for most travellers in terms of time, but are
sometimes not available or are dis-incentivized by their price. Travel cost is a key consideration for
public institutions; under UBC policy 83 (Line 1.4), individuals must “make the most economical
travel arrangements possible” (Board of Governors, 2010).
Calculating the emissions savings from selecting only direct flights with the entire dataset is
complicated by the unknown factor of availability at the time flights were booked. We tested
the potential emissions savings and the costs of choosing direct flights using the Department of
Geography sample; we approximated availability of flights by entering the same dates into the
Skyscanner travel booking tool, but using upcoming months (e.g., April 20th, 2016 becomes April
20th, 2018) and recording the cost of the least expensive direct and indirect flights.
Of the 71 indirect flight routings in the sample that could theoretically be shortened to a direct
route, only 14 (or 5.1% of all trips in the sample) were replaceable with direct flights using this
approach. Two of these flights would have been prohibitively more expensive (over $2,000 in
increased cost), leaving 12 realistically replaceable flights with a total savings of 1.80 tCO2e per
year (0.4% reduction in departmental emissions). The flight substitutions result in an average cost
savings of $6.87; this may be a product of booking travel far in advance, as direct flights are not
consistently cheaper than indirect alternatives. This is likely an overestimate of potential emissions
reductions as taking a direct flight in these situations may have resulted in departure or arrival
times that were either inconvenient or incompatible with the purpose of the trip. There could be
marginal benefits to informing travellers of this mitigation measure, but the achievable emissions
reductions are likely too small to warrant a change in policy or incentives. Most fliers travel direct
when it is reasonably possible; 74% of the trips in the Department of Geography sample were
direct.
3.3 Survey on Air Travel Attitudes
A total of 251 individuals from 19 different faculties responded to the voluntary survey between
June 18 and October 16, 2017. Of those, 210 completed the survey: roughly half (49%) of the
respondents were male, 146 (70%) were faculty (including emeriti and teaching faculty), 23 were
graduate students, 9 were staff, and 6 were post-doctoral fellows. The response rate is estimated
at a minimum 3%, based on the 146 faculty respondents out of 5,003 faculty working at UBC.
The relatively low response rate may be due to the competing demands on faculty time as well
as the difficulty reaching all units; of the 66 academic units contacted about the survey, only 41
confirmed sharing the survey with the faculty.
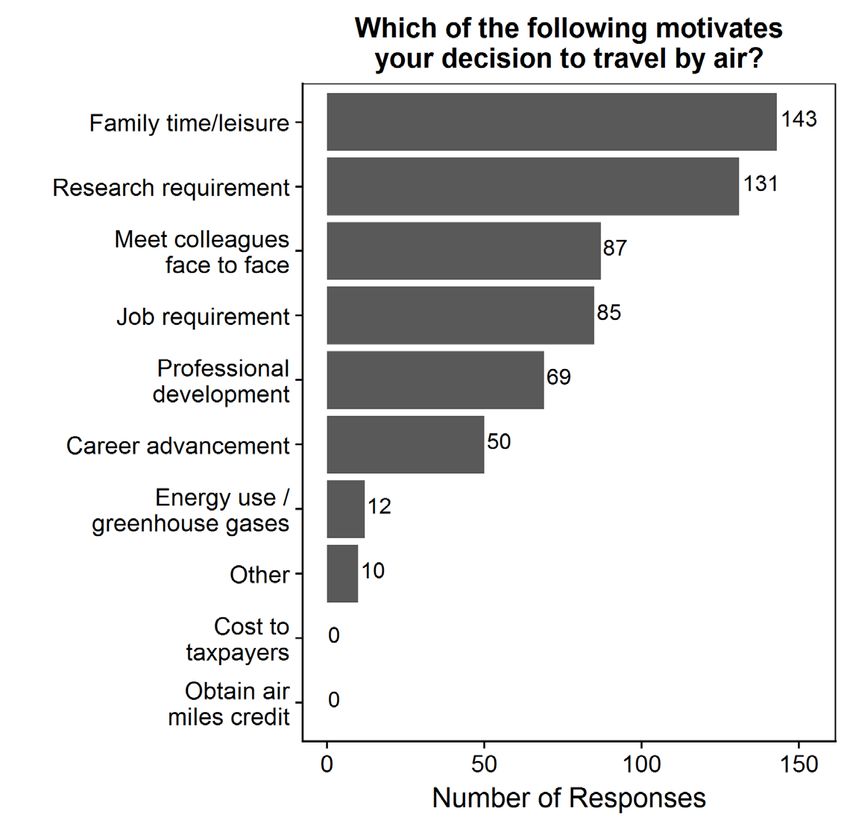
In response to the first question, “Which of the following motivates your decision to travel by air?
(maximum of three options permitted),” the most popular response (143 individuals) was “Family
time/leisure” (Figure 4). Although the survey was about business-related air travel at UBC, it is
possible that many respondents reflected on their personal flying while answering this question.
The next most popular responses – all of which were job or career related – are therefore more
instructive. Of note, only 5.7% of respondents (12 individuals) selected “energy use/greenhouse
gases” and no respondents selected air miles or the cost to taxpayers as among the three most
important motivators for the decision to travel by air.
15Pacific Institute for Climate Solutions
Figure 4: Responses to business-related air travel survey question regarding motivations for air travel
Figure 5: Responses to business-related air travel survey questions regarding (a) how UBC could support reduced air
travel and (b) obstacles to use of teleconferencing on campus
When asked, “How could UBC support you to reduce your need to fly? (Check all that apply)”,
the most common response (45.7% of respondents) was to improve teleconferencing on campus
(Figure 5a). Of those who responded “Other” and entered a reply, suggestions included “allow
courses to be taken at a distance”, “give enough time for alternative travel methods”, “promote and
support a culture of reduced acceptability for air travel”, “more regional gatherings … that happen
at the same time as other regional gatherings for international conferences (conference hubs)”. In
16Pacific Institute for Climate Solutions
this same category, 8% of respondents (17 individuals) also voiced some version of the idea that
UBC could or should not try to reduce their need to travel, for instance, “I travel because I feel
the need to meet people face-to-face. UBC can’t affect that.” or “They should not try to reduce it.”
In response to the follow-up question about teleconferencing as a way to reduce air travel (Figure
5b), the primary obstacle identified was lack of awareness of teleconferencing options at UBC
(39%, or 82 respondents), followed closely by the quality of the communication (80 respondents).
The fourth most common response was “Other” (58 responses with 56 written explanations). One
common theme among the written responses (identified in 19 responses) was that teleconferencing
is not an adequate substitute for certain needs (e.g., “Teleconferencing is not a substitute for
on-site research or in-person interaction”). Of the written responses, 15 referred to specific
technical issues such as poorly insulated rooms, incompatible headphones, a mismatch between
the size of available rooms and the size of room needed, or glitches in specific software packages.
Nine respondents also identified issues which we coded as “cultural” such as, “the norm in my
field is to meet in person” or “lack of teleconferencing option for meetings attended”.
Although the low response rate to the survey may introduce selection bias, the results suggest
there is not a strong sample bias towards individuals uniquely knowledgeable about business-
related air travel emissions or the topic of climate change. This is evidenced by the response to
the final survey questions about carbon offsets (Figure 6a). Of the individuals surveyed, 70%
claimed to never purchase offsets and 14% claimed to rarely purchase them. In response to the
question “What is the primary barrier to purchasing carbon offsets?”, 35% of respondents cited
some version of cost (i.e., “Too expensive”, “I don’t get reimbursed”, or “There is no budget for it”)
while 26% of respondents selected “I don’t think it’s effective”, possibly reflecting deep knowledge
of the subject (Figure 6b). The category with the most responses, however, was “Other”. Most of
the text responses in this category described lack of knowledge of offsets (12%, or 26 respondents)
– “Never heard of it” – or a lack of interest in offsets (20 respondents or 9.5%) with responses
suggesting disinterest (“I don’t know how”, or “Didn’t think about it”).
4. CHALLENGES AND OPPORTUNITIES: INFORMATION AND COMMUNICATIONS
TECHNOLOGY (ICT)
ICT represents a potentially low-cost way to reduce business-related air travel and accompanying
emissions while maintaining or even expanding contact and collaboration with outside individuals
and institutions. Although the use of teleconferencing, videoconferencing, and other virtual
meeting technologies may only modify or possibly even stimulate air travel (Haynes, 2010),
there is recent evidence that in practice, they are capable of reducing air travel via substitution
(Denstadli et al., 2013; Lu and Peeta, 2009). Many meetings, speeches, and lectures that in
the past might have required air travel already take place using ICT – from conference calls
to videoconferencing to the delivery of video feed – at universities and other public sector
institutions. Emerging ‘telepresence’ or virtual reality (VR) technology promises to further reduce
the gap between the virtual and in-person engagement experience. Recognizing the potential
for ICT, the travel policy established in 2017 at UBC states that, “Travellers should strive to use
available technology as a substitute for face-to-face meetings where possible” (University of British
Columbia, 2017b).
From an emissions perspective, the lifecycle emissions of equipment and energy use for ICT is less
than that of air travel, even when infrequently used, and can even be less than that of train travel,
if used frequently (Borggren et al., 2013). Coroama et al. conducted a conference in two locations
connected with ICT to reduce participant transportation emissions, and found total reductions of
17Pacific Institute for Climate Solutions
37-50% even though participation increased compared to a single venue alternative (Coroama et
al., 2012). While ICT has much potential for climate mitigation, there are important caveats to
consider. Emissions from ICT will increase when more complicated equipment such as large LCD
screens are used (Borggren et al., 2013), which should motivate institutions to carefully select the
right technology for their needs. In addition, there are important rebound effects. For example,
the ease with which modern communications technology permits contact between researchers in
different locations has been critical in developing distant collaborations, which while important,
can invite additional air travel. ICT can also lead to cost savings which may be redirected to
other activities or purchases with their own emissions. When Matsuno et. al accounted for
cost savings rebound effects, they still found
videoconferencing resulted in 80% less emissions
BOX C: ICT AT UBC MEDICINE
than a face-to-face meeting (Matsuno et al.,
2007). In 2005, UBC Medicine began a
distributed program to increase enrollment
4.1. Information and Communications and address the shortage of rural doctors.
Technology at UBC The program uses videoconferencing to
With 46% of survey respondents indicating bridge campuses as far apart as Vancouver,
that improvements in campus teleconferencing Victoria, Kelowna, and Prince George. For
would help them reduce their need to fly, a instance, lectures for first year students
strong argument can be made for the need for occur simultaneously, with a lecturer in
progress in this area. In the past, UBC employed one site speaking to students in that lecture
a patchwork of ICT resources such that access hall and hundreds of kilometers away. Each
to facilities and software can vary by faculty, lecture hall is equipped with microphones
building, and department. For instance, any and cameras, such that if a student in
employee in the Faculty of Arts can book a Kelowna asks a question to the lecturer in
conference room with a high-definition camera, Prince George, the audience can hear and
high-definition TV, and an omni-directional see the question being asked.
microphone for free and may necessitate a walk
Lectures receive IT support and a help
across campus (this may not be widely known;
desk is available for those booking a
48% of Faculty of Arts respondents in our survey
videoconferencing room (uses include a
reported being unaware of teleconferencing
TEDx conference). Standardization reduces
options).
the demand for assistance; lecture theatres
Unfortunately, there has been little incentive and smaller seminar rooms, often used
for sharing of resources because units that for hospital-to-hospital communication,
make significant investments from their own are highly similar. In each location, users
budgets in technologies and in IT staff to will find the same button on a familiar
support those technologies want sole or primary touch-screen for projecting an image from
access for their own faculty and staff. Even for a document viewer. Training on one site
those who do have access to facilities, IT staff therefore applies to any of the sites.
interviewed for this paper report that users
Staff cautioned that these technologies
desire same-day video/web conferencing in
are not a replacement for face-to-face
a nearby facility, such that booking a session
interactions. Professors still like to travel
in a different part of campus is not viewed as
regularly to the remote locations in order
sufficient. The above and other limitations lead
to build personal relationships with the
to low usage of existing facilities, which one IT
students. Teleconferencing has therefore
staff estimated at as low as 8% for some rooms.
connected distant locations, but not wholly
Additionally, without a centralized support
displaced flying.
system, departments that invested in equipment
18Pacific Institute for Climate Solutions
may not have ongoing funding for maintenance. Because of these problems, UBC is in the
midst of implementing a campus-wide pilot project, “UBC Collaboration Suite,” which will be
an “ecosystem of components” including Skype for Business and Pexip, a meeting platform that
allows users to collaborate across audio, video, or web conferencing devices (UBC Information
Technology, 2017).
Related technologies are also in use to create better learning environments without the need for
travel (by air or otherwise). Senior Instructor Loch Brown and a team in the Department of
Geography have experimented with immersive, 360° videos for field sites, such as Stanley Park in
Vancouver, that allow students to participate in field trips without going to the actual location.
This can have many benefits including ease of accessibility for disabled students, decreased
departmental costs, and reduced transportation emissions. Conferences and lectures with options
for pre-recorded lectures, livestreaming, or audience questions delivered by apps or text messages
are also commonplace. The UBC Faculty of Medicine (see Box C) has been a leader in integrating
these technologies into its educational mission.
4.2. Available and Emerging Technologies
There
is no “one-size-fits-all” solution for ICT. More elaborate technologies are likely to come with
higher price tags and embodied emissions, and should only be implemented if they will be used
frequently. A list of currently available technology options is presented below in Table 4.
Table
4:
Videoconferencing
technologies
Technology
Description
Examples
Cost
Range
Allows
multiple
types
of
devices
and
software
(audio,
visual,
web
Bluejeans
Bridge
conferencing)
to
be
connected
in
one
Pexip
Variable
platforms
virtual
meeting.
Example:
simultaneous
Cisco
Meeting
Server
connection
between
participants
using
Skype,
a
cellphone,
and
a
room
system
Small
seminar
room
(6
people):
Two
microphones,
$80-‐100,000
one
large
screen
and
Allows
for
direct
communication
with
projector
similar
videoconference
units,
and
in
Large
seminar
room
(~40
Room-‐based
some
cases,
with
outside
devices
people):
Two
projectors
and
systems
$200,000
(cellphones,
PCs,
etc.).
Examples
large
screens,
20
(prices
and
provided
contained
one
omni-‐ microphones
examples
directional
microphone
for
every
two
Lecture
theatre
(size
varies,
taken
from
individuals,
two
projector
screens,
and
up
to
350
people):
Two
$350-‐500,000
UBC
MED
IT)
video
cameras
to
view
participants
and
projectors,
camera
for
(Renewal
lecturers.
lecturer,
camera
to
focus
on
every
8
years
participant
with
microphone,
for
one
microphone
per
two
~$200,000)
participants
Free
versions
of
this
type
of
software
Google
Hangouts
usually
support
only
video,
while
paid
Skype
for
Business
versions
allow
for
options
such
as
Cisco
WebEx
Software
Variable
sharing
spreadsheets
and
documents
or
GoToMeeting
having
many
participants
join
a
single
Fuze
videoconference
Adobe
Connect
19
You can also read