Article - the NOAA Institutional Repository
←
→
Page content transcription
If your browser does not render page correctly, please read the page content below
Article
An Eye on the Storm
Integrating a Wealth of Data for Quickly Advancing the Physical
Understanding and Forecasting of Tropical Cyclones
Svetla M. Hristova-Veleva, P. Peggy Li, Brian Knosp, Quoc Vu, F. Joseph Turk,
William L. Poulsen, Ziad Haddad, Bjorn Lambrigtsen, Bryan W. Stiles, Tsae-Pyng Shen,
Noppasin Niamsuwan, Simone Tanelli, Ousmane Sy, Eun-Kyoung Seo, Hui Su,

                                                                                                                                                         Downloaded from http://journals.ametsoc.org/bams/article-pdf/101/10/E1718/5011864/bamsd190020.pdf by NOAA Central Library user on 02 November 2020
Deborah G. Vane, Yi Chao, Philip S. Callahan, R. Scott Dunbar, Michael Montgomery,
Mark Boothe, Vijay Tallapragada, Samuel Trahan, Anthony J. Wimmers, Robert Holz,
Jeffrey S. Reid, Frank Marks, Tomislava Vukicevic, Saiprasanth Bhalachandran,
Hua Leighton, Sundararaman Gopalakrishnan, Andres Navarro,
and Francisco J. Tapiador

                                ABSTRACT: Tropical cyclones (TCs) are among the most destructive natural phenomena with huge
                                societal and economic impact. They form and evolve as the result of complex multiscale processes
                                and nonlinear interactions. Even today the understanding and modeling of these processes is still
                                lacking. A major goal of NASA is to bring the wealth of satellite and airborne observations to bear
                                on addressing the unresolved scientific questions and improving our forecast models. Despite their
                                significant amount, these observations are still underutilized in hurricane research and operations
                                due to the complexity associated with finding and bringing together semicoincident and semi-
                                contemporaneous multiparameter data that are needed to describe the multiscale TC processes.
                                Such data are traditionally archived in different formats, with different spatiotemporal resolution,
                                across multiple databases, and hosted by various agencies. To address this shortcoming, NASA
                                supported the development of the Jet Propulsion Laboratory (JPL) Tropical Cyclone Information
                                System (TCIS)—a data analytic framework that integrates model forecasts with multiparameter
                                satellite and airborne observations, providing interactive visualization and online analysis tools.
                                TCIS supports interrogation of a large number of atmospheric and ocean variables, allowing for
                                quick investigation of the structure of the tropical storms and their environments. This paper
                                provides an overview of the TCIS’s components and features. It also summarizes recent pilot
                                studies, providing examples of how the TCIS has inspired new research, helping to increase our
                                understanding of TCs. The goal is to encourage more users to take full advantage of the novel
                                capabilities. TCIS allows atmospheric scientists to focus on new ideas and concepts rather than
                                painstakingly gathering data scattered over several agencies.

https://doi.org/10.1175/BAMS-D-19-0020.1
Corresponding author: Dr. Svetla Hristova-Veleva, svetla.hristova@jpl.nasa.gov
In final form 26 April 2020
©2020 American Meteorological Society
For information regarding reuse of this content and general copyright information, consult the AMS Copyright Policy.

                AMERICAN METEOROLOGICAL SOCIETY                                                                        O C TO B E R 2 0 2 0   E1718
AFFILIATIONS: Hristova-Veleva, Li, Knosp, Vu, Turk, Poulsen, Haddad, Lambrigtsen, Stiles, Shen,
Niamsuwan, Tanelli, Sy, Su, Vane, Callahan, and Dunbar—Jet Propulsion Laboratory, California Institute
of Technology, Pasadena, California; Seo—Department of Earth Science Education, Kongju National
University, Gongju, South Korea; Chao—Joint Institute for Regional Earth System Science and Engineer-
ing, University of California, Los Angeles, Los Angeles, California; Montgomery and Boothe—Naval
Postgraduate School, Monterey, California; Tallapragada—NOAA/National Center for Environmental
Prediction/Environmental Modeling Center, College Park, Maryland; Trahan—NOAA/Earth System
Research Laboratory/Global Systems Laboratory, and CIRES, Boulder, Colorado; Wimmers and Holz—
Cooperative Institute for Meteorological Satellite Studies, University of Wisconsin–Madison, Madison,
Wisconsin; Reid—Marine Meteorology Division, Naval Research Laboratory, Monterey, California; Marks
and Gopalakrishnan—NOAA/AMOL/Hurricane Research Division, Miami, Florida; Vukicevic—Faculty of
Physics, University of Belgrade, Belgrade, Serbia; Bhalachandran—Department of Earth System Science,

                                                                                                               Downloaded from http://journals.ametsoc.org/bams/article-pdf/101/10/E1718/5011864/bamsd190020.pdf by NOAA Central Library user on 02 November 2020
Stanford University, Stanford, California; Leighton—Rosenstiel School of Marine and Atmospheric Sci-
ence, University of Miami, and NOAA/AOML/Hurricane Research Division, Miami, Florida; Navarro—
Department of Applied Physics, University of León, León, Spain; Tapiador—Earth and Space Sciences
Research Group, University of Castilla–La Mancha, Toledo, Spain

T
      ropical cyclones (TCs) and disturbances are a key component of the climate system,
      and understanding their evolution and role in modifying the water and energy budgets
      is of great scientific interest. TCs are among the most destructive natural phenomena
and have huge societal and economic impact. Each year they threaten the U.S. coast, cause
damage worth billions, and take lives. The deadliest hurricane in U.S. history still is the 1900
Galveston storm, which killed 8,000–12,000 people and destroyed the city. More recently,
Hurricane Harvey (2017) became the second-costliest storm in U.S. history at the time
($131.3 billion, values based on the 2020 Consumer Price Index adjusted cost) after 2005’s
Hurricane Katrina, which caused $170.0 billion in damage (according to the same index),
killed some 1,200 people, and left hundreds of thousands homeless. In other parts of the world
the effects are even more damaging. In one noteworthy case, it has been estimated that some
84,500 people died and another 53,800 disappeared when Tropical Cyclone Nargis struck
Myanmar in 2008 (Swiss Reinsurance Company Ltd. 2009). Four billion-dollar hurricanes
occurred during the very recent 2017 and 2018 Atlantic hurricane seasons (Harvey, Irma,
Maria, and Michael). The damages caused by each of them are estimated to be between
$50 and $131 billion (NOAA/NCEI 2019).
   Readiness for TC landfall is vital and there is a well-recognized need to improve the forecast
accuracy of the models. However, TCs form and evolve as the result of complex multiscale
processes and nonlinear interactions and those interlinked processes enormously complicate
their modeling. Even today there are still many unanswered questions about the physical pro-
cesses that determine hurricane genesis, their rapid intensity changes (RIC), their structure,
and their evolution in general. During the past 20 years there has been significant improve-
ment in track forecast (Cangialosi 2019; Elsberry 2014; Goerss et al. 2004). However, the
intensity forecasts have improved at a slower rate over the same period (DeMaria et al. 2005;
Emanuel 2017, Kaplan et al. 2010; Krishnamurti et al. 2005). Current focus of research
and development is toward improvement of forecasts of TC intensity and especially of TC
RIC (Kaplan et al. 2010; DeMaria et al. 2014), posing questions about the sources of the
intensity forecast errors. To improve TC forecasts, there is a need to better understand how
well models reflect the physical processes (e.g., moisture convergence, turbulent mixing,
microphysical processes that lead to hydrometeor production, associated latent heat release,

AMERICAN METEOROLOGICAL SOCIETY                                                 O C TO B E R 2 0 2 0   E1719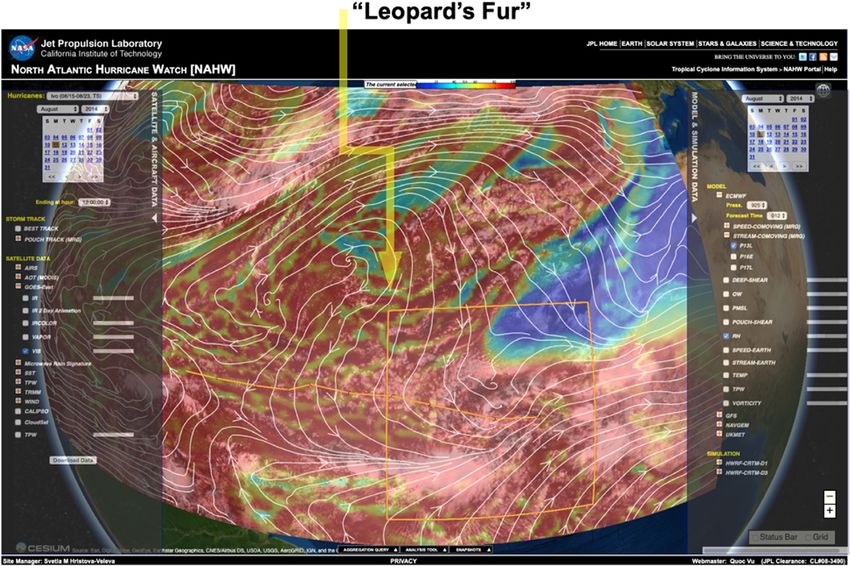
and the development/intensity of the convective updrafts and vertical transport of mass
and moisture) and their interactions. While today’s satellite observations do not yet provide
information on the processes, they provide information on the macroscale structure and
evolution of the storms, which can be used as a constraint and guidance toward improving
the models. Some specific questions include:

(i)		 How well is the complexity in precipitation structure simulated?
(ii)		 Are the vortex-scale processes and associated asymmetries captured correctly?
(iii) Is the representation of the surrounding environment accurate?
(iv)	How accurate is the interaction between the storm vortex and the surrounding environ-
       ment?

                                                                                                            Downloaded from http://journals.ametsoc.org/bams/article-pdf/101/10/E1718/5011864/bamsd190020.pdf by NOAA Central Library user on 02 November 2020
   One avenue to improve tropical forecast modeling is through the better use of existing
data in TC research and operations. The advanced use of satellite data should involve model
validation through comparisons of observed and forecasted storms. It should also lead to
model improvement by guiding the development of parameterization schemes such that the
resulting storm structures compare better to those observed by the satellites. Besides improv-
ing models, model forecasts could also be improved through data assimilation. It has been
widely recognized that the large-scale model forecasts have significantly improved over the
last two decades due to the assimilation of satellite observations—mostly in the absence of
precipitation. However, the model forecasts could be significantly improved further by the
assimilation of satellite data inside the precipitating core. This remains still a challenging
problem for two reasons: the direct satellite observations (e.g., microwave brightness tempera-
tures) have indirect and very nonlinear sensitivity to the most important underlying model
variables, and at the same time the satellite-based retrievals of the geophysical variables,
directly related to the model fields, often carry significant uncertainty due to the variety of
assumptions made in the retrieval algorithms.
   The wealth of satellite and airborne observations collected over the past two decades can
be brought to bear on addressing unanswered fundamental questions about the physics of a
variety of processes. Major satellite data processing centers provide TC satellite imagery, in-
cluding near-real-time capabilities (e.g., Hawkins et al. 2001). However, despite the significant
amount of satellite data that is available today, such observations are still underutilized in a
more quantitative way due to the complexity associated with finding and bringing together
semicoincident and semicontemporaneous multiparameter data that are needed to describe
the multiscale processes associated with complex phenomena such as tropical cyclones.
Such data are traditionally archived in different formats, with different temporal and spa-
tial resolutions, across multiple databases, and hosted by various agencies. To address this
shortcoming, over the last 10 years NASA has developed information-system technology that
promotes a fusion of observations and operational model output to help improve the scientific
understanding of hurricanes, typhoons, and TCs in general.
   One such example is the Jet Propulsion Laboratory (JPL) Tropical Cyclone Information
System (TCIS; https://tropicalcyclone.jpl.nasa.gov). TCIS is a data analytic center framework that
integrates model forecasts with multiparameter satellite and airborne observations from a
variety of instruments and platforms. In practice, TCIS is an interactive system for visualiza-
tion and includes online analysis tools that work with both observations and model output,
allowing for quick investigation of tropical disturbances and TCs and their surrounding
large-scale environments. Bringing multiparameter digital data in a semicoincident and
semicontemporaneous framework and integrating them with online analysis tools should help
the more quantitative model evaluation and improve the understanding through supporting
joint analysis of different variables (e.g., wind and precipitation).

AMERICAN METEOROLOGICAL SOCIETY                                              O C TO B E R 2 0 2 0   E1720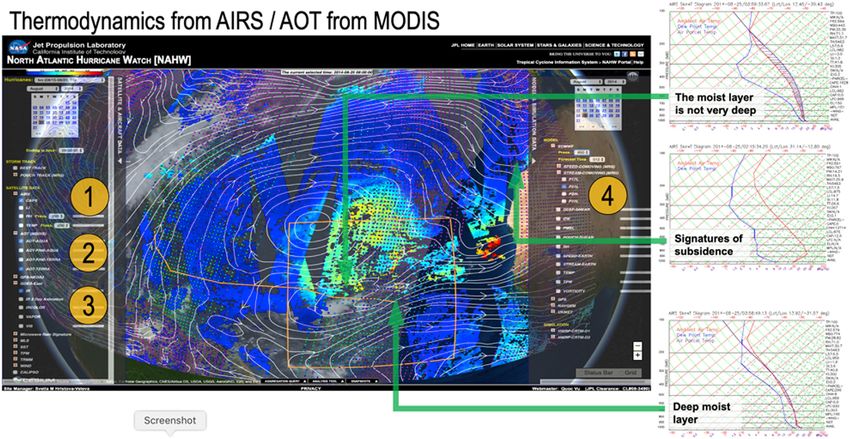
TCIS allows atmospheric scientists to spend more time on new ideas and concepts rather
than painstakingly gathering observational and model data scattered over several agencies.
Considering the growing interest in improving hurricane predictability, the societal impli-
cations of this meteorological phenomena, and the need of levering resources, JPL’s TCIS
provides an important service to the community.
   The purpose of the article is to present NASA’s TCIS and to inform potential users of the
utility of TCIS for monitoring and analyzing the observed and forecasted evolution of TC track,
intensity, and structure so anyone interested can use the resources provided in the portals.
The paper also highlights some potential uses of the JPL TCIS through pilot projects and direct
applications of the novel tool. These, however, are just a few examples intended to illustrate
the potential. The system can be used by anyone to explore new avenues of research. The
intent of the paper is to inform the community how TCIS can benefit our ability to understand

                                                                                                           Downloaded from http://journals.ametsoc.org/bams/article-pdf/101/10/E1718/5011864/bamsd190020.pdf by NOAA Central Library user on 02 November 2020
and forecast such destructive phenomena.

A comprehensive data hub for tropical cyclone research
Recognizing the high societal value of accurate hurricane forecasts, the NOAA-led,
multiagency Hurricane Forecast Improvement Project (HFIP) was established in 2007. The
JPL TCIS was built to support this initiative, and today it is advanced enough to be reliably
used by a variety of users, including the forecast and research communities.
    The Tropical Cyclone Information System is a data analytic framework designed to help
improve our understanding of what controls hurricane genesis and evolution, and tropical
convection in general. Its development was driven by the goal to enable investigations of the
multiscale interactions that sometimes lead to the development of storms and other times do
not, and to facilitate model evaluation (e.g. Hristova-Veleva et al. 2012b) that goes beyond
the comparison of “best track” metrics.
    TCIS has two components: (i) a set of interactive portals that integrate model forecast with
multiparameter satellite and airborne observations from a variety of instruments and platforms,
providing interactive visualization and some online analysis tools that work with both obser-
vations and models, and (ii) a 12-yr global archive of multisatellite hurricane observations.
    The objectives of the interactive systems are (i) to allow interrogation of a large number
of atmospheric and ocean variables to help better understand the processes associated
with tropical convection in general, and, in particular with tropical cyclone genesis, track,
and intensity changes; (ii) to allow for easy evaluation of models by comparison with exist-
ing observations; and (iii) to serve as a rich information source during the planning and
postcampaign analysis stages of field campaigns and to support in-depth posthurricane
research. These interactive portals include the North Atlantic Hurricane Watch (NAHW;
https://nahw.jpl.nasa.gov) site and the interactive data portals being developed to support field
campaigns: NASA’s Convective Processes Experiments (CPEX and CPEX-AW) site (https://
cpex.jpl.nasa.gov) and the 2019 Cloud, Aerosol and Monsoon Processes Philippines Experi-
ment (CAMP2Ex) site (https://camp2ex.jpl.nasa.gov) for the study of tropical convection. All
these portals, run also in near–real time, are designed with the same overarching goals in
mind: (i) to increase the accessibility and utility of NASA and NOAA observational data and
(ii) to enable the development of new information products. These portals provide the same
capabilities and are developed using the same technology. Here we focus on presenting the
NAHW portal, as this is the system that addresses the questions regarding hurricane genesis
and evolution—a science problem with significant societal implications.
    In addition to the three interactive portals, TCIS also includes a 12-yr-long (1999–2010)
global data archive of satellite observations of tropical cyclones (Li et al. 2007; Turk et al.
2010). It is a one-stop place to obtain an extensive set of multiparameter data from multiple
observing systems. The Tropical Cyclone Data Archive (TCDA; https://tcis.jpl.nasa.gov/data/

AMERICAN METEOROLOGICAL SOCIETY                                             O C TO B E R 2 0 2 0   E1721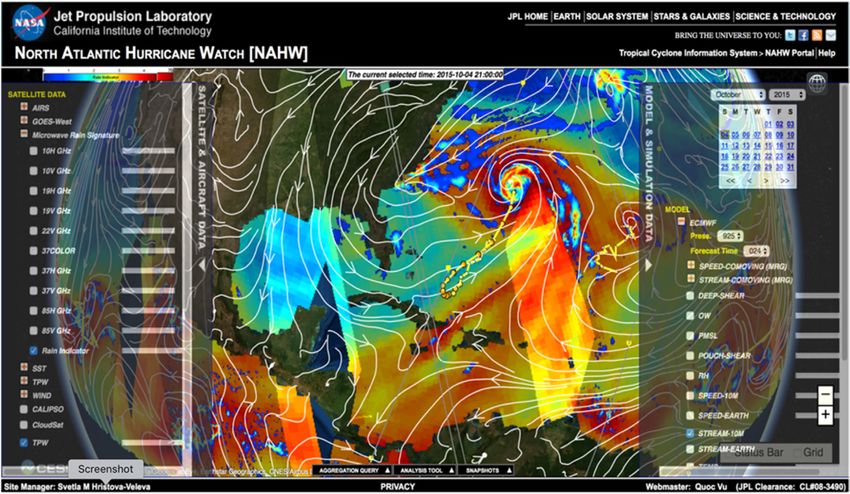
TC_Data_Archive/) offers both digital data and imagery that are subset to the domain and
time of interest, thus greatly reducing the volume of unwanted data. This makes the TCDA a
valuable source to quickly build statistics in support of research, forecast improvement, and
algorithm development (e.g., Hristova-Veleva et al. 2014; Wu et al. 2012).
   Table 1 presents a summary of the spatial and temporal coverage for all components of TCIS.
The NAHW portal is the longest-running TCIS interactive portal. It contains data since 2012,
though with somewhat variable coverage and product selection. The CPEX portal was run in
support of the 2017 NASA CPEX field campaign and contains data covering the specific domain
of interest, collected during the period 15 May–15 July 2017. The CPEX-AW portal, supporting
NASA’ s CPEX-AW 2021 field campaign, is active now, and will continue collecting data through
2022. The CAMP2Ex portal has been running since 15 August 2017. However, it was under
development in the first year and a half. It has been running with a full set of data since July

                                                                                                             Downloaded from http://journals.ametsoc.org/bams/article-pdf/101/10/E1718/5011864/bamsd190020.pdf by NOAA Central Library user on 02 November 2020
2019. The TCDA contains global satellite observations of TC, covering the period 1999–2010.
   Science-wise, TCIS can be used as the empirical basis for a number of research directions
aimed to advance our knowledge of hurricanes. The three critical pathways to hurricane
forecast improvement that can be assisted by the system are (i) improved understanding of
physical processes, (ii) validation and improvement of hurricane models through the use of
satellite data, and (iii) development and implementation of new techniques for assimilation
of satellite observations inside the hurricane precipitating core (e.g., Haddad et al. 2015).
TCIS can be used in each one of the three directions thanks to the unique subsetting and
coregistration of multiparameter observations and model output.

Data in TCIS
As mentioned, TCIS contains both observations and model forecasts. Figure 1 shows several
of the key datasets (described below) and the complementary nature of the information they
carry. It illustrates how these diverse data can be combined to capture the most important
characteristics of the environment and the storm structure, depicting the confluence of factors,
closely related with Hurricane Joaquin (2015), that led to the historic South Carolina floods
of 1–5 October 2015. While Joaquin did not make a landfall in the United States but in the
Bahamas (where it was devastating), it played a critical role in U.S. flooding by generating a
plume of tropical moisture. The interaction of the hurricane circulation with the large-scale
synoptic flow produced a moisture river that was persistently pushed toward the U.S. coast
over a week-long period. This resulted in record rainfall over portions of South Carolina. Some
areas experienced more than 20 inches (1 in. = 2.54 cm) of rainfall over the 5-day period. Many
locations recorded rainfall rates of 2 in. h−1. Flooding from this event resulted in 19 fatalities.
South Carolina State Officials said damage losses were $1.492 billion (NOAA/NWS 2016).

The observational data. The observational data of TCIS contain products from a number
of NASA, NOAA, and international satellites pertaining to the cloud and precipitation
structure of the storms, the environment in which the storms develop and evolve, and
the air–sea interactions that provide the
fuel for the storms. In addition, TCIS con- Table 1. Summary of the spatial and temporal coverage
tains the best track data for the tropical  for all components of TCIS. The domain of the NAHW has
                                            expanded over the years. Given are the dimensions of the
cyclones that occurred within the time
                                            current domain.
range and the spatial domain of each of
                                             Portals        Temporal coverage              Domain
the individual portals. Most importantly
                                             NAHW         2012–present              10°S–60°N, 175°W–0°
in terms of user experience, the best track
                                             CAMP2Ex      2018–present              15°S–35°N, 40°E–180°
data are organized in a database that can
                                             CPEX         15 May–15 Jul 2017        10°–40°N, 45°–100°W
be searched by the year and the name of
the tropical storm.                          TCDA         1999–2010                 Global

AMERICAN METEOROLOGICAL SOCIETY                                               O C TO B E R 2 0 2 0   E1722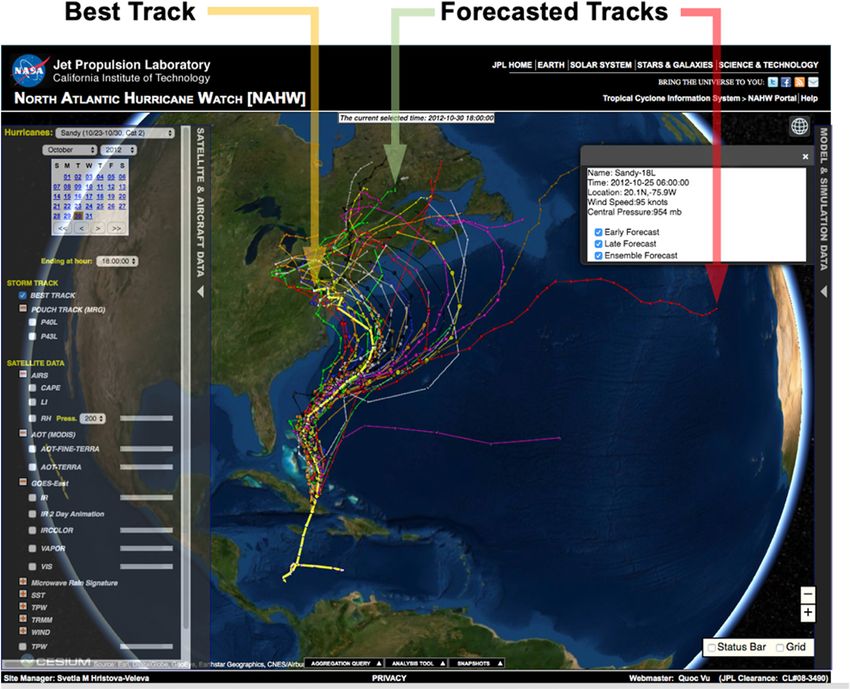
Downloaded from http://journals.ametsoc.org/bams/article-pdf/101/10/E1718/5011864/bamsd190020.pdf by NOAA Central Library user on 02 November 2020
Fig. 1. The historic South Carolina floods of 1–5 Oct 2015 as depicted by observations and models in the
NAHW. Illustrated is the variety of observational and model data available in the portal. The figure shows
the different ways in which the data can be interrogated. Displayed are observations of TPW, overlaid
with the RI, a special product developed to depict rain intensity and variability as a function of PMW
observations. The model flow is overlaid on top to show the interaction of the hurricane circulation with
the large-scale synoptic flow, producing a moisture river that was persistently pushed toward the coast,
over a week-long period. Note that the RI is displayed with transparency, to illustrate the width of the
swath and to help separate regions with available observations (and no rain), appearing darker, vs the
brighter regions for which there was no observation of the rain.

      Table 2 lists the specific satellite observations, including their sources, that have been
   routinely included in all interactive portals of TCIS. It should be pointed that the cam-
   paign portals (CPEX and CAMP2Ex) might have alternative or additional satellite observa-
   tions (e.g., CAMP2Ex portal has geostationary observations from Himawari and includes
   specific-to-the-campaign Fire Hotspots, depicting the satellite-determined sources of
   smoke and aerosols).
      Below is a quick summary of the data types. It is then followed by discussions on the value
   of each of the data types and illustrations of their potential use.
      As mentioned above, the satellite observations included in the portal have the purpose to
   describe the storm and its environment, pertaining to the following:

   (i)		The precipitation structure of the storms that is captured well by passive microwave (PMW)
         brightness temperatures from a number of different instruments that are all part of the Global
         Precipitation Measuring (GPM) mission: Instruments like TMI, GMI, ASMR-E, AMSR2, and
         SSMIS provide high information content, piercing through the cloud tops, to depict details
         on the vertical structure, the evolution of intensity, and the organization of convection in the
         storms. TCIS also includes infrared (IR) data from AIRS and geostationary observations. While
         the geostationary data have even better temporal resolution, they often fail to discriminate
         between dead or decaying convection and a developing one. Incorporating the less frequent
         PMW observations from polar-orbiting satellites provides this complementary and important
         information, giving a comprehensive view of the storm development.

   AMERICAN METEOROLOGICAL SOCIETY                                                 O C TO B E R 2 0 2 0   E1723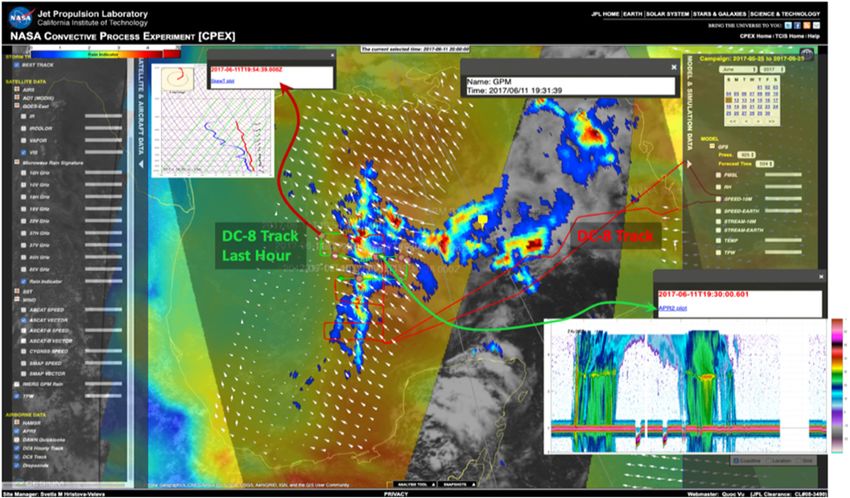
Table 2. Types and sources for the satellite data routinely included in TCIS. The color coding reflects
atmospheric composition (red), thermodynamics (green), surface (blue), and convective activity
(black).
 Sensors                                                  Data products                                  Data sources
 MODIS                                   Aerosol optical thickness                              LAADS DAAC
 AIRS                                    Temperature and water vapor—vertical profiles          GES DISC
 MHS, ATMS (NOAA, MetOp, NPP)            Total precipitable water                               NOAA/NESDIS, CLASS
 MUR-SST                                 Sea surface temperature                                JPL PO.DAAC
 QuikSCAT; RapidScat                     Surface vector winds over the ocean                    JPL PO.DAAC
 ASCAT-A; ASCAT-B                        Surface vector winds over the ocean                    KNMI/JPL PO.DAAC
 ScatSat                                 Surface vector winds over the ocean                    JPL product from ISRO
                                                                                                observations

                                                                                                                                       Downloaded from http://journals.ametsoc.org/bams/article-pdf/101/10/E1718/5011864/bamsd190020.pdf by NOAA Central Library user on 02 November 2020
 SMAP                                    Surface wind speed over the ocean                      JPL product
 CYGNSS                                  Surface wind speed over the ocean                      JPL product
 GOES-E and GOES-W;                      Geostationary IR (~11- and ~6.7-μm water               NOAA/CLASS; NRL; CIMSS-SSEC
 Himawari-AHI                            vapor); visible
 TMI, GMI, AMSR-2, SSM/I, SSMIS          Brightness temperatures 10–89 GHz                      NASA GSFC PPS GPM
 TMI, GMI, AMSR-2, SSMIS                 Rain Indicator: 2D maps of relative rain intensity     JPL Derived Product
 GPM-IMERG                               Integrated multi-instrument 1-h rain totals            NASA GSFC PPS GPM
 Best track                              Hurricane location, estimated maximum wind             NCAR/RAL*
                                         speed and minimum MSLP, updated every 6 h

 TC DATA ARCHIVE ONLY
 OMI                                     Ozone–total column                                     GES DISC
 MLS                                     Ozone–vertical profiles                                GES DISC
 MLS                                     Temperature, water vapor–vertical profiles             GES DISC
 MLS                                     Ice content–vertical profiles                          GES DISC
 TRMM-PR                                 Precipitation; radar reflectivity–3D structure         NASA GSFC PPS GPM
 CloudSat                                Clouds and precipitation; radar backscatter;           CloudSat Data Processing
                                         vertical profiles                                      Center/CSU
* The NCAR/RAL was chosen as the source of the operational best track data because of the accuracy, completeness, and ease of
 access to the data. According to NCAR’s Real Time Guidance description (http://hurricanes.ral.ucar.edu/realtime/) “for the North
 Atlantic, Eastern Pacific, and Central Pacific basins, the [Tropical Cyclone Guidance Project] TCGP is just providing the b-decks
 obtained from the National Hurricane Center. For the other global basins, TCGP constructs the b-decks using information found
 in the tcvitals files that the U.S. Navy’s Joint Typhoon Warning Center (JTWC) provides to the U.S. National Oceanographic and
 Atmospheric Administration’s National Center for Environmental Prediction (NOAA/NCEP) for the purpose of initializing the model.”
 The “b-deck” is “a data file that contains a complete history of the past estimates of the storm’s center locations, intensity, and
 other parameters at the 6-hourly synoptic times: 0000, 0600, 1200, and 1800 UTC (note that the files can also contain informa-
 tion about the storm at off-synoptic periods, such as the time of landfall). During hurricane season, these files contain the best
 operational estimates of these parameters, and so are called the ‘operational best tracks’.”

(ii)		Thermodynamics: Total precipitable water from AMSU-A, MHS, and ATMS and vertical
       profiles of vapor and temperatures from AIRS characterize the environment and the
       storm-induced perturbations.
(iii)	Atmospheric composition: The aerosol optical thickness/depth indicates the variability
       in the aerosol content, which has implications for the microphysical composition of the
       storm that develops in this environment.
(iv)	Air–sea interactions: The global high-resolution SST estimates from merged satellite
       (NOAA/POES AVHRR, TMI, GMI, AMSR-E, AMSR2) and in situ measurements characterize
       the storm’s energy source and potential. They complement surface wind vector observa-
       tions from QuikSCAT, RapidSCAT, ASCAT-A/-B, ScatSat, and scatterometers to depict the
       SST–wind interactions, including surface convergence/divergence and vorticity of the

AMERICAN METEOROLOGICAL SOCIETY                                                                         O C TO B E R 2 0 2 0   E1724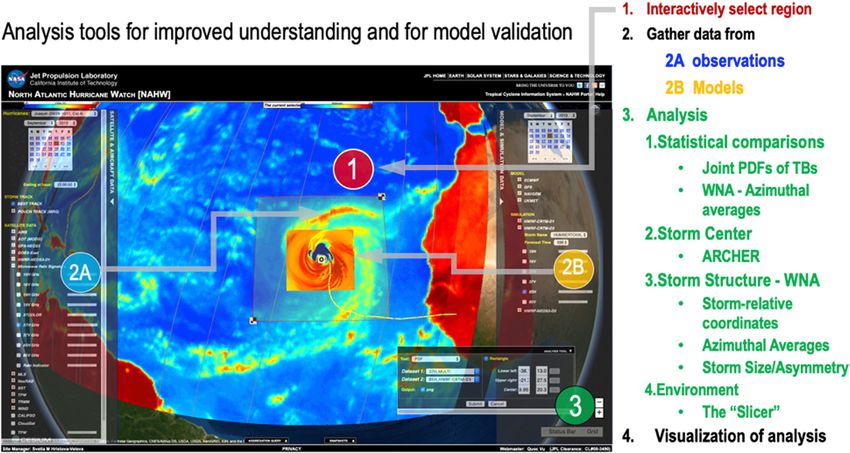
systems. SMAP and Cyclone Global Navigation Satellite System (CYGNSS) surface wind
    speeds are also included to characterize the surface fluxes.

    Following is a discussion on the information content of the different data types with some
illustrations about their possible use within the TCIS.
    The cloud and precipitation structure of the storms, including the convective processes,
is best captured by two complementary observing systems: geostationary observations in
visible and IR wavelengths, and passive microwave observations from low-Earth-orbiting
(LEO) satellites. The main advantage of the geostationary observations is their high tempo-
ral and spatial resolutions. Indeed, imagery from geostationary satellites are widely used in
day-to-day operational forecasting to visualize the evolution of a hurricane. However, such
data depict mainly the structure of the cloud tops, with little information on the storm struc-

                                                                                                           Downloaded from http://journals.ametsoc.org/bams/article-pdf/101/10/E1718/5011864/bamsd190020.pdf by NOAA Central Library user on 02 November 2020
ture below, thus often failing to discriminate between decaying clouds and the ones that are
developing under the cloud canopy. To be able to sense below the cloud cover, one can use
passive microwave observations that provide complementary information. Such observations
are available from a number of satellites at LEO orbits (NASA’s GMI, JAXA’s AMSR-2, NOAA’s
SSMIS series, Suomi NPP ATMS). While not as frequent as the geostationary data, the constel-
lation of similar instruments, each with wide swaths, observes every point in the tropics on
average every 80 min and allows the detection of convection that is growing underneath the
cloud cover. These observations carry significant potential, when used together, to provide
detailed information to capture the evolution of intensity and organization of convection in
the storms, even providing some limited information on the vertical structure of clouds and
precipitation inside hurricanes.
    Examples are the passive microwave data, which are available under the “Microwave Rain
Signature” from the “Satellite Data” menu on the left (Fig. 1). Presented are the 6-h composite
images that include observations from a number of radiometers. Such compositing allows for
quick overview of the cloud and precipitation structure over the entire ocean basin, revealing
the interactions between storms that occur simultaneously and in close proximity. Available
for display are the brightness temperatures at a number of different frequencies and polar-
izations, each providing a different view, as each is sensitive to different characteristics of
the precipitation [e.g., amount of precipitation, its phase (liquid vs frozen)]. For example, the
difference between the horizontal and vertical polarization of a given channel signifies the
presence and the intensity of the precipitation. This is because the precipitation particles in
the atmosphere reduce the polarization difference in the highly polarized radiation emitted
from the ocean surface. Hence, the polarization difference is representative of the precipita-
tion itself. Furthermore, the different frequencies interact differently with the precipitation
particles. Microwave signals at the top of the atmosphere can be classified into two categories:
(i) an emission signal that is dominant at lower frequencies and shows a warming signature in
the presence of rain, especially in the absence of frozen particles, and (ii) a scattering signal
that is dominant at higher frequencies and exhibits a cooling signature in the case of heavy
precipitation with significant amount of frozen particles. Because the emission signal tends
to dominate in light rain conditions while the scattering signal tends to dominate in heavy
rain cases, both have to be considered to cover the entire rainfall spectrum.
    Overlaying the different frequencies with variable transparency easily creates a fused
product that allows one to see whether and where the intense surface rain is associated with
intense frozen precipitation aloft.
    Probably the best way to quickly grasp the organization and intensity of the precipitation
is to display the Rain Indicator (RI; Hristova-Veleva et al. 2013), found at the bottom of this
list. It combines, nonlinearly, brightness temperatures from a number of channels to form a
single measure that presents a cohesive depiction of the rain and the graupel above and has

AMERICAN METEOROLOGICAL SOCIETY                                             O C TO B E R 2 0 2 0   E1725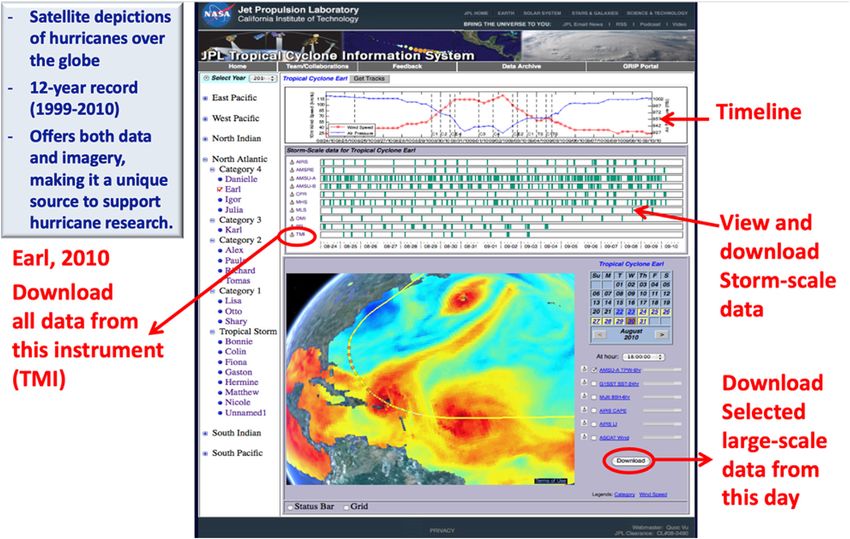
characteristics similar to that of a 2D radar image (Hristova-Veleva et al. 2018b). As Fig. 1
illustrates, the Rain Index shows a capability to depict small-scale features and to capture
both regions of light precipitation as well as regions of heavy rain, thus providing information
on the storm structure and a first-order estimate of the intensity of the precipitation. These
features of the Rain Index make it a desirable tool to use in studying the 2D distribution and
variability of precipitation as it provides a 2D structure, much like a 2D map of radar reflec-
tivity (Hristova-Veleva et al. 2013, 2016).
   It is important to note that the RI can be computed not only from observations but also
from models. The inputs to the RI, in the case of the models, are the synthetic brightness
temperatures that can be produced from the model fields, as described in more detail in the
“Model forecasts” section. This allows for a more direct comparison between models and
observations that is based on the satellite-like depiction of the modeled storms.

                                                                                                             Downloaded from http://journals.ametsoc.org/bams/article-pdf/101/10/E1718/5011864/bamsd190020.pdf by NOAA Central Library user on 02 November 2020
   PMW observations have proven to be fundamental to enhance our physical understanding
(and thus the forecasting) of storm evolution (Kieper and Jiang 2012; Tao and Jiang 2015;
Wimmers et al. 2019; Cossuth et al. 2012; Hristova-Veleva et al. 2011, 2012a). Bringing to-
gether, within the same system, the less frequent PMW observations from polar-orbiting (or
LEO) satellites with the geostationary data provide complementary and more quantitative,
physically based information on the clouds, yielding a comprehensive view of hurricane
development, as high temporal and spatial resolution is combined with better hydrometeor
discrimination capabilities.

Understanding the environment in which the storms grow is a critical component of hurricane
research. To describe this environment, we incorporate data that capture the thermodynamics
and the aerosol loading of the atmosphere. The more important subsets here are the total
precipitable water (TPW) data from a number of microwave sounders (e.g., AMSU-A, MHS,
ATMS) and the vertical profiles of water vapor and temperature from AIRS, which are used
to characterize the thermodynamic environment and the storm-induced perturbations (the
storm-induced modification of the shear and the removal of instability that result from the
fluxes of momentum and sensible and latent heating that accompany the convective pro-
cesses). The distribution of temperature and water vapor are known to play a key role in
hurricane development, and their precise determination is crucial for predicting hurricane
genesis and intensity changes, trajectory, and landfall location (e.g., Chen and Zhang 2013;
Montgomery et al. 2009; Wang 2012; Wu et al. 2012).
   Figure 2 provides an illustration on how the aerosol and the thermodynamic state of the
environment can be revealed in TCIS. In this example, the aerosol optical thickness from
MODIS is overlaid with the estimates from AIRS of the convective available potential energy
(CAPE) shown as dots that are colored by the CAPE value. Clicking on each dot gives the user
the CAPE value with the time and location of the observation. In addition, the estimated verti-
cal structure of the temperature and humidity are available as a skew-T plot.
   Another valuable category of data that has not been systematically exploited comprises
satellite data on aerosol loading of the environment. Observations from MODIS on Aqua and
Terra are also integrated into the system and can be readily used to elucidate the role of aerosols
in the radiative and microphysical processes yielding hurricane genesis and intensification
(Braun et al. 2013; Nowottnick et al. 2018; Rosenfeld et al. 2012).
   Air–sea interactions are recognized as critical to improve modeling (e.g., Chen et al. 2007;
Moon et al. 2007; Bender et al. 1993; Bender and Ginis 2000), and in order to advance in-
vestigation into this realm, the system includes the global high-resolution SST estimates
from merged satellite (NOAA/POES AVHRR, TMI, GMI, AMSR) and in situ measurements
(Chin et al. 2017). These can be used to characterize the storm’s energy source and poten-
tial, and can complement surface wind observations from QuikSCAT, ASCAT, OceanSat

AMERICAN METEOROLOGICAL SOCIETY                                               O C TO B E R 2 0 2 0   E1726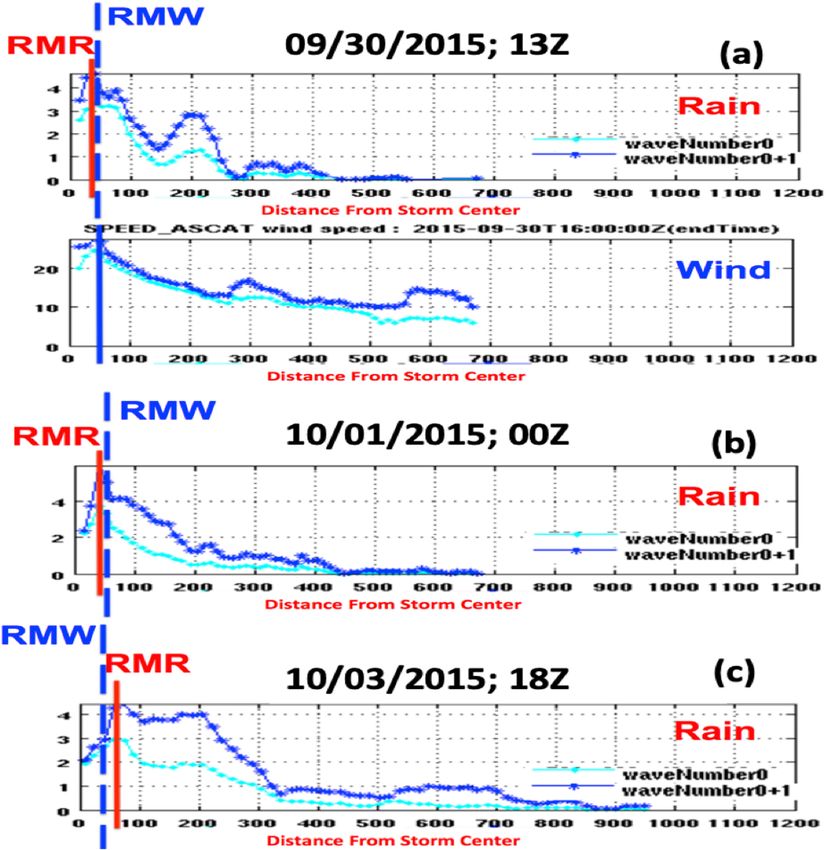
Downloaded from http://journals.ametsoc.org/bams/article-pdf/101/10/E1718/5011864/bamsd190020.pdf by NOAA Central Library user on 02 November 2020
Fig. 2. Illustration of how the portal can be used to investigate the thermodynamic structure of the envi-
ronment together with the aerosol loading. The image shows a 6-h composite of the aerosol optical thick-
ness (AOT) from MODIS observations (in blue to red colors), together with the geostationary IR data (in
grayscale). Overlaid are two additional fields: the streamlines showing storm-relative flow field at 850hPa
from the 12-h forecast of ECMWF to allow investigation of the type of air that is entering the storm and
the CAPE from AIRS retrievals, shown as place markers (dots) that are color coded by the CAPE value.
Clicking on the place markers allows the user to view the retrieved thermodynamic structure, shown as
a skew-T plot, at the particular location and allows comparison of the vertical profiles of humidity and
temperature at various locations around the storm. Note that the numbers point to the observational
and model data that are shown.

   Scatterometer (OSCAT), and RapidScat scatterometers that directly depict the SST–wind
   interactions (Black et al. 2007; Emanuel 1986, 1999; Knaff et al. 2013; Zhu and Zhang 2006).
      A very important component of TCIS is the inclusion of the best track data, available in
   all three portals. In addition, model tracker forecast tracks are available in the Atlantic and
   east Pacific (Fig. 3). Having the best track data allows researchers to understand the observed
   storm structure and environmental conditions in the context of storm evolution (its intensity
   and life cycle stage).

   Model forecasts. Model forecasts are also an integral part of TCIS. Table 3 lists the forecasts
   models and the individual fields that are included in TCIS.
      Model data provide a dynamically consistent picture of the relationship between the dif-
   ferent characteristics of the storms and the interplay between the environment and the storm
   (e.g., Fig. 4). They contribute critical information on variables that we cannot observe routinely
   (e.g., the 3D structure of the flow). In the end, models are the ultimate tool for testing and
   validation of physical hypothesis regarding hurricane genesis and evolution: discrepancies
   between model simulations and observations indicate areas that need improvement, and
   the actual concrete differences may help to guide where, when, and why the model fails to
   simulate a process. Model data in the TCIS come from a variety of sources but with different
   selection available through the years. The model-richest period was during the Hurricane and
   Severe Storm Sentinel (HS3) campaign (2012–14; each year from 1 August to 1 November).
   Collaboration with the Montgomery Research Group (MRG) resulted in having the meteo-
   rological forecasts from a number of large-scale models [ECMWF, GFS, UKMET, and Navy

   AMERICAN METEOROLOGICAL SOCIETY                                                O C TO B E R 2 0 2 0   E1727
Downloaded from http://journals.ametsoc.org/bams/article-pdf/101/10/E1718/5011864/bamsd190020.pdf by NOAA Central Library user on 02 November 2020 Fig. 3. Best Track data are included in the TCIS portals. The goal is to quickly provide information on the past evolution of the storm. In addition, forecast tracks from a number of models are made available to facilitate the understanding of the forecast uncertainty. The figure shows the best track data for Hur- ricane Sandy as of 29 Oct 2012. Each position is marked by a symbol (circle) whose size and color reflect the intensity of the storm at each 6-h interval. Clicking on any given position opens a small window that displays the name of the hurricane, the time and location of the hurricane, and its intensity in terms of maximum wind speed and minimum surface central pressure. In addition, the window allows the user to display the forecasted tracks from a number of models (each model forecast in a different color), all these forecasts starting at the selected location and time. These model forecasts are arranged in three groups [following Automated Tropical Cyclone Forecast (ATCF) designation]. Clicking on the individual symbols for a given forecast track shows information on the model, the time and location, the forecast hour, and the storm intensity. A very important feature of the TCIS interactive portals is the ability to search for a particular storm, from a database that is displayed under the menu “Hurricanes” at the very top of the “Satellite and Aircraft Data” menu on the left. Selecting a hurricane would then bring the user to the very last day of the storm’s life cycle, showing the entire track. This allows the users to quickly navigate in time to point of their interest. Operational Global Atmospheric Prediction System (NOGAPS)]. The MRG also provided the NAHW with daily analyses that depicted the “Pouch” center and track and computed the storm-relative flow. Such analyses provide critical information in determining the potential for hurricane genesis for each identified tropical disturbance according to the “Pouch theory” (Dunkerton et al. 2009; Montgomery et al. 2010). The Pouch tracks and storm-relative flow were available for all forecast models and forecast times. The Pouch tracks were made available in the same format as the best tracks to facilitate comparison between observed circulations and their model predictions (Fig. 4). AMERICAN METEOROLOGICAL SOCIETY O C TO B E R 2 0 2 0 E1728
Table 3. Types and sources of model fields available in TCIS. For each model, the specific portals that
provide the data are listed. Period of availability is given in parentheses.
Models                                                   Data products                                   Data sources
GFS                              - T emperature, relative humidity, horizontal wind at standard         NOMADS/
- NAHW                             pressure levels                                                       NCEP/NOAA
- CPEX                           - 2D fields:                                                            MRG
- CAMP2Ex                             ° 10-m winds, 2-m temperature, SST, MSLP
                                      ° Integrated precipitable water; shear (deep and low level)
ECMWF                            - T emperature, relative humidity, horizontal wind at standard         MRG
- NAHW (2012–16)                   pressure levels
                                 - 2D fields:
                                      ° Integrated precipitable water
                                      ° Shear (deep and low level)

                                                                                                                              Downloaded from http://journals.ametsoc.org/bams/article-pdf/101/10/E1718/5011864/bamsd190020.pdf by NOAA Central Library user on 02 November 2020
UKMET                            - T emperature, relative humidity, horizontal wind at standard         MRG
- NAHW (2012–14)                   pressure levels
                                 - 2D fields:
                                      ° Integrated precipitable water
                                      ° Shear (deep and low level)
ECMWF                            - T emperature, relative humidity, horizontal wind, vertical           CAMP2Ex Team
- CAMP2Ex (2019–present)           velocity at standard pressure levels
                                 - 2D fields:
                                      ° 10-m winds, 2-m temperature, 2-m dewpoint, SST, MSLP
                                      ° Integrated precipitable water
                                      ° Total precipitation
GEOS5                            - T emperature, relative humidity, horizontal wind, vertical           NCCS/GSFC
- CAMP2Ex (July 2019–present)      velocity at standard pressure levels                                  MDISC
- NAHW (October 2019–present)    - 2D fields:
                                      ° 10-m winds, 2-m temperature, 2-m humidity
                                      ° Integrated precipitable water; integrated ice water path;
                                         integrated liquid water
                                      ° Aerosol optical depth/thickness (AOD) total
                                      ° AOD coarse mode
                                      ° AOD fine mode
HWRF (regional model)            - Synthetic microwave brightness temperatures                           EMC/NCEP/
- NAHW (2013–15)                 - Rain Index                                                            NOAA

   In addition, collaboration with the Environmental Modeling Center (EMC) resulted in the
integration of the hurricane operational forecast produced by the high-resolution regional
Hurricane Weather Research and Forecast (HWRF) model into TCIS. A moving-domain
strategy was followed to better capture hurricane dynamics and mitigate the effects of lat-
eral conditions. The most important benefit of the collaboration was the inclusion of the
synthetic brightness temperatures produced using the Community Radiative Transfer Model
(CRTM) under development at the Joint Center for Satellite Data Assimilation (JCSDA). CRTM
is an instrument simulator that took as input the hydrometeors, temperature, humidity, and
surface conditions as forecasted by the HWRF model. Having side-by-side observed and the
simulated passive microwave brightness temperatures allowed for direct comparison between
models and observations. It also facilitated the comparison of the observed and simulated
storm structure as revealed by the RI and analyzed by the hurricane-specific online analyses
tools described below.
   In recent years the model data available in the NAHW have focused on the GFS large-scale
model forecasts. However, recently, as part of CAMP2Ex portal development, the team gained
new ability in incorporating other models (ECMWF, GEOS-5) and creating ensemble means.
Some other new features have also been developed (e.g., overlaying coasts, synchronizing

AMERICAN METEOROLOGICAL SOCIETY                                                                O C TO B E R 2 0 2 0   E1729
Downloaded from http://journals.ametsoc.org/bams/article-pdf/101/10/E1718/5011864/bamsd190020.pdf by NOAA Central Library user on 02 November 2020 Fig. 4. Model relative humidity at 925 hPa from the 12-h forecast from ECMWF is colored. It is overlaid with the storm-relative flow (courtesy of MRG) from the same model forecast. In the background is the visible imagery from geostationary satellite observations. The model-forecasted relative humidity is dis- played with transparency, allowing the user to see the correlation between the model relative humidity and the observed low-level clouds. model and observation dates, option to download KML/KMZ tar files with the data being viewed at a particular time) These will soon be incorporated in the NAHW portal as well. TCIS allows quick access to both individual and merged data and offers seamless tools to combine apparently dissimilar sources. From data to research: Interactive visualization and online analysis tools In terms of user experience, TCIS integrates a variety of satellite observations from a number of instruments with the forecasts of several models in a virtual globe. To help users navigate the system, we recently developed a tutorial video for the NAHW portal (https://nahw.jpl.nasa.gov/NAHW_Tutorial_Video.mp4). A similar tutorial with a focus on the CAMP2Ex portal (https://camp2ex.jpl.nasa.gov/CAMP2Ex_Tutorial_Video.mp4) is also available. Below is an illustration of the several features that can help the users. Menus. Figure 1 provides an illustration of the wealth of data available in the NAHW por- tal. User choice is driven by two independent menus—one for the observations (left panel) and one for the model data (right panel). Each menu is driven by an independent calendar, allowing the user to display observations together with the user-defined model forecast cycle or forecast hour. Discovering a storm. Figure 3 demonstrates a very important feature of the TCIS interactive portals, namely, the ability to search for a particular storm from a database that is displayed under the menu “Hurricanes” at the very top of the “Satellite and Aircraft Data” menu on the AMERICAN METEOROLOGICAL SOCIETY O C TO B E R 2 0 2 0 E1730
left (Sandy in Fig. 3). Selecting a hurricane would then bring the user to the very last day of
   the storm’s life cycle, showing the entire track. This allows the users to quickly navigate in
   time to point of their interest.

   Overlays. TCIS also contains an interactive system for visualization of highly complex systems
   (storms that evolve as the result of nonlinear multiscale interactions) that allows for user-
   driven overlay of different parameters, with transparencies. This architecture supports inter-
   rogation of observations to reveal relationships between different environmental and storm
   characteristics (e.g., precipitation and surface wind, forecasted flow, and observed relative
   humidity) and for comparison of forecasted and observed parameters. Figure 4 presents an
   example of how the portal can be used to interrogate models and observations to understand
   how different features are related. In this case, an interesting structure often observed in the

                                                                                                                Downloaded from http://journals.ametsoc.org/bams/article-pdf/101/10/E1718/5011864/bamsd190020.pdf by NOAA Central Library user on 02 November 2020
   model forecasts was investigated. Dr. Tim Dunkerton (2014, personal communication) called
   it “leopard’s fur” pattern in ECMWF boundary layer relative humidity (RH) because of the
   stripe-like appearance of the alternating narrow regions of high and low relative humidity. The
   model/observations overlay corroborates his suggestion that “shallow overturning circula-
   tions are responsible for vorticity and relative humidity anomalies alike in these regions.” The
   low-level clouds in the visible imagery are well correlated with the model’s relative humid-
   ity and vorticity fields (not shown). The ability to overlay products/variables, with different
   transparency, proved very helpful in this case.

   Analysis tools. Most importantly in terms of investigating the physics, TCIS has a set of online
   analysis tools that work both with observations and models and that allow quick investiga-
   tion of storm structure and evolution (Figs. 5–8). Geospatial data searches and analysis tools
   work together through intuitive user interfaces. The framework we adopted has the follow-
   ing critical components: (i) subset and reformat data into consistent format, (ii) develop a
   geospatial database architecture to support the analysis tools, (iii) develop the user interface
   and its integration with the database and the tools—we call this the “subsetting tool,” and
   (iv) develop the analysis tools.

Fig. 5. List of the main hurricane-specific analysis tools of the system: WNA, ARCHER, the Slicer, and the
computation of the joint statistics of brightness temperatures from any two channels (the joint PDFs).

   AMERICAN METEOROLOGICAL SOCIETY                                               O C TO B E R 2 0 2 0   E1731
Downloaded from http://journals.ametsoc.org/bams/article-pdf/101/10/E1718/5011864/bamsd190020.pdf by NOAA Central Library user on 02 November 2020
Fig. 6. Illustration of how the horizontal fields at different pressure levels and the vertical Slicer tool can
be used to evaluate the environment around the storm and to compare how accurately it is depicted in
the model forecasts. (top left) The 850-hPa relative humidity in the GFS analysis. (top right) As in the
top-left panel, but in the ECMWF analysis. We see generally similar fields in both models but with a
better resolution and more detail in the ECMWF analysis. (bottom left) Retrievals from AIRS observa-
tions, however, show a field with more moisture just north of the storm. (bottom right) To evaluate the
vertical structure in the observations and the two models, we run the Slicer tool along the black line
in all three fields. Indeed, the comparison between the observations and the two models shows a dry
tendency for the models.
Figure 5 summarizes the concept and lists the main analysis tools of the system—the Wave
Number Analysis (WNA), Automated Rotational Center Hurricane Eye Retrieval (ARCHER;
Wimmers and Velden 2016), the computation of the joint statistics of brightness temperatures
from any two channels (the PDF tool), and the “Slicer.” Table 4 provides more information on
each of the tools, describing their purpose and inputs.
Tropical Cyclone Data Archive. As mentioned earlier, in addition to the three interactive
portals for user-driven visualization and online analyses, TCIS includes a static stand-alone
searchable MySQL-based TCDA (https://tcis.jpl.nasa.gov/data/TC_Data_Archive/) that contains a
12-yr global record (1999–2010) of satellite observations of tropical cyclones from a number
of instruments and missions pertaining to (i) the thermodynamic and microphysical structure
of the storms, (ii) the air–sea interaction processes, and (iii) the larger-scale environment. The
digital data (and imagery) are subset to the domain and time of interest, thus greatly reduc-
ing the volume of unwanted data. The data are organized by ocean basin, year, and storm.
As such, the TCDA provides an easy way to determine when coincident observations from
multiple instruments are available—a very valuable and unique feature that saves researchers
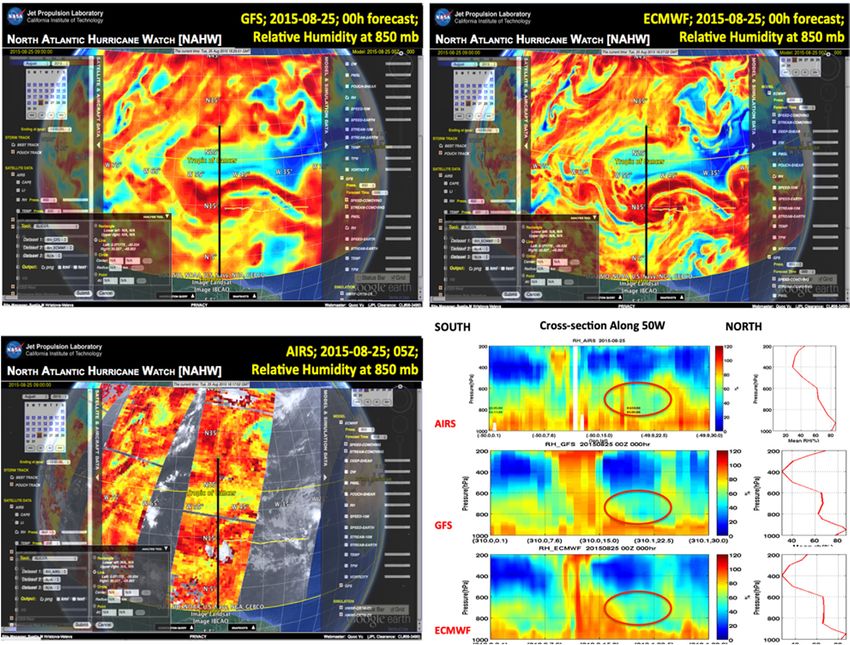
AMERICAN METEOROLOGICAL SOCIETY O C TO B E R 2 0 2 0 E1732Downloaded from http://journals.ametsoc.org/bams/article-pdf/101/10/E1718/5011864/bamsd190020.pdf by NOAA Central Library user on 02 November 2020 Fig. 7. (top) The NAHW portal and how the WNA tool can be initiated and (bottom) the results from the WNA of the storm’s precipitation structure (as depicted by the RI on 10 Oct 2015). The four bot- tom panels show (in clockwise direction from top left): the full field, the representation as depicted by wavenumbers 0 and 1, the residual, and the radial distribution of wavenumber 0 (cyan) and the amplitude of wavenumbers 0 and 1 (blue) in the top line plots and the radial distribution of the direction in the peak of wavenumber 1 (green) in the bottom line plot. The distance between the two curves in the top line plot signifies the degree of storm asymmetry: the larger the distance, the more energy there is in wavenumber 1, and the more asymmetric the storm is. The green curve shows the azimuthal location (in degrees from north) of where the peak in wavenumber 1 is, as a function of distance from storm center. By simply subtracting the direction of storm motion, or the direction of the environmental shear, this green curve will represent where the peak of the field is, in storm-relative AMERICAN METEOROLOGICAL SOCIETY O C TO B E R 2 0 2 0 E1733
coordinates with dynamical significance. Several recent studies (e.g., Chen and Gopalakrishnan 2015;
Rogers et al. 2016) have pointed to the significance of the azimuthal location of the deep convection
with respect to the shear vector and the presence or absence of counterclockwise propagation of
this convective peak. Analyses of the data reflected by the green curve will prove very informative
in these types of studies.

 a significant amount of time dedicated to discovering the data alone. Particularly useful in
 this regard is a user interface we developed in the past (Figs. 9, 10). This interface (https://tropi-
 calcyclone.jpl.nasa.gov/tcda/index.php) is now undergoing upgrades and while being functional,
 it is expected to be further improved by December 2020. In addition, work is underway to
 extend the 12-yr record. The purpose of the TCDA is to facilitate the quick build of statistics,
 including development of statistical relationships between different parameters, in support of

                                                                                                                Downloaded from http://journals.ametsoc.org/bams/article-pdf/101/10/E1718/5011864/bamsd190020.pdf by NOAA Central Library user on 02 November 2020
 research, forecast improvement, and algorithm development (e.g., Hristova-Veleva et al. 2014;
 Wu et al. 2012; F. J. Tapiador et al. 2019, unpublished manuscript).

 Examples of applications
 Tropical cyclones are the product of complex multiscale nonlinear interactions. The role of the
 environment in influencing an RIC has long been recognized (e.g., Kaplan and DeMaria 2003;
 Kaplan et al. 2010). However, as noted above, recent research has shown that convective-scale
 processes in the hurricane core might also play a crucial role in determining the rapid change in
 TC intensity (e.g., Gray 1998; Chen and Zhang 2013; Rogers et al. 2013; Guimond et al. 2010).
 A third set of controls is the interaction between the storm-scale and the large-scale processes.
    The overarching goal of TCIS is to support investigations of these complex multiscale
 interactions. To achieve that goal, TCIS brings together multiparameter data to help better
 understand the large-scale and storm-scale processes associated with tropical convection in
 general, and, in particular with hurricane genesis, track and intensity changes. The more
 specific goals are fourfold: (i) to allow near-real-time (NRT) interrogation of a large number of
 atmospheric and ocean variables; (ii) to allow for easy evaluation of models by comparison
 with existing observations; (iii) to serve as a very rich information source during the analysis
 stages of the field campaigns—both the CPEX and the CAMP2Ex portals have already been used
 to characterize the large-scale environment of the airborne observations taken during the 2017
 CPEX and the 2019 CAMP2Ex campaigns (Fig. 11); (iv) to support in-depth posthurricane re-
 search. Indeed, posthurricane analyses of a number of storms (e.g., Hristova-Veleva et al. 2016)
 has led to the development of possible satellite-based predictors for hurricane RIC—a topic of
 intense research, with potential for supporting decision-making during disaster management
 (e.g., Bhalachandran et al. 2018, 2019; Hristova-Veleva et al. 2018a; F. J. Tapiador et al. 2019,
 unpublished manuscript).

 RIC: Focus on the hurricane core. A recent composite study (Rogers et al. 2013) and a case
 study (Reasor et al. 2009) of airborne Doppler observations have indicated that a very im-
 portant aspect of the hurricane RIC process might involve the location of the convective
 activity with respect to the radius of maximum wind (RMW). Motivated by this, the TCIS
 system has been used to perform analyses of satellite hurricane observations, looking for
 predictors of RIC. The system allows examination of the joint behavior of the structure of
 the 2D precipitation and the near-surface wind for TCs that undergo rapid intensification
 and rapid decay using satellite observations of Atlantic hurricanes. Using the online WNA
 (e.g., Vukicevic et al. 2014) tool available in the TCIS system, a number of case studies were
 carried out (e.g., Figs. 7, 8) and potential predictive capabilities for hurricane RIC were found
 (Hristova-Veleva et al. 2016). These studies uncovered the importance of monitoring the
 amount of precipitation inside versus that outside the radius of maximum wind—precipitation

 AMERICAN METEOROLOGICAL SOCIETY                                                 O C TO B E R 2 0 2 0   E1734
You can also read