POSSIBILITIES Redefining the - OCTOBER 22 - 24 | TORONTO, ON - Canadian Institutional Research and Planning Association
←
→
Page content transcription
If your browser does not render page correctly, please read the page content below

Redefining the
POSSIBILITIES
OCTOBER 22 - 24 | TORONTO, ON

1 | CIRPA 2017 • Redefining the Possibilities

WELCOME
TO T.O.
It gives me great pleasure to extend greetings and a warm welcome to
everyone attending CIRPA 2017, the Canadian Institutional Research and
Planning Association’s conference.

As Canada’s largest city and the fourth largest in North America, Toronto is a
global centre for business, finance, arts and culture and is dedicated to being
a model of sustainable development. I welcome everyone to our city and
encourage you to enjoy Toronto at this time of year and learn about our
vibrant neighbourhoods.

On behalf of Toronto City Council, please accept my best wishes for an
informative and enjoyable event.

Yours truly,

John Tory
MAYOR OF TORONTO

Redefining the
                                          POSSIBILITIES

                                       CONFERENCE COMMITTEE

                                CONFERENCE CHAIR
                                HENRY DECOCK Seneca College

                                PROGRAMING COMMITTEE
                                HENRY DECOCK Seneca College
                                PINA MARINELLI-HENRIQUES Seneca College
                                MATTHEW DUNCAN Seneca College
                                URSULA MCCOY Seneca College
                                CHARLOTTE ALEXANDER College of the North Atlantic
                                ANNE MOTTE University of Montreal
                                NEIL CHAKRABORTY University of Toronto
                                PETER MCNAMARA University of Toronto
                                SUZANNE DWYER George Brown College
                                ASHLEY BLACKMAN Red River College
                                STEPHANIE MCKEOWN University of British Columbia

                                LOCAL ARRANGEMENTS
                                HENRY DECOCK Seneca College
                                PINA MARINELLI-HENRIQUES Seneca College
                                MATTHEW DUNCAN Seneca College
                                LIMIN CHEN Seneca College
                                CARMELINDA DEL CONTE Mohawk College

                                REGISTRATION & WEBSITE

CONTENTS
                                RANDY ROLLER University of Manitoba
                                MATTHEW DUNCAN Seneca College

                                SPONSORSHIP
                                MIKE KRYWY Red River College
President’s Message | 4
Sponsors | 4                    LOGO AND PROGRAM DESIGN
Conference at a Glance | 6      MATTHEW DUNCAN Seneca College
Keynote Speakers | 8
Confernce Tracks | 10           MOBILE APP DESIGN
Pre-Conference Workshops | 11   MATTHEW DUNCAN Seneca College
                                PINA MARINELLI-HENRIQUES Seneca College
Concurrent Sessions | 13
Conference Map | 24
PRESIDENT’S MESSAGE

                     MIKE KRYWY
                     CIRPA President
                     Welcome everyone to Toronto, Ontario. On behalf of      To this end we have revised our membership model to include a “Limited
                     CIRPA-ACPRI and all its members, I’d first like to      Membership” to complement our Full Membership. The Full Member-
acknowledge that this land is the traditional territory of the Haudeno-      ship enables members to vote, and provides full access past webinars
saunee, and most recently, the territory of the Mississaugas of the New      and conference proceedings. The Limited Membership will enable IR
Credit First Nation. The name Toronto is from the Haudenosaunee word         professional to be part of the association without paying membership
Tkaronto, an area that is home to many Indigenous people. We are             dues, providing them with networking and professional development
grateful to have the opportunity to work in the community, on this terri-    opportunities outside of the annual conference. We will begin rolling out
tory.                                                                        this model in the upcoming year, with the hope that all Canadian IRP
                                                                             professionals eventually become part of the association.
As President of CIRPA-ACPRI, I am pleased to welcome everyone to our
largest conference yet. Special thanks go out to our conference co-          We have also begun offering webinars throughout the year, with two
chairs: Pina Marinelli-Henriques and Henry Decock of Seneca College, as      offerings so far and more planned for the upcoming year. As our transi-
well as their conference planning team, who have worked tirelessly to        tion to a new website proceeds, we expect to provide other opportuni-
put this years’ event together. The challenges of putting on a conference    ties for networking and knowledge sharing – such as discussion boards,
are many (and the tasks are often thankless), so please take a moment to     blogs, and a document library to share resources. Please reach out to a
offer thanks to these volunteers for sharing their time to make this con-    CIRPA board member to find out how you can help us realize these col-
ference a reality.                                                           lective goals.

The conference serves as an important touchpoint in our annual cycle. A      Make friends, feed your mind, and have a great conference!
year ago we formally launched our new strategic plan, with two priorities:
a) building a community of IRP professionals with a broad, inclusive na-
tional membership; b) supporting the professional development of mem-
bers through networking and knowledge-sharing.

                                                THANK YOU TO OUR SPONSORS

                                                                                                         Redefining the Possibilities • CIRPA 2017 | 4
5 | CIRPA 2017 • Redefining the Possibilities
CONFERENCE AT A GLANCE

SUNDAY, OCTOBER 22, 2017
9:00 am – 4:30 pm     Pre-Conference Workshops                              Breakout Rooms
9:00 am – 4:30 pm     Expo/Trade Show                                       Churchill Court
6:00 pm – 6:30 pm     Conference Opening                                    Hockey Hall of Fame
6:30 pm – 11:00 pm    President's Welcome & Reception Dinner                Hockey Hall of Fame

MONDAY, OCTOBER 23, 2017
7:30 am – 9:00 pm     Breakfast                                             Churchill Ballroom
7:30 am – 5:00 pm     Expo/Trade show                                       Churchill Court
9:00 am – 9:20 am     Opening Remarks                                       Churchill Ballroom
9:20 am – 10:00 am    Concurrent Sessions                                   Breakout Rooms
10:10 am – 10:30 am   Break                                                 Churchill Ballroom
10:30 am – 11:10 am   Concurrent Sessions                                   Breakout Rooms
11:20 am – 12:00 pm   Concurrent Sessions                                   Breakout Rooms
12:00 pm – 1:00 pm    Lunch                                                 Churchill Ballroom
1:00 pm – 2:00 pm     Keynote Address – David Trick                         Churchill Ballroom
2:10 pm – 2:50 pm     Concurrent Sessions                                   Breakout Rooms
2:50 pm – 3:10 pm     Break                                                 Churchill Ballroom
3:10 pm – 4:00 pm     Concurrent Sessions                                   Breakout Rooms
4:10 pm – 5:00 pm     Concurrent Sessions                                   Breakout Rooms
6:00 pm – 11:00 pm    'Explore Toronto'                                     Various Location
                      (Delegates on their own)

TUESDAY, OCTOBER 24, 2017
7:30 am – 9:00 am     Breakfast                                             Churchill Ballroom
7:30 am – 4:00 pm     Expo/Trade show                                       Churchill Court
8:15 am – 9:00 am     CIRPA AGM                                             Churchill Ballroom
9:00 am – 9:20 am     Announcements                                         Churchill Ballroom
9:20 am – 10:00 am    Concurrent Sessions                                   Breakout Rooms
10:10 am – 10:30 am   Break                                                 Churchill Ballroom
10:30 am –11:10 am    Concurrent Sessions                                   Breakout Rooms
11:20 am – 12:00 pm   Concurrent Sessions                                   Breakout Rooms
12:00 pm – 1:00 pm    Lunch                                                 Churchill Ballroom
1:00 pm – 2:00 pm     Keynote Address – Christine Keller                    Churchill Ballroom
2:10 pm – 2:50 pm     Concurrent Sessions                                   Breakout Rooms
2:50 pm – 3:10 pm     Break                                                 Churchill Ballroom
3:10 pm – 4:00 pm     Concurrent Sessions                                   Breakout Rooms

                                                               Redefining the Possibilities • CIRPA 2017 | 6
7 | CIRPA 2017 • Redefining the Possibilities

KEYNOTE SPEAKERS

 Monday, October 23                                                          Tuesday, October 24
 1:00 pm to 2:00 pm | Churchill Ballroom                                     1:00 pm to 2:00 pm | Churchill Ballroom

                   DAVID TRICK                                                                     CHRISTINE KELLER
                   President,                                                                      Executive Director, Association for
                   David Trick & Associates Inc.                                                   Institutional Research (AIR)

                   David Trick is President of David Trick and Associates                          Selected in a comprehensive search process,
Inc. Since 2005, the firm has offered professional consulting services      Dr. Christine Keller is an accomplished association leader and
specializing in higher education strategy and management.                   institutional research professional who is committed to advancing
                                                                            informed decision-making in higher education. She has a broad
David offers clients expertise based on his experience as a senior          understanding of national issues, policies, and trends, especially
campus administrator, senior government official and award-winning          related to institutional research, information management, and data
researcher in the field of higher education.                                policy.

David is the former Assistant Deputy Minister for Postsecondary             Formerly Vice President for Research and Policy Analysis at the
Education in the Government of Ontario, where he was responsible for        Association of Public and Land-Grant Universities (APLU), her
managing the government’s relationships with colleges and universities      accomplishments include directing the operation, expansion, and
during the most rapid period of enrolment growth since the 1960s.           promotion of the cross-sector Student Achievement Measure (SAM)
                                                                            project on behalf of APLU and five other higher education associations.
David was the first Chief Executive Officer and Vice Provost of the
University of Guelph-Humber, a unique partnership between the               Prior to her employment with APLU, Christine was the Assistant
University of Guelph and Humber College to establish a new university       Director of Institutional Research and Planning at the University of
campus in Toronto. During David’s term, Guelph-Humber enrolled its          Kansas and the Associate Dean of Continuing Education at Sterling
first students, launched six innovative programs and opened a 130,000       College.
-square foot state-of-the-art academic building.
                                                                            An active member of the Association for many years, she is a former
Earlier David was Assistant Deputy Minister of Finance with                 member of the AIR Board of Directors, was a member of the Improving
responsibility for the provincial budget, taxation and federal-provincial   and Transforming Institutional Research in Postsecondary Education
finance. He has worked in the fields of intergovernmental affairs,          Advisory Board, and served as co-editor of the IR in the Know column
economic development, labour market policy and demographic                  in the eAIR newsletter for several years.
analysis. He has undertaken assignments at IBM Canada and at the
Canadian Embassy in Washington, D.C.                                        Christine has spent her career working to make the world a better
                                                                            place through higher education and data, and understands that the
David holds an Honours B.A. from York University, an M.A. from              current focus on data and evidence provides significant opportunities
Brandeis University, an M.P.A. from Harvard University, and a Ph.D. in      for the IR community. She is committed to positioning AIR and its
political science from the University of Toronto.                           members to advance and flourish during this exciting time of growth
                                                                            and change.
David is the co-author of Academic Reform: Policy Options for
Improving the Quality and Cost-effectiveness of Undergraduate
Education in Ontario (with Ian D. Clark and Richard Van Loon, 2011)
and Academic Transformation: The Forces Reshaping Higher Education
in Ontario (with Ian D. Clark, Greg Moran and Michael L. Skolnik, 2009),
both published by McGill-Queen’s University Press.

                                                                                                       Redefining the Possibilities • CIRPA 2017 | 8
9 | CIRPA 2017 • Redefining the Possibilities
CONFERENCE TRACKS

Institutional Research and Planning: Redefining the Possibilities

CN TOWER
Redefining the Possibilities for Innovation

Redefining the Possibilities for Innovation should align with enabling Institutional Research and Planning
offices with the latest competitive technology, tools, software, dashboards, scorecards, customized data
analytics and data ownership promoting leading edge data representation. How do we distinguish Institu-
tional Research and Planning offices from the Registrar’s Office? How do we move Institutional Research
and Planning offices away from a traditional statistical role? What are current Institutional Research and
Planning offices doing to stand out and become a cutting edge leader? What best practices have been
incorporated into Institutional Research and Planning Offices? How do Institutional Research and Planning
offices use technology?

QUEEN STREET WEST
Redefining the Possibilities for Students

Redefining the Possibilities for Students should align with enhancing student engagement and experience,
ensuring that we are able to investigate/research data that addresses student success and/or issues, eval-
uation and reporting on graduate outcomes, gather data on our graduates through surveys, contribution
to the Institution retention, enrolment and financial aid strategies. How do we use surveys to inform labour
market trends? What leads to student success and achievement? What are the barriers to student success
and access? What labour market trends influence program development?

NATHAN PHILLIPS SQUARE
Redefining the Possibilities for Governance, Planning and Policy

Redefining the Possibilities for Governance, Planning and Policy should align with supporting IRP initiatives
to build on established survey and data polices (such as, the change in data representation, storage, securi-
ty, access and data quality), financial capabilities to accelerate current research, accountability and owner-
ship of data governance, to enhance emerging labour market trends, environmental scanning and forecast-
ing, strategic planning priority areas, and space planning. How do we modify the information for reporting
and presentations? How does your Institutional Research and Planning office actively support/inform strate-
gic planning? How does your institution manage data governance (e.g. quality, access, integrity, ownership)?

MASSEY HALL
Redefining the Possibilities for Institutions

Redefining the Possibilities for Institutions should align with how well are Institutional Research and Plan-
ning offices ensuring that the information provided to the Institution is meaningful, aligns and supports the
strategic mandate through program review, program development, accreditation & assessment, employee
engagement, and dissemination of information. How are Institutional Research and Planning offices creating
insight and telling the story? How are the demands for new and existing programs analysed? How are Insti-
tutional Research and Planning offices handling professional development? What are the current and future
roles/direction of Institutional Research and Planning offices?

                                                                                                  Redefining the Possibilities • CIRPA 2017 | 10
PRE-CONFERENCE WORKSHOPS | SUNDAY, OCTOBER 22
Half Day Workshops | 9:00 am to 12:00 pm Participants will apply data envelopment analysis (DEA) using R
software to identify a program’s efficiency in the use of instructional
Sprinting Towards Solutions: An Applied Introduction to Design
resources. They will learn to compare programs operating at a sub-
Thinking and Design Sprints for Institutional Researchers optimal level with a best virtual program. The analysis will provide the
COST: $70 |WREN | CN Tower program chairperson with guidance to improve efficiency.
As Institutional Research and Planning (IRP) offices move away from Participants are encouraged to bring a laptop and to download the
traditional statistical roles, developing new initiatives to incorporate free trial version of M-Plus and the R libraries Benchmarking in R,
emerging technologies and answer complex questions can be rDEA, dplyr and tidyr in order to explore the use of these software
overwhelming. Design thinking and design sprints can make solving packages prior to the pre-conference workshop.
even the most complex IRP challenges easier, more enjoyable and Tom Eleuterio, University of Delaware
more efficient – all without your computer. In this workshop, IRP
practitioners will learn to problem-solve using Google Venture’s design
sprint methodology and how to effectively develop new IRP tools, Half Day Workshops | 1:30 pm to 4:30 pm
collaborate with institutional stakeholders, and champion data-driven Data vs Evidence: A Hands-On Workshop
decision-making. Be prepared to leave this workshop with tips and COST: $70 | WREN | Massey Hall
tricks to host your own IRP sprint. What is the difference between data and evidence? What turns data
Laurie Beatt, Southern Alberta Institute of Technology into evidence? How do I evaluate evidence? What is good evidence?
Corey Buchanan, Southern Alberta Institute of Technology This workshop will explore these questions in detail and help
Candice Carrillo, Southern Alberta Institute of Technology attendees improve their tools and frameworks for creating, assessing,
Jacqueline Lambert, Southern Alberta Institute of Technology and presenting evidence. The workshop will include an interactive –
Walter Moreno-Pachon, Southern Alberta Institute of Technology and fun – hands-on section.
Anthony Gray, University of Toronto
Exploring the possibilities of IRP and CIRPA: A Workshop Aurora Mendelsohn, University of Toronto
for Newcomers
COST: FREE | SEYMOUR | Massey Hall Bluenotes Community Regional Workshop: Bringing Blue
Whether you’re new to institutional research or an IR veteran attending technology and community expertise to your feedback
your first CIRPA-ACPRI conference, this free half-day workshop is the process for a greater level of automation and insights
perfect introduction to CIRPA-ACPRI and the IRP profession. Discover COST: FREE | SCOTT | Massey Hall
how to get the most from your conference experience as veteran Do you want to reduce repeat requests from your end users such as
members provide tips and tricks for optimizing your networking and “Where is my evaluation report?” and “How can I access my course
learning. Address the challenges and possibilities of institutional evaluation?” During this workshop we will show you how to set up Blue
research and planning in round-table discussions, and learn lessons in such a way that end users can get answers to these questions
from the painful and sometimes humorous experiences of long-time themselves, while driving higher response rates. In addition, you will
CIRPA members in our “True Confessions of an Institutional get the chance to build reports that will help you gain more insights
Researcher segment. through demographic, qualitative, and quantitative analysis for various
Miranda Pearson, University of Regina stakeholder levels.
Garry Hansen, St. Thomas University You will also get hands-on experience with the all new Blue 7 and
Bluepulse, as well as exposure to BlueX, our upcoming survey
Academic benchmarking innovations to improve discipline-level product. BlueX is designed to enable anyone in your institution
peer group selection by using data-informed modeling and (instructor, student, researcher, etc.) to create surveys that meet their
needs with ease.
promote resource optimization using data envelopment analysis
Mohammed Sheraidah, eXplorance
COST: $70 | SCOTT | Massey Hall
Participants in this workshop will learn advantages and disadvantages
The UCASS academic staff survey: progress and brainstorming ideas.
of peer-oriented bench-marking including mean-centered, rankings-
COST: $70 | SEYMOUR | Nathan Phillips Square
based and optimization methods. Participants will use longitudinal data
In September 2016, the Minister of Science announced the
to construct peer groups using a latent class analysis structural
reinstatement of the UCASS (University and College Academic Staff
equation model (SEM). They will use the trial version of M-plus
System) survey by Statistics Canada. At the 2016 CIRPA conference in
software which produces path diagrams and visualizations.
Kelowna, Statistics Canada presented its plans for the reinstatement
11 | CIRPA 2017 • Redefining the PossibilitiesPRE-CONFERENCE WORKSHOPS | SUNDAY, OCTOBER 22
and redevelopment of UCASS, including expanded coverage to include Full Day Workshops | 9:30 am to 4:30 pm
part-time and college staff. A year later, consultations with
Data Carpentry: Using R to Analyze and Visualize Data - A
respondents and stakeholders across the country are well underway.
In this pre-conference session, Michael Martin will update attendees on Hands-on Workshop
the progress that has been made to date, and to explore some of the COST: $120 | CARLYLE | CN Tower
ideas that have emerged from these consultation discussions. The In recent years, the statistical programming language R has become
focus of the session will be to explore some of these concepts in one of the foremost open source technologies in data science.
greater depth, in an open discussion format. It will also be an Institutional Researchers can take advantage of this language and
opportunity to brainstorm possible strategies on incorporating some of related tools to build capacity in data management, analysis, and
these ideas into the UCASS system, as well as to obtain feedback on visualization. In this hands-on workshop, bring your laptops and we’ll
how they may be used by our institutional research colleagues. walk you through the whole process, right from installing the software
Michael Martin, Statistics Canada you’ll need to analyzing data. No previous experiences with R or
programming is necessary. Participants will be able to take home
materials from the workshop to continue honing their skills.
Stephen Childs, York University
Evan Cortens, Mount Royal University
Redefining the Possibilities • CIRPA 2017 | 12CONCURRENT SESSIONS | MONDAY, OCTOBER 23
9:20 am to 10:00 am Evolution of Institutional Research Departments in the
Ontario Community Colleges
The Death of Hunch-Based Decision-Making in Higher Ed
SEYMOUR | Massey Hall
WREN | CN Tower
The 24 Ontario Community Colleges took part in two IR Department
Data interpretation can be difficult; even the most savvy administrator
Inventory Surveys conducted in 2014 and 2017. This session will
may fall back on an occasional hunch. By applying data visualization
present the analysis of these two surveys by College size. The
techniques from the manufacturing industry to our data, we made
presenters aim to provide a sense of how IR departments in the
data interpretation easy. Control charts extract the signal from the
system have evolved over the last few years; identifying common
noise. They clearly display trends in context, so that the user can
themes in their reporting structure, staffing, roles and responsibilities,
identify when performance is truly changing, and when it is not. This
challenges and opportunities, as well as expectations for the next 5
means that we know when to act, when to maintain, and when to
years. The presentation will provide baseline data to support the
celebrate. Attendees will learn the basics of control charts, and how
strategic and operational planning of IR offices within or external to the
to use them to monitor strategies and report on performance.
Ontario system.
Morgan Blair, Medicine Hat College
Helen Sheridan, Mohawk College
Mark Chapman, Sheridan College
Mining graduate surveys to strengthen quality and student
Max Bernosky, Confederation College
choice: Lessons from Ontario’s surveys of college and
university graduates
10:30 am to 11:10 am
CARLYLE | Queen Street W
Managing Growing Demands from International Students with
A number of governments in Canada and elsewhere conduct regular
surveys of postsecondary graduates. This activity raises questions
a Course Section Allocation Model
about who is supposed to use these data and for what purpose. In WREN | CN Tower
this session we propose a framework for how these data might be Facing the rapid growth of international student enrolments in recent
used to strengthen quality and student choice. Using raw data from years, Langara College in Vancouver has been managing the influx of
Ontario’s surveys of college and university graduates, we propose international students with a course section allocation model to
ways to use data better and supplement it with emerging sources of achieve an optimal balance in meeting the competing needs between
administrative data. We conclude with observations about how better domestic and international students for high- demand courses. The
use of these data could lead to more collegial relationships between demonstrated predictive model puts the College in the leading edge
governments and higher education institutions. among its counterparts in the Province in managing international
David Trick, David Trick and Associates Inc. enrolments, and has become the go-to tool for the College’s
Jinli Yang, The Learning Partnership academic leadership team in its course planning process each
semester.
The Successful Launch of a Data Governance Regime Ian Humphreys, Langara College
Larry Xiong, Langara College
SCOTT | Nathan Phillips Square
Data Governance is undertaken to ensure that an organization can
maximize the benefits of its data assets. A Data Governance program
Exploring the Keys to Transformation in Post-secondary
aims to improve the efficiency and effectiveness of the business Access and Retention: Pathways to Meaningful Work and
processes throughout the organization through the effective Lives for Youth from Underserved neighborhoods
management of data. The University of Regina has, after two years of CARLYLE | Queen Street W
preparation, successfully launched a Data Governance regime. This Exploring the Keys to Transformation is a HEQCO-funded project that
presentation will describe all that this entails: groundwork, resources, continues the ongoing applied research and evaluation being
structure, tools, people, policies, and plans. It will also reflect the undertaken at Centennial College to improve access, persistence, and
factors, including a proof-of-concept dashboard, which played in retention outcomes in its signature outreach program, Helping Youth
obtaining institutional support for this initiative. Pursue Education (HYPE). We use propensity score matching to
Brian Christie, University of Regina analyze the effect of HYPE on three student outcomes.
Keith Fortowsky, University of Regina We find that HYPE has a negative effect on its participants for each
outcome, however sensitivity tests suggest these results need to be
interpreted cautiously. Interviews with HYPE practitioners supports
13 | CIRPA 2017 • Redefining the PossibilitiesCONCURRENT SESSIONS | MONDAY, OCTOBER 23
this cautionary prescription and we conclude with recommendations Gina Johnson, Association for Institutional Research
for institutions and the provincial government. Mike Krywy, Red River College
Huizi Zhao, Centennial College Tony Olmsted, Northern Alberta Institute of Technology
Anthony Bertin, Centennial College Blair Jackson, University of Ottawa
Hayfa Jafar, Centennial College
Paul Armstrong, Centennial College
11:20 am to 12:00 pm
IR in the modern world: Data Warehousing and Dashboarding
Beyond rankings, the use of evidence based in communication!
WREN | CN Tower
(Sponsor Session)
The University of Alberta demonstrates how it has moved to a state of
SCOTT | CN Tower
reporting consistent data, using automated processes to prepare
The session objective is to discuss the influence and impact of the QS
information, along with users across campus having the ability to
World University Rankings whilst also suggesting an alternative tool to
prepare their own reports. This state has been realized with a fully
rankings. To go over QS World University Rankings methodology and
functioning institutional data warehouse, called Acorn that includes
the data collection process. Follow by Stars ratings which assesses
student, staff and financial data, and much more. The University’s
universities on how they perform in several areas, like the areas
chosen business intelligence tool, Tableau, sits on the data
considered in rankings. But rather than comparing institutions against
warehouse, and is the window to the University’s wealth of
one another, they are judged on how they perform against a set
information.
standard. QS Stars is an audit on the strengths and weaknesses of a
Deborah Williams, University of Alberta
university. The university provides QS with evidence across dozens of
Laura Stewart, University of Alberta
indicators.
Nicholas Sequeira, QS Intelligence Unit
From Application and Beyond: Tracking Aspirations, Motivations,
Thunder & Lightning: Cognos & Tableau; Info Services and the IR Office Experiences, and Outcomes of Ontario’s Transfer Students
SEYMOUR | CN Tower CARLYLE | Queen Street W
This presentation examines the profiles and pathways of
Tableau is increasingly being used for Data Analytics in IR offices.
postsecondary students in order to better understand the outcomes
Many IR Offices are also taking a leading role in implementation of
and experiences of college applicants with degree aspirations, as well
Data Analytics tools for their entire institutions. Tableau is now often
as compare the experiences of those who transfer from college to
installed to work in conjunction with existing “Enterprise Reporting”
university and those who do not. Utilizing Academica Group’s
tools. However these tools are themselves rapidly adding “Analytics”
University and College Applicant Study (UCAS™) database and an
functions. In particular Cognos v 11 claims that it is “Tableau-like”. We
online survey, we find that overall, increasing the number of students
will report on our experiences with both products at U Regina, and
utilizing the college-to-university transfer pathway may help to reduce
our experiences leading Analytics implementation(s) in the context of
inequities in overall university participation. However, there are still
fundamental differences between IR and Info Services (IS) functions.
inequities in the aspirations of college students that reproduce those
Keith Fortowsky, University of Regina
seen in the college-university divide.
Miranda Pearson, University of Regina
Ursula McCloy, Seneca College
Claire Henderson, Academica Group Inc.
A Consideration of the Applicability of AIR’s Duties & Functions
of Institutional Research in Canadian Institutions
Bringing It All Together for Smarter Decisions: Institutional
10:30 am to 12:00 pm | CHURCHILL BALLROOM | Massey Hall
Planning with the Strategic Program Mix Decision Framework
AIR has long been involved in the process of defining institutional
SCOTT | Nathan Phillips Square
research as a profession and a critical function in higher education.
This session features a comprehensive approach to campus decision
This presentation will first provide an overview of, and the research
support at the Southern Alberta Institute of Technology. In response to
behind, AIR’s recent identification of the Duties & Functions of
the need for academic planning that is sensitive to a constantly
Institutional Research. A panel will then explore these duties and
changing environment, Institutional Planning and Analysis developed
functions within the Canadian context, looking for similarities and
the Strategic Program Mix Decision Framework. The framework
differences, and consider the extent to which these definitions provide
delivers decision-making tools that inform the right-sizing of existing
an effective road map for the future development of Institutional
programs and the development of new programs. In this session,
Research across borders.
Redefining the Possibilities • CIRPA 2017 | 14CONCURRENT SESSIONS | MONDAY, OCTOBER 23
common planning questions will be used to demonstrate the tools. This review also looked at provincial differences. Findings may help
Attendees will learn how SAIT has combined reports for business inform decisions about sources of funding at post-secondary
strategy, market alignment, and program planning and effectiveness to institutions, such as student financial aid and on campus employment
make a complete planning toolbox. opportunities.
Corey Buchanan, Southern Alberta Institute of Technology Wayne Sun, Simon Fraser University and Director, CUSC-CCREU Board
Walter Moreno-Pachon, Southern Alberta Institute of Technology Linda Kupp, Thompson Rivers University and President, CUSC-CCREU
Constantly Changing Data & Data Requirements Data Governance and the Small Institution: An Update on the
SEYMOUR | CN Tower Implementation of a Data Governance Framework at St. Thomas
Enrolment data that is reported to the Ministry is constantly moving, as University
well as the data requirements from the Ministry is constantly changing. SCOTT | Nathan Phillips Square
This can lead to many hours of data validation as well as data
This session will describe the efforts of St. Thomas University to
management. MacEwan University has completed a project that
improve data quality, accessibility and security by implementing a
allowed Research Analysts to validate and analyze this data in half the
university-wide data governance framework. Building on an earlier
time it used to take.
presentation at CIRPA 2015 in Halifax, the session will provide an
Isabel Madeira, MacEwan University
update on the components of the framework completed to date and
Melannie Angeles, MacEwan University describe the planned steps moving forward. At the core of the
session will be a frank discussion of the challenges of integrating data
governance with the business practices and institutional culture of a
2:10 pm to 2:50 pm
small institution, as well as a consideration of some practical strategies
Sheridan Internal Student Mobility Platform: Pathways and Transfer for overcoming these obstacles.
WREN | CN Tower Garry Hansen, St. Thomas University
Student’s mobility is a reality within colleges and universities.
Internally, colleges and universities promote pathways programming The UCASS Story: 40 Years of Data
to help students achieve their career goals. It is important to monitor
SEYMOUR | Massey Hall
student mobility among programs to evaluate planned pathways as
Institutions need to be knowledgeable about what is going on in the
well as ad hoc transfers.
education world to make sure they do not miss possibilities. Making
The presentation is an Innovative Tableau visualization of student
right decisions often implies having good historical data on their
mobility within Sheridan programs. The system trucks for each
academic staff and be able to contextualize them at the jurisdictional
program returning students from other programs and transfers to
level. The University and College Academic Staff System could be
other programs. The underlying data use student level term
quite useful for that purpose. The survey began in 1937 collecting
enrollment along with demographic profile and success measures.
aggregate data until 1960. From 1960 onwards the survey collected
The visualization present aggregations by all combination of possible
individual record data with complete coverage of all data elements
dimensions of transferred students.
starting in 1970. This presentation will analyse the data over the last
Mokhtar Noka, Sheridan College
40 years, and highlight trends in areas such as gender, age profile,
rank distribution, salaries, subject taught etc. It will tell the UCASS
Canadian Student Employment and Debt: A longitudinal and multi- story in an historical context and highlight the analytic capacity of the
component perspective based on CUSC-CCREU survey responses data base.
CARLYLE | Queen Street W Teresa Omiecinski, Statistics Canada
Student debt is an important topic for both students and institutional
administrators with respect to post-secondary education accessibility.
Our longitudinal review of responses to CUSC-CCREU surveys of 3:10 pm to 4:00 pm
graduating students (Baccalaureate students in their final year of Developing an interactive course registration dashboard using
study) explored the relationships between employed students and
open source tools to inform strategic enrolment management
non- employed students on their amount of debt, sources of debt,
WREN | CN Tower
involvement in activities, impact on academic performance,
Mount Royal University recently developed a live, interactive,
satisfaction with their institution, and other components of student
visualization of course registration patterns. The tool arose from a
experience.
need identified by deans, chairs, scheduling and the registrar to
15 | CIRPA 2017 • Redefining the PossibilitiesCONCURRENT SESSIONS | MONDAY, OCTOBER 23
locate bottlenecks preventing students from getting the courses they the universities in the prairie region and about their participation in
needed to graduate on time. This presentation will discuss the Maclean’s ranking survey and their use of the Maclean’s rankings. This
development of the visualization tool from initial concept, through presentation discusses their responses.
development and testing, to eventual production deployment, Brian Christie, University of Regina
concluding with a live demonstration of its full functionality. Using R
and Shiny, free open-source toolkits, we were able to develop the
application in-house in just six weeks and deploy it with minimal 4:10 pm to 5:00 pm
support and resources. The Impact of Online Surveys for 3 Ontario Colleges
Evan Cortens, Mount Royal University WREN | CN Tower
The changes in technology and students’ increasing usage of social
Leveraging data tools to tell the story of students’ academic journey – media and the online environment is pushing educational institutions
Complex analytics translated to value-added decision making tools. to keep up. More and more, students want to complete surveys
CARLYLE | Queen Street W online using their smart devices or computers.
Student success is important issue for postsecondary academics, Unfortunately, institutions are facing challenges in reaching the same
practitioners and policymakers - but its complex, multidimensional high participation rates that they had with their paper surveys when
nature has often been a black box. Is it really possible to develop tools they move online. In addition, students are being bombarded by more
so faculty and academic managers can use evidence to target services questionnaires due to the ease of online survey set-up. This session will
and learning opportunities that enable students to be successful? SAIT explore the transition to online surveys for three Ontario Community
has developed an analytical framework that leverages data Colleges including their processes, variations, scope, challenges,
visualization tools and descriptive and inferential statistical analysis to successes, and impact. Along the way, they will showcase how
better understand and explain how student, program, course, and eXplorance’s Blue online survey software has made it easier to meet
other characteristics come together to influence student progression these changes, as well as the limitations.
and success at the individual, program, and institutional level where Helen Sheridan, Mohawk College
applicable. Connie Phelps, Conestoga College
Walter Moreno-Pachon, Southern Alberta Institute of Technology Rob Downie, Fanshawe College
Jacqueline Lambert, Southern Alberta Institute of Technology
Using Tableau to understand the impact of academic policy
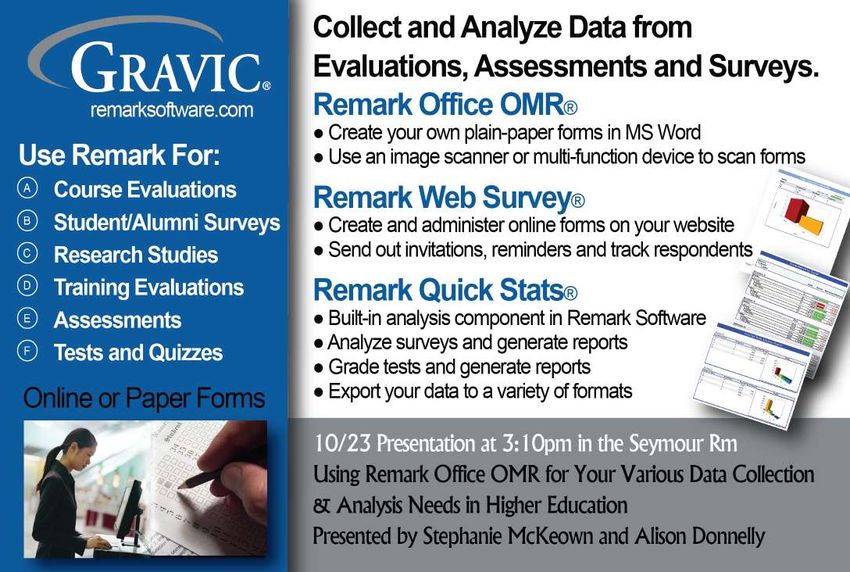
Using Remark Office OMR for Your Various Data Collection & changes on programs and their students
Analysis Needs in Higher Education (Sponsor Session) CARLYLE | CN Tower
SEYMOUR | CN Tower Academic policy changes are not always implemented with a full
The Remark Office OMR Software is a multi-purpose data collection understanding of their impact across the organization. For example, a
and analysis program often used in higher education for testing, well-intentioned policy raising a program’s minimum GPA standard
course evaluations, surveys, research, and more. During this may negatively impact retention. Using Tableau, institutional
presentation, Stephanie McKeown of the University of British Columbia researchers can identify and explore the impact of academic policies
Okanagan Campus will demonstrate how she has implemented the and provide insight into how negative consequences (e.g. lower
use of Remark Office OMR for a study on physics as well as grading retention) may be mitigated by better understanding the data. In this
exams. Alison Donnelly is the Sr. Sales Representative at Gravic, Inc., session, attendees will learn how NAIT is using Tableau action filters
developers of the Remark Products. She will be on hand to answer (“fetch” method) to better understand how students and programs
product questions. may be impacted by academic policy changes.
Alison Donnelly, Gravic David McDine, NAIT in Edmonton, Alberta
Stephanie McKeown, University of British Columbia
What High School Guidance/Career Counsellors Told Us about
Maclean’s Rankings
SCOTT | Nathan Phillips Square
In early 2017 the University of Regina commissioned a survey high
school guidance/career counsellors in its regional catchment area.
Respondents were asked about their sources of information about
Redefining the Possibilities • CIRPA 2017 | 16CONCURRENT SESSIONS | MONDAY, OCTOBER 23
How to Present Data: Lessons from data visualization failures, Replacing the engine while the car is still running: using
deceptions, and disasters Tableau to govern, streamline, report, and visualize data from
SCOTT | Massey Hall a data warehouse and surveys.
The talk will explore three types of data visualization failure: the good- SEYMOUR | Nathan Phillips Square
faith failure to convey information clearly and efficiently; the The world of institutional research and planning is changing quickly.
intentionally deceptive and misleading visualization; and the outright Tableau is a tool many offices have adopted to help streamline
dataviz disaster (laugh and learn). From the analysis of various reporting and analysis. In this demonstration, Plaid will show how we
failures, I will propose generalized lessons for effective visualization leverage Tableau to help us with: data governance through Tableau,
and offer tools for detecting data-driven deception. automated data refreshes, daily admissions reporting from an
Anthony Gray, University of Toronto institutional data warehouse, and transforming survey data for
Aurora Mendelsohn, University of Toronto reporting in Tableau Plaid helps higher education institutions use data
to improve their policies, services, and processes. Plaid is a Tableau
Alliance Partner.
Andrew Drinkwater, Plaid Consulting
Patrick Lougheed, Plaid Consulting
Have you downloaded the conference App yet?
The Toronto conference has a FREE mobile app available for iOS and Android, available
for download in both English and French. We encourage all delegates to download the
app prior to the conference.
With the CIRPA 2017 App you can:
Create a personalize a profile;
Look up the profiles of other delegates and speakers at the Conference;
Network with other participants and speakers through an instant messaging service;
Participate in the app games for a chance to win one of three prizes;
Access the schedule of events, as well as floor plans & maps;
Evaluate the plenary sessions, workshops, and parallel sessions;
Receive alerts about last minute changes;
Take notes for plenary sessions, workshops, and parallel sessions;
Share your experience at CIRPA 2017 Toronto Conference by posting photos on the
Activity Feed;
Access Twitter and share real time news and updates about the Conference.
17 | CIRPA 2017 • Redefining the PossibilitiesCONCURRENT SESSIONS | MONDAY, OCTOBER 23, 2017
Redefining the Possibilities • CIRPA 2017 | 18CONCURRENT SESSIONS | TUESDAY, OCTOBER 24
9:20 am to 10:00 am facilitating knowledge production\dissemination itself. To
demonstrate the salience of our approach we describe the
Useful Visualization of Geographic Information Using Tableau
development and application of various analytical tools used to
– Examples of How Institutional Research Departments Can Use It Today. support strategic planning within the Department of Physical and
WREN | CN Tower Environmental Science at UTSC.
Geographic information can be used for more than just creating James MacLellan, University of Toronto
maps. It can be used by institutional researchers to gain insight into Naureen Nizam, University of Toronto
the student population, to understand how school resources can be Fahim Kazemi, University of Toronto
better leveraged, and to present complex space information in a
simply understood manner. Creating a Data-Driven Culture: Humber's Journey
Types of geographic data visualizations, Tableau - a data visualization SEYMOUR |Massey Hall
tool, and sources of geographic information will be discussed. Institutional researchers spend a great deal of time creating data
Examples will be shown of how the visualization of geographic data resources and reports and often do not know the extent to which
can highlight the special needs of a student population, identify they are being used to inform decision making. This session will detail
groups of people, assist in student recruitment, and better Humber’s journey over the last 2 years to engage stakeholders in the
understand how school space is used. development of data resources and support data-driven decision
Joseph Peter McNamara, University of Toronto making. We will demonstrate our new self- service interactive data
tools and discuss them with respect to their purpose, design choices,
Refining educational pathways for students: insights from national and outreach strategies.
surveys to inform institutional research on graduates’ destinations Corrine Johnston, Humber College
CARLYLE | Queen Street W Mark Kane, Humber College
This presentation uses data from Statistics Canada’s National Daniel Fowler, Humber College
Graduate Survey 2013 and its 2011 National Household Survey to
investigate the further study and employment destinations of 10:30 am to 11:10 am
Canadian college and university graduates. Outcomes differ markedly
You do not need to be an expert in order to be innovative: A
by field but for unregulated fields, the proportion of graduates who
proceed to further study or employment in the same field is much
case of creating a completion rates identifier on Tableau
lower than commonly assumed. This has implications for student WREN | CN Tower
services, for curriculum and for the design of pathways between study Control chart is a common tool used for quality control. The tool lets
and work. This work offers institutions national data against which manufacturers identify problematic performance that is beyond
they may compare their analyses of their own data. acceptable limits, which allows manufacturers to address the issues in
Gavin Moodie, University of Toronto/OISE a timely manner. However, PSE institutional researchers rarely use
Leesa Wheelahan, University of Toronto/OISE control chart. This presentation will demonstrate how a control chart is
Ruth Childs, University of Toronto/OISE used to identify courses with exceptionally high or low completion
Annette Ford, University of Toronto/OISE rates. More importantly, it will show that institutional researchers
Jinli Yang, University of Toronto/OISE need not to be an expert to be innovative and creative. What really
Amanda Brijmohan, University of Toronto/OISE matters are the will to think outside the box, to experiment, and to
seek help from different resources.
Chun-On Lam, Thompson Rivers University
Institutional Analytics as a Reflexive Aid for Strategic Planning
at the University of Toronto, Scarborough Campus
The Role of Faculty in Student Learning Outcomes from the
SCOTT | Nathan Phillips Square
CUSC 2014 Survey Data (Survey of Middle -Year Students)
We argue that universities should adopt a more reflexive approach to
CARLYLE | Queen Street W
institutional decision-making as consistent with the insights of Beck
The importance of student learning outcomes such as academic
(1992) and Giddens (1992). In essence we seek to extend the
achievement (GPA), retention, and satisfaction cannot be over
knowledge base associated with Institutional Research and Planning,
emphasized. Faculty play a unique role in this process. This proposal
to account for the challenges associated with environmental
applied a multiple ordinary/logistic regression model to the CUSC
knowledge production and delivery. We discuss why this merger is
2014 survey data to explore the role of faculty in student learning
important not only from an efficiency perspective, but as a means of
outcomes in Canadian postsecondary institutions.
19 | CIRPA 2017 • Redefining the PossibilitiesCONCURRENT SESSIONS | TUESDAY, OCTOBER 24, 2017
CONCURRENT SESSIONS | TUESDAY, OCTOBER 24
Preliminary results indicate that faculty attitudes and behaviors, pillars, the key indicators/outputs and the diverse linkage possibilities.
pedagogical practices, student-faculty interactions, faculty Some results will be presented to demonstrate the potential of the
involvement in academic and social integration of students, academic information that could be made available to the community of users
advising, student-peer interactions, student expectations of faculty, through the Research Data Centres as well as to the general public.
and student satisfaction with faculty teaching are significant There will also be a presentation showing a provincial perspective of
predictors of student learning outcomes. The model accounted for graduate outcome indicators and how participation in postsecondary
82.1% of the variance in student learning outcomes. The results are education impacts geographic mobility and income.
analyzed and interpreted and discussed in the context of the Louise Marmen, Statistics Canada
theoretical, methodological, and policy and practice implications. Sylvie Gauthier, Statistics Canada
Edward H. K. Acquah, Athabasca University Janm Mehta, Alberta Advanced Education
Using the FBS Costing Tool to Inform Institutional Governance & Planning
11:20 am to 12:00 pm
SCOTT | Nathan Phillips Square
The FBS Costing Tool is a new resource that can be utilized by
Utilizing Course Scheduling Dashboards to Improve Retention, Time
institutional researchers and administrators in the pursuit of more -to-Completion, and Graduation Rates while Saving Money
effective and efficient collective bargaining outcomes. This WREN | CN Tower
demonstration session will show attendees the functionality, range of This session explores how utilizing dashboards can assist Canadian
data produced by and relevance of this new resource in the broader institutions in optimizing course scheduling, improve retention, time-to
context of ongoing discussions on the financial sustainability of -completion (degree velocity), and graduation rates while potentially
Canadian higher education institutions. saving millions in instructional expenditures. Building upon a national
Jim Butler, CAUBO sample, the session explores several case studies of United States and
Ryan Johnston, University of New Brunswick Canadian institutions that have implemented many best practices
based upon course scheduling dashboard metrics. Specifically, by
Taking Institutional Analysis to the Next Level: Big Picture optimizing on-grid scheduling, institutions can improve retention by
Insights to Inform Decision-Making seven percent and reduce instructional expenditures by four percent.
SEYMOUR | Massey Hall Generally, findings suggest that financial, facilities, and institutional
In this session, we introduce participants to data synthesis methods researchers can greatly assist in improving course scheduling and
that draw on one or more data sources, like databases, surveys, and better align institutional resources.
published research, to infer conclusions and recommendations. These John Barnshaw, Ad Astra
methods are common in the health and social sciences, where
interdisciplinary, and multi-institutional, groups come together to Adventures with Data Definitions and Reporting (and maybe some
collaboratively engage in research that aims to address a substantial solutions)
challenge facing their worlds. We will engage participants in a CARLYLE | Queen Street W
discussion on how synthesis methods can be applied in institutional Many institutions struggle with complex data definition problems that
research, what postsecondary challenges we can collectively address hinder production of meaningful reports. This session will be
using synthesis research, and how the results will help us to better structured like a Special Interest Group (SIG), focused on student data.
inform our decision-makers. Attendees will present their definition questions and discuss solutions.
Ashley Blackman, Red River College The University of Regina will kick off the session with discussion of how
Stephanie McKeown, University of British Columbia – Okanagan to define/report: “duplicate headcount” students; active and
withdrawn students for capacity planning; and “at risk” students.
Moving forward Postsecondary Education data at Statistics Canada Attendees will gain a network of contacts with whom to continue
10:30 am to 12:00 pm | CHURCHILL BALLROOM | CN Tower discussions following the conference. Attendees are encouraged to
Over the last few years, Statistics Canada has invested resources in contribute questions of their own prior to the session
the modernization of its postsecondary education programs. - please email miranda.pearson@uregina.ca.
Following the creation of an Education Longitudinal Linkage Platform, Miranda Pearson, University of Regina
a framework on Education and Labour Outcomes of Students and Keith Fortowsky, University of Regina
Apprentices has been developed. In this session, Statistics Canada will
walk you through the framework, talking about the key elements, the
Redefining the Possibilities • CIRPA 2017 | 20CONCURRENT SESSIONS | TUESDAY, OCTOBER 24
Collaborative work between CUSC and the MPHEC: A Comparison of Kellan Eckstrom, Conestoga College
Maritime and Non-Maritime University Students on Education Debt How many rocket scientists and burger-flippers are we
and the Transition to Employment using the CUSC 2015 Survey of graduating? Accurately measuring underemployment as an
Graduating Students indicator of PSE graduate success. (Sponsor Session)
SCOTT | Nathan Phillips Square CARLYLE | Queen Street W
The Maritime Provinces Higher Education Commission has engaged “Underemployment” is a key concept in measuring graduate
with the Canadian University Survey Consortium (CUSC) board to outcomes. While employment rates are favourable for PSE graduates,
analyze data from the CUSC 2015 survey of graduating students. This there remain challenges with adequately measuring
presentation will explore information on education debt and the underemployment rates. This is increasingly an area of interest for
transition to employment, comparing Maritime university students with PSE institutions, as they attempt to collect evidence of their graduates’
students elsewhere in the country. success in making the school-to-work transition. This paper outlines
Isabelle Cormier, Université de Moncton the various components of underemployment including both skill
Dawn Gordon, Maritime Provinces Higher Education Commission underutilization and involuntary part-time employment. We present
various approaches to measuring underemployment ranging from self
Departmental productivity and cost data from the Delaware Cost Study -reports (less reliable) to efficient occupational analysis algorithms that
IR offices can use to produce more reliable and valid measures of their
can yield data-informed peer groups that can be used with Data
students’ outcomes.
Envelopment Analysis to guide targeted improvement in teaching
Victoria Díaz, DPM Research
workload allocations to optimize the use of resources.
Celine Pinsent, DPM Research
SEYMOUR | Massey Hall
Pierre Mercier, DPM Research & University of Ottawa
Academic bench-marking by four-year institutions in higher education
can be improved by focusing on discipline-level characteristics, the
Visualizing Policy Change: A showcase of data visualization
use of innovative statistical modeling methods and by offering
tools that use real data to visualize changes to Ontario’s
actionable guidance for departmental improvements. Traditional
bench-marking concentrates too heavily on past activities and funding framework
average performance. Data envelopment analysis (DEA) shifts the SCOTT | Nathan Phillips Square
focus to the optimal comparators in a peer group and uses their Ontario’s funding model is changing. With the introduction of a
accomplishments to guide departmental improvement. Data- “corridor model,” institutions face different outcomes when their
informed peer group selection optimizes the comparator group for enrolments fall above or below a negotiated target. This session will
conducting DEA. There may be multiple paths to achieve optimal provide a detailed description of this policy change, showcase a
resource utilization and DEA can illuminate those paths. dynamic visualization tool designed to help institutions and other
Tom Eleuterio, University of Delaware stakeholders understand these policy changes and their impacts on
institutional finances, and introduce the technology behind the
visualizations.
2:10 pm to 2:50 pm
Paul Jarvey, Ontario MAESD
A non-traditional approach to measuring the economic impact
Alex Chen, Ontario MAESD
of a PSE institution
WREN | CN Tower Assessing and responding to labour market demands
Often, the calculation of economic impact involves a tally of the total
SEYMOUR | Massey Hall
injection of spending into the local economy. This approach may be
Canada’s colleges and institutes have evolved into sophisticated
appropriate for private enterprise, but didn’t sufficiently align with
providers of education that respond to the demands of the workforce.
Conestoga’s primary mandate to serve the needs of the local labour
These demands change very quickly and it is estimated that sixty-five
market. This presentation will outline how the IR office utilized an
percent of today’s students will be employed in jobs that do not yet
approach created by Larry Smith, Adjunct Associate Professor of
exist. Understanding the current and future labour market
Economics at UWaterloo, to determine that 55% of our local adult
requirements is necessary but very challenging. This session will detail
population and 45% of our local resident employment, has received
the use of data to understand the link between post-secondary
education/training from Conestoga. Our graduates contribute 2.3
programs and the labour market enabling institutions to assess
billion dollars each year to the community.
current and future needs of the workforce and plan programs and
Connie Phelps, Conestoga College
enrolments accordingly.
21 | CIRPA 2017 • Redefining the PossibilitiesYou can also read