ALTMETRICS DATA PROVIDERS: A META-ANALYSIS REVIEW OF THE COVERAGE OF METRICS AND PUBLICATION - RECYT
←
→
Page content transcription
If your browser does not render page correctly, please read the page content below

Altmetrics data providers: A meta-
   analysis review of the coverage of
   metrics and publication
   José-Luis Ortega

   How to cite this article:
     Ortega, José-Luis (2020). “Altmetrics data providers: A meta-analysis review of the coverage of metrics and
     publications”. El profesional de la información, v. 29, n. 1, e290107.
     https://doi.org/10.3145/epi.2020.ene.07

                                                                                          Invited manuscript received on November, 20th 2019
                                                                                                            Accepted on December, 10th 2019

                       José-Luis Ortega *
                       https://orcid.org/0000-0001-9857-1511
                       Institute for Advanced Social Studies (IESA-CSIC)
                       Joint Research Unit (CSIC-University of Córdoba)
                       Innovation, Knowledge and Transfer
                       Plaza Camposanto de los Mártires, 7.
                       14004 Córdoba, Spain
                       jortega@iesa.csic.es

Abstract
The aim of this paper is to review the current and most relevant literature on the use of altmetric providers since 2012.
This review is supported by a meta-analysis of the coverage and metric counts obtained by more than 100 publications
that have used these bibliographic platforms for altmetric studies. The article is the most comprehensive analysis of alt-
metric data providers (Lagotto, Altmetric.com, ImpactStory, Mendeley, PlumX, Crossref Event Data) and explores the co-
verage of publications, social media and events from a longitudinal view. Disciplinary differences were also analysed. The
results show that most of the studies are based on Altmetric.com data. This provider is the service that captures most
mentions from social media sites, blogs and news outlets. PlumX has better coverage, counting more Mendeley readers,
but capturing fewer events. CED has a special coverage of mentions from Wikipedia, while Lagotto and ImpactStory are
becoming disused products because of their limited reach.
Keywords
Altmetrics; Coverage; Data providers; Social media; Lagotto; Altmetric.com; ImpactStory; Mendeley; PlumX; Crossref
Event Data; Wikipedia; Review.

1. Introduction
Altmetric data providers play a key role in altmetric research, to the point that much of this research topic relies on
these providers in order to carry out most of their studies. The importance of these platforms is not only due they are
fundamental tools for altmetric research, but also that data from these services are increasingly being used to evaluate
articles, authors and organisations. It is worth remembering that Altmetric.com has mainly based its business on suppl-
ying metrics and indicators to academic publishers. Similarly, PlumX has found in the institutions the way to develop
its activity, offering a dashboard to track the social impact of their outputs. This commercial activity has inserted their
altmetric counts into the scholarly publishing environment prior to being tested as reliable and significant research indi-
cators, causing considerable misinterpretation about their meanings and importance (Bornmann, 2014).
In this sense, altmetrics is obliged to test the reliability of these services both to verify that the scientific results are ba-
sed on trustworthy sources and to audit the authenticity of these services as data providers. This vigilant attitude is even
more motivated because these platforms are not exactly scientific instruments for bibliometric studies, but commercial
suites focused on providing visibility to academic journals and organisations. Altmetrics should therefore be undertaken
as an independent and authoritative instrument that assesses the technical suitability of these tools for supplying and
processing altmetric counts. The clearest expression of this inspection attitude is the NISO Alternative assessment me-
trics (Altmetrics) initiative which aims to standardise and ensure transparency of the way in which data aggregators
obtain and process their information (NISO, 2016).

e290107                                                          El profesional de la información, 2020, v. 29, n. 1. eISSN: 1699-2407    1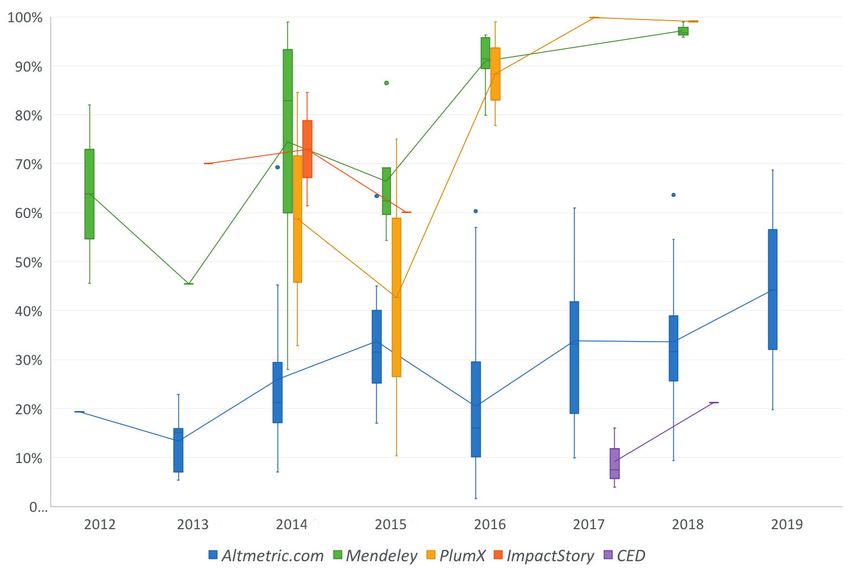
José-Luis Ortega

However, and despite all these platforms agreeing to report their sources and how they process their metrics, impor-
tant points still need more clarification. For example, aggregators should improve their reporting of the complete list
of sources covered, mainly blogs and news media; how they manage the intentional manipulation of metrics (i.e., bots
on Twitter); and how the links to events are curated and updated when they are moved or eliminated (Ortega, 2019b).
These limitations are evident when the resulting metrics are compared and the counts differ significantly, although many
of them come from the same source such as Twitter, Mendeley or Wikipedia. These discrepancies raise doubts about the
reliability of these platforms when they come to extract information and count metrics.
This instability in the metrics provided by each data aggregator justifies a meta-study to collect all the figures captured
from these providers at different times and from different samples, enabling an accurate picture of how these services
are evolving in time and a general overview of the coverage and working of each platform. It is interesting to note that
this type of analysis is uncommon in bibliometric studies, even more when referring to a quantitative discipline. In alt-
metrics, we can highlight the study by Bornmann (2015a), who analysed the published correlations between tweets,
blogs and readers. But, perhaps, the most exhaustive meta-analysis was performed by Erdt et al. (2016b). These authors
reviewed the literature about altmetrics and performed a cross-metric validation of altmetric indicators. However, no
meta-study has explored the evolution and coverage of altmetric data providers. This study attempts to fill this gap by
reviewing the current altmetric literature and analysing the numbers obtained by these studies.
2. Objectives
The principal objective of this work is to review and analyse the scholarly literature that has used an altmetric provider
to conduct its studies. The aim is to check and contrast the figures obtained to build a general picture of the coverage
and metrics supplied by each altmetric provider. From this analysis, we aim to:
- describe the proportion of indexed publications (coverage) in each provider;
- present the proportion of documents in each provider by metric;
- depict the average counts of each metric; and
- display disciplinary differences by metric and provider.

3. Methods
3.1. Altmetric providers
Within the context of big data and its technological revolution, altmetric data providers or aggregators are platforms that
capture, collect and quantify in a single venue different events about scholarly publications produced in distant places
on the Web. According to commercial agreements or open endpoints, these secondary services are adding up events
generated in social networks, specialised databases, citation indexes, blogs and news outlets. Using specific document
identifiers (doi, isbn, uri, Pubmed id, etc.), these platforms track the footprint of a publication on each website that they
monitor. In addition, these platforms sometimes produce indicators and reports from the information gathered, offering
added value to the data provided. Mendeley is a special case because it is not strictly a data provider, but an online re-
ference manager. However, this service is included because many studies have used this platform as a principal source
for counting reader numbers.
Mendeley
https://www.mendeley.com
                           It was created by three PhD students in 2008 with the aim of exporting the Last.fm model to
                           the scholarly world. That is, that each user could share their favourite publications with other
                           members (Ortega, 2016). This became Mendeley the most important reference manager on
                           the Web. In 2013, it was acquired by Elsevier for integration with its products. Mendeley is
                           also a social network in which users “read” the publications. The number of readers of a pu-
                           blication is a measure used for altmetric studies to evaluate the academic impact of a publi-
                           cation (Mohammadi; Thelwall, 2014; Mohammadi et al., 2015).
Lagotto
http://www.lagotto.io
                            Lagotto was the first altmetric data provider and was created in March 2009 by the publisher
                            Public Library of Science (PLoS). Although it is an open tool that can be used by any publisher,
                            this instrument is not widespread, and only three publishers (PLoS, Copernicus and Public
                            Knowledge Project) have implemented this provider. The last API version (Lagotto 4.0) dates
                            from April 2015, an indication of its brief development.

e290107                                                  El profesional de la información, 2020, v. 29, n. 1. eISSN: 1699-2407   2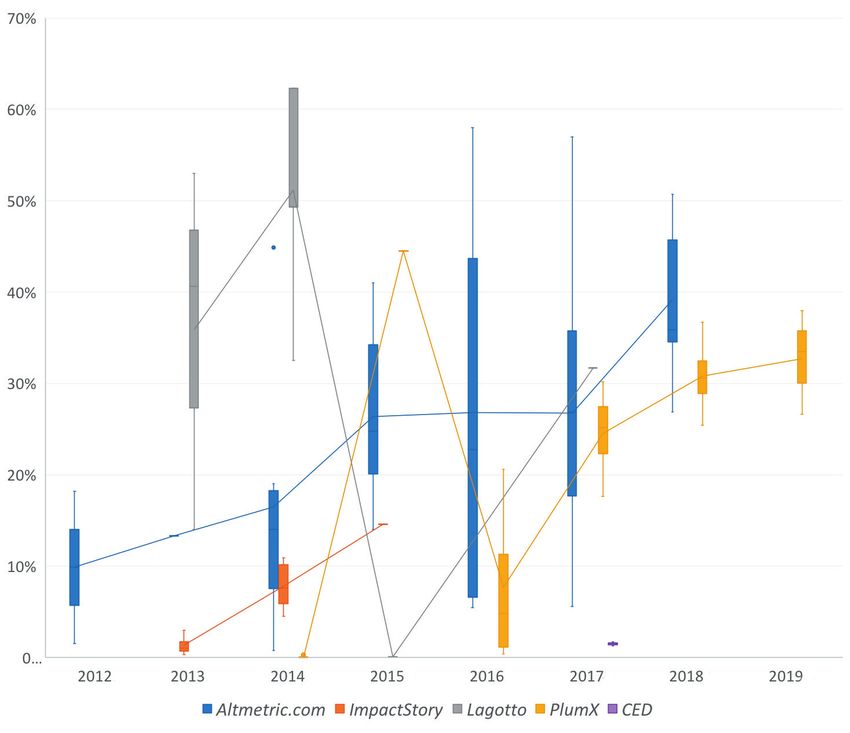
Altmetrics data providers: A meta-analysis review of the coverage of metrics and publications

Altmetric.com
https://www.altmetric.com
                            Altmetric.com was launched in 2011 by Euan Adie, with the support of Digital Science. Alt-
                            metric.com is centred in the publishing world, signing agreements with publisher houses to
                            monitor the altmetric impact of their publications. This information is accessible through a
                            public API on the Web. Today, Altmetric.com captures over 60 million events and tracks the
                            social impact of close to 9.5 million research papers (Altmetric.com, 2019).
ImpactStory
https://profiles.impactstory.org
                            This aggregator was developed by Jason Priem and Heather Piwowar in 2011. Unlike other
                            providers, ImpactStory is focused on building personal profiles that illustrate the altmetric
                            impact of a researcher. Using Orcid and a Twitter account, this tool enables the creation of
                            a profile with the list of publications mentioned on the Web. Up to 2015, this tool offered a
                            public API to retrieve data, but this endpoint is now closed. To date, around 18,000 profiles
                            have been created (ImpactStory, 2019).
PlumX
https://plu.mx/plum/g/samples
                            PlumX is a provider of alternative metrics created in 2012 by Andrea Michalek and Michael
                            Buschman from Plum Analytics. This product targets the institutional market, offering alt-
                            metric counts of publications for specific institutions. PlumX is the aggregator that offers
                            more metrics, including usage metrics (i.e. views and downloads). It covers more than 52.6
                            million artefacts and is the largest altmetric aggregator (Plum Analytics, 2019). In 2017, Plum
                            Analytics was acquired by Elsevier and now tracks the online presence of any article indexed
                            in the Scopus database. PlumX also offers their customers an API to extract data.
Crossref Event Data (CED)
https://www.crossref.org/services/event-data
                            CED is the youngest service. Created in 2016, it is still in beta. Unlike Altmetric.com and
                            PlumX, CED is not a commercial site and provides free access to data through a public API.
                            Another important difference is that it does not provide metrics, but only displays informa-
                            tion about each altmetric event linked to a doi identifier. For instance, it shows information
                            about an article mention on Twitter (date, user, tweet, etc.), but does not show a count of the
                            number of tweets. For that reason, CED’s data would have to be processed to be comparable
                            with the other services. This provider is only accessible via API.
3.2. Indicators
One of the most important challenges of a meta-study is the selection and standardisation of the various observations
for comparison and analysis. The observation date, when available, was used instead of the publication date to fairly
compare different observations over time. In certain cases, although some metrics are not available in the paper, it in-
cludes enough information for that metric (percentages and proportions) to be calculated. In these cases, metrics were
calculated and added to the study. Three main indicators were defined:
Coverage (%): percentage of documents indexed in one provider. This percentage is available when an external sample
was selected in the study and compared with the coverage of an altmetric service. This indicator reports the size of a
data provider. Another way to refer to this metric are items with data scores (Gorraiz et al., 2018), nonzero altmetric
events (Didegah et al., 2018) and nonzero scores (Thelwall, 2018).
Metrics proportion in each provider (%): percentage of publications with at least one event from one metric in relation
to the publications included in the provider. In this case, this indicator shows the weight of a metric over all the metrics
gathered by one provider. This indicator is also named Percent nonzero (Thelwall; Nevill, 2018).
Average of events per publication: ratio of the total count of events by the number of indexed publications. This metric
reports the frequency of each metric and is also named Geometric mean (Thelwall; Nevill, 2018) or Density (Zahedi et
al., 2014b; Costas et al., 2015a; Gorraiz et al., 2018; 2019).
3.3. Search criteria
Google Scholar and Scopus were searched to obtain the sample of publications. The search criteria in both databases was a
generic query “altmetric*” to obtain the largest number of results. After a first round, other precise queries were performed
to identify papers that have used a data provider. For example, “altmetric” OR “altmetric.com” for Altmetric.com, “plumx” OR

e290107                                                   El profesional de la información, 2020, v. 29, n. 1. eISSN: 1699-2407   3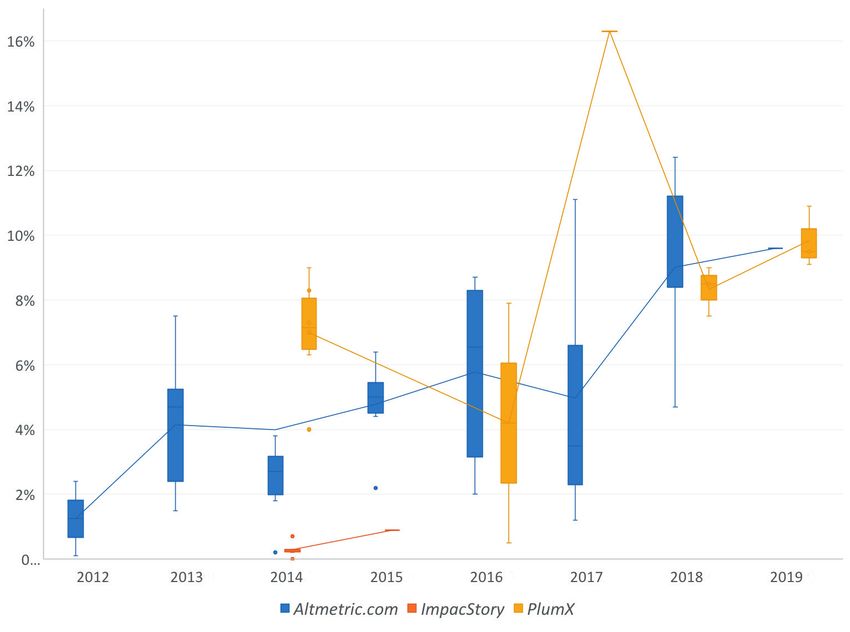
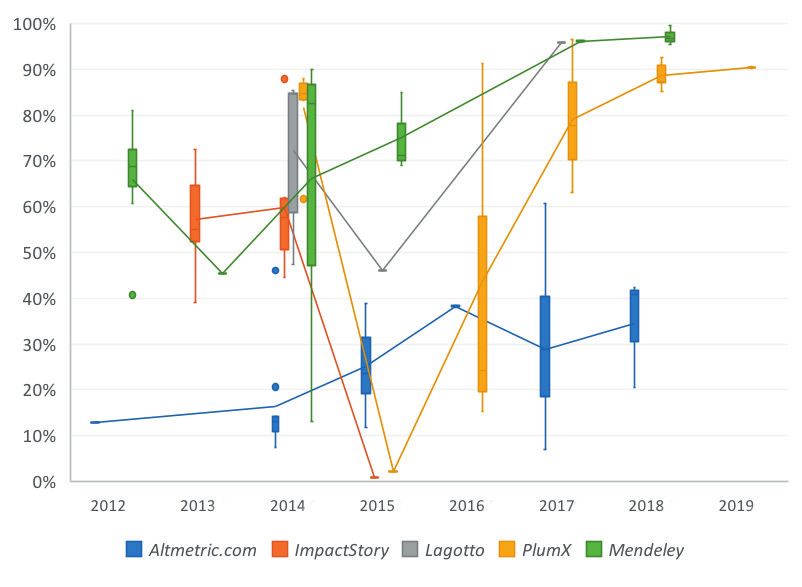
José-Luis Ortega

“Plum Analytics” for PlumX, “impactstory” for ImpactStory, “lagotto” OR “PLOS” for Lagotto, “crossref event data” OR “CED”
for Crossref Event Data and “mendeley” for Mendeley. These results were filtered to search for papers that had used an altme-
tric data provider for their analysis, had calculated some of the previous indicators or had published any data that would allow
us to compute them. A total of 107 articles published between 2012 and 2019 were selected for the study.

4. Results
First, the results describe the number of providers used, the coverage of publications and the percentage of papers
mentioned in the most important metrics. Next, the number of counts of each metric in each provider will be presented,
and lastly a disciplinary study will point out thematic differences among the aggregators.
4.1. Providers
Graph 1 illustrates the propor-
tion of altmetric data providers       100%
used in the academic literature          90%
since 2012. This picture allows          80%
us to visualise how different            70%
providers gain market share              60%
and others fall into disuse. For         50%
example, the initial studies were        40%
done with Mendeley (50%) and             30%
Lagotto (50%). The first gives           20%
the source of the readers and            10%
the second the first altmetric            0%
provider. In 2013, Altmetric.com                  2012       2013      2014       2015        2016      2017 2018  2019
appeared as an altmetric sour-
ce and began dominating the                    Mendeley       Lagotto      Altmetric.com        ImpactStory  PlumX CED
market. 2014 and 2015 are the
years with more providers used      Graph 1. Proportion of data providers used in altmetric studies by year
with the coming of ImpactStory
and PlumX. However, from 2016 to 2017 only three services were used, Mendeley, Altmetric.com and PlumX. Because
Lagotto is not implemented in important publishers other than PLoS, it became a limited tool for altmetric studies and
was used only in one-time cases (Zahedi; Costas, 2018). ImpactStory stops provide a public API, making it hard to ob-
tain random representative samples. In 2018, a new data provider, Crossref Event Data, began being used and was the
first non-commercial open product. Overall, the three main data sources are Altmetric.com (54%), Mendeley (18%) and
PlumX (13%), Altmetric.com being by far the most used service.
4.2. Coverage
Graph 2 depicts the distribu-
tion of publications covered
in each data provider grouped
by year. Lagotto was excluded
due to absence of data. This
trend was displayed using the
data collection date, instead of
the publication year because
this is the closest date to the
observation. However, not all
the articles include that infor-
mation and, in those cases, the
publication date was selected,
which could distort the results
to some extent. We must the-
refore understand the data in
an illustrative way. Another
problem is that not all the ob-
servations were taken in the
same way. Many are limited to
specific disciplines, publication
windows or regions, thereby           Graph 2. Yearly evolution of the coverage of the providers analysed
provoking a high dispersal in
annual distributions.

e290107                                                      El profesional de la información, 2020, v. 29, n. 1. eISSN: 1699-2407   4
Altmetrics data providers: A meta-analysis review of the coverage of metrics and publications

Altmetric.com, the platform with most observations, shows a generalised, paused increase in the coverage of publica-
tions. Studies during the 2012-2013 period show a coverage between the 19.3% of Knight (2014) and the 15.1% of Cos-
tas et al. (2015a). In 2014, these percentages slightly increased to a mean coverage of 28%, where we can highlight the
outlier 69.3% (Bornmann, 2014a) caused by a sample of recommended papers in Biomedicine from F1000Prime. From
2015 to date, the mean coverage has stabilised around the 31.5% of 2015, the 33.2% of 2017 and the 29.9% of 2018.
There was a fall in 2016 to 16% caused by some local studies about Brazilian publications (Eléspuru-Briceño; Huaroto,
2016; Maricato; Filho, 2018) where the indexation and mention of local publications was clearly insufficient (Alperin,
2015). In 2018, Orduña-Malea and Delgado-López-Cózar (2019) found the outlier 9.4%. These authors used the full da-
tabase of Dimensions to detect publications from Altmetric.com, with no time limit, including pre-2000 print documents
that could not be mentioned in social networks. However, they reached 21.6% and 21.8% when they limited the sample
to papers published in 2016 and 2017, respectively. Two recent studies (Wooldridge; King, 2019; Wolcott et al., 2019)
place the coverage of Altmetric.com at 44% in 2019. The limited coverage observed in the literature is caused mainly by
the fact that Altmetric.com only indexes publications previously mentioned in some social networks (Twitter, Facebook,
Google+, etc.) (Haustein et al., 2015; Bar-Ilan et al., 2019). This indexing strategy has resulted in the steady growth of
coverage since 2014.
Mendeley, the second service by number of observations, describes a positive trend with continuous growth since 2013,
reaching percentages of over 90% in 2016. This high coverage is explained because the Mendeley Web Catalog is fed
by important sources such as Pubmed, Scopus and their own users (Ortega, 2016), which brings an extensive number
of publications. Thus, in 2012, Mendeley collected a mean of 63.8% of publications, ranging from the 82% of Bar-Ilan et
al. (2012) to the 45.6% of Mohammadi et al. (2015). This considerable difference could be because the first study used
a reduced sample of bibliometricians, which could overrepresent the number of readers. Mohammadi et al. (2015),
however, take articles from 2008, when Mendeley was created. This early date could indicate that many articles are still
not indexed in the platform. Later studies found similar percentages. Zahedi et al. (2014a; 2014d) also detected a cove-
rage of 45.5% and 47.4% in a multidisciplinary sample. Mohammadi and Thelwall (2014) yielded low percentages: 28%
for Humanities and 58% for Social Sciences. Haustein and Larivière (2014), on the contrary, found 65.9% in Biomedicine
papers, which points to disciplinary differences in favour of the natural sciences. However, in mid-2014 an important
change occurred in Mendeley’s database because from that moment onwards the coverage percentages were always
beyond 80%. The most likely reason is the effective integration of the Scopus index in the Mendeley Web Catalog, which
led to increased coverage of Mendeley (Bonasio, 2014; Scopus, 2014). In August 2014, Peters et al. (2014b) already de-
tected 84.2% of coverage, while Bornmann and Haunschild (2015) found 99% from F1000 papers. Subsequent studies
(Thelwall; Wilson, 2016; Bornmann; Haunschild, 2016b) reported percentages over 90%. In 2015, some disciplinary
studies (Pooladian; Borrego, 2016; Aduku et al., 2017) showed that this high coverage is not the same in Computer
Sciences (63.5%), Engineering (54.3%) or Library Sciences (61.4%). From 2016, all the studies verified the elevated cove-
rage of Mendeley with values higher than or around 90% (Bornmann; Haunschild, 2017; Didegah et al., 2018; Zahedi;
Van-Eck, 2018).
PlumX describes a growing trend motivated mainly by its integration into Elsevier’s products such as Scopus, Mendeley
and ScienceDirect from 2017. Until 2014, no studies used PlumX as a data source. The first was Peters et al. (2014b),
who compared the coverage of several data providers using a sample of publications from Leibniz Association, finding
84.6% of publications indexed in PlumX. However, this same team (Peters et al., 2016) observed 32.9% when only da-
tasets were considered. This percentage descended (10.4%) when they repeated the same study one year later (Peters
et al., 2015). From 2016 to 2019, coverage increases considerably to nearly 100% (Meschede; Siebenlist, 2018; Zahedi;
Costas, 2018; Ortega, 2018a; Ortega, 2019; Gorraiz et al., 2019). The only exception is Torres-Salinas et al., (2017a), who
obtained a coverage of 77.7% because their sample was limited to books.
Studies on ImpactStory cover a short time-window (2013-2015). During this period, ImpactStory showed a mean covera-
ge of between 70% in 2013 (Zahedi et al., 2014b), 73% in 2014 (Peters et al., 2014a; 2014b) and 60% (Kraker et al., 2015)
in 2015. CED also describes a short activity period (2017-2018), but with significant increases. Thus, in 2017, it showed
an average coverage of 9.1% (Ortega, 2018a; 2018b; Zahedi; Costas, 2018), which rose to 21.2% in 2018 (Ortega, 2019).
4.3. Coverage of metrics
This section analyses the coverage of six of the most important metrics (tweets, readers, Wikipedia citations, Facebook
mentions, blogs and news) according to each provider.
4.3.1. Tweets
Tweets are the most studied metric in the literature (62.3%) because Twitter is the principal source of analyses of the
dissemination and social impact of scholarly publications. Overall, Graph 3 shows that Altmetric.com is the platform that
has continued for longer and with better mean percentages of tweets. Next, PlumX also shows a constant rise in tweets
since 2016 but under Almetric.com counts. Other services such as Lagotto and ImpactStory present specific observations
in short time periods.

e290107                                                  El profesional de la información, 2020, v. 29, n. 1. eISSN: 1699-2407   5
José-Luis Ortega

Altmetric.com presents a better
and growing coverage of tweets,
ranging from 10-15% in 2012-
2014 to 40% in 2018, on average.
Coverage is better even though
Altmetric.com’s definition of the
metric is restricted (it only counts
the number of different users that
tweeted a publication to avoid in-
tentional manipulations), which
a priori would produce lower va-
lues. The first studies were per-
formed by Knight (2014), who
detected 18.2% of tweeters for
articles on solid organ transplan-
tation in 2012. However, Adie
and Roe (2013), analysing the full
Altmetric.com database, reported
that the coverage of tweets was
still low (1.6%). In 2013, Costas
et al., (2015a) observed 13.3% of
tweeters in a random sample of
500,000 WoS journal articles. In
2014, average observation rose to         Graph 3. Yearly evolution of the percentage of tweets in each provider
16.5%, highlighting the outliers of
Haustein et al. (2014a) (44.9%) and Alperin (2015) (0.8%). The first was because the authors analysed 84,000 articles
deposited in the online repository arXiv, which would favour the tweeting of these pre-prints. Contrary to this result,
Alperin (2015) studied almost 400,000 articles from SciELO, a local database for Latin-American academic publications,
evidencing the poor altmetric impact of Latin-American science or the incomplete coverage of Altmetric.com of local
events in Spanish and Portuguese. In 2015, the coverage of tweets increased again (26.4%), from 14% of publications
about History in Htoo and Na (2015) and 41% in Scott et al., (2015) from Pubmed articles. 2016 presents a similar mean
percentage (26.8%). Particularly noteworthy are the poor results of Eléspuru-Briceño and Huaroto (2016) (5.4%) about
documents deposited in the local repository of the Peruvian University of Applied Sciences (UPC) and those of Torres-Sa-
linas et al. (2018b) (5.6%) limited to publications from Spanish universities. Both studies based in local samples again
provide evidence of the reduced impact on Twitter of local, non-English publications. At the other extreme, Wang et
al. (2016) found 58% of tweeted articles in a sample of Biotechnology articles authored by Chinese authors outside of
China. This result could be explained by a research area exposed to social networks and that Chinese abroad could be in-
serted in prestigious groups and institutions. In 2017, the average proportion of tweeted documents (25.4%) also caused
by the presence of extreme values dropped slightly. Htoo and Na (2017) found low percentages for Business (5.6%) and
Law (8.1%), confirming the low impact on Twitter of Humanistic disciplines. On the other hand, the highest values are for
Zahedi and Costas (2018) (57%), who used sample PLoS articles, which could indicate a greater exposure of PLoS journals
on Twitter than other publications. In 2018, Altmetric.com increased considerably with a mean coverage of 40.8% of
publications in Twitter. This observation encompasses the 26.9% of Economics and the 50.7% of Communication captu-
red by De-Filippo and Sanz-Casado (2018). This result demonstrates the important disparity within the Social Sciences.
Next, PlumX also describes a positive evolution, starting from a mean of 6.6% in 2016 to 33.5% in 2019. The first obser-
vations about tweets on PlumX were done by Peters et al., (2014b) when they compared the presence of the Leibniz
Association’s publications in several aggregators. The results show insignificant percentages (

Altmetrics data providers: A meta-analysis review of the coverage of metrics and publications

This result suggests that Information Sciences could gain more attention on Twitter than the average. In 2018, the mean
percentage was 30.8%, thanks to Gorraiz et al. (2018), who analysed the Austrian publications in PlumX and found 25.4%
and 36.7% for publications mentioned on Twitter for 2014 and 2016, respectively. The last observation, in 2019, was re-
peated by these same authors (Gorraiz et al., 2019), but only with regard to University of Vienna publications. The result
(32.7%) is just slightly higher than the previous year.
ImpactStory shows observations only in the 2013-2015 period. The trend was steady and homogenous, starting from
an average percentage of tweeted papers of 1.3% in 2013 (Zahedi et al., 2014b) and 7.8% in 2014 (Peters et al., 2014b)
to 14.6% in 2015 (Kraker et al., 2015). Lagotto also includes only a few observations, although it reached an average of
35.8% in 2015 and 51.1% in 2014. This elevated proportion is due to the fact that Lagotto is almost solely implemented in
PLoS journals. PLoS one, the multidisciplinary journal, has considerable exposure on Twitter, thereby giving rise to these
high percentages. For example, Fenner (2013), analysing only the journal PLoS biology, detected just 14% of tweeted ar-
ticles. Zahedi et al. (2015a) detected the derisory 0.1% of tweeted articles in Lagotto using a random sample of Crossref.
For CED, only the studies by Ortega (2018b) and Zahedi and Costas (2018), carried out in 2017, can be mentioned. Both
found very low percentages: 1.3% for Ortega (2018b) and 1.7% for Zahedi and Costas (2018).
4.3.2. Readers
Another of the most studied
metrics is the number of Men-
deley readers with a publication
(54.7%). The reason for this inte-
rest is the strong association of
this metric with bibliographic ci-
tations (Mohammadi; Thelwall,
2014) and its possible utilisation
as an indicator of early scientific
impact (Thelwall; Nevill, 2018).
Graph 4 depicts an increasing
evolution in every provider, more
defined from 2016 onwards.
Mendeley is obviously the pla-
tform that has a better covera-
ge of readers, with a continued
rise in readers since 2014. Next,
PlumX is the service with better
percentages in relation to Altme-
tric.com, mainly from 2016.
Altmetric.com is the service that
presents a less average propor-
                                         Graph 4. Yearly evolution of the percentage of readers in each provider
tion of readers in comparison to
the other aggregators. The first
observation came in 2012 from Knight (2014), who observed 12.9% of readers in Medicine papers from Scopus. But up
to 2014, there is no study on the coverage of readers by Altmetric.com. In that year, the mean percentage of readers in
Altmetric.com grew to 16.3%, although the observations vary considerably. Hammarfelt (2014) noticed that 7.4% of books
have at least one Mendeley reader. Robinson-García et al. (2014) showed a little higher percentage (12%) in a very large
random sample of 2.8 million papers from WoS. Peters et al. (2014b) detected a range of readers from 8.6% in Humanities
to 20.6% in the Life Sciences. However, Zahedi et al. (2014c) observed a surprising 46% due, perhaps, to the sample being
set up by PLoS one papers, which could indicate that multidisciplinary journals have more saves in Mendeley (Zahedi et al.,
2014b). In 2015, the number of readers covered by Altmetric.com rose to 25.1%. Observations are now more stable and
the 38.9% of readers in Psychology and the 11.8% in History are worth mentioning (Htoo; Na, 2015). Other studies present
similar percentages (Alhoori et al., 2015; Zahedi et al., 2015a; Nuredini; Peters, 2016; Thelwall; Nevill, 2018). In 2016, the
articles by Meschede and Siebenlist (2018) and Torres-Salinas et al. (2018b) reached very similar percentages: 38% and
38.5%, respectively, which confirms the increasing coverage of readers by Altmetric.com. In 2017, the mean percentage fell
to 28.8%, as a result of the study by Htoo and Na (2017) about the disciplinary differences in altmetrics for Social Sciences,
when they verified the low number of readers in some disciplines such as Business (6.9%) and Law (8.3%). Excepting this
study, the percentages uniformly increase again, from the 40.1% of Ortega (2018b) and 40.8% of Bar-Ilan et al. (2019) to
the 60.6% of Zahedi and Costas (2018). This last high value is based on PLoS articles, which could pinpoint a bias in favour
of PLoS articles in Mendeley, as was seen in Zahedi et al. (2014c; 2014b). In 2018, these values remain stable between the
40.8% of Repiso et al. (2019) and the 42.4% of Bar-Ilan et al. (2019). However, Torres-Salinas et al. (2018a) found 20.4% of
readers in books, indicating the low coverage of books by Mendeley.

e290107                                                     El profesional de la información, 2020, v. 29, n. 1. eISSN: 1699-2407   7
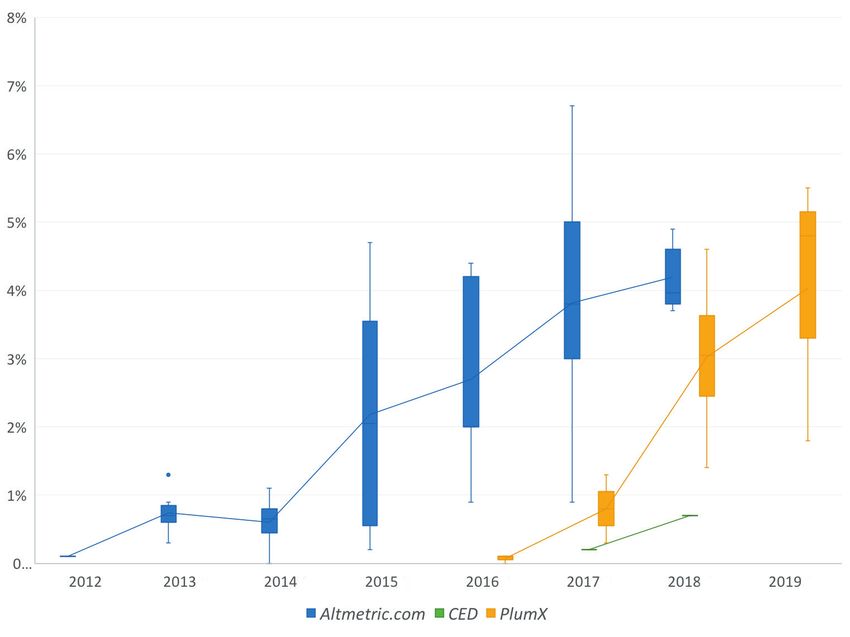
José-Luis Ortega

After Mendeley, PlumX is the aggregator with a better coverage of readers. In 2014, the first study with PlumX data (Pe-
ters et al., 2014b) already noted an elevated coverage from the 61.7% in Humanities to the 88.1% in Life Sciences. Howe-
ver, the study by Kraker et al. (2015), limited to Figshare objects, brought an anecdotal 2.2% of readers. In 2016, there
was great variability between the results of Meschede and Siebenlist (2018) (91.3%) and the outputs of Torres-Salinas
et al. (2017a; 2017b) (15.2%; 24.2%). The latter studies were restricted to books, indicating poor coverage and reading
of books in Mendeley as in Altmetric.com (Torres-Salinas et al., 2018a). In 2017, the average number of readers grew
dramatically (79.1%), thanks to studies by Bar-Ilan et al. (2019) (63.1%), Ortega (2018b) (77.7%) and Zahedi and Costas
(2018) (96.6%). This trend was reinforced in 2018 (89.4%) and 2019 (88.7%) with the results of Ortega (2018b), Zahedi;
Costas (2018), Bar-Ilan et al. (2019) and Gorraiz et al. (2018; 2019).
Mendeley is the service that produces the metric readers and, consequently, the coverage of papers in Mendeley (Graph
2) is similar to the trend of the number of papers with at least one reader (Graph 4). Even so, some studies have eviden-
ced that not all the references included in Mendeley have readers, so these pictures would not match exactly (Moham-
madi et al., 2015; Bornmann; Haunschild, 2016b; 2017). As mentioned in the section on coverage, Mendeley presents a
low proportion of readers between 2012 and 2014, the mean being 65.9% in 2012 (Haustein et al., 2014b; Mohammadi
et al., 2015) and 45.5% in 2013 (Zahedi et al., 2014a). As with coverage, the percentage of readers in Mendeley increa-
ses considerably in the middle of 2014, with values beyond 75% (Peters et al., 2014b; Bornmann; Haunschild, 2016b;
Thelwall; Wilson, 2016). In 2015, the average of readers reached 75.1% and in 2016, 96.1%. Finally, in 2018 it was near
to 100% (98.15%) (Didegah et al., 2018; Bar-Ilan et al., 2019; D’Angelo; Di-Russo, 2019).
Studies that used ImpactStory show a good coverage of readers. In 2013, Zahedi et al. (2014b) uncovered an average
of articles with 57.3% of readers, more than the 45.5% of Zahedi et al. (2014a), using Mendeley. This difference could
be attributed to different samples and ways of matching the data (i.e. articles with/without doi). Peters et al. (2014b)
maintained this percentage in 2015 (59.8%) and Kraker et al. (2015) fell to 1% when they studied the readers of Figshare
datasets. Lagotto showed a high 72.2% average of readers in 2014 (Zahedi et al., 2014c; Bornmann, 2014b; 2015). These
elevated values are again due to PLoS one, which attracts more attention than average, distorting the coverage of this
provider. In 2015, this percentage descended to 46% with the analysis by Zahedi et al. (2015a).
4.3.3. Wikipedia
Wikipedia’s citations are an important metric that describes the educational impact of scientific research (Kousha; The-
lwall, 2017). However, it is a metric with a low prevalence because it requires the writing of an entry and an important
selection of the most relevant bibliography. Graph 5 presents the evolution of the percentage of articles with a Wikipedia
citation included in each provider. Percentages do not exceed 7% in all the aggregators. Altmetric.com and PlumX descri-
be a steady increase since 2015, caused by the growth of the online encyclopaedia and the addition of different language
versions. Thus, the first study on the coverage of Wikipedia citations in Altmetric.com was performed in 2015 by Nure-
dini and Peters (2016), who observed a 1.1% of papers with mentions, and Thelwall and Nevill (2018) with 0.2%. These
proportions increased by 1.3% in 2016 and 2.4% in 2017. In 2018, there is a slight descent (1.7%) caused by the low
percentages found by De-Filippo
and Sanz-Casado (2018) (1.6%
and 1%) and Repiso et al. (2019)
(1.3%). These results are due to
the fact they are analysing Social
Sciences disciplines, which would
indicate fewer Wikipedia men-
tions to that research area than
to others (Zahedi et al., 2014b). In
2018, Torres-Salinas et al. (2018a)
found a disproportionate 11.7%
of Wikipedia mentions caused by
a sample based on books from
Book Citation Index (WoS). This
result suggests that books are
specially mentioned in Wikipedia,
due perhaps to the educational
orientation of the monographs.
PlumX also describes a constant
growth since the first observation
by Peters et al. (2014b) (0.7%) in
2014 to the last by Gorraiz et al.
(2019) (3%) in 2019. This signifi-      Graph 5. Yearly evolution of the percentage of Wikipedia’s citations in each provider

e290107                                                    El profesional de la información, 2020, v. 29, n. 1. eISSN: 1699-2407        8
Altmetrics data providers: A meta-analysis review of the coverage of metrics and publications

cant increase could be due to the indexation of entries in languages other than English (Allen, 2018). It is important
to notice that in 2016 Torres-Salinas et al. (2017b) found the astonishing proportion of 16% of Wikipedia citations in a
sample of books, close to the 11.7% in Altmetric.com (Torres-Salinas et al., 2018a), which would confirm that books are
more cited in Wikipedia than research papers (Kousha; Thelwall, 2017). ImpactStory presents a downward trend, star-
ting from a 1.3% of citations on average in 2013 to the 0.7% of Peters et al., (2014b) in 2014 and the 0.1% of Kraker et al.
(2015). Lagotto again shows a high main percentage (4.5%) because it is only representative of PLoS journals. Lastly, CED
was used in 2017 (Ortega, 2018b; Zahedi; Costas, 2018), resulting in an average of 1.7%, similar to PlumX and Altmetric.
com in that year.
4.3.4. Facebook
Facebook’s mentions are other important metrics resulting from a generalist social network. It counts the number of
mentions, shares and likes that a publication receives. However, when aggregators come to count Facebook mentions,
there are differences between them, which could produce inconsistencies in the comparison. Altmetric.com only in-
cludes posts on a curated list of
public pages, excluding likes and
individual pages (Altmetric Su-
pport, 2019). PlumX and Lagotto,
on the contrary, index and add
likes, comments and shares in a
single count (Allen, 2016; PLoS,
2019). Taking these facts into
consideration, Graph 6 presents
a constant increase of Facebook
mentions, mainly in Altmetric.
com and PlumX. Altmetric.com
evolves positively from the ave-
rage mentions of 1.3% in 2012
(Adie; Roe, 2013; Knight, 2014)
to the 9.2% in 2018 (De-Filippo;
Sanz-Casado, 2018; Repiso et
al., 2019; Robinson-García et al.,
2019) and 9.6% in 2019 (Wooldri-
dge; King, 2019). PlumX follows
a similar ascending pattern (on
average, 7% in 2014 to 9.8% in
2018), but with more peaks and         Graph 6. Yearly evolution of the percentage of Facebook’s mentions in each provider
troughs. Thus, the highest outlier
observation is the 16.3% found
by Zahedi and Costas (2018), due
to the use of a limited sample of
PLoS articles. As we have seen
before, articles from that publi-
sher present higher than average
values in social media metrics. It
is interesting that despite PlumX
counting more Facebook events,
the percentage of articles men-
tioned is very similar to Altmetric.
com. According to ImpactStory
and Lagotto, the observations
are anecdotal, with the 0.3% (Pe-
ters et al., 2014b) in 2014 and the
0.9% (Kraker et al., 2015) in 2015
of ImpactStory being the most
noteworthy. Lagotto describes
very high values (45.4% in 2014)
arising from the fact that PLoS
articles have a better presence in
social networks. Lagotto figures       Graph 7. Yearly evolution of the percentage of news’ mentions in each provider
are not depicted in the graph be-

e290107                                                   El profesional de la información, 2020, v. 29, n. 1. eISSN: 1699-2407   9
José-Luis Ortega

cause of the considerable distortion they cause.
4.3.5. News
News mentions measures the number of times that a research publication is mentioned in a news outlet. Unlike the
other metrics, this one is not based on a single source. Rather, it depends on the coverage of news media that each pro-
vider gets indexing, which can give rise to important differences between services. Graph 7 describes a steady increase
of news events in each provider, especially in the last three years. Only three services (Altmetric.com, PlumX and CED)
were used in the literature to extract news mentions. Altmetric.com presents a paused growth up to 2017, starting from
the 0.1% of Knight (2014) in 2012 to the mean 3.8% in 2017. Graph 7 shows a jump from 2015, motivated by the new
partnership with Moreover.com (Williams, 2015), which doubles the proportion of mentioned articles on news media.
In 2018, the coverage of news increased to the mean of 4.2% (Repiso et al., 2019; Dardas et al., 2018; Torres-Salinas et
al., 2018a; Ortega, 2019; Robinson-García et al., 2019). PlumX showed more continued growth, ranging from 0.1% in
2016 (Meschede; Siebenlist, 2018; Torres-Salinas et al., 2017a; 2017b) to 4% in 2019 (Gorraiz et al., 2019). According to
CED, Ortega’s papers show a coverage of 0.2% in 2017 (Ortega, 2018b) and of 0.7% in 2018 (Ortega, 2019), considerably
lower than PlumX and Altmetric.com, which have similar percentages.
4.3.6. Blogs
The last metric analysed is the number of references to scholarly outputs included in Blogs. In the manner of News,
this indicator is also influenced by the list of sources managed by each provider. Graph 8 illustrates the evolution of the
percentage of publications with that metric in each provider. Overall, the percentage of mentioned articles increased in
every service during the period
covered. Altmetric.com descri-
bes a constant rise in mentions,
from 0.6% for Knight (2014) in
2012 to the 8.8% average men-
tions in 2018. Throughout this
time span, worthy of notice is
the 0% of Latin-American articles
mentioned in 2014 by Alperin
(2015), which illustrates the low
presence of non-English literatu-
re in altmetric aggregators. Also
interesting is the significant co-
verage of articles on Psychology
(8.2%) reported by Htoo and Na
(2015) and Business (6.4%) by
Nuredini and Peters (2016) in
2015. This result could be due
to the important presence of
blogs specialising in Social Scien-
ces subjects such as Psychology,
Economics and Politics (Orte-
                                         Graph 8. Yearly evolution of the percentage of blog mentions in each provider
ga, 2019c). The growth of the
percentage of blog mentions in
PlumX is also continuous. Since 2016, the mean percentage of blogs mentions has increased from 0.8% to close to 3%
in 2019. In this period, the high value observed by Ortega (2019a) (5.8%) is noteworthy. According to other providers,
Lagotto presents an elevated proportion (9%) due to the aforementioned high presence of PLoS journals on social me-
dia. CED describes an increasing coverage of publications from 0.1% in 2017 (Ortega, 2018b) to 1.2% in 2018 (Ortega,
2019a).
4.4. Metrics proportion in each provider
This section describes the coverage and weight of the different metrics in each provider. The aim is to observe differen-
ces between services when they come to capture each metric.
Graph 9 depicts the distribution of the percentages of the eight most important metrics observed in the literature by alt-
metric provider. In general, Altmetric.com presents higher coverage in every metric with the exception of Facebook men-
tions, Mendeley readers and Wikipedia citations. In the case of Facebook, Lagotto captures more mentions (18.5%) than
Altmetric.com (15.6%) and PlumX (9%), caused mainly by the high coverage of PLoS articles in social networks (Priem et
al., 2012; Fenner, 2013; Zahedi; Costas, 2018). The distribution of Mendeley readers in each aggregator is skewed due to
different sample size and type. This is especially significant in the study of books, where the proportion of readers is very

e290107                                                 El profesional de la información, 2020, v. 29, n. 1. eISSN: 1699-2407   10
Altmetrics data providers: A meta-analysis review of the coverage of metrics and publications
low with regard to articles
100%
(Torres-Salinas et al., 2017b;
2018a). These authors found 90%
between 20.4% (Altmetric.
com) and 48.8% (PlumX) of 80%
readers. Leaving these counts
aside, PlumX is the platform 70%
that captures a higher pro-
60%
portion of Mendeley readers
(93.8%), followed by Lagotto 50%
(87.5%) and Altmetric.com
(80.9%). Mentions on Twitter 40%
also follow a skewed distri-
30%
bution with many outliers. In
the case of Altmetric.com, it 20%
is important to notice the first
observation of Adie and Roe 10%
(2013) when the service had
just started (1.5%); tweets to 0…
Blo… Facebook Google+ News Readers Reddit Tweets Wikipedia
books (Torres-Salinas et al., Altmetric.com ImpactStory Lagotto PlumX CED
2018a) (26.2%); geographical
and language biases in Spanish Graph 9. Box plot of the most important metrics by altmetric provider
(Torres-Salinas et al., (2018b)
(13%) and Latin-American ar-
ticles (Alperin, 2015) (24.2%); 25,0
and disciplinary differences in
nursing (Dardas et al., 2018)
(23.8%) and dentistry (Kolahi
20,0
et al., 2017) (21.5%). In spite
of these values, Altmetric.com
is by far the aggregator that
gathers the most Twitter men- 15,0
tions (72.5%), followed by La-
gotto (30.4%). PlumX gathers
29.2% on average, excepting
books (Torres-Salinas et al., 10,0
2017a; 2017b) and the study
of Peters et al. (2014b), when
PlumX did not yet use Gnip to 5,0
extract Twitter citations. CED
includes an average of 28.7%
of tweeted papers. Lastly, the
coverage of Wikipedia cita- ,…
Blo… Facebook Google+ News Readers Reddit Tweets Wikipedia
tions by CED is especially rele- Altmetric.com ImpactStory Lagotto PlumX Mendeley
vant because it is the service
that has a greater percentage Graph 10. Box plot of the frequency of events by paper according to provider
of articles cited on Wikipedia
(31.2%). This is mainly becau-
se it harvests entries from across Wikipedia, with no language limitation (Ortega, 2018b; Zahedi; Costas, 2018).
4.5. Average of events per publication
This indicator illustrates the frequency at which a paper is mentioned in different metrics. This measurement offers
information on the prevalence of events in every metric. It is calculated as the number of total events divided by the
number of publications in the sample.
This indicator describes a high level of scattering resulting from both the heterogeneous nature of the samples and
time and disciplinary differences. However, it is more stable when it comes to compare results across platforms. For
this reason, only multidisciplinary samples were used to analyse this measure. Graph 10 presents a low proportion of
events in almost every metric, with the exception of Facebook mentions, Mendeley readers and tweets. The remaining
metrics do not amount to 10 mentions on average. Altmetric.com is the service that has a better proportion of events
e290107 El profesional de la información, 2020, v. 29, n. 1. eISSN: 1699-2407 11José-Luis Ortega
per publication across all metrics, excepting Facebook and readers. In the case of Facebook mentions, the average of
events in PlumX (4.9) and Lagotto (2.6) is far greater than ImpactStory (0.03) and Altmetric.com (0.4). The reason for this
discrepancy is that PlumX and Lagotto include likes and shares as Facebook mentions (Peters et al., 2014b; Allen, 2016;
PLoS, 2019), causing an increase in the proportion of events by publication. More variability and higher complexity are
found in the proportion of readers by provider. The average of events per publication in Mendeley (10.3) is lower than
that observed in PlumX (15.5) and very similar to Lagotto (10.7) and ImpactStory (9.47). The higher proportion in PlumX
is paradoxically explained by the fact that PlumX groups duplicated articles, causing the average of readers by publica-
tion to be higher than with non-merged references. However, worth noting is the outlier in Mendeley of Alperin (2015),
who detected 0.6 of readers per publication in a sample of Latin-American publications. This low proportion could again
suggest a bias detrimental to non-English papers. On the contrary, the proportion of 21.5 readers found by Bornmann
and Haunschild (2016b) refers to review articles, which explains why this type of publication attracts a high proportion
of readers. According to tweets, PlumX (3.5), Lagotto (3.4) and Altmetric.com (3.3) depict similar averages of mentions
by publication, which suggests that these providers do not present significant differences in counting tweets per article.
These percentages change when the most recent articles are observed (2018-2019). In this case, PlumX has 4.5 and
Altmetric.com has 4 tweets per article. Nevertheless, some outliers influence these figures. Bornmann (2015) observed
an elevated proportion of tweets (7.8) to recommended articles on F1000, a fact that could influence the mention of
these articles on Twitter. Also interesting to note is the recent study by Gorraiz et al. (2019), who found 10.3 tweets per
article in publications from the University of Vienna. This study confirms the increase in the number of tweets per article
in recent years.
4.6. Disciplines
This section examines disciplinary differences in the coverage of publications in each provider and explores how each
metric is distributed in different disciplines. All Science Journal Classification (ASJC) was used to group the different dis-
ciplinary studies (https://pg.edu.pl/documents/611754/75313317/asjc).
From this classification, Social Science and Humanities and Physical Sciences and Engineering were broken up to observe
the specific behaviour of these categories: 52 (49%) articles from the sample show some disciplinary information and
only 18 (17%) include data from providers other than Altmetric.com. This lack of data means that most of the results are
only based on one or two observations, which could lead to inaccurate results and cautious interpretation.
The disciplinary coverage of publications has been studied in only three providers, Altmetric.com, Mendeley and Im-
pactStory. The remaining were used to track the coverage of specific metrics but not the general coverage of these plat-
forms. The reason is that some providers were limited to specific sources (Lagotto) or to particular institutions (PlumX).
Graph 11 presents the distribution of each research area according to the three providers analysed. In general, only two
research areas present significant differences: Health Science and Social Sciences. Health Sciences describes higher cove-
rage levels in all three providers. In the case of Altmetric.com, this proportion goes from the 19.3% of Knight (2014) to the
69.3% of Bornmann (2014a), with an average of 38%. Mendeley has better coverage, reaching 87.5% of articles. Interes-
ting to note is the outlier of Haustein and Larivière (2014) with a 65.9%, due mainly to the fact that this study is previous
to Mendeley’s integration with
Scopus (Bonasio, 2014; Scopus, 100%
2014). In the case of ImpactStory,
only one publication contained 90%
information about its disciplinary
coverage (Zahedi et al., 2014b). 80%
Thus, this platform captures 36% 70%
of Health Sciences papers. Inte-
restingly, Social Sciences (25.7%) 60%
and Humanities (22.8%) have on
50%
average more publications inclu-
ded in Altmetric.com than the re- 40%
maining areas. However, this pat-
tern is not observed in Mendeley, 30%
where Life Sciences (95.7%) and
20%
Physical Sciences (85%) are the
research areas that have more do- 10%
cuments (Zahedi; Van-Eck, 2018).
These differences between Men- 0…
Engineering sciences Life Sciences Social Sciences
deley and Altmetric.com could be Health Sciences Humanities Physical sciences
because Altmetric.com only cap- Altmetric.com Mendeley ImpactStory
tures publications that have pre-
viously been mentioned in social Graph 11. Box plot of the disciplinary coverage of publications by provider
e290107 El profesional de la información, 2020, v. 29, n. 1. eISSN: 1699-2407 12Altmetrics data providers: A meta-analysis review of the coverage of metrics and publications
Blogs Readers
14% 100%
90%
12% 80%
10% 70%
60%
8%
50%
6% 40%
4% 30%
20%
2% 10%
0% 0%
Engineering… Life Sciences Social Sciences Engineering… Life Sciences Social Sciences
Health Sciences Humanities Physical sciences Health Sciences Humanities Physical sciences
Altmetric.com Lagotto PlumX Altmetric.com Mendeley PlumX ImpactStory
Facebook mentions Tweets
14% 100%
90%
12% 80%
10% 70%
60%
8%
50%
6% 40%
4% 30%
20%
2% 10%
0% 0%
Engineering… Life Sciences Social Sciences Engineering… Life Sciences Social Sciences
Health Sciences Humanities Physical sciences Health Sciences Humanities Physical sciences
Altmetric.com ImpactStory PlumX Altmetric.com ImpactStory PlumX Lagotto
Graph 12. Distribution of the disciplinary coverage of publications by altmetric provider according to four metrics: blogs, Mendeley readers, Facebook
mentions and tweets
networks (Haustein et al., 2015; Bar-Ilan et al., 2019). Another reason could be that Mendeley readers could be dis-
tributed thematically as bibliometric indicators, owing to the strong correlation between these metrics (Mohammadi;
Thelwall, 2014; Mohammadi et al., 2015).
Graph 12 displays the distribution of the percentage of documents mentioned in four metrics: blogs, readers, Facebook
mentions and tweets. The remaining metrics were not studied because of the absence of specific data on the coverage
of these metrics from a disciplinary perspective. In fact, many of the observations in Graph 12 come from only one or
two studies. This lack of data led us to carefully interpret and to limit the analysis to the most studied metrics. For exam-
ple, the analysis of blogs shows a predominance of Altmetric.com data. In this sense, Physical Sciences (5.3%) and Social
Sciences (3.6%) are the most mentioned disciplines in blogs according to Altmetric.com. This proportion coincides with
the results of Ortega (2019c) about the disciplinary coverage of blog sites, which suggests a strong relation between the
mention of articles by discipline and the thematic content of the sources.
Facebook mentions also depicts a majority of Altmetric.com observations, but now the disciplines with a greater mean
proportion of mentioned publications are Health Sciences (6.2%) and Social Sciences (5%). This raised value for Social
Sciences is due to the special presence of Sociology (12.4%) and Communication (11.2%) reported by De-Filippo and
Sanz-Casado (2018). However, PlumX presents better percentages than Altmetric.com in every metric, particularly for
Life Sciences (8.6%) and Social Sciences (7.3%) (Peters et al., 2014b).
More data were found for readers. Obviously, Mendeley has a better mean percentage of publications than the other
services, but PlumX presents very close percentages, which reveals that PlumX manages better duplicated records and
that both services are now integrated into Elsevier’s products, sharing bibliographic information. However, data about
PlumX are taken only from two works (Peters et al., 2014b; Bar-Ilan et al., 2019), so these results should be read with
caution. In general, it is interesting to note that Social Sciences is the discipline with the best coverage in all providers,
with the exception of ImpactStory. This important presence of the Social Sciences was previously reported by Haustein
et al. (2014b) when they detected 81% of readers in Psychology; Htoo and Na (2015) notice more than double the num-
ber of readers in Psychology (39%) than in History (11.8%) or Linguistics (17.6%); and Zahedi et al. (2017) perceived that
Social Sciences, Humanities (18.1%), along with Life and Earth Sciences (18.6%), were the disciplines with more readers.
Finally, the coverage of tweeted papers by discipline presents an unlikely behaviour. In Altmetric.com, Health Sciences
(28%) and Social Sciences (24.5%) are the research categories that attract more tweets on average, whereas Impact
Story, Life Sciences (7.6%) and Physical Sciences (6%) are the most tweeted disciplines. PlumX depicts a strong collection
of Social Sciences publications (21.7%), although this result is obtained at the expense of the absence of more discipli-
nary data.
4.7. Comparative
e290107 El profesional de la información, 2020, v. 29, n. 1. eISSN: 1699-2407 13José-Luis Ortega The existence of different services that provide similar metrics have led to the appearance of some studies that compare coverage and counts between services. However, the number of publications that address this issue is low: only seven studies comparing different providers were located in the literature. The first attempt was performed by Zahedi et al. (2014c) with data from February 2014. They randomly selected 1,000 articles from PLoS one. This sample allowed them to compare Lagotto, Altmetric.com and Mendeley. Their results showed that the data reported by these providers were not consistent and revealed important differences. Mendeley was the service that indexed more publications, Altmetric. com captured more tweets and Lagotto had a special coverage of Facebook mentions. A few months later, Peters et al. (2014b), with data from August 2014, analysed 1,740 publications from the Leibniz Association, a multidisciplinary research organisation from Germany. These publications were searched in four services: Plum Analytics (PlumX), Im- pactStory, Altmetric Explorer (Altmetric.com) and Mendeley (through Webometric Analyst). Because the publications could be classified in research areas, they were also able to perform a disciplinary study. The principal result was the verification of the great discrepancy between services, even when using the same sources. In this sense, they evidenced that PlumX barely provided information about tweets, but displayed high scores for Facebook mentions and Mendeley readers. Altmetric.com, on the contrary, was the platform with the best coverage of tweets. From a disciplinary perspec- tive, these authors observed that Science, Technology and Medicine (STM) articles attracted more attention than other disciplines. Kraker et al. (2015) compared two altmetric aggregators: PlumX and ImpactStory, using a small sample of datasets (1000 items) from Figshare. They perceived that PlumX detected considerably more items in social media and also found higher altmetric scores than ImpactStory. In July 2015, Zahedi et al. (2015a) used a random sample of 30,000 articles from Crossref and WoS to check the same providers as in 2014 (Zahedi et al., 2014c). Their results confirmed previous outputs about coverage and metrics. However, this is the first work that explored the counting differences between providers according to the same metric. Thus, they reported that in general Mendeley had a higher number of readers than Lagotto and Altmetric.com, Lagotto counted more Facebook mentions than Altmetric.com, and Altmetric. com collected more tweet counts. Not until 2018 were there more systematic comparisons between altmetric aggregators. Meschede and Siebenlist (2018), with data from September 2016, analysed 50,000 dois from WoS in Altmetric.com and PlumX. They found that PlumX almost covered 100% (91%), while Altmetric.com only collected 38% of the sample. According to the metrics, pu- blications on Altmetric.com have better scores than PlumX in all the metrics, with the exception of Mendeley readers and Wikipedia citations. From these results, it is interesting to note that Altmetric.com has slightly more papers mentioned in Facebook than PlumX, a result that contradicts other studies (Peters et al., 2014b). In the same year, but with data from May 2017, Ortega (2018b) compared the coverage and counts of 67,000 papers extracted from PlumX in three altmetric data services: Altmetric.com, PlumX and CED. Although the sample could be biased in favour of PlumX, the coverage of Altmetric.com was above 40%, while CED included only 4% of publications with at least one metric. According to metrics, PlumX (98.6%) captured more documents with readers than Altmetric.com (95.7%), but much fewer articles with men- tions on Twitter (22.3%) than Altmetric.com (38%). This last percentage in PlumX is lower than previous studies (Kraker et al., 2015) but in line with recent analyses (Meschede; Siebenlist, 2018, 21%; Zahedi; Costas, 2018; 23.9%). Doubtless- ly, the most complete analysis of the coverage of altmetric providers was performed by Zahedi and Costas (2018), who tested 31,000 PLoS one articles in June 2017 on five data platforms: Altmetric.com, CED, Lagotto, PlumX and Mendeley. Despite the fact that using data about only one journal could not be representative, their results were consistent with previous studies, though with higher proportions. Thus, for example, PlumX, Lagotto and Mendeley reached a coverage above 90%, while Altmetric.com obtained 61% and CED 7% —a percentage much greater than previous studies (Zahedi et al., 2015a; Ortega, 2018b; Meschede; Siebenlist, 2018). A similar interpretation could be made with the high number of tweeted papers (57%) in Altmetric.com, much higher than the 38% of Ortega (2018) and the 36% of Meschede and Siebenlist (2018). The last study now comparing altmetric aggregators was published by Bar-Ilan et al. (2019). These authors examined 2,700 articles from the Journal of the Association for Information Science and Technology at two di- fferent moments —June 2017 and April 2018— in PlumX, Mendeley and Altmetric.com. The results were very similar to previous studies, confirming that PlumX (87%) and Mendeley (98.6%) have almost full coverage of readers. However, it is interesting to note that the number of tweets captured by PlumX (30%) is close to that of Altmetric.com (35%), which suggests that PlumX is addressing their disadvantages by capturing tweets. 5. Limitations The realisation of a meta-analysis about the coverage and counting of altmetric providers has evidenced that the re- viewed literature presents very different results, showing an elevated variability between similar observations. For example, Graph 2, on the evolution of the different services, depicts wide annual margins in the percentage of covered publications. This instance is perceived in the evolution of the different metrics (reads, tweets, Facebook mentions, etc.). This inaccuracy is mainly caused by the different ways of selecting the sample, which could produce a wide range of biases. For example, the use of some specific sources such as recommended articles from F1000 (Bornmann, 2014; 2015; Bornmann; Haunschild, 2015; 2018) or articles from specific journals such as PLoS One (Zahedi et al., 2014c; De-Winter, 2015; Zahedi; Costas, 2018) and Journal of the Association for Information Science and Technology (Bar-Ilan et al., 2019) produce specific results that can hardly be generalised. Another important bias is introduced when local e290107 El profesional de la información, 2020, v. 29, n. 1. eISSN: 1699-2407 14
You can also read