Chemical Analysis of Pollen by FT-Raman and FTIR Spectroscopies - fulir
←
→
Page content transcription
If your browser does not render page correctly, please read the page content below
ORIGINAL RESEARCH
                                                                                                                                             published: 31 March 2020
                                                                                                                                         doi: 10.3389/fpls.2020.00352

                                             Chemical Analysis of Pollen by
                                             FT-Raman and FTIR Spectroscopies
                                             Adriana Kendel
                                                         ¯ 1 and Boris Zimmermann 2,3*
                                             1
                                              Division of Analytical Chemistry, Department of Chemistry, Faculty of Science, University of Zagreb, Zagreb, Croatia,
                                             2
                                              Faculty of Science and Technology, Norwegian University of Life Sciences, Ås, Norway, 3 Division of Organic Chemistry
                                             and Biochemistry, Ruder ¯ Bošković Institute, Zagreb, Croatia

                                             Pollen studies are important for the assessment of present and past environment,
                                             including biodiversity, sexual reproduction of plants and plant-pollinator interactions,
                                             monitoring of aeroallergens, and impact of climate and pollution on wild communities
                                             and cultivated crops. Although information on chemical composition of pollen is
                                             of importance in all of those research areas, pollen chemistry has been rarely
                         Edited by:
                                             measured due to complex and time-consuming analyses. Vibrational spectroscopies,
                   Andras Gorzsas,           coupled with multivariate data analysis, have shown great potential for rapid chemical
            Umeå University, Sweden
                                             characterization, identification and classification of pollen. This study, comprising
                        Reviewed by:
                                             219 species from all principal taxa of seed plants, has demonstrated that high-
                      Scott D. Russell,
          The University of Oklahoma,        quality Raman spectra of pollen can be obtained by Fourier transform (FT) Raman
                         United States       spectroscopy. In combination with Fourier transform infrared spectroscopy (FTIR), FT-
                  Barry Harvey Lomax,
             University of Nottingham,
                                             Raman spectroscopy is obtaining comprehensive information on pollen chemistry.
                      United Kingdom         Presence of all the main biochemical constituents of pollen, such as proteins, lipids,
                   Notburga Gierlinger,
                                             carbohydrates, carotenoids and sporopollenins, have been identified and detected in the
       University of Natural Resources
            and Life Sciences, Austria       spectra, and the study shows approaches to measure relative and absolute content of
                  *Correspondence:           these constituents. The results show that FT-Raman spectroscopy has clear advantage
                   Boris Zimmermann          over standard dispersive Raman measurements, in particular for measurement of pollen
         boris.zimmermann@nmbu.no
                                             samples with high pigment content. FT-Raman spectra are strongly biased toward
                   Specialty section:        chemical composition of pollen wall constituents, namely sporopollenins and pigments.
         This article was submitted to       This makes Raman spectra complementary to FTIR spectra, which over-represent
 Technical Advances in Plant Science,
               a section of the journal      chemical constituents of the grain interior, such as lipids and carbohydrates. The results
            Frontiers in Plant Science       show a large variability in pollen chemistry for families, genera and even congeneric
         Received: 08 October 2019           species, revealing wide range of reproductive strategies, from storage of nutrients to
          Accepted: 10 March 2020
                                             variation in carotenoids and phenylpropanoids. The information on pollen’s chemical
          Published: 31 March 2020
                                             patterns for major plant taxa should be of outstanding value for various studies in
                             Citation:
        Kendel
             ¯ A and Zimmermann B            plant biology and ecology, including aerobiology, palaeoecology, forensics, community
(2020) Chemical Analysis of Pollen by        ecology, plant-pollinator interactions, and climate effects on plants.
 FT-Raman and FTIR Spectroscopies.
              Front. Plant Sci. 11:352.      Keywords: Raman spectroscopy, Fourier transform infrared spectroscopy, multivariate analysis, male
       doi: 10.3389/fpls.2020.00352          gametophyte, flowering, pollen wall, pollination, palynology

Frontiers in Plant Science | www.frontiersin.org                                   1                                              March 2020 | Volume 11 | Article 352
Kendel
    ¯ and Zimmermann                                                                                       Pollen Analysis by Vibrational Spectroscopies

INTRODUCTION                                                                 provide valuable information on past environmental conditions
                                                                             (Lomax et al., 2012).
Pollen is multicellular haploid gametophyte life stage of seed                  Vibrational spectroscopy of pollen offers a novel approach in
plants (spermatophytes) and thus it has a key function in plant life         plant phenomics via precise and comprehensive measurement of
cycle. Due to their high mobility by abiotic and biotic pollination          pollen’s biochemical ‘fingerprint.’ Vibrational spectra of pollen
vectors, pollen play an essential role in the gene flow within and           contain specific signals of lipids, proteins, carbohydrates and
among plant populations. Therefore, pollen studies are important             water, and even some minor biochemical constituents, such
for assessment of environment, including biodiversity, plant–                as pigments, can be precisely measured (Schulte et al., 2008,
pollinator interactions, and impact of climate and pollution                 2009; Zimmermann, 2010; Pummer et al., 2013; Zimmermann
on wild communities and cultivated crops. Moreover, pollen is                and Kohler, 2014; Bagcioglu et al., 2015; Jardine et al., 2015).
seasonal air pollutant that can trigger allergy-related respiratory          The compounds that are measurable by vibrational spectroscopy
diseases, and thus pollen monitoring is needed for avoidance                 are the principal structural and nutritious components, and
and timely treatment of symptoms. Finally, fossil pollen grains              they are responsible for the majority of chemical phenotypic
are often the most abundant and the best preserved remains                   attributes of pollen. Therefore, chemical analysis of pollen by
of plant species, thus providing crucial information for the                 vibrational spectroscopy offers complementary information to
reconstruction of past terrestrial communities and climate                   the contemporary ‘omics-based’ approaches, such as genomics
conditions (Lindbladh et al., 2002; Jardine et al., 2016). In general,       and transcriptomics by sequencing technologies, as well as
pollen studies can provide information on spatial and temporal               to proteomics and metabolomics by mass spectrometry and
distribution of organisms and populations, as well as on the                 NMR spectroscopy.
biological and environmental processes influencing them. As a                   Vibrational studies of pollen, by diverse infrared and Raman
result, pollen studies have been extensively conducted in biology,           techniques, have shown that vibrational spectroscopy achieves
ecology, palaeoecology, medicine, agronomy, and forensics.                   economical and rapid identification and classification of
    Most of the pollen studies are focused on a quite limited                pollen according to taxonomy and phylogenetic relationship
number of traits, such as pollen morphology, pollen production               (Pappas et al., 2003; Ivleva et al., 2005; Gottardini et al., 2007;
per flower, pollen transfer, pollinator attraction, and pollen               Schulte et al., 2008; Dell’anna et al., 2009; Zimmermann, 2010,
viability (Bell, 1959; Bassani et al., 1994; Molina et al., 1996;            2018; Guedes et al., 2014; Zimmermann and Kohler, 2014;
Pacini et al., 1997; Streiff et al., 1999; Tamura and Kudo,                  Zimmermann et al., 2015b; Julier et al., 2016; Seifert et al.,
2000; Oddou-Muratorio et al., 2005; Hall and Walter, 2011;                   2016; Woutersen et al., 2018; Jardine et al., 2019; Mondol
Welsford et al., 2016). The most important reason for such                   et al., 2019). For example, the recent FTIR microspectroscopy
deficiency of data, compared to information on female traits, is             study on individual pollen grains has achieved more accurate
relative difficulty of quantitative and qualitative measurements             classification than optical microscopy, which is the benchmark
of male traits (Williams and Mazer, 2016). In particular, pollen             method in pollen identification (Zimmermann et al., 2016).
chemical composition has been rarely measured due to complex                 Moreover, FTIR microspectroscopy enables chemical imaging of
and time-consuming analyses. For example, triglyceride lipids                pollen grain ultrastructure (Zimmermann et al., 2015a), while
(triacylglycerols) primarily serve as carbon and long-term energy            even higher spatial resolution of Raman microspectroscopy
reserves in a form of lipid bodies that play a crucial role, as              enables monitoring of the molecular composition during pollen
a source of materials and energy, in germination of pollen as                germination and pollen tube growth (Schulte et al., 2010; Joester
well as in pollen tube growth (Piffanelli et al., 1998; Rodriguez-           et al., 2017). In addition to classification and identification
Garcia et al., 2003). This is of importance since the reproduction           studies, vibrational spectroscopies provide biochemical
of seed plants involves competition among growing pollen                     characterization of pollen with respect to environmental
tubes to reach and penetrate the ovule. Carbohydrates, in the                conditions. For example, differences in chemical phenotypes
form of cytoplasmic saccharides, have a vital function in the                of pollen were measured with respect to nutrient availability
resistance of pollen to dehydration and temperature stress, as               (Zimmermann et al., 2017), heat stress (Lahlali et al., 2014;
well as serving as grain wall components (cellulose) and energy              Jiang et al., 2015), pollution stress (Depciuch et al., 2016,
reserves for germination (starch and sucrose) (Pacini et al.,                2017), location (Bağcıoğlu et al., 2017; Zimmermann et al.,
2006; Bokszczanin et al., 2013). Pollen’s proteins have both                 2017), and season (Zimmermann and Kohler, 2014; Bağcıoğlu
structural and functional role, and have implication for both                et al., 2017). In general, Raman and Fourier transform infrared
pollen-pistil and plant-pollinator interactions (Roulston et al.,            (FTIR) spectroscopies provide chemically complementary
2000). Pollen proteins are important source of dietary nitrogen              information, and therefore measurement of samples by both
for a majority of pollinators, while as enzymes they have crucial            techniques provides highly detailed biochemical characterization
function during pollen tube growth (Roulston et al., 2000).                  (Zimmermann, 2010; Pummer et al., 2013; Bagcioglu et al., 2015;
Pigments, such as carotenoids and flavonoids, participate in                 Zimmermann et al., 2015a; Diehn et al., 2020).
light harvesting, serve as cellular membrane protectants from                   One important advantage of Raman spectroscopy of pollen
photooxidative damage, and as pathogen defense (Fambrini                     over FTIR approach is the obtained information on grain wall
et al., 2010; Lutz, 2010). Finally, sporopollenins are complex               pigments, in particular carotenoids, which cannot be measured
and resilient grain wall biopolymers that protect the grain                  at all by FTIR due to low concentrations and weak signals
interior from environmental effects (Li et al., 2019), and can               (Schulte et al., 2009). Unfortunately, Raman measurements

Frontiers in Plant Science | www.frontiersin.org                         2                                         March 2020 | Volume 11 | Article 352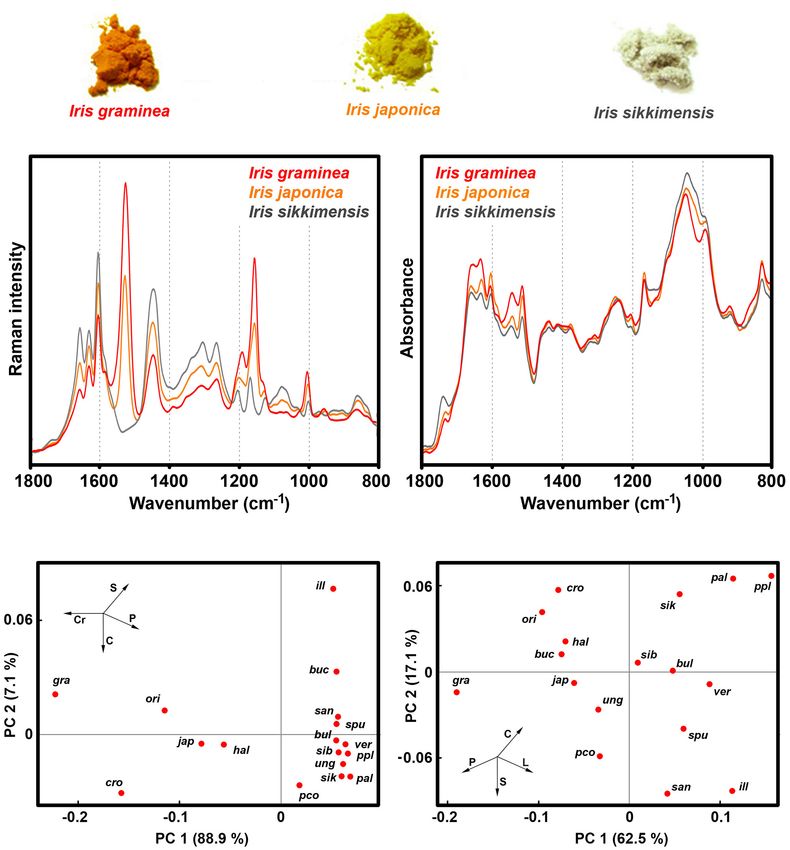
Kendel
    ¯ and Zimmermann                                                                                   Pollen Analysis by Vibrational Spectroscopies

are often hindered by laser-induced degradation (burning) of             pollen chemistry information obtained by either FT-Raman
pollen grains, and by the strong fluorescence background that            or FTIR approach, and thus demonstrates advantages of the
often masks any underlying Raman spectra (Ivleva et al., 2005;           combined approach with both techniques. The biochemical
Schulte et al., 2008; Guedes et al., 2014). An interesting aspect        characterization of pollen for the major plant lineages is provided,
of Raman spectroscopy is that pigments, such as carotenoids              in particular regarding lipid, protein, carbohydrate, carotenoid
and chlorophylls, exhibit resonance Raman spectra of various             and phenylpropanoid content. Pollen chemistry, obtained by the
intensities (De Oliveira et al., 2009). Resonance Raman spectra          spectroscopic approach, was discussed in relation to the results
occur when the wavelength of the excitation laser coincides              of the standard chemical analysis pollen studies. Moreover,
with electronic transition. For example, the conjugated nature           quantitative measurement of pollen protein content has been
of π-electrons from the polyene backbone of carotenoids results          provided by combining spectroscopy and chemometrics, clearly
in electronic states of lower energy, often with absorption in the       demonstrating potential of vibrational spectroscopy for not only
visible part of the spectrum. For this reason, carotenoids usually       qualitative but also quantitative chemical analysis of pollen.
display strong yellow, orange and red colors. Moreover, this can
cause strong enhancement of vibrational bands in carotenoids,
especially those at 1530 (related to −C=C− bonds) and                    MATERIALS AND METHODS
1160 cm−1 (related to −C−C− bonds) that have strong electron-
phonon coupling. Resonance Raman spectra of pigments enable              Samples
measurement of very low concentration of pigments (Schulte               Samples of pollen were collected at two facilities of the
et al., 2009). However, resonant Raman spectra can also mask             University of Zagreb; the Botanical Garden of the Faculty of
completely the regular Raman spectral contributions from other           Science and the Botanical Garden “Fran Kušan” of the Faculty
compounds, thus hindering their analysis (Schulte et al., 2008).         of Pharmacy and Biochemistry. Both locations are situated
Use of visible excitation lasers, such as 633 nm, often results          within 1.5 km radius and can be considered the same climate
with strong light absorbance of pollen sample, leading to sample         area. 219 samples were collected altogether, each belonging
heating and even photodegradation (Schulte et al., 2008, 2009).          to different plant species (Table 1, Supplementary Table S1,
   These problems, that are common in conventional                       and Supplementary Figure S1). Pollen samples were collected
(dispersive) Raman measurements, can be addressed by                     during 2011 and 2012 pollination seasons. The pollen samples
Fourier transform (FT) Raman spectroscopy that uses high-                were collected directly from plants at flowering time, either
wavelength near infrared (NIR) laser excitation. In general,             by shaking flowers (anemophilous species) or collecting mature
electronic transitions are weaker at longer wavelengths, and             anthers (entomophilous species). Only one sample per species
thus detrimental effect of sample heating can be avoided by              was created, either by collecting pollen from only one plant or
use of NIR lasers. Moreover, the frequency of the NIR laser              by collecting pollen from several individuals of the same species
usually does not correspond to an electronic transition of               followed by merging of all the collected pollen into one sample.
the sample, thus diminishing possibility for the occurrence of           The samples were kept in paper bags at r.t. for 24 h (together with
fluorescence. Finally, use of longer Raman excitation wavelengths        anthers for entomophilous species), and afterward transferred to
can significantly increase penetration depth, compared to short-         vials as dry powder and stored at −15◦ C. For the spectroscopic
wavelength lasers, thus more comprehensive information                   measurements, three replicates per technique were measured,
on pollen composition could be obtained (Moester et al.,                 each replicate comprising approx. 0.5–1.0 mg of pollen sample.
2019). However, these important advantages of FT-Raman                   Approx. 103 –105 pollen grains per replicate were measured, and
spectrometers can be overshadowed by sensitivity advantage               considering that each pollen grain has a unique genotype (and
of dispersive Raman spectrometers with short-wavelength laser            implicitly phenotype), each measurement comprised biologically
excitation. Nevertheless, our preliminary study, employing               distinct pollen population. However, in a majority of cases
FT-Raman spectroscopy for measurement of 43 conifer species,             (for example for all tree species) genetic pool was very limited
has shown that high-quality FT-Raman spectra of pollen can               since it originated from the same sporophyte parent plant.
be recorded (Zimmermann, 2010). The spectra were devoid of               Therefore, the presented variation in the spectral sets can be
detrimental fluorescence and heating effects, thus indicating            considered a preliminary estimate for the measured plant groups.
great potential of FT-Raman spectroscopy for identification and          Influence of larger genetic pools, growth conditions, location and
analysis of plants.                                                      year of pollination on pollen chemical composition and pollen
   In the paper at hand, we explore the use of FT-Raman and              classification for a number of plant groups (e.g., grasses, pines,
FTIR spectroscopy for chemical characterization of pollen. The           and oaks) were covered in our previous studies (Zimmermann
study was conducted on a diverse set of plants, comprising               and Kohler, 2014; Bağcıoğlu et al., 2017; Zimmermann et al.,
219 species, belonging to 42 families, and covering all major            2017; Diehn et al., 2020).
taxa of seed plants. Firstly, we wanted to demonstrate that                  For identification of basic biochemicals in pollen a set
high-quality Raman spectra of pollen can be obtained by                  of model compounds was measured to correlate with high
FT-Raman technique. In particular, Raman spectra of pollen               positive or negative values in the principal component analyses
samples with high pigment content, which regularly cannot                loadings plots. Spectra of crystal lipids and carbohydrates
be measured intact with dispersive Raman, were obtained by               were recorded above their melting temperature, and again
FT-Raman spectroscopy. Secondly, the study highlights unique             at r.t. after cooling to obtain spectrum of amorphous

Frontiers in Plant Science | www.frontiersin.org                     3                                         March 2020 | Volume 11 | Article 352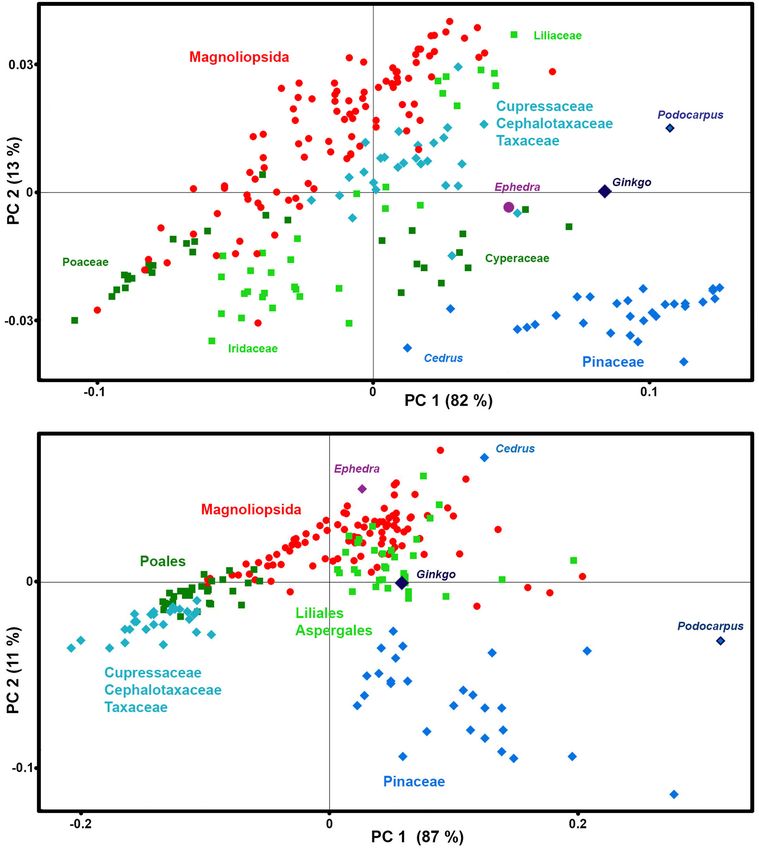
Kendel
    ¯ and Zimmermann                                                                                                Pollen Analysis by Vibrational Spectroscopies

TABLE 1 | List of analyzed plant taxa with number of genera and species covered       and phenylpropanoids: rutin, β-carotene, p-coumaric acid,
by the study (see Supplementary Table S1 for details).
                                                                                      ferulic acid, caffeic acid, sinapic acid, hydro-p-coumaric acid,
Clade              Order             Family             No. of        No. of          hydroferulic acid, hydrocaffeic acid. Carbohydrates: cellulose,
                                                        genera       species          amylose, amylopectin, arabinoxylan, pectin, β-D-glucan, sucrose,
                                                                                      trehalose, fructose, glucose. Proteins: gluten. All chemicals
Eudicots           Fagales           Betulaceae            5            13
                                                                                      were purchased from Merck (Darmstadt, Germany) and
                                     Fagaceae              2            11
                                                                                      Sigma-Aldrich (St. Louis, United States), and used without
                                     Juglandaceae          3             6
                                                                                      further purification.
                   Malpighiales      Salicaceae            2             3
                                     Euphorbiaceae         1             1
                   Lamiales          Oleaceae              1             3            Spectroscopic Analyses
                                     Plantaginaceae        2             4            The Raman spectra in backscattering geometry were recorded on
                                     Scrophulariaceae      1             1            a FT-Raman FRA 106/S model, coupled with a Bruker Equinox
                                     Acanthaceae           1             1            55 IR spectrometer, equipped with a neodymium-doped yttrium
                   Solanales         Solanaceae            3             4            aluminum garnet (Nd:YAG) laser (1064 nm, 9394 cm−1 ), and
                   Proteales         Platanaceae           1             2            germanium detector cooled with liquid nitrogen. The spectra
                   Saxifragales      Altingiaceae          1             2            were recorded with a resolution of 4 cm−1 , with a digital
                                     Paeoniaceae           1             2            resolution of 1.9 cm−1 , and with a total of 64 scans, using
                   Sapindales        Sapindaceae           1             1            Blackman–Harris 4- term apodization and with a laser power of
                                     Anacardiaceae         1             2            400 mW. Each pollen sample was measured in three replicates.
                                     Rutaceae              1             1               The infrared spectra were recorded on an ABB Bomem
                   Dipsacales        Adoxaceae             2             3            (Quebec City, Canada) MB102 single-beam spectrometer,
                                     Dipsacaceae           1             1            equipped with cesium iodide optics and deuterated triglycine
                   Buxales           Buxaceae              1             2            sulfate (DTGS) detector. The reflectance spectra were recorded
                   Rosales           Rosaceae              4             5            by using the single-reflection attenuated total reflectance (SR-
                                     Urticaceae            1             1            ATR) accessory with the horizontal diamond prism and with 45◦
                   Ranunculales      Ranunculaceae         5            10            angle of incidence. The SR-ATR infrared spectra were measured
                                     Papaveraceae          3             5            with a Specac (Slough, United Kingdom) Golden Gate ATR Mk
                   Caryophyllales    Polygonaceae          1             4            II or a Specac High Temperature Golden Gate ATR Mk II. The
                   Asterales         Asteraceae            2             3            spectra were recorded with a spectral resolution of 4 cm−1 , with a
                                     Campanulaceae         1             1            digital resolution of 1.9 cm−1 , and with a total of 30 scans, using
                   Malvales          Malvaceae             3             3            cosine apodization. Each spectrum was recorded as the ratio of
Magnoliids         Magnoliales       Magnoliaceae          2             2            the sample spectrum to the spectrum of the empty ATR plate.
Monocots           Poales            Cyperaceae            3            11            Each pollen sample was measured in three replicates.
                                     Poaceae               9            18
                                     Juncaceae             1             2
                                                                                      Spectral Pre-processing and Data
                   Asparagales       Iridaceae             1            17
                                     Xanthorrhoeaceae      2             4
                                                                                      Analysis
                   Liliales          Liliaceae             2            10
                                                                                      The spectra were pre-processed prior to calibration: all spectra
                   Arecales          Arecaceae             1             1            were smoothed by the Savitzky–Golay algorithm using a
Gymnosperms        Pinales           Cupressaceae          11           23            polynomial of degree two and a window size of 11 points in
                                     Taxaceae              1             2            total, followed by normalization by extended multiplicative signal
                                     Cephalotaxaceae       2             2            correction (EMSC), an MSC model extended by a linear and
                                     Pinaceae              5            29            quadratic component (Zimmermann and Kohler, 2013; Guo
                                     Podocarpaceae         1             1            et al., 2018). The following spectral regions were selected for
                   Ginkgoales        Ginkgoaceae           1             1            data analysis: 1900-800 cm−1 for infrared spectra, and 2000-
                   Ephedrales        Ephedraceae           1             1            500 cm−1 for Raman spectra. In the EMSC pre-processing, the
                                                                                      spectral region of chemical absorbance was down-weighted, and
                                                                                      spectral regions devoid of any chemical absorbance were up-
                                                                                      weighted, by applying a weighting vector. Vector value 1 was
phase (liquid and/or glass phase). Lipids: Tristearin                                 used in the whole spectral region, except the regions 1900-
(2,3-di(octadecanoyloxy)propyl octadecanoate), triolein (2,3-                         1800 cm−1 (for IR spectra) and 2000-1800 cm−1 (for Raman
bis[[(Z)-octadec-9-enoyl]oxy]propyl (Z)-octadec-9-enoate), tri-                       spectra), where the weighting vector was set to 10. These two
heptadecanoin (2,3-di(heptadecanoyloxy)propyl heptadeca-                              regions are devoid of any chemical signals. Therefore, these
noate), phosphatidistearoylcholine (1,2-distearoyl-rac-glycero-                       regions should have the same baseline values in all pollen spectra
3-phosphocholine),    phosphatidioleylcholine    (1,2-dioleoyl-                       when interferent signals, due to light reflection or fluorescence,
sn-glycero-3-phosphocholine), stearic acid (octadecanoic                              have been removed. Up-weighting of this region, by applying
acid), oleic acid ((9Z)-octadec- 9-enoic acid). Pigments                              a weighting vector, is constraining the EMSC pre-processing

Frontiers in Plant Science | www.frontiersin.org                                  4                                         March 2020 | Volume 11 | Article 352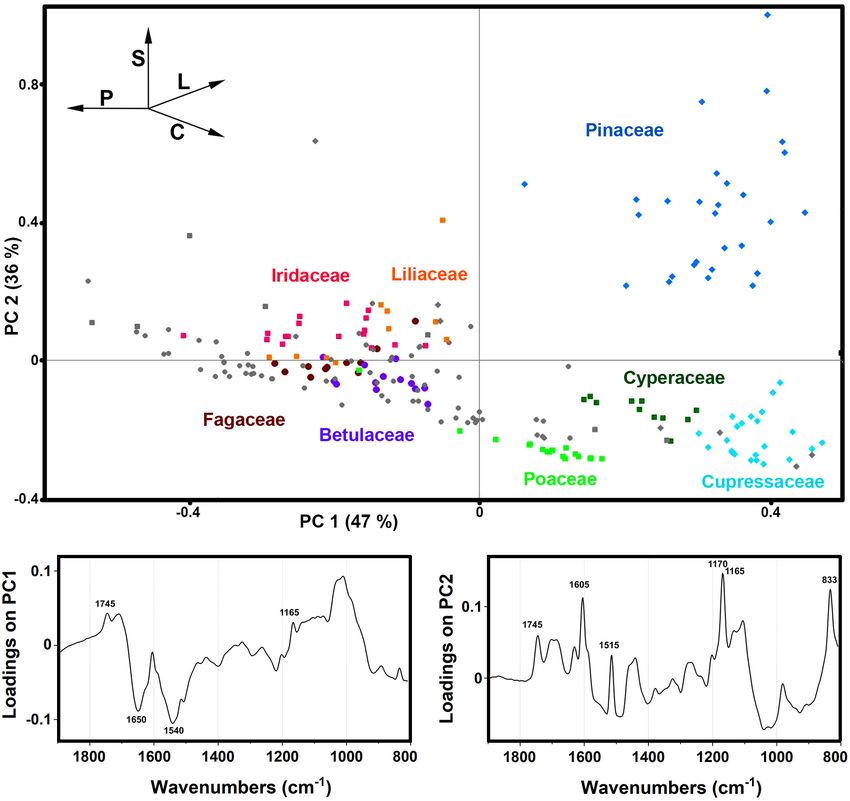
Kendel
¯ and Zimmermann Pollen Analysis by Vibrational Spectroscopies
and ensuring a stable baseline in all pollen spectra. Thus pre- The following spectral regions were selected for analysis of
processed spectra were designated Datasets I and subsequently chemical composition of aromatics in pollen grain wall: 810 –
used to evaluate biochemical similarities between pollen samples 860 cm−1 for FTIR spectra, and 1580 – 1650 cm−1 for FT-Raman
by calculating correlation coefficients (Pearson product-moment spectra. Prior to the selection of spectral regions, the EMSC
correlation coefficients) or by using principal component analysis pre-processing was conducted by applying a weighting vector:
(PCA). For better viewing the figures depicting correlation Vector value 1 was used in the whole spectral region, except the
matrixes and PCA plots were based on averaged spectra, where regions 1900-1800 cm−1 (for IR spectra) and 1800-1660 cm−1
spectra of 3 replicates were averaged. (for FT-Raman spectra), where the weighting vector was set to
The estimates of relative chemical composition of pollen 10. Thus pre-processed spectra were designated Datasets II and
were obtained by deflating the data matrix containing complete subsequently analyzed by PCA.
set of spectra from Datasets I by using spectra of standard All pre-processing methods and data analyses were performed
compounds (Zimmermann and Kohler, 2014). In general, matrix using The Unscrambler X 10.3 (CAMO Software, Oslo,
deflation modifies a data matrix to eliminate the influence of a Norway), as well as functions and in-house developed routines
given eigenvector (White, 1958). However, here we used model written in MATLAB 2014a.8.3.0.532 (The MathWorks, Natick,
compounds as eigenvectors while the corresponding eigenvalues MA, United States).
were used to estimate the relative content of those compounds.
For the deflation, the data matrix was centered while the vectors
were normalized. Tristearin, gluten and amylose FTIR spectra RESULTS AND DISCUSSION
were used as eigenvectors for FTIR dataset to estimate relative
amounts of triglicerides, proteins and carbohydrates respectively. Vibrational Spectra of Pollen
β-carotene and amylose FT-Raman spectra were used as As mentioned in the Introduction, the major problem in Raman
eigenvectors for Raman dataset to estimate relative amounts of spectroscopy of pollen is sample heating and fluorescence,
carotenoids and carbohydrates respectively. The corresponding resulting with complex background and low signal-to-noise
eigenvalues, as well as ratios of eigenvalues (carbohydrate-to- ratio. In contrast, the spectra of all 219 pollen samples covered
protein ration), were plotted in order to visualize chemical by this study are devoid of strong fluorescence background
composition of pollen. and have high signal-to-noise ratio (Supplementary Figure
Datasets I were used for the analysis of pollination strategy by S2). The vibrational spectra of pollen of representative species
denoting the following taxa: (1) anemophilous: Fagales (except show influence of different biochemicals on an overall spectral
Fagaceae), Pinales (except Podocarpaceae), Poales, Proteales, fingerprint (Figure 1) (Gottardini et al., 2007; Schulte et al.,
Anacardiaceae, Asteraceae (except Taraxacum), Polygonaceae, 2008; Zimmermann, 2010; Bagcioglu et al., 2015; Zimmermann
Urticaceae, Plantago; (2) entomophilous: Asparagales, et al., 2015b). In some species, such as gymnosperms (e.g.,
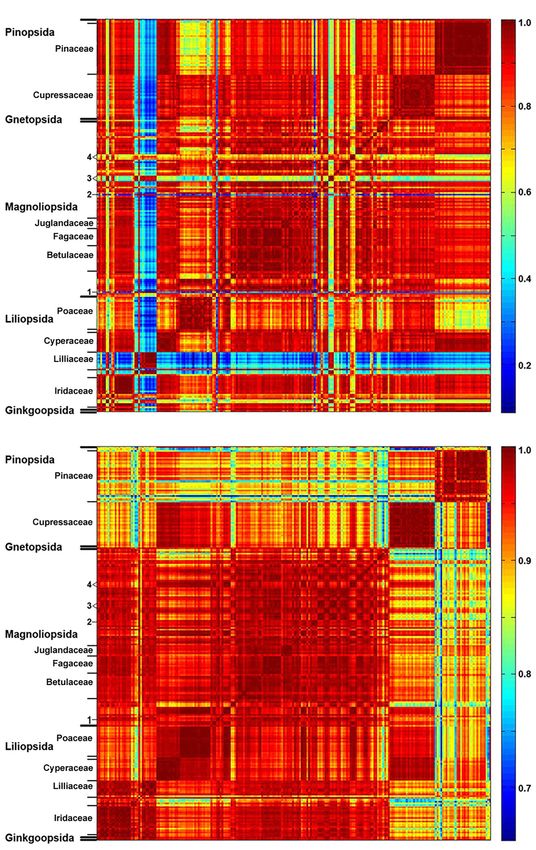
Dipsacales, Liliales, Magnoliales, Malvales, Ranunculales, Figure 1 Pinus ponderosa and Ephedra major), the most
Sapindales (except Anacardiaceae), Solanales, Acanthaceae, prominent features are phenylpropanoid-associated signals of
Campanulaceae, Paeoniaceae, Rosaceae, Scrophulariaceae, sporopollenins around 1630, 1605, 1585, 1205, 1170, 855, and
Digitalis, Taraxacum; (3) double-strategy: Arecales, Buxales, 830 cm−1 in the Raman spectra, and around 1605, 1515,
Ephedrales, Malpighiales, Altingiaceae, Fagaceae, Ginkgoaceae, 1205, 1170, 855, 830 and 815 cm− in the FTIR spectra1 (all
Oleaceae, Podocarpaceae. vibrations are related to phenyl ring vibrations). Furthermore,
The protein content of pollen from Roulston et al. (2000) some taxa, such as grasses (e.g., Figure 1 Festuca amethystina)
was used as a chemical reference values for regression in and sedges, have strong carbohydrate signals around 1450-1300
the Partial Least Squares Regression (PLSR) modeling of (CH2 and CH deformations) and 1150-900 cm−1 (C−O−C,
spectral data from Datasets I, where spectra of replicates were C−C and C−O stretching vibrations) in the Raman spectra,
averaged. The optimal number of components (i.e., PLSR factors) and around 1200-900 cm−1 (C−O, C−C, C−O−C, and C−OH
of the calibration models (AOpt ) was determined using full stretches and deformations) in the FTIR spectra. Signals related
cross-validation. The PLSR coefficient of determination (R2 ), to lipids (e.g., Figure 1 Fagus sylvatica), around 1745 (C=O
correlation value (R), and root-mean-square error (RMSE) were stretch), 1440 and 1300 (CH2 deformation), and 1070 cm−1
used to evaluate the calibration models. The following 35 (C−C stretch) in the Raman, and around 1745 (C=O stretch),
species were included in the PLSR: Fagus sylvatica, Quercus 1460 (CH2 deformation) and 1165 cm−1 (C−O−C stretching
rubra, Quercus robur, Corylus avellana, Alnus incana, Alnus in esters) in the FTIR spectra, often show large variation
glutinosa, Betula pendula, Juglans nigra, Juglans regia, Carya within related plant species. All species show prominent protein
illinoinensis, Zea mays, Secale cereale, Festuca pratensis, Poa signals around 1655 (amide I), 1450 (CH2 deformation), and
pratensis, Poa nemoralis, Dactylis glomerata, Holcus lanatus, 1260 cm−1 (amide III) in the Raman spectra, and around
Juniperus communis, Thuja occidentalis, Picea abies, Pinus 1645 (amide I), 1535 (amide II), and 1445 cm−1 (CH2
mugo, Pinus sylvestris, Pinus ponderosa, Eschscholzia californica, deformation) in the FTIR spectra, with taxon-specific ratio of
Magnolia x sonlangiana, Liriodendron tulipifera, Fraxinus protein-to-carbohydrate signals. In addition to these signals,
excelsior, Plantago lanceolata, Salix alba, Taraxacum officinale, a number of species (e.g., Figure 1, Lilium bulbiferum) show
Populus nigra, Aesculus hippocastanum, Buxus sempervirens, carotenoid-associated strong Raman signals around 1520 (C=C
Artemisia vulgaris, Rumex acetosa. stretching), 1155 (C-C stretching), and 1005 cm−1 (C-CH3
Frontiers in Plant Science | www.frontiersin.org 5 March 2020 | Volume 11 | Article 352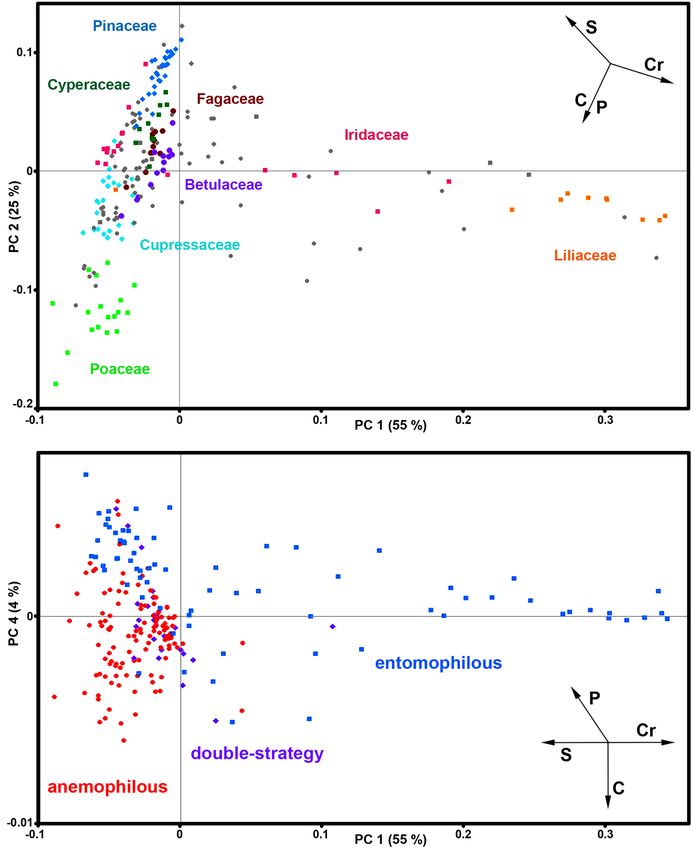
Kendel
    ¯ and Zimmermann                                                                                                      Pollen Analysis by Vibrational Spectroscopies

  FIGURE 1 | Pre-processed (A) FT-Raman and (B) FTIR spectra of representative species: Pinus ponderosa (with denoted sporopollenin bands), Ephedra major (with
  denoted carbohydrate signals), Fagus sylvatica (with denoted lipid signals), Festuca amethystina (with denoted protein signals), and Lilium bulbiferum (with denoted
  carotenoid signals).

deformation) (Schulte et al., 2009). Carotenoids are present in                        other hand, the FT-Raman spectrum of Aesculus hippocastanum
low concentration in pollen, and thus they cannot be detected                          has weak carotenoid signals and strong signals of proteins,
by FTIR spectroscopy. However, resonant Raman effect enables                           carbohydrates and sporopollenins (Supplementary Figure S3).
their measurement by FT-Raman spectroscopy, which sometimes
results with the complete dominance of these carotenoid
signals over spectral contributions of other biochemicals, such                        Overall Assessment of Pollen
as proteins, sporopollenins and carbohydrates (e.g., Figure 1,                         Composition
Lilium bulbiferum).                                                                    The large and extremely diverse set of measured species,
    Compared to the published results of Raman measurements                            covering 42 plant families, has enabled assessment of major
with 633 nm laser excitation (see Supplementary Figure S1 in                           biochemical differences and similarities between pollen species.
Guedes et al., 2014), the FT-Raman spectra have rather simple                          The correlation coefficients of spectra were calculated in order
background, which can be easily corrected with EMSC pre-                               to assess major patterns within and between taxa. In addition,
processing (Supplementary Figure S2). Moreover, compared to                            PCA was used to estimate predominant spectral differences,
the published results of Raman measurements with 785 nm laser                          and indirectly to assess principal differences in chemical
excitation (Schulte et al., 2008), the FT-Raman spectra show                           composition of pollen.
significantly weaker resonant Raman effect. For example, the                              The matrices of correlation coefficients (Figure 2 and
spectrum of Aesculus hippocastanum excited with 785 nm shows                           Supplementary Figure S4) show that plant families have
predominant carotenoid bands at 1518 and 1156 cm−1 , while                             relatively uniform and specific pollen composition, specifically
strong signals of proteins, carbohydrates and sporopollenins were                      that pollen of related species share common chemical features.
recorded only after the prolonged photodestruction of the sample                       Such property is apparent, for example, for pollens of Pinaceae,
with 633 nm laser (see Figure 1 in Schulte et al., 2008). On the                       Cupressaceae, Fagaceae, Betulaceae, Poaceae and Cyperaceae.

Frontiers in Plant Science | www.frontiersin.org                                   6                                               March 2020 | Volume 11 | Article 352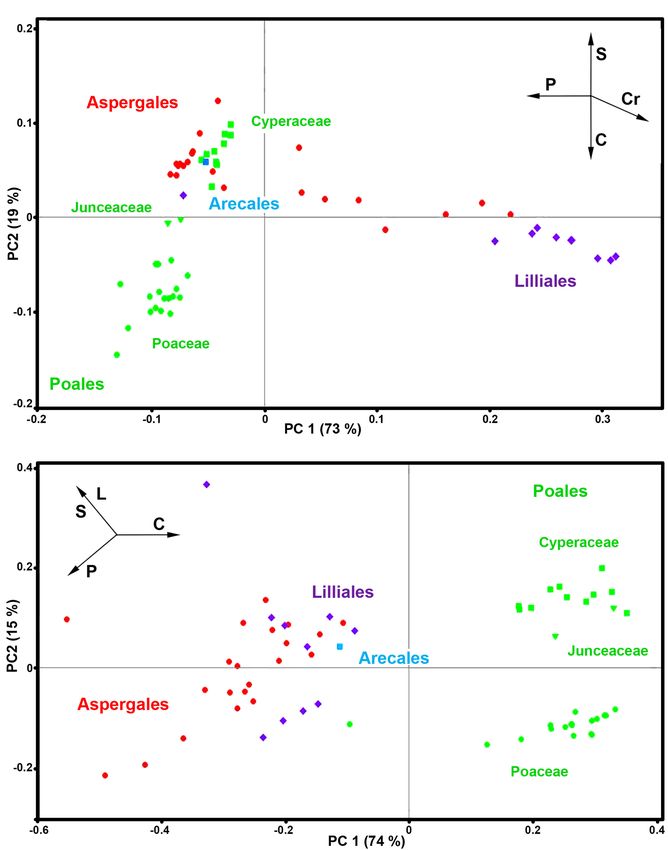
Kendel
    ¯ and Zimmermann                                                                                                     Pollen Analysis by Vibrational Spectroscopies

  FIGURE 2 | Correlation between spectroscopic data and taxonomy. Matrices of correlation coefficients calculated from: (A) FT-Raman and (B) FTIR spectra of 219
  species (Dataset I, average spectra of 3 replicates), with depiction of plant classes and families (in addition: 1, Taraxacum officinale; 2, Hibiscus trionum; 3,
  Eschscholzia californica, Glaucium flavum, Papaver lapponicum; 4, Ranunculus repens, Ranunculus acris, Ranunculus lanuginosus).

Frontiers in Plant Science | www.frontiersin.org                                  7                                              March 2020 | Volume 11 | Article 352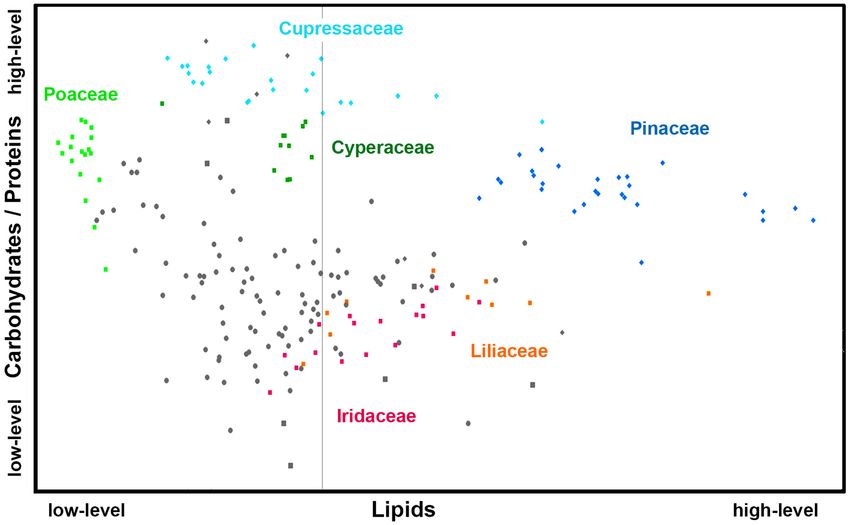
Kendel
    ¯ and Zimmermann                                                                                      Pollen Analysis by Vibrational Spectroscopies

However, FT-Raman spectral set has higher spectral variability              thus plants with non-rewarding pollen (anemophilous, self-
than infrared set, as shown by the larger range of correlation              pollinators, and nectar rewarders) have pollen with higher
coefficients, with a number of taxa showing specific spectral               carbohydrate content. Although the spectroscopy results are in
patterns (Figure 2A). For example, FT-Raman spectra of                      agreement with previous studies on pollination mode and pollen
Liliaceae (Figure 2A) are extremely different compared to                   chemistry, it is possible that the trends present in Figure 3 are
spectra of a majority of angiosperms (including other monocots),            driven by plant relatedness, specifically that pollen of related
while the corresponding infrared spectra (Figure 2B) show                   species share common chemical features. Therefore, further
considerably lower level of variability. Moreover, a number                 studies are needed, preferably on a group of closely related species
of species show specific FT-Raman spectral fingerprints, such               presenting different pollination modes.
as large variations for congeneric species of Iris and Papaver                  The PCA of the FTIR data shows that the predominant
(see Iridaceae and number 3 markings in Figure 2A). In                      spectral differences are the result of variations of bands associated
all the cases the large spectral variability within the FT-                 with proteins, carbohydrates and sporopollenins (Figure 5).
Raman data set is driven by the strong Raman signals of the                 The PC loading plots have high factor loadings associated
carotenoids that overshadow spectral contributions from other               with proteins (negative loadings) at 1650 and 1540 cm−1 ,
chemicals, as illustrated previously by the spectrum of Lilium              carbohydrates (positive) at 1050-950 cm−1 and lipids (positive)
bulbiferum (Figure 1A).                                                     at 1745 and 1165 cm−1 in PC 1, and carbohydrates (negative) at
    The PCA of FT-Raman data shows that the predominant                     1050-950 cm−1 , sporopollenins (positive) at 1605, 1515, 1170 and
spectral differences are the result of variations of bands associated       833 cm−1 , and lipids (positive) at 1745 and 1165 cm−1 in PC 2.
with carotenoids, sporopollenins, carbohydrates and proteins                The PCA score plot in Figure 5 indicates scores for the selected
(Figures 3, 4). The PCA plots have high factor loadings                     plant families highlighted in the PCA score plot of Raman data
associated with carotenoids (positive loadings) at 1523, 1155,              (Figure 3). Similar as for the Raman data, the major plant
and 1005 cm−1 , and proteins (negative) at 1655, 1455, and                  families show taxon-specific clustering. For example, analogous
1260 cm−1 in PC 1, and sporopollenins at 1630, 1605, 1585,                  to the Raman data set, the separation of relatively related clades
1205, and 1170 cm−1 , and proteins (negative) at 1650 and                   Poaceae and Cyperaceae (both Poales), as well as Pinaceae and
1453 cm−1 in PC 2 (Figure 4). Therefore, it is evident that the             Cupressaceae (both Pinales), is mostly driven by the difference in
predominant information from FT-Raman spectral data is on                   their sporopollenin and carbohydrate content and composition.
pollen grain wall chemicals. The PCA score plot in Figure 3                 This issue has already been mentioned in our previous studies
indicates scores for the selected plant families with relatively high       (Zimmermann and Kohler, 2014), and it will be discussed in more
number of species represented in the data set. Similar as the               details later in this paper. The main difference between the FTIR
matrices of correlation coefficients (Figure 2 and Supplementary            and FT-Raman data is lack of the carotenoid-driven outliers in
Figure S4), the score plot shows that the majority of Liliaceae,            the FTIR that were present in the Raman data (in particular,
as well as the number of Iridaceae species, have quite different            Liliaceae). Another difference is relative large variation in the
pollen chemistry (in particular, carotenoid content) compared               FTIR data driven by the lipid content, which was mostly lacking
to the rest of measured pollen species. All the major families,             in the FT-Raman data. The issue of carotenoid and lipid content
apart from Iridaceae, show relatively good clustering, indicating           will be tackled in more details below when we discuss strategies
taxon-specific chemistry. For example, the separation of relatively         for quantification of relative chemical composition of pollen.
related clades Poaceae and Cyperaceae (both Poales), as well as
Pinaceae and Cupressaceae (both Pinales), is mostly driven by               Relative Chemical Composition of Pollen
the difference in their sporopollenin and carbohydrate content              A primary drawback of PCA of vibrational spectral data is its
and composition.                                                            reduced interpretability due to complex loadings. Therefore, the
    Furthermore, the PCA score plot of PCs 1 and 4 indicates a              data matrices containing complete set of spectra were deflated
trend in pollen chemistry composition based on pollination mode             by using spectra of standard compounds (Zimmermann and
(Figure 3). Anemophilous (wind pollinated) and entomophilous                Kohler, 2014). That way, estimates of chemical composition of
(insect pollinated) species show different tendencies based on              pollen were obtained regarding principal type of compounds:
relative content of protein, carbohydrates and carotenoids. The             triglyceride lipids, proteins, carbohydrates and carotenoids. It
PCA loading plots have high factor loadings associated with                 should be noted that this procedure is not a replacement for
carotenoids and proteins in PC 1, and proteins (positive) at 1655           aforementioned PCA, particularly if residual spectral component
and 1450 cm−1 , and carbohydrates (negative) at 1450-1300 and               is large and contains important variability information. However,
1150-1050 cm−1 in PC 4 (Figure 4). In general, anemophilous                 the obtained eigenvalues can be good proxies for estimating
species have low content of carotenoids and proteins, and                   relative chemical composition of pollen and for simple
high content of carbohydrates, compared to entomophilous                    visualization of pollen composition.
species. This is in agreement with the published studies, showing               Figures 6, 7 show that relative composition of pollen has big
that insect foragers prefer plants with high-protein pollen                 variations regarding carotenoids and triglycerides. These type
content (Roulston et al., 2000), while anemophilous species                 of compounds show substantial variations even for congeneric
produce pollen with high carbohydrate content (Speranza et al.,             species. For example, a number of far-related genera, such as
1997; Wang et al., 2004). The evolutionary explanation is                   Quercus, Iris, Pinus, and Juniperus show large variations for
that production of proteins has higher metabolic cost, and                  congeneric species regarding triglycerides, as well as Papaver,

Frontiers in Plant Science | www.frontiersin.org                        8                                         March 2020 | Volume 11 | Article 352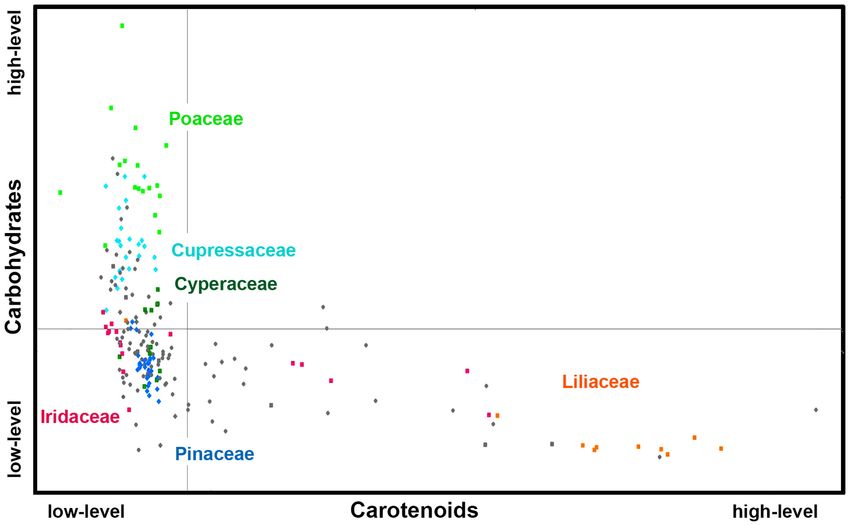
Kendel
    ¯ and Zimmermann                                                                                                        Pollen Analysis by Vibrational Spectroscopies

  FIGURE 3 | Correlation between FT-Raman data and taxonomy. PCA score plots of FT-Raman dataset containing 219 species (Dataset I, average spectra of 3
  replicates) with: (A) depiction of plant classes ( monocots;  gymnosperms; eudicots and magnoliids) and families (Pinaceae, Cupressaceae, Betulaceae,
  Fagaceae, Poaceae, Cyperaceae, Liliaceae, and Iridaceae), and (B) depiction of pollination strategies (blue  entomophilous; red anemophilous; purple
  double-strategy) species. Vectors are approximating the increase in relative amount of proteins (P), sporopollenins (S), carbohydrates (C) and carotenoids (Cr). The
  percent variances for the first five PCs are 54.77, 25.08, 6.43, 4.41, and 2.31.

Lilium and Iris regarding carotenoids (Supplementary Figures                            is a clear trend in chemical composition for anemophilous
S5, S6, respectively). On the other hand, relative composition                          and entomophilous species, which is consistent with FT-Raman
regarding carbohydrates and proteins is quite taxa-specific. These                      results in Figure 3 and our previous finding (Zimmermann and
two type of compounds show negative linear correlation in the                           Kohler, 2014). Pollen of anemophilous plants have much higher
FTIR dataset (Supplementary Figure S7). It has been known                               relative content of carbohydrates, defined as carbohydrate-
that the pollen protein content is very similar for congeneric                          to-protein ratio, as compared with entomophilous plants
species, and it can be even similar for confamiliar species                             (Supplementary Figure S7).
(Roulston et al., 2000). Based on this and the aforementioned                              These results are in agreement with the published studies.
linear correlation between pollen carbohydrates and proteins,                           As mentioned previously, insect pollinated species have in
it can be concluded that pollen carbohydrate content is highly                          general higher protein content and lower carbohydrate content
conserved within genera and families as well. Moreover, there                           than anemophilous plants (Speranza et al., 1997; Roulston

Frontiers in Plant Science | www.frontiersin.org                                    9                                               March 2020 | Volume 11 | Article 352
Kendel
¯ and Zimmermann Pollen Analysis by Vibrational Spectroscopies
should be noted that vibrational microspectroscopy can measure
single pollen grains (Zimmermann et al., 2016), and therefore
quantification of pollen proteins by spectroscopy approach would
be equally applicable to anemophilous and zoophilous pollen.
Quantitative Measurement of Pollen
Protein Content
The exploratory data analyses, as the ones presented above, are
offering valuable information on relative chemical composition
of pollen, as well as on chemical differences within and between
taxa. However, the next important question to address is whether
the vibrational data on pollen contains valuable quantitative
biochemical information to allow the prediction of absolute
chemical composition. Quantitative chemical analysis of complex
biological samples, such as composition of biomass or biofluids,
is readily obtained by combining vibrational spectroscopy with
multivariate regression, such as PLSR (Zimmermann and Kohler,
2013; Kosa et al., 2017). Therefore, we have conducted PLSR
analyses on FT-Raman and FTIR datasets for predicting protein
mass fraction of pollen (percentage of protein by dry mass). PLSR
models were validated, using the full cross validation method,
against protein mass fraction values for 35 species obtained from
Roulston et al. (2000). The analyzed species include all major
taxa of seed plants (see Supplementary Table S2), and had
extensive range of protein content, from 8.8 to 43.1% of protein
content by dry mass.
The R2 values for the PLSR models were 0.53 and 0.49 for
FT-Raman and FTIR models respectively, with RMSE errors
of approx. 15% (Table 2). PLSR regression coefficients are
summarizing the relationship between spectral variables and
protein mass fraction values. As can be seen, the spectral features
associated with proteins are present in the regression coefficients
at 1640-65 cm−1 (amide I), 1452 cm−1 (CH2 deformation) and
1006 cm−1 (phenylalanine sidechain vibrations) for FT-Raman
dataset, and at 1630-1670 cm−1 (amide I) and 1515-1560 cm−1
(amide II) for FTIR dataset (Supplementary Figure S8). FT-
FIGURE 4 | Loadings plots on the principal components 1, 2 and 4 of Raman model was based on a larger number of components
FT-Raman dataset containing 219 species (Dataset I, average spectra of 3 (Aopt = 12) than the model based on FTIR data (Aopt = 6).
measurements). This is probably due to relatively strong protein-related signals
in FTIR spectra, compared to FT-Raman spectra where protein
signals are often overlapped by stronger signals associated with
sporopollenins and carotenoids. It should be noted that the
et al., 2000). Similarly to our results, the study by Roulston
reference data for the PLSR models was based on literature
et al. (2000), has revealed that anemophilous pollens contain
values, and not on an actual measurements of studied samples.
significantly less protein (average value 25.8% protein dry mass
It can be assumed that prediction models will improve when
content) than zoophilous (animal pollinated) pollens (average
actual protein reference values for measured samples are used,
value 39.3%). However, the authors have stipulated that this
and when they are restricted to phylogenetically related taxa, for
discrepancy could arise from a sampling and measurement bias.
example plant orders and families. Moreover, there is a great
They have stated that due to analytical limitations and relative
potential of vibrational spectroscopy for direct measurement of
ease of collecting anemophilous pollens, anemophilous species
not only protein content of pollen, but other constituents, such as
are always overrepresented in the data set. The main reason
carbohydrates and carotenoids, as well.
is that standard analyses of pollen protein content requires
1-1000 mg of pollen (Roulston et al., 2000), thus favoring
anemophilous plants that produce large quantities of pollen. Chemical Composition of
Although in our vibrational study the sampling set was relatively Phenylpropanoids in Pollen Grain Wall
balanced regarding number of anemophilous and entomophilous Pollen wall is extremely resilient structure, both physically and
species, the sampling bias cannot be entirely disregarded. It chemically, protecting generative cells from environmental stress,
Frontiers in Plant Science | www.frontiersin.org 10 March 2020 | Volume 11 | Article 352Kendel
¯ and Zimmermann Pollen Analysis by Vibrational Spectroscopies
FIGURE 5 | Correlation between FTIR data and taxonomy. PCA score and loading plots of FTIR dataset containing 219 species (Dataset I, average spectra of 3
replicates) with: depiction of plant classes ( monocots; gymnosperms; eudicots and magnoliids) and families (Pinaceae, Cupressaceae, Betulaceae,
Fagaceae, Poaceae, Cyperaceae, Liliaceae, and Iridaceae). Vectors are approximating the increase in relative amount of proteins (P), sporopollenins (S),
carbohydrates (C), and lipids (L). The percent variances for the first five PCs are 47.44, 35.59, 4.12, 2.53, and 2.18.
including ultraviolet light, temperature, excessive water loss and complex biopolymers, such as lignin and suberin. Unlike the
gain, and microbial damage. In general, pollen wall is comprised intine and the grain interior (i.e., vegetative and generative cells),
of two layers with distinct chemical composition: exine, an outer which are synthesized under the control of the gametophytic
layer, and intine, an inner layer (Blackmore et al., 2007). Exine genome, sporopollenins are synthesized in the tapetum under
is the most complex and resilient plant extracellular matrix, the control of the sporophytic genome (Piffanelli et al., 1998;
and is predominantly composed of sporopollenins, an extremely Blackmore et al., 2007). Therefore, sporopollenin measurements
robust, chemically resistant and complex biopolymers (Jiang reveal important information on parent plants (sporophytes), in
et al., 2013). Sporopollenins are a group of chemically related particular concerning plant-environment interactions.
polymers composed of covalently coupled derivatives of fatty acid A number of studies have shown response of sporopollenin
and aromatic phenylpropanoid building blocks, with significant chemistry to variation in UV-B radiation levels received by
taxon-specific variations in chemical composition (Dominguez sporophytes for a range of different plant species, such as conifers,
et al., 1999; Blackmore et al., 2007; Jiang et al., 2013; Li et al., grasses and legumes (Rozema et al., 2001, 2009; Willis et al.,
2019). Production of phenylpropanoids in plants is induced 2011; Lomax et al., 2012; Jardine et al., 2016; Bell et al., 2018).
by solar ultraviolet radiation (UV-B) via the phenylpropanoid Recent studies have shown that the FTIR analysis of UV-B-
pathway, the same pathway responsible for synthesis of similar absorbing phenylpropanoids in sporopollenins of pollen and
Frontiers in Plant Science | www.frontiersin.org 11 March 2020 | Volume 11 | Article 352Kendel
¯ and Zimmermann Pollen Analysis by Vibrational Spectroscopies
FIGURE 6 | Scatter plot of eigenvalues from the reduced FT-Raman data set (Dataset I, average spectra of 3 replicates), obtained by modeling spectral contribution
of carbohydrates and carotenoids, with depiction of plant classes ( monocots; gymnosperms; eudicots and magnoliids) and families (Pinaceae,
Cupressaceae, Poaceae, Cyperaceae, Liliaceae, and Iridaceae). Axis scales are in relative units and are based on deflation eigenvalues.
FIGURE 7 | Scatter plot of eigenvalues from the reduced FTIR data set (Dataset I, average spectra of 3 replicates), obtained by modeling spectral contribution of
carbohydrates and proteins (expressed as C/P ratio), and lipids with depiction of plant classes ( monocots; gymnosperms; eudicots and magnoliids) and
families (Pinaceae, Cupressaceae, Poaceae, Cyperaceae, Liliaceae, and Iridaceae). Axis scales are in relative units and are based on deflation eigenvalues.
spores could provide very valuable record of solar-UV radiation pollen cell wall (Bagcioglu et al., 2015). The main spectral regions
received by plants, which is of high interest in palaeoclimatic and (i.e., aromatic regions) for characterization of phenylpropanoids
palaeoecological fields. The primary phenylpropanoids in pollen, are 860-800 cm−1 in infrared spectra, associated with phenyl C-
such as derivatives of p-coumaric, ferulic and sinapic acids, have H out-of-plane deformations, and 1650-1580 cm−1 in FT-Raman
specific vibrational bands in both infrared and FT-Raman spectra, spectra, associated with phenyl C=C stretching vibrations.
and thus specific spectral regions can be selected and analyzed in The PCA data analysis of these spectral regions shows
detail in order to obtain characteristic chemical fingerprints of that the majority of taxa have phylogeny-based similarities
Frontiers in Plant Science | www.frontiersin.org 12 March 2020 | Volume 11 | Article 352Kendel
¯ and Zimmermann Pollen Analysis by Vibrational Spectroscopies
in chemical composition of phenylpropanoids (Figure 8). In TABLE 2 | PLS regression results between vibrational spectra and protein content
for 35 pollen species (N = 35).
accordance with our previous finding (Bagcioglu et al., 2015),
Cedrus is a noteworthy outliers, showing quite different chemistry PLSR FTIR FT-Raman
when compared to the rest of Pinaceae species, with a higher parameter
ratio of ferulic-to-p-coumaric acid derivatives in sporopollenin
RMSE 6.45%wt (15%) 6.19%wt (14%)
compared to the other species. In general, gymnosperms show
R2 0.487 0.527
much higher chemical variability of phenylpropanoids than
R 0.698 0.726
angiosperms, with substantial differences between Cupressaceae,
Aopt 6 12
Cephalotaxaceae, Pinaceae, Podocarpus, Ginkgo, and Ephedra
(For example, see differences in 900–800 cm−1 region for FTIR %wt = protein mass fraction (% of protein by dry mass).
spectra of Pinus ponderosa and Ephedra major in Figure 1B). This
is not surprising, since all major families of gymnosperms have
diverged in Permian-Triassic periods (300-200 Ma) (Lu et al., (negative) at 1605, 1514, 1167, and 831 cm−1 in PC 1, and
2014), much earlier that angiosperm families. sporopollenins (positive) at 1603, 1512, 1165, and 831 cm−1 ,
In addition, the analysis has revealed a difference in chemical lipids (positive) at 1744 and 1165 cm−1 , and proteins (negative)
composition of phenylpropanoids between sedges (Cyperaceae) at 1645 and 1530 cm−1 in PC 2 (Supplementary Figure S9b).
and grasses (Poaceae). While in both cases the predominant Both FT-Raman and FTIR can easily distinguish between the
signals belong to p-coumaric acid at 830 cm−1 in FTIR two, predominantly anemophilous, families: grasses (Poaceae)
and 1605 cm−1 in FT-Raman, grasses have additional signals and sedges (Cyperaceae). However, this discrimination is based
associated with ferulic acid at 850 and 1605 cm−1 in FTIR and on relative protein-to-lipid ration in FTIR data, which is high
FT-Raman respectively, while sedges have signals associated with in grasses and low in sedges, while in FT-Raman data it is
sinapic acid at 815 and 1595 cm−1 in FTIR and FT-Raman based on carbohydrate-to-sporopollenin ratio, which is high in
respectively. This is in accordance with phenylpropanoid studies grasses and low in sedges. Regarding the three, predominantly
of plant vegetative tissues which have shown that grass cell walls entomophilous, families (Xanthorrhoeaceae, Liliaceae and
are characterized by ferulic and p-coumaric acids, while sedges Iridaceae) it is evident that information obtained by FT-Raman
contain sinapic and p-coumaric acids (Bogucka-Kocka et al., has no equivalence in FTIR. The predominant spectral variability
2011; De Oliveira et al., 2015). Sinapic acid is rarely detected in in FT-Raman data belongs to relative amount of carotenoids,
plant tissues, and it has been hypothesized that its presence in and, to a less extent, to sporopollenins as well. These results are
tissues of a number of Carex species can be associated with the in accordance with previous studies that have shown significant
humidity of plants’ habitats (Bogucka-Kocka et al., 2011). reserves of starch nutrients in Poaceae and Cyperaceae pollen,
while pollen grains of Iridaceae, Xanthorrhoeaceae, Liliaceae,
and Arecaceae is predominantly starchless (Franchi et al., 1996).
Comparative Assessment of FT-Raman The large dataset has enabled us to study differences for
and FTIR: A Case Study on Monocots congeneric species, in particular Iris genus comprising spectral
and Iris data on 17 species. Iris is the largest genus of Iridaceae,
Here we will demonstrate the benefits of pollen phenotyping by comprising approx. 250 entomophilous species that inhabit the
both FT-Raman and FTIR methods by taking a more detailed Earth’s North Temperate Zone (Mathew, 1981). Iris flowers have
look on spectral data of monocots (Monocotyledons, Liliopsida). elaborate and versatile pollinator attractants, including different
Monocots are large clade, covering a variety of habitats, and color patterns of tepals and sepals with specific orientation
include quite diverse group of plants such as lilies, agaves and distinctive nectar guides, floral odors, nutritive nectars and
and sedges, as well as grasses which are economically the pollen, as well as non-nutritive forms of reward, such as shelter
most important group of plants. The PCA analyses of FT- and thermal energy (Sapir et al., 2006; Vereecken et al., 2013;
Raman and FTIR data reveal corresponding and complementary Imbert et al., 2014; Guo, 2015; Pellegrino, 2015). Regarding pollen
information on pollen chemistry (Figure 9 and Supplementary chemistry, triglycerides are the primary nutrient reserve in Iris
Figures S4, S9). pollen since the grains are starchless (Franchi et al., 1996).
The PCA plots have high factor loadings associated with Our study shows that Iris species have a large variation
carotenoids (positive loadings) at 1526, 1156 and 1007 cm−1 , of pollen chemistry (Figure 10 and Supplementary Figure
and proteins (negative) at 1657 and 1450 cm−1 in PC 1, S4). The species with large content of carotenoids, such as
and sporopollenins (positive loadings) at 1630, 1603, 1204 I. graminea, I. orientalis, I. japonica and I. crocea, have relatively
and 1171 cm−1 , and carbohydrates (negative) at 1460-1300 low content of lipids and carbohydrates, and high content
and 1150-1000 cm−1 and carotenoids (negative) at 1526, and of proteins (Figure 10 and Supplementary Figure S10). It
1156 cm−1 in PC 2 (Supplementary Figure S9a). In contrast, should be noted that our previous FTIR study has shown
FTIR data shows large variation in carbohydrate-to-protein and that pollen lipids between various species of Iris can vary
carbohydrate-to-lipid ratios. The PC loading plots have high tenfold, as for example between I. pallida and I. graminea
factor loadings associated with proteins (negative loadings) at (Zimmermann and Kohler, 2014). This could indicate differences
1640 and 1530 cm−1 , carbohydrates (positive) at 1050-950 cm−1 , in germination and pollen tube growth, considering the roles
lipids (negative) at 1744 and 1165 cm−1 , and sporopollenins of triglycerides in other plants (Rodriguez-Garcia et al., 2003).
Frontiers in Plant Science | www.frontiersin.org 13 March 2020 | Volume 11 | Article 352You can also read