Mitochondrial Markers Identify a Genetic Boundary of the Green Tiger Prawn (Penaeus semisulcatus) in the Indo-Pacific Ocean - Zoological ...
←
→
Page content transcription
If your browser does not render page correctly, please read the page content below
Zoological Studies 60: 8 (2021)
doi:10.6620/ZS.2021.60-08

                                                                                                                        Open Access

Mitochondrial Markers Identify a Genetic
Boundary of the Green Tiger Prawn (Penaeus
semisulcatus) in the Indo-Pacific Ocean
Siti Amalia Aisyah Abdul Halim1,* , Ahmad Sofiman Othman1 , Noor Adelyna Mohammed Akib2 ,
Noorul-Azliana Jamaludin3 , Yuzine Esa4,5 , and Siti Azizah Mohd Nor1,6
1
  School of Biological Sciences, Universiti Sains Malaysia, 11800 Minden, Pulau Pinang, Malaysia.
        *Correspondence: E-mail: ameliaaisya245@gmail.com (Halim). Tel: +60142214807
        E-mail: sofiman@usm.my (Othman)
2
  Centre for Global Sustainability Studies, Universiti Sains Malaysia, Penang, Malaysia. E-mail: adelyna@usm.my (Akib)
3
  Marine Capture Fisheries Division, FRI Kampung Acheh, 32000 Sitiawan, Perak, Malaysia. E-mail: noorulazliana@gmail.com (Jamaludin)
4
  Department of Aquaculture, Faculty of Agriculture, Universiti Putra Malaysia, 43400 Universiti Putra Malaysia, Serdang, Selangor, Malaysia.
        E-mail: yuzine@upm.edu.my (Esa)
5
  International Institute of Aquaculture and Aquatic Sciences, Universiti Putra Malaysia, Port Dickson, Negeri Sembilan, Malaysia
6
  Institute of Marine Biotechnology, Universiti Malaysia Terengganu, 21030 Kuala Nerus, Terengganu, Malaysia.
        E-mail: s.azizah@umt.edu.my (Nor)

Received 25 September 2020 / Accepted 31 December 2020 / Published 18 March 2021
Communicated by Ka Hou Chu

    A population genetics study of the commercially important Green Tiger Prawn (Penaeus semisulcatus)
    was conducted in the Indo-Pacific Ocean with a focus on the Indo-Malay Archipelago waters of the South
    China Sea (SCS), Sulu Sea (SLS), Celebes Sea (CLS) and the Strait of Malacca (SOM), the latter being
    the main waterway that connects the Indian Ocean with the Pacific Ocean. A 548-base-pair region of
    mitochondrial COI and 571 base pairs of the control region (CR) were analysed in 284 specimens from 15
    locations. Genetic divergences (Tamura 3-parameter) for COI ranged from 0.1% to 7.2% and CR 2.3% to
    21.7%, with Bagan Pasir (BGP) in central SOM being the most genetically different from other populations
    (COI: 3.3–4.2%; CR: 7.1–16.5%). All populations were differentiated into two lineages with a genetic break
    in the vicinity of BGP; Lineage I comprised populations south of this site (SCS, SLS, CLS and part of
    SOM) and Lineage II comprised populations north of BGP (part of the SOM). Specifically, most individuals
    of Bagan Pasir (BGP) and another site just south of it, Batu Pahat (BPT), clustered in Lineage I, while
    all SOM populations to the north of these sites clustered in Lineage II. The BGP population is believed
    to be a mixed gene pool between the two lineages. The results could be attributed to the fluctuations of
    Pleistocene sea levels and a possible influence of the One Fathom Bank in SOM. High genetic diversity
    was recorded, π (Lineage I: COI: 3.4%; CR: 7.4%) (Lineage II: COI: 3.8%; CR: 12.6%) and, h (Lineage I:
    COI: 0.81; CR: 1.0) (Lineage II: COI: 0.57; CR: 0.99). Demographic statistics revealed that both lineages
    underwent a sudden expansion and consequent stabilisation in genetic variability. The findings of this
    study have wide implications for fisheries in the Indo-Pacific. The increased sampling effort within a
    narrower geographical scale by the current study permitted a precise locality of the genetic break for this
    species within the Indo-Pacific Ocean to be identified. The substantial genetic diversity within both lineages
    should be considered in fishery management and aquaculture development programs of this species in
    this region.
    Key words: Penaeus semisulcatus, Cytochrome oxidase subunit I (COI), Control region (CR), Population
               genetics, Indo-Pacific.

Citation: Abdul Halim SAA, Othman AS, Akib NAM, Jamaludin NA, Esa Y, Nor SAM. 2021. Mitochondrial markers identify a genetic boundary of
the Green Tiger Prawn (Penaeus semisulcatus) in the Indo-Pacific Ocean. Zool Stud 60:8. doi:10.6620/ZS.2021.60-08.

© 2021 Academia Sinica, Taiwan                                            1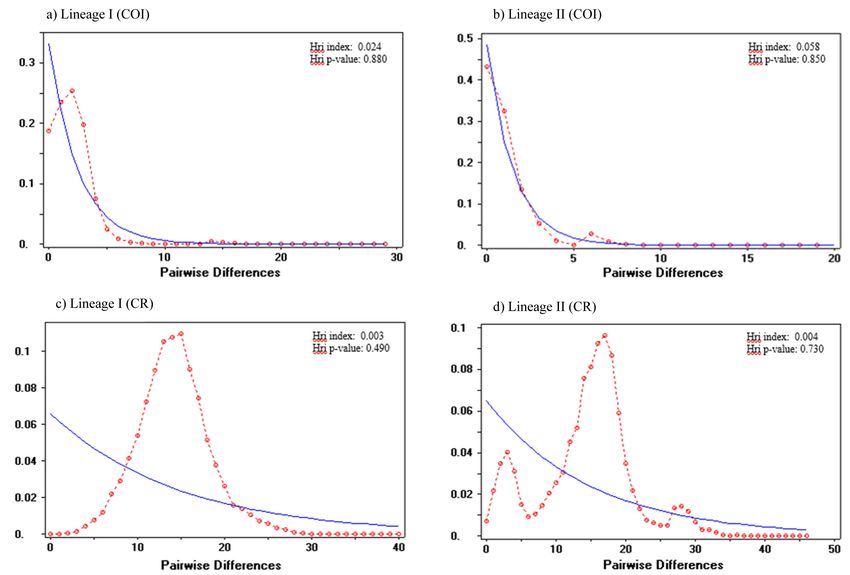
Zoological Studies 60: 8 (2021)                                                                             page 2 of 19

                       BACKGROUND                                    The green tiger prawn or grooved tiger prawn,
                                                              Penaeus semisulcatus De Haan, 1844, is one of
       Knowledge of the population genetics of a              the commercially important species in the family
 species—including its distribution and changes in            Penaeidae. It is widely distributed in the Indo-West
 genotype and phenotype frequencies and the underlying        Pacific from the Red Sea, east and southeast Africa
 causes—provide information that can answer various           to Japan, Korea, the Malay Archipelago and northern
 biological questions. Understanding population genetic       Australia (Holthius 1980; Dall et al. 1990; Chan 1998).
 diversity and structure is essential for the management      The species is widely distributed in the seas of the
 and conservation of genetic resources in marine              Indo-Malay Archipelago (IMA); Strait of Malacca,
 organisms and for productive fisheries conservation          (the main channel connecting the Indian Ocean with
 and sustainable population harvesting (Park and Moran        the Pacific Ocean), South China Sea, Celebes Sea and
 1994; Hillis et al. 1996; Thorrold et al. 2002; Xiao et      Sulu Sea, the latter three are within the Pacific Ocean. A
 al. 2012; Cui et al. 2018). Such population genetic data     number of population genetic investigations of penaeids
 can contribute additional information for taxonomic          prawn in the Indo-Pacific region have been done—e.g.,
 and evolutionary historical analyses (Benzie et al.          for the tiger prawn, P. monodon (Duda and Palumbi
 1995; Uthicke and Benzie 2003; Cheng et al. 2018),           1999; Benzie et al. 2002; You et al. 2008; Waqairatu
 as well as information on demographic history, such          et al. 2012; Abdul‐Aziz et al. 2015); kuruma prawn,
 as effective population size (Fu 1997) and changes in        P. japonicus (Tzong et al. 2004; Tsoi et al. 2007);
 population size (Rogers and Harpending 1992), critical       brown tiger prawn, P. esculentus (Ward et al. 2006);
 for fisheries and aquaculture management, particularly       banana prawn, P. merguiensis (Hualkasin et al. 2003;
 of ecologically and commercially important groups            Wanna et al. 2004); and Indian prawn, P. indicus (De
 such as the penaeids. Identification of reproductively       Croos and Pálsson 2010; Alam et al. 2015); these have
 isolated and genetically differentiated populations of       displayed strong phylogeographic structuring among
 existing resources within an exploited species is critical   populations in the Indo-West Pacific region that have
 for planning conservation strategies (Brooker 2009;          revealed a clear distinction between populations in the
 Schröder and Walsh 2010).                                    Indian Ocean and Pacific Ocean. This suggests that a
       Due to their ecological and economic importance,       similar pattern of population structuring may also occur
 the family Penaeidae has been the subject of                 in the widespread P. semisulcatus species. However,
 considerable biological and genetic research. Dall et        population genetics studies of the Penaeus are limited,
 al. (1990) hypothesised that the genus Penaeus within        particularly in the region. Most penaeid studies in
 family Penaidae, which is comprised of some of the           the region have focused on the giant tiger prawn, P.
 most economically important species, arose in the            monodon, and banana prawn, P. merguiensis (Daud
 Indo-Pacific based on the principle that biogeographic       1995; Aziz 2011; Aziz et al. 2011; Nahavandi et al.
 centres of origin have the highest species diversity         2011a b). Indeed, broad-scale phylogeographic division
 and the deepest morphological differentiation (Briggs        of this species between the Indian Ocean and Pacific
 1999). This was supported by the study of Baldwin            Ocean has also been shown, but the genetic boundary
 et al. (1998), which showed that the highest mtDNA           remains obscure, primarily due to the lack of detailed
 diversity and deepest mtDNA lineages for Penaeus are         coverage of the connecting populations between the two
 found in this region, based on 14 species. They further      oceans (Alam et al. 2016).
 postulated that the genus Penaeus radiated westward                 Thus, the aim of this study was to identify the
 into the eastern Atlantic and eastward into the eastern      potential location of this genetic break in the Indo-
 Pacific/western Atlantic. This bidirectional migration       Pacific Ocean, based on the mitochondrial cytochrome
 theory has received considerable support. Phylogenetic       c oxidase I (COI) and control region (CR) genes, on a
 studies of P. kerathurus (eastern Atlantic) (Lavery et       narrower geographical scale in the IMA. The COI gene
 al. 2004) and P. japonicus (Indo-Pacific) (Tzong et al.      (Folmer et al. 1994) is widely used because it is robust,
 2004; Tsoi 2006; Shih et al. 2011) corroborated the          is efficiently amplified using a universal primer, and has
 hypothesis of the westward movement from the Indian          been successfully applied to reconstruct phylogenetic
 Ocean into the eastern Atlantic. Similarly, several          relationships among several Penaeus species, including
 studies have documented a close relationship between         the Indian white prawn, P. indicus (De Croos and
 the P. monodon lineages of the eastern Pacific/western       Pálsson 2010; Alam et al. 2015); banana prawn, P.
 Atlantic and the Indo-Pacific region, indicating the         merguiensis (Hualkasin et al. 2003); kuruma prawn,
 eastward radiation across the Pacific (Benzie et al. 2002;   P. japonicus (Tsoi 2006); and Chinese white prawn, P.
 You et al. 2008; Waqairatu et al. 2012; Munasinghe           chinensis (Li et al. 2009). The mitochondrial control
 2014; Abdul‐Aziz et al. 2015).                               region (CR) or D-loop is a non-coding protein and

 © 2021 Academia Sinica, Taiwan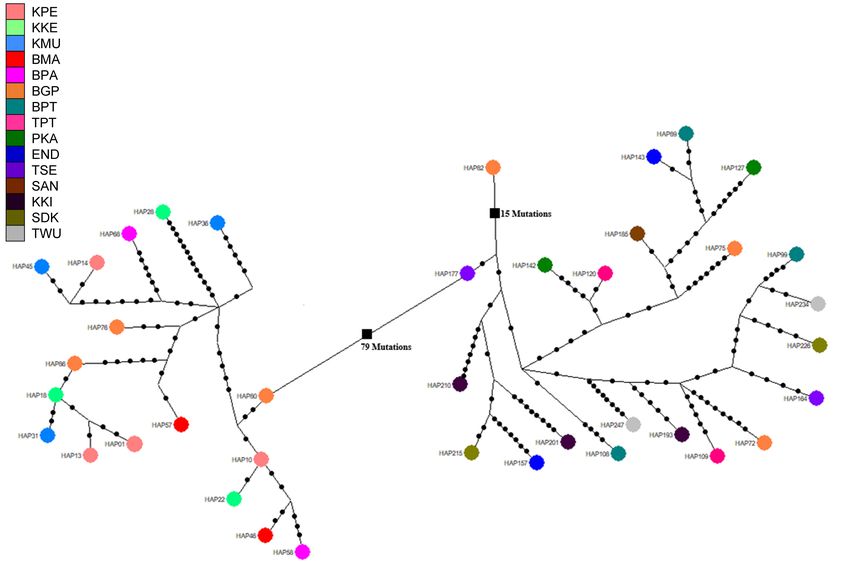
Zoological Studies 60: 8 (2021)                                                                           page 3 of 19

commonly used for population studies due to its highly      TGA GGG AAG AAA GTA A-3) (Tong et al. 2000)
variable and rapid evolution (Upholt and Dawid 1977;        for COI gene and 12S (5'-AAG AAC CAG CTA GGA
Walberg and Clayton 1981; Chu et al. 2003). This gene       TAA AAC TTT-3') and PCR-1R (5'-GAT CAA AGA
has also found applicability when elucidating population    ACA TTC TTT AAC TAC-3') (Chu et al. 2003) for
variability and relationships in several Penaeus species:   the control region. The PCR amplifications for each of
giant tiger prawn, P. monodon (Zhou et al. 2009;            the two gene fragments were performed in a reaction
Alam et al. 2016); kuruma prawn, P. japonicus (Tsoi         mixture containing 1.5 μL DNA template, 0.5 μL of
2006; Tsoi et al. 2007); Chinese white prawn, Penaeus       each primer, 2.5 μL of 10x i-TaqTM plus PCR Buffer,
chinensis (Cui et al. 2007; Xiao et al. 2010); and pink     2.0 of 25 mM MgCl 2, 1.0 μL of dNTP, 0.25 μL of
prawn, Penaeus duorarum (McMillen-Jackson and Bert          i-TaqTM plus DNA Polymerase and 16.75 μL of distilled
2004b).                                                     water (ddH2O), adding up to 25 µL. The PCR cycling
      Although several population genetic studies           conditions for COI and CR was conducted according
have been reported on P. semisulcatus based on              to the following thermal cycling profile: 4 min at 94°C,
mitochondrial DNA and nuclear markers (Munasinghe           35 cycles of 30 s at 94°C for denaturation, 50 s at 50°C
and Senevirathna 2015; Alam et al. 2017; Jahromi et al.     (COI) and 48.8°C (CR) for annealing and 1 min at
2019), none have been within the IMA waters. Thus, the      72°C for extension followed by a final step of 7 min
present study aimed to characterize the genetic diversity   at 72°C for the complete fragment extension. The
and population structure of P. semisulcatus populations     PCR products were sent to the service provider, First
within the IMA (Strait of Malacca, South China Sea,         BASE Laboratories Sdn. Bhd., for sequencing in both
Sulu Sea and Celebes Sea) inferred from mtDNA COI           the forward and reverse directions with an automated
and control region (CR) genes. This represents the first    sequencer (ABI3730XL, Applied Biosystems USA).
detailed population genetics study of the green tiger
prawn, P. semisulcatus, in IMA waters. The combined         Data Analysis
application of the COI (DNA barcoding) gene and
control region could provide useful insights into           Nucleotide alignment
potential cryptic diversity and population structuring.
                                                                  Both forward and reverse COI and CR sequences
                                                            were aligned using ClustalW in MEGA 7 (Nei and
            MATERIALS AND METHODS                           Kumar, 2000; Kumar et al. 2016). The aligned
                                                            sequences for COI were translated into proteins to
Sample collection and species identification                ensure accurate alignment and to detect stop codons,
                                                            if present. The haplotype distribution for sampled data
      Specimens of P. semisulcatus were collected from      was summarized using DnaSP 5.10 (Librado and Rozas
landing sites of 15 locations in the IMA, focusing on       2009). Sequence data for both genes were analysed
the Strait of Malacca, South China Sea, Celebes Sea and     based on the Maximum Likelihood (ML) method in
Sulu Sea in 2016 and early 2017 (Table 1 and Fig. 1).       MEGA 7 (Kumar et al. 2016) to produce phylogenetic
The prawn specimens were identified through assistance      trees with a confidence level of 1000 bootstrap
of a taxonomist and were identified using the following     replicates. Prior to this, the Model Test was conducted
references; A guide to the Australian penaeid prawns        to determine the best model for tree construction
(Grey et al. 1983), A guide to penaeid shrimps found in     using MEGA 7 (Kumar et al. 2016). The Bayesian
Thai waters (Chaitiamvong and Supongpan 1992) and           Information Criterion method was run to construct a
FAO Species Identification Guide for Fishery Purposes       Bayesian Inference tree phylogeny with the Markov
(Chan 1998). All specimens were immediately iced            Chain Monte Carlo (MCMC) algorithm (Ronquist et
or frozen after collection and later stored at -20°C or     al. 2012). PartitionFinder2 (Lanfear et al. 2017) was
preserved in 99% ethanol until DNA extraction.              used to determine the best-fit partitioning schemes
                                                            and models of molecular evolution for phylogenetic
DNA Extraction and PCR Amplification                        analysis. The Bayesian Inference (BI) tree was run
                                                            in MrBayes 3.2.6 (Ronquist et al. 2012) on CIPRES
      Total DNA were extracted from the pleopod tissue      Science Gateway (Miller et al. 2010) together with
of the preserved samples based on the 2xCTAB method         gene partitions, 1 million MCMC chains and 50% burn
(Doyle 1991). The COI and CR gene fragments were            in. The output files generated from the analyses were
amplified using a penaeid-specific primer COIf (5'-         examined in Tracer v.1.6 (Rambaut et al. 2014) to assess
TAA CCT GCA GGA GGA GGA GAY CC-3') (Palumbi                 the MCMC chain. The generated tree was displayed
and Benzie 1991) and COI-P4 (5'-AGG AAA TGT                 in FigTree v.1.4.3 (Rambaut 2016) and the complete

                                                                                          © 2021 Academia Sinica, Taiwan
Zoological Studies 60: 8 (2021) page 4 of 19
N
Fig. 1. Sampling locations of fifteen Penaeus semisulcatus populations amplified for mtDNA COI and control region gene analysed in the present
study.
Table 1. Sampling location, sample size and number of haplotypes of 15 Penaeus semisulcatus populations based on
mtDNA COI and CR
No Population Abbreviation N No. of haplotypes
COI CR COI CR
Group 1: Straits of Malacca (SOM), West Coast of Peninsular Malaysia
1. Kuala Perlis KPE 18 17 3 16
2. Kuala Kedah KKE 19 19 7 16
3. Kuala Muda KMU 19 17 10 17
4. Batu Maung BMA 18 14 5 14
5. Bagan Panchor BPA 15 15 8 14
6. Bagan Pasir BGP 23 20 11 20
7. Batu Pahat BPT 23 20 7 20
Group 2: South China Sea (SCS), East Coast of Peninsular Malaysia and Sabah and Sarawak, Malaysian Borneo
8. Tumpat TPT 20 19 13 18
9. Pulau Kambing PKA 19 16 13 16
10. Endau END 20 17 13 17
11. Tanjung Sedili TSE 20 20 10 20
12. Santubong SAN 11 11 5 11
13. Kota Kinabalu KKI 20 20 11 20
Group 3: Sulu Sea (SLS), Sabah, Malaysian Borneo
14. Sandakan SDK 19 18 11 18
Group 4: Celebes Sea (CLS), Sabah, Malaysian Borneo
15. Tawau TWU 20 20 12 20
TOTAL 284 263 90 246
© 2021 Academia Sinica, TaiwanZoological Studies 60: 8 (2021) page 5 of 19
mitochondrial sequence of the giant tiger prawn, P. population available for further genetic analysis (Table
monodon (AF217843), sequence was selected from 1).
GenBank as an outgroup to root the phylogenetic trees.
In addition, the Minimum Spanning Network (MSN) Nucleotide composition
version 5.0.0.3 (Polzin and Daneshmand 2018) was
used to display the haplotype relationships based on The sequence analysis for COI generated a
median joining or MJ network algorithm (Bandelt et al. 548-base-pair region from the 284 specimens with
1999) together with reduction options. 89 variable sites—58 parsimony informative and 31
singleton—generating 90 haplotypes (Table 1). The
Genetic diversity and Demographic history average nucleotide composition for the COI gene was A:
27.7%, T: 37%, G: 17.4%, C: 17.9%. Sequence analyses
The genetic diversity of these populations were for CR generated a 571 base pair region from the 263
examined using two estimators: haplotype diversity (Hd) specimens with 252 variable sites, 194 parsimony
and nucleotide diversity (p) in Arlequin 3.1 (Excoffier informative and 58 singleton sites, generating 247
et al. 2005). Tajima’s D (Tajima 1989) and Fu’s Fs haplotypes. The average nucleotide composition was,
(Fu 1997) analyses were examined to evaluate the A: 41.7%, T: 41.6%, G: 7.7%, C: 9%. Most unique
deviation from neutrality of the observed variation in sequences have been deposited in GenBank with
the same software. Mismatch distribution analysis and accession numbers for COI (MG020144–MG214725)
goodness of fit assessed by the Harpending’s raggedness and CR (MG214707–MG544283).
index, Hri (Harpending 1994), were performed to
evaluate demographic patterns in the major regional Haplotype distribution
groups as identified by the median joining network
and phylogenetic trees using DnaSP 5.10 (Librado Haplotypes 1 (22.9%) and 27 (27.8%) were
and Rozas 2009). A non-significant result of Hri index the most dominant for the COI gene. Haplotype 1
analysis indicates an expanding population (Harpending was represented by all populations from the Strait of
1994). Malacca (SOM) except for BPT (southern SOM), and
a few specimens from BGP. Haplotype 27 represented
Population structure analysis specimens from the South China Sea (SCS), Sulu
Sea (SLS) and Celebes Sea (CLS), and included the
Analysis of Molecular Variance (AMOVA) was SOM population of BPT and several individuals of
conducted to evaluate the genetic variation at different BGP (SOM). Sixty-three haplotypes were private or
hierarchical levels using Arlequin 3.1 (Excoffier et al. population-specific, while the other 27 haplotypes
2005). Isolation by Distance (IBD) analysis (Mantel were shared by more than one population. However,
Test) was also tested to assess any significance in in CR gene, apart from a few exceptions, each of the
isolation by distance relationships (Bohonak 2002) 247 mtCR haplotype generated was restricted to only a
using the same software. To determine groups of single population with none being dominant. Of these
populations that are geographically homogenous and 247 haplotypes, only seven are shared between two or
maximally differentiated from each other, and the more populations, which were mainly limited to the
genetic barriers between these groups a Spatial Analysis coast of the Straits of Malacca.
of Molecular Variance (SAMOVA) was performed in
SAMOVA 2.0 (Dupanloup et al. 2002). The optimal Phylogenetic relationships among haplotypes
number of groups, k (with maximum was k = 12), was
chosen based on the number that has the highest among The best-fit Model Selection for ML for both
group (FCT) variance. Significant values were adjusted genes was Tamura 3-parameter (T92+G) with a discrete
for family-wise error rate using the False Discovery gamma distribution. Two lineages were generated,
Rate Procedure at α = 0.05 (Verhoeven et al. 2005). Lineage I and Lineage II, in both COI (Fig. 2A) and CR
(Fig. 2B) (only selected representative haplotypes are
shown) genes with high support (BP > 92%). Lineage I
RESULTS is composed of the SCS, SLS and CLS populations and
the unexpected inclusion of BPT (southern SOM) and
A total of 284 individuals for COI and 263 most of the BGP specimens (central SOM). Lineage
individuals for CR specimens from 15 localities were II is composed of all SOM populations to the north of
successfully amplified. Sample size per site ranged BGP and the rest of the BGP specimens (of SOM) that
from 11 to 23, with an average of 19 individuals per were not clustered in Lineage I.
© 2021 Academia Sinica, TaiwanZoological Studies 60: 8 (2021) page 6 of 19
(A)
Lineage I
H ap25-H ap90
(BGP,BPT,TPT,PKA,END,
TSE,SAN,KKI,SDK,TWU)
(PKA)
(KMU)
Lineage II
(BPA)
Hap01-Hap29 (KPE,KKE,KMU,BMA,BPA,BGP)
(B) H ap89 (BPT)
H ap143 (END)
H ap127 (PKA)
H ap185 (SAN)
H ap120 (TPT)
H ap142 (PKA)
H ap106 (BPT)
H ap75 (BGP)
H ap193 (KKI)
Lineage I
H ap72 (BGP)
H ap109 (TPT)
H ap164 (TSE)
H ap99 (BPT)
H ap226 (SDK)
H ap234 (TWU)
H ap210 (KKI,TWU)
H ap157 (END)
H ap247 (TWU)
99/0.98 H ap201 (KKI)
H ap215 (SDK)
H ap82 (BGP)
H ap177 (TSE)
Hap46 (BMA)
Hap58 (BPA)
Hap22 (KKE)
Hap10 (KKE,BPA)
Hap80 (BGP)
Hap14 (KPE,KKE,KMU)
99/1.0 Hap45 (KMU)
Lineage II
Hap68 (BPA)
Hap36 (KMU)
Hap76 (BGP)
Hap28 (KKE,BPA)
Hap57 (BMA)
Hap18 (KKE,BMA)
Hap31 (KMU)
Hap86 (BGP)
Hap01 (KPE)
Hap13 (KPE,KMU)
Penaeus monodon (AF217843)
0.5
Fig. 2. (A) Maximum Likelihood tree of P. semisulcatus rooted with P. monodon (AF217843) from GenBank and Bayesian Inference (BI) analyses
of mtDNA COI gene. (B) Maximum Likelihood tree of P. semisulcatus rooted with P. monodon (AF217843) from GenBank and Bayesian Inference
(BI) analyses of mtDNA CR gene. The bootstrap support and posterior probability values are presented at the nodes. Population abbreviations are as
defined in table 1.
© 2021 Academia Sinica, TaiwanZoological Studies 60: 8 (2021) page 7 of 19
The minimum spanning network (MSN) generated distance from the eastern seas of SCS, SLS and CLS
two discrete groups (Lineage I and Lineage II) (Fig. populations was 3%. The BPT population of SOM
3) for COI and CR haplotypes (only representative was most genetically distant from the northern SOM
haplotypes are shown) (Fig. 4), with a reticulate pattern populations, with an average of 7%. However, the BPT
within each lineage in the latter, concordant with the population was genetically similar to the SCS, SLS and
phylogenetic tree analysis. The data shows the genetic CLS populations, with an average of 0.3%.
isolation of the SOM populations from SCS, SLS and As in COI, a parallel trend was observed in CR
CLS populations with two distinct exceptions as in (Table 2), although with higher absolute values. Within-
the earlier analyses, supporting a strong population population genetic diversity ranged from 2.3% to 9.7,
structure of this species, except for the admixed gene while between-population diversity ranged from 2.3%
pool at BGP. to 21.7%. The BGP population of SOM was the highly
differentiated from the northern SOM populations
Genetic diversity within and among populations (KPE, KKE, KMU, BMA and BPA) at an average
distance of 16%, while its distance from the eastern
Based on COI, BGP had the highest within- seas of SCS, SLS and CLS populations was only
population genetic diversity (4%), while KPE had the 7%. The BPT population was even more genetically
lowest (0.1%). Between-population genetic diversity distant from the northern populations of SOM, at a
ranged from 0.1% to 7.2% (Table 2). The BGP mean of 21%, while it was genetically similar to SCS,
population of SOM was genetically differentiated from SLS and CLS populations at a mean of 3%. Thus, in
the northern populations (KPE, KKE, KMU, BMA summary, the genetic diversity between the SCS, SLS
and BPA) of SOM at a mean of 4%, while its genetic and CLS populations (Lineage I) and the northern SOM
Fig. 3. Median joining-network of mtDNA COI haplotypes in Penaeus semisulcatus. The sizes of the circles are proportional to haplotype
frequencies, colour coded corresponding to locations and black squares on the lines linking haplotypes represent the number of mutations.
© 2021 Academia Sinica, TaiwanZoological Studies 60: 8 (2021) page 8 of 19
populations (Lineage II) were high for both genes; COI history in a large stable population or high level of
(7%) and CR (21%). However, the two more southern divergence among haplotypes that may be attributed to
populations of SOM—BGP and BPT—were more secondary contact between differentiated lineages.
genetically close to SCS, SLS and CLS.
As derived from COI gene, the within population Historical demographic pattern
haplotype diversities were high for most populations
(h: 0.307–0.911), except for KPE, KKE and BMA (all Tajima’s D and Fu’s Fs revealed negatively
in SOM) at (h < 0.5) (Table 3). The nucleotide diversity significant deviations from the mutation drift
was moderate, at 0.4% to 2.7%, except in the BGP equilibrium in Lineage I and Lineage II (except the
population, with very high value of (p: 22%). Based Tajima’s D for CR in Lineage II), thus making it
on the lineages, the combined populations had high consistent with the molecular response to population
haplotype and nucleotide diversities ranging from (h: expansion (Table 3 and Fig. 5). Overall, most of the
0.567–0.813) and (p: 3.4%–3.8%), respectively. sites fit a sudden population expansion model, with
On the other hand, based on the CR gene, the negatively significant Fu’s Fs and Tajima’s D for COI.
haplotype and nucleotide diversities were high: (h: However, the Tajima’s D for CR was not significant,
0.965–1.000) and (p: 2%–8%), respectively. Based on which is not consistent with Fu’s Fs. The discrepancy
lineages, haplotype and nucleotide diversities were between Tajima’s D and Fu’s Fs is likely due to the
also very high ranging from (h: 0.993–1) and (p: 7.4– superiority of Fu’s Fs over Tajima’s D in detecting
12.6%), respectively. Thus, according to the four basic significant changes in population (Fu 1997). A unimodal
classifications of demographic history by Grant and peak and non-significant Harpending’s raggedness
Bowen (1998), both Lineages I and II in general fall into index were observed in both lineages (Fig. 5), which
category 4, with high haplotype (h > 0.5) and nucleotide strengthen the evidence that both lineages underwent
(p > 0.5%) diversities, indicating a long evolutionary sudden expansion.
Fig. 4. Median joining-network of mtDNA CR haplotypes in Penaeus semisulcatus. The sizes of the circles are proportional to haplotype
frequencies, colour coded corresponding to locations and black squares on the lines linking haplotypes represent the number of mutations.
© 2021 Academia Sinica, TaiwanZoological Studies 60: 8 (2021) page 9 of 19
Population genetic structure with one or more single population groups cannot
deduce the group structure (Heuertz et al. 2004). Thus,
In agreement with the earlier analyses, the SCS, the best population configuration with the highest FCT
SLS and CLS populations (Lineage I) were found to be was selected when the analysis had more than a single
genetically distinct from the SOM populations (Lineage population (Tsukagoshi et al. 2011).
II), except for the BGP and BPT populations (COI: Based on the SAMOVA, k = 2 was selected for
FST = 0.912–0.984, CR: FST = 0.816–0.846, p < 0.05) both genes as the best population configuration defined
(Table 4). The majority of non-significant values after by the highest FCT (COI: 90.05%, p-value: 0.0000; CR:
FDR corrections were confined to within individual 82.34%, p-value: 0.0000) for AMOVA analysis (Table
seas. Mantel tests indicated statistically non-significant 5). Two analyses were conducted for the AMOVA. For
correlation between genetic differentiation (FST) and the COI, the first AMOVA analysis—which divided the
geographical distance among populations within both 15 populations into four groups based on the seas (Group
lineages, for both genes: Lineage I (COI: r = 0.051, P = 1: KPE, KKE, KMU, BMA, BPA, BGP, BPT (SOM);
0.585; CR: r = 0.227, P = 0.117) and Lineage II (COI: Group 2: TPT, PKA, END, TSE, SAN, KKI (SCS);
r = 0.317, P = 0.849; CR: r = 0.265, P = 0.837), which Group 3: SDK (Sulu Sea); Group 4: TWU (Celebes
indicate gene flow, were not restricted by distance. Sea)—showed significant difference among groups/
In SAMOVA, the best population configuration seas (FCT: 55.41%, p < 0.05). In the second approach,
is defined by the highest FCT. However, in this study, populations were divided into two groups based on
SAMOVA revealed that FCT increased with partitioning SAMOVA, k = 2) (Group 1: BGP, BPT, TPT, PKA,
of populations into the maximum group in all analyses. END, TSE, SAN, KKI, SDK, TWU; Group 2: KPE,
It should be noted that population structure analysis KKE, KMU, BMA, BPA) and resulted in even higher
Table 2. Genetic diversity within (bold) and among populations of P. semisulcatus based on COI (below diagonal) and
CR (above diagonal) genes
Populations KPE KKE KMU BMA BPA BGP BPT TPT PKA END TSE SAN KKI SDK TWU
KPE 0.028 0.026 0.029 0.025 0.031 0.163 0.211 0.211 0.212 0.214 0.213 0.214 0.214 0.211 0.215
0.001
KKE 0.001 0.025 0.028 0.023 0.030 0.162 0.210 0.211 0.211 0.213 0.213 0.213 0.213 0.210 0.215
0.002
KMU 0.002 0.002 0.028 0.026 0.032 0.166 0.213 0.213 0.213 0.216 0.215 0.215 0.215 0.213 0.217
0.003
BMA 0.001 0.001 0.002 0.023 0.029 0.162 0.211 0.211 0.211 0.213 0.212 0.213 0.213 0.210 0.215
0.001
BPA 0.002 0.003 0.004 0.003 0.035 0.165 0.212 0.213 0.213 0.215 0.214 0.215 0.215 0.212 0.217
0.004
BGP 0.041 0.041 0.042 0.041 0.042 0.097 0.072 0.072 0.073 0.072 0.072 0.073 0.073 0.071 0.074
0.040
BPT 0.070 0.070 0.071 0.070 0.070 0.033 0.027 0.027 0.028 0.026 0.026 0.027 0.026 0.026 0.028
0.002
TPT 0.071 0.071 0.072 0.071 0.071 0.034 0.003 0.027 0.028 0.027 0.027 0.028 0.027 0.026 0.029
0.004
PKA 0.068 0.068 0.068 0.068 0.068 0.033 0.004 0.005 0.030 0.027 0.028 0.028 0.028 0.027 0.030
0.007
END 0.070 0.070 0.071 0.070 0.070 0.034 0.003 0.004 0.006 0.026 0.026 0.027 0.026 0.025 0.028
0.004
TSE 0.070 0.070 0.070 0.070 0.070 0.033 0.002 0.003 0.005 0.003 0.026 0.027 0.026 0.026 0.028
0.002
SAN 0.069 0.069 0.070 0.069 0.069 0.033 0.002 0.003 0.004 0.003 0.002 0.028 0.028 0.027 0.029
0.002
KKI 0.071 0.071 0.071 0.070 0.071 0.034 0.003 0.004 0.005 0.004 0.003 0.003 0.026 0.026 0.028
0.004
SDK 0.071 0.070 0.071 0.070 0.071 0.034 0.003 0.004 0.005 0.004 0.003 0.003 0.003 0.025 0.028
0.003
TWU 0.070 0.070 0.070 0.069 0.070 0.033 0.003 0.004 0.005 0.004 0.003 0.002 0.003 0.003 0.030
0.003
© 2021 Academia Sinica, TaiwanZoological Studies 60: 8 (2021) page 10 of 19
Fig. 5. Mismatch distributions of Penaeus semisulcatus in COI (a & b) and CR (c & d) for both Lineages I and II and goodnesss fit tests were tested
using raggedness index.
Table 3. Demographic parameters of Penaeus semisulcatus based on mtDNA COI and CR in 15 populations sampled
from the Strait of Malacca, South China Sea, Sulu Sea and Celebes Sea. Bold values indicate significance (p < 0.05)
after the FDR procedure α = 0.05
Populations Haplotype diversity (h) Nucleotide diversity (p%) Tajima’s D Fu’s Fs
COI CR COI CR COI CR COI CR
KPE 0.307 0.993 0.4 2.7 -1.096 -0.398 -1.096 -4.406
KKE 0.544 0.965 0.9 2.5 -2.162 -0.817 -4.343 -2.979
KMU 0.784 1.000 2.1 2.7 -2.149 -0.641 -5.314 -6.706
BMA 0.484 1.000 0.7 2.3 -1.742 -0.264 -2.380 -5.314
BPA 0.791 0.991 2.4 3.1 -2.163 -0.761 -2.876 -2.814
BGP 0.866 1.000 22.0 8.0 1.864 0.695 4.551 -2.642
BPT 0.652 1.000 1.2 2.8 -1.820 -1.223 -2.896 -8.909
TPT 0.884 0.994 2.4 2.9 -2.048 -1.243 -9.061 -5.461
PKA 0.906 1.000 4.1 2.9 -2.011 -1.183 -5.955 -5.682
END 0.911 1.000 2.7 2.5 -1.765 -1.131 -8.400 -7.055
TSE 0.711 1.000 1.3 2.7 -1.640 -1.215 -7.696 -9.081
SAN 0.618 1.000 1.0 2.9 -1.791 -0.887 -2.310 -2.748
KKI 0.842 1.000 2.1 2.7 -1.361 -1.453 -6.358 -9.055
SDK 0.790 1.000 2.0 2.7 -1.578 -1.063 0.042 -7.575
TWU 0.811 1.000 1.9 3.0 -1.981 -1.166 -9.088 -8.323
LINEAGE I 0.813 1.000 3.4 7.4 -2.428 -1.843 -27.260 -23.938
LINEAGE II 0.567 0.993 3.8 12.6 -2.430 -1.223 -29.041 -24.184
TOTAL 0.727 0.010 3.1 3.1 -1.563 -0.850 -4.692 -5.984
© 2021 Academia Sinica, TaiwanZoological Studies 60: 8 (2021) page 11 of 19
and significant variations among groups (FCT = 87.92%, among groups (FCT = 42.54%, p < 0.05). In the second
p < 0.00001), indicating that the Group 1 populations approach with similar grouping to COI, an even higher
and Group 2 populations (which were mainly composed significant variation among groups was revealed (FCT
of northern SOM populations) were genetically distinct = 79.76%, p < 0.05) and significant among populations
from each other. For CR, the first AMOVA was grouped within group (FSC = 0.74%, p < 0.0000).
similarly to the COI and showed significant difference
Table 4. Pairwise FST among 15 populations of Penaeus semisulcatus based on COI (above diagonal) and CR (below
diagonal) genes. Bold values indicate significant (p < 0.05) FST values
Group SOM SCS SLS CLS
Populations KPE KKE KMU BMA BPA BGP BPT TPT PKA END TSE SAN KKI SDK TWU
SOM KPE * 0.000 0.014 0.001 0.004 0.478 0.978 0.963 0.940 0.960 0.978 0.984 0.967 0.969 0.970
KKE -0.031 * 0.006 -0.015 -0.017 0.475 0.972 0.957 0.933 0.953 0.971 0.975 0.960 0.963 0.963
KMU 0.033 0.062 * -0.015 -0.012 0.462 0.959 0.943 0.919 0.940 0.957 0.957 0.947 0.949 0.950
BMA -0.029 -0.031 0.041 * -0.004 0.470 0.974 0.958 0.935 0.955 0.973 0.978 0.962 0.965 0.965
BPA -0.026 -0.024 0.035 -0.010 * 0.429 0.957 0.939 0.912 0.935 0.955 0.953 0.943 0.945 0.946
BGP 0.568 0.582 0.571 0.567 0.551 * 0.373 0.342 0.288 0.334 0.353 0.290 0.346 0.341 0.342
BPT 0.831 0.838 0.831 0.842 0.823 0.113 * -0.011 0.013 0.010 0.017 0.050 0.009 0.006 0.017
SCS TPT 0.829 0.836 0.829 0.840 0.820 0.116 -0.009 * 0.001 -0.016 0.016 0.044 0.005 0.006 0.020
PKA 0.827 0.835 0.827 0.839 0.817 0.102 -0.008 -0.011 * -0.011 0.019 0.022 0.006 -0.011 0.012
END 0.839 0.846 0.839 0.851 0.830 0.117 -0.009 0.001 -0.013 * 0.034 0.063 0.008 -0.005 0.032
TSE 0.835 0.841 0.835 0.845 0.826 0.124 0.000 0.010 0.008 0.002 * 0.015 0.010 -0.006 -0.011
SAN 0.830 0.839 0.830 0.844 0.819 0.091 -0.018 0.008 -0.014 0.001 0.003 * 0.045 0.031 0.002
KKI 0.834 0.841 0.834 0.845 0.826 0.124 -0.013 0.020 0.007 -0.005 0.013 0.002 * 0.003 -0.010
SLS SDK 0.835 0.842 0.835 0.846 0.826 0.115 -0.007 0.009 -0.010 -0.015 0.016 0.003 0.002 * -0.001
CLS TWU 0.825 0.832 0.825 0.835 0.816 0.124 -0.002 0.019 0.017 0.011 0.022 0.004 -0.009 0.013 *
Table 5. AMOVA results for hierarchical genetic subdivision for percentage of variation and F-statistics of the mtDNA
COI and control region (CR) genes
Grouping Variance components % Variations F-statistics P-value
Based on mtDNA COI
i) All geographical seas Among Groups 55.41 FCT: 0.5541 0.0029
Group 1: (KPE,KKE,KMU,BMA,BPA,BGP,BPT) Among populations within group 30.44 FSC: 0.6828 0.0000
Group 2: (TPT,PKA,END,TSE,SAN,KKI) Among populations within total 14.14 FST: 0.8586 0.0000
Group 3: (SDK)
Group 4: (TWU)
ii) All SAMOVA (k = 2) Among Groups 87.92 FCT: 0.8792 0.0000
Group 1: (BGP,BPT,TPT,PKA,END,TSE,SAN,KKI,SDK,TWU) Among populations within group 2.89 FSC: 0.2396 0.0000
Group 2: (KPE,KKE,KMU,BMA,BPA) Among populations within total 9.18 FST: 0.9082 0.0000
Based on mtDNA control region
i) All geographical seas Among Groups 42.54 FCT: 0.4254 0.0068
Group 1: (KPE,KKE,KMU,BMA,BPA,BGP,BPT) Among populations within group 28.09 FSC: 0.4888 0.0000
Group 2: (TPT,PKA,END,TSE,SAN,KKI) Among populations within total 29.37 FST: 0.7063 0.0000
Group 3: (SDK)
Group 4: (TWU)
ii) All SAMOVA (k = 2) Among Groups 79.76 FCT: 0.7976 0.0020
Group 1: (KPE,KKE,KMU,BMA,BPA) Among populations within group 0.74 FSC: 0.0366 0.0000
Group 2: (BGP,BPT,TPT,PKA,END,TSE,SAN,KKI,SDK,TWU) Among populations within total 9.18 FST: 0.9082 0.0000
© 2021 Academia Sinica, TaiwanZoological Studies 60: 8 (2021) page 12 of 19
DISCUSSION 2012).
High genetic diversity and historical Genetic boundary of Penaeus semisulcatus
demographic pattern in the Strait of Malacca separates the Indian
Ocean from the Pacific Ocean populations
High levels of genetic diversity was evident in the
green tiger prawn, Penaeus semisulcatus, in the studied Two distinct phylogenetic groups (Lineage I and
regions, as reflected in both Lineage I (h: COI = 0.813; Lineage II) were evident based on the mitochondrial
CR = 1.0) (p: COI = 3.4%; CR = 7.4%) and Lineage II COI and control region of P. semisulcatus. Lineage
(h: COI = 0.567; CR = 0.993) (p: COI = 3.8%; CR = I comprised populations from the South China Sea,
12.6%). Similar patterns of genetic diversity have been Sulu Sea, Celebes Sea including all Batu Pahat - BPT
observed in other penaeid prawns: giant tiger prawn, and most of Bagan Pasir - BGP (Straits of Malacca)
P. monodon (h = 0.992, p = 4.3%) (You et al. 2008); individuals. On the other hand, Lineage II is composed
spear prawn, Mierspenaeopsis hardwickii (h = 0.996, of several specimens of Bagan Pasir and all populations
p = 0.77%) (Tzong 2007); and Indian white prawn, P. to the north of it. Population structuring within the Indo-
indicus (h = 0.88, p = 3.47%) (De Croos and Pálsson Pacific has been well depicted in other penaeid prawns,
2010). Thus, despite its commercial value, the genetic P. monodon and P. merguiensis (Daud 1995; Aziz et
variability is maintained, suggesting a large and stable al. 2011) which also displayed at least two different
population. The current study, based on the criteria phylogenetic groups between the Straits of Malacca and
proposed by Grant and Bowen (1998), suggests that South China Sea specimens. The current study found
Lineage I and Lineage II were formed either through deep genetic division between the populations to the
secondary contacts between previously differentiated north and south of Bagan Pasir, a site located in central
allopatric lineages or a long evolutionary history in SOM, the former being genetically aligned to the Indian
a large stable population (h > 0.5 and p > 0.5%), in Ocean and the latter to the Pacific Ocean. Previous
agreement with Category 4. This interpretation is studies have documented deep phylogeographic
supported by demographic analyses of Tajima’s D, Fu’s structuring in the Indo-Pacific Ocean between the Indian
Fs, Harpending Index (Hri) and mismatch distribution Ocean and Pacific Ocean populations involving broad
that together support a population expansion hypothesis geographically separated penaeid populations but with
for P. semisulcatus. minimal focus within the SOM where only one or very
Sudden population expansion can influence a few samples were sampled within the IMA (Daud 1995;
species genetic diversity and also the relationships Aziz 2011; Aziz et al. 2011; Jahromi et al. 2019). Highly
among haplotypes (McMillen-Jackson and Bert 2004a). differentiated populations were documented between the
During rapid population growth, lineage sorting (the Andaman Sea (an extension of the Indian Ocean) from
stochastic loss of haplotypes and lineages) slows, the Gulf of Thailand, South China Sea and Java Sea (part
as production of mutations overrides the effect of of the western Pacific Ocean) in the giant tiger prawn, P.
removal of alleles through genetic drift (Avise et al. monodon (Klinbunga et al. 1998 1999; Tassanakajon et
1984 1987), with a concomitant increase in haplotypes al. 1998; Supungul et al. 2000; Klinbunga et al. 2001).
and lineages and hence genetic diversity. It appears A similar pattern of genetic differentiation involving
that this diversity was consequently maintained in the other Indo-Pacific P. monodon populations have also
populations of Penaeus semisulcatus in the IMA and been reported (Duda and Palumbi 1999; Benzie et al.
stabilised in time, as recorded in the current study. This 2002; You et al. 2008; Waqairatu et al. 2012; Abdul‐
demographic expansion was reflected by the star-like Aziz et al. 2015), as has the kuruma prawn, P. japonicus
genealogy and unimodal mismatch distribution (Rogers (Tzong et al. 2004; Tsoi 2006; Shih et al. 2011). Abdul‐
and Harpending 1992; Slatkin and Hudson 1991) in the Aziz et al. (2015) reported that P. monodon populations
mtDNA COI analysis. The unimodal mismatch analysis were genetically distinct among six Indonesian regions:
pattern for both lineages have been observed in other Aceh, Bali, Cilacap (Central Java), Grajagan (East
prawn species in the Indo-Pacific region: kuruma prawn, Java), Sumbawa (West Nusa Tenggara) and Timika
P. japonicus (Shih et al. 2011); pink prawn, P. duorarum (Papua). You et al. (2008) covered a wide geographical
(McMillen-Jackson and Bert 2004b); brown prawn, range of P. monodon populations in the Indo-Pacific
P. aztecus and white prawn, P. setiferus (McMillen‐ area: four populations from Taiwan (Ta-NE, Ta-E,
Jackson and Bert 2003); Chinese prawn, P. chinensis Ta-W and Ta-S), two from Thailand (Th-E and Th-W),
(Li et al. 2009; Xiao et al. 2010); Indian white prawn three from Vietnam (VND, VNS and VNC), two from
P. indicus (De Croos and Pálsson 2010); and giant tiger the Philippines (PHB and PHR), two from Australia
prawn, P. monodon (Benzie et al. 2002; Waqairatu et al. (Aus-E and Aus-N), one from Madagascar (MG) and
© 2021 Academia Sinica, TaiwanZoological Studies 60: 8 (2021) page 13 of 19
one from Kenya (KY). They found that the West Indian (Strait of Malacca) from the western Pacific Ocean
Ocean populations were genetically differentiated (South China Sea and neighbouring waters), the genetic
from the West Pacific populations. In concordance, a boundary clearly differs between the two species.
study on the banana prawn, P. merguensis, Hualkasin The homogeneity along the Strait of Malacca and
et al. (2003) and Wanna et al. (2004) identified two its heterogeneity with South China Sea population
lineages composed of specimens mainly from the Gulf conforms to a divide at the southern tip of Peninsular
of Thailand and the East Pacific and another lineage Malaysia in P. monodon. The southern entrance to
confined to the Andaman Sea. This common pattern the Strait at the southern tip of Peninsula Malaysia
among sympatric species provides strong evidence has numerous islets, some fringed by reefs and sand
that, in a broad sense, species structuring is shaped by ridge accumulations of materials brought down by
similar vicariant histories (Avise 1992) within the Indo- rivers from Sumatra, which presumably hindered
Pacific. However, for most of these studies, populations trans-ocean crossing by the epibenthic tiger prawn
had been sourced from widely distant locations and the in contemporary times. However, the same cannot
detailed sampling of intervening populations such as be concluded in the present study in the case of P.
Strait of Malacca were not conducted. Thus, the precise semisulcatus. The unexpected inclusion of the southern
genetic boundary between these two major oceans was SOM population of Batu Pahat (BPT) in Lineage 1
not determined. (Pacific Ocean-South China Sea, Sulu Sea and Celebes
Although there has been limited documentation Sea) and a mixed Bagan Pasir gene pool (central SOM)
on the population genetics of the green tiger prawn, P. comprised of Lineage 1 and Lineage 2 suggest that the
semisulcatus, a parallel Indian Ocean vs Pacific Ocean physical obstacle at the tip of Peninsular Malaysia for
demarcation was documented by Alam et al. (2017). P. monodon has not been effective in preventing the
The authors investigated the genetic structuring of northward movement of P. semisulcatus, as significant
populations from Bangladesh, Sri Lanka, Iran (GenBank phylogeographic structuring occurred further north in
sequences), India (GenBank sequences), Philippines central SOM.
(GenBank sequences), China (GenBank sequences) and Thus, it is postulated based on the high genetic
Malaysia (a single GenBank sequence from Penang, variability and haplotypic signatures derived from both
northwest Peninsular). They observed two distinct lineages that the barrier lies at or within the vicinity
lineages, one in the Western Pacific Ocean (Philippines of Bagan Pasir (BGP) in central SOM. Samples at this
and China) and the other in the Indian Ocean landing site originate from three neighbouring coastal
(Bangladesh, Sri Lanka, Iran, India and Malaysia), fishing grounds; 1. the Klang Strait 2. a mud shoal
suggesting that the point of genetic division lies between called Angsa Bank and 3. Permatang Sedepa, more
the Philippines and Penang (Alam et al. 2017). commonly known as One Fathom Bank. These areas
are major contributors to the annual total fish catch
Bagan Pasir: A mixture of gene pools of the (Sulaiman et al. 2014). Thus, the highly variable Bagan
two Lineages? Pasir population could also represent a conglomerate of
heterogeneous gene pools of the three fishing grounds.
While numerous studies on penaeids and other However, while this may explain the high diversity,
marine species (Carpenter et al. 2011) unequivocably it does not explain why the northern and southern
delineate the Indian Ocean from the Pacific Ocean, populations are distinctly heterogeneous. One Fathom
the most population genetic borders are largely Bank is one of the largest sand banks in the Strait of
undetermined. However, the genetic boundary in P. Malacca and is characterised by a sudden dip in the
monodon was narrowed down to the Strait of Malacca sea. Its location is near the meeting point of the Indian
(SOM), as inferred through microsatellite loci, which Ocean and South China Sea fronts contributing to high
showed a cluster composed of three South China Sea biological productivity due to changing movements of
populations (Pacific Ocean) and another composed of currents and nutrients in these water bodies (Sulaiman
SOM populations involving a single population each et al. 2014). The sudden decrease in depth around
in the north and south of the SOM, suggesting genetic One Fathom Bank could act as a physical barrier to
homogeneity in this waterway (Aziz et al. 2011). migration of certain organisms between the north and
The Strait of Malacca waterway connects the south of it. The sand waves, ripples and sand banks
Indian Ocean and the Pacific Ocean between southeast at One Fathom Bank (Sulaiman et al. 2014) may also
of the Andaman Sea and the southwest of the South act as physical barriers that restrict the movement
China Sea (Leifer 1978). While the genetic structure of this species leading to differentiated populations.
of P. monodon (Aziz et al. 2011) parallel the current In contrast, the tiger prawn, P. monodon, appears to
study as in the broad delineation of the Indian Ocean, move freely across this bank based on microsatellite
© 2021 Academia Sinica, TaiwanZoological Studies 60: 8 (2021) page 14 of 19
markers (Aziz et al. 2011). The reason (s) for this cycles, which could facilitate the transportation of the
difference is unknown since both populations have a green tiger prawn larvae across these seas. Similarly,
similar ecology and behaviour (Chan 1998). A more the Strait of Malacca is strongly influenced by the
holistic study is required to identify the factors for northeast and the southwest monsoons (Thia-Eng et al.
this discordance and the precise point of delineation. 2000) and ocean currents. In the case of the green tiger
These will include research on other penaeid species prawn, P. semisulcatus, the genetic connectivity among
in this area which is currently lacking, more detailed the four seas investigated as expected by the influences
studies of P. semisulcatus populations between Bagan of Pleistocene and larval drift was impeded at a genetic
Pasir (BGP) and Batu Pahat (BPT), monitoring of its barrier in the central Strait of Malacca.
larval behaviour and dispersal, analysing contemporary
and past history of coastal currents as well as other Taxonomy ambiguity or biological factors that
ecological parameters to understand the population lead to genetic structuring
structuring in this oceanic realm.
The genus Penaeus is hypothesised to have Taxonomic misidentifications could also lead
originated or arose in the Indo-Pacific region and to erroneous conclusions about population genetics
radiated eastward and westward, forming two assessment. For instance, several studies on the kuruma
groups (western Pacific and Indian Ocean), during prawn, P. japonicus (Tzong et al. 2004; Tsoi 2006;
the Tertiary and Pleistocene periods (Baldwin et al. Shih et al. 2011), over a wide geographical coverage
1998). The lowering of sea level to below 120 m in reported significant genetic differentiation in the Indo-
the glacial periods during the Pleistocene Ice Age Pacific region, representing two varieties (I and II) of
exposed most parts of Malay-Peninsula, Sumatra, this species. However, in a more recent study, Tsoi
Java and Borneo to Palawan and led to vicariant et al. (2014) verified that variety I was actually P.
events for many marine species (Voris 2000) due to japonicus, which is endemic to the East China Sea
restricted genetic connectivity of populations across and northern South China Sea, while variety II was P.
the Sunda Shelf during these periods. Barriers to pulchricaudatus, which is widely distributed in the South
gene flow that structured prawn species have been China Sea, Australia, the Red Sea, the Mediterranean
recognised in the Malay-Indo Archipelago (Benzie and the western Indian Ocean. Cases of cryptic
et al. 1992; Dall et al. 1990; Daud 1995; Sodsuk diversity within this marine region have been recorded
1996). However, subsequently, during the interglacial involving the Indian white prawn, P. indicus (Alam et
period, the sea level rose, and the Indian Ocean and al. 2015); Japanese thread bream, Nemipterus japonicus
South China Sea were consequently connected via (Lim et al. 2014), Blacktip grouper, Epinephelus
the Straits of Singapore (Bird et al. 2006), which in fasciatus (Kuriiwa et al. 2014); and Malaysian oysters,
contrast to distinct structuring in several prawn species, Crassostrea belcheri and C. iredalei (Suzana et al.
homogenised previously isolated populations. Several 2011).
recent studies have documented intra-specific genetic The high genetic distinction between the two
homogeneity between the Strait of Malacca and South clusters calls for taxonomic studies to be conducted to
China Sea populations (Japanese threadfin bream, ascertain the taxonomic status of the two gene pools
Nemipterus japonicus (Lim et al. 2014); black scar (COI: 7%, CR: 21%). The genetic distances observed
oyster, Crassostrea iredalei (Zainal Abidin et al. 2014); in the current study are in accordance with inter-
mud crab, Scylla olivacea (Rosly et al. 2017); and blood specific variation among marine prawn species. For
cockles, Anadara granosa (Chee et al. 2011). A study example, five species of the genus Parapenaeopsis—P.
on the Indian mackerel, Rastrelliger kanagurta (Akib stylifera, P. coromandelica, P. hardwickii, P. sculptilis,
et al. 2015), found high connectivity up to the Gulf of P. uncta—showed sequence divergences of 7.65 to
Oman in the west Indian Ocean. 20.3% for COI gene and 2.4 to 12.0% for the 16S
The dispersal ability of the adult green tiger prawn rDNA gene (Chowdhury et al. 2018). Furthermore,
has been reported to be typically low (Farmer and Al- two juvenile pink prawn, Penaeus brasiliensis and P.
Attar 1981; Somers and Kirkwood 1984; Niamaimandi paulensis, showed values between 4.3–18.1% based on
et al. 2010). While adult movement is limited, the COI gene (Teodoro et al. 2016) and Metapenaeus
Rothlisberg et al. (1983) suggested that the larva could dobsoni populations using RAPD, 5 to 18% (Mishra
move up to 100 km between the offshore spawning et al. 2009). Jahromi et al. (2019) recently reported
grounds to inshore nursery habitats and enhance gene the presence of two morphotypes of P. semisulcatus in
flow among populations. Furthermore, the ocean the Persian Gulf namely the banded and non-banded
currents of the South China Sea, Sulu Sea, and Celebes antennae morphotypes genetically distant by 17.3%.
Sea are very much subjected to seasonal monsoon The non-banded is restricted to the Persian Gulf waters
© 2021 Academia Sinica, TaiwanZoological Studies 60: 8 (2021) page 15 of 19
while the banded morphotype is found not only in the degree. Consequently, this could be challenging due
Persian Gulf but also reaches the Malaysian waters to the cost and time needed to design them (Chambers
with albeit sampling restricted to only a single location and MacAvoy 2000; Jamaluddin 2017). Besides, a high
north of the Strait of Malacca (Penang) (Jahromi et al. number of samples is required for precise analysis of
2019). All haplotypes based on the COI gene of banded microsatellite variation. Chai et al. (2017) observed
antennae of P. semisulcatus from Iran and Malaysia low microsatellite variations among blue swimmer crab
(Penang) were clustered in one lineage while non- (Portunus pelagicus) populations throughout the coastal
banded antennae morphotype clustered in another areas of Malaysia, attributed to insufficient sample sizes.
distinct lineage, supporting the differentiation between However, in recent years, advances and reductions
the two morphotypes. In comparison, the genetic in cost associated with Next Generation Sequencing
distance within each of the lineage was similar to that analysis have facilitated microsatellite marker
in the current study (0.0 to 0.3%). Thus, their study development, circumventing most of these challenges
highlighted the prolific hidden diversity within this (Liu 2007; Gardner et al. 2011). Our future management
species (or potentially species complex). To extend the programme for this study will be to include novel
analysis, we conducted a comparative analysis of data biparental microsatellite data for population genetics of
from Jahromi et al. (2019) and the current data which this species.
further supported the genetic delineation of banded This study contributes to the growing evidence
and non-banded (16%.) morphotypes. Furthermore, the of inherently high genetic variability in non-
banded populations from Iran and Malaysia (Jahromi morphologically differentiated prawn species on a
et al. 2019) showed a close relationship with Lineage wide geographical scale. However, a morphological
II (1.4%), geographically overlapping populations with re-evaluation of the specimens should be conducted to
Jahromi et al. 2019), while being genetically distant confirm the taxonomic status. The understanding of the
from Lineage I, in parallel with our findings. genetic structure of this species will be highly beneficial
The mitochondrial markers in this study for fishery management and aquaculture development
successfully elucidated the population structuring programs through identification of reproductively
and genetic diversity of the green tiger prawn, P. isolated and genetically differentiated populations.
semisulcatus. However, information generated by
these generally matrilineal markers are restricted to
maternal inheritance. Over the past two decades, the CONCLUSIONS
complementary use of biparental nuclear markers,
particularly microsatellites, have gained wide Understanding population genetic diversity and
importance for a more holistic assessment of the structure is vital for managing productive fisheries,
population genetic variability of marine prawns and conserving genetic resources and sustainably harvesting
factors influencing them (Tsoi et al. 2007; Waqairatu populations of of marine organisms. The current study
et al. 2012; Abdul-Aziz et al. 2015; Song et al. 2018; highlights substantial genetic diversity in the green
Jahromi et al. 2019). In comparison to the mitochondrial tiger prawn, P. semisulcatus, with significant genetic
DNA gene, the usage of microsatellites as molecular differentiation between its two main lineages (I and
markers is more advantageous due to its abundance in II); Lineage I mainly comprised populations from the
genomes, small locus size facilitating polymerase chain Pacific Ocean-South China Sea, Sulu Sea and Celebes
reaction (PCR)-based genotyping, evenly distribution, Sea, while Lineage II was composed of northern to
codominant nature of Mendelian inheritance and high central populations in the Strait of Malacca. This
levels of polymorphism (Liu 2007). Furthermore, while genetic structure is likely attributed to a combination of
mitochondrial DNA provides important insights into factors, including historical vicariant events, dynamics
the population history of a population or species, it of ocean currents and biological factors. The Bagan
is limited to explaining contemporary factors, which Pasir population is considered a mixture of gene pools
could be elucidated through the use of microsatellite of the two lineages, and probably represents the area
markers. In addition, since both sexes contribute to (or vicinity) of demarcation of the two lineages. More
the genetic diversity of the progeny in biparental intensive studies of P. semisulcatus along the Strait of
markers, sex biased dispersal could be assessed from Malacca using a greater number of molecular markers—
the genetic output between the two sexes. However, including nuclear markers such as microsatellites—
the major disadvantage of microsatellite markers is the would provide further clues to the precise site of
requirement for prior de novo development of markers divide. This study is an important contribution to
for the species under investigation, although cross fishery management and aquaculture development
species amplification may sometimes work to a limited programs because it identifies genetically variable and
© 2021 Academia Sinica, TaiwanYou can also read