UNDERSTANDING THE CHALLENGES AND UNCERTAINTIES OF SEROPREVALENCE STUDIES FOR SARS-COV-2 - MDPI
←
→
Page content transcription
If your browser does not render page correctly, please read the page content below
International Journal of
               Environmental Research
               and Public Health

Review
Understanding the Challenges and Uncertainties of
Seroprevalence Studies for SARS-CoV-2
David McConnell 1,2, *, Conor Hickey 1,2 , Norma Bargary 3 , Lea Trela-Larsen 1,2 , Cathal Walsh 1,3 , Michael Barry 1,2
and Roisin Adams 1,2

                                          1   National Centre for Pharmacoeconomics, St James’s Hospital, D08 HD53 Dublin, Ireland;
                                              hickeyc2@tcd.ie (C.H.); trela@stjames.ie (L.T.-L.); Cathal.Walsh@ul.ie (C.W.); mbarry@stjames.ie (M.B.);
                                              roadams@tcd.ie (R.A.)
                                          2   Department of Pharmacology and Therapeutics, Trinity College Dublin, D08 HD53 Dublin, Ireland
                                          3   Health Research Institute and MACSI, University of Limerick, V94 T9PX Limerick, Ireland;
                                              Norma.Bargary@ul.ie
                                          *   Correspondence: DMcConnell@stjames.ie

                                          Abstract: SARS-CoV-2 continues to widely circulate in populations globally. Underdetection is
                                          acknowledged and is problematic when attempting to capture the true prevalence. Seroprevalence
                                          studies, where blood samples from a population sample are tested for SARS-CoV-2 antibodies
                                          that react to the SARS-CoV-2 virus, are a common method for estimating the proportion of people
                                          previously infected with the virus in a given population. However, obtaining reliable estimates from
                                seroprevalence studies is challenging for a number of reasons, and the uncertainty in the results is

                                          often overlooked by scientists, policy makers, and the media. This paper reviews the methodological
Citation: McConnell, D.; Hickey, C.;
                                          issues that arise in designing these studies, and the main sources of uncertainty that affect the
Bargary, N.; Trela-Larsen, L.; Walsh,
                                          results. We discuss the choice of study population, recruitment of subjects, uncertainty surrounding
C.; Barry, M.; Adams, R.
                                          the accuracy of antibody tests, and the relationship between antibodies and infection over time.
Understanding the Challenges and
Uncertainties of Seroprevalence
                                          Understanding these issues can help the reader to interpret and critically evaluate the results of
Studies for SARS-CoV-2. Int. J.           seroprevalence studies.
Environ. Res. Public Health 2021, 18,
4640. https://doi.org/10.3390/            Keywords: COVID-19; SARS-CoV-2; coronavirus; seroprevalence; antibody testing
ijerph18094640

Academic Editor: Nicola
Luigi Bragazzi                            1. Introduction
                                                The SARS-CoV-2 virus is likely to be circulating in populations since December 2019
Received: 9 April 2021
                                          with the currently known first case recorded in Wuhan in China. Despite worldwide
Accepted: 24 April 2021
                                          attempts at suppression, and in some countries eradication, the virus continues to circulate
Published: 27 April 2021
                                          and in most countries it is unclear to what extent. However, many publications have
                                          indicated that it is circulating to a wider extent than the case incidence report [1–3].
Publisher’s Note: MDPI stays neutral
                                                Estimating the true number of people who have previously been infected with SARS-
with regard to jurisdictional claims in
                                          CoV-2 enables scientists and policy-makers to understand how the virus spreads in various
published maps and institutional affil-
                                          settings, to retrospectively assess the performance of infectious disease models and hence
iations.
                                          improve future modeling and planning for further outbreaks, and to evaluate the effective-
                                          ness of restrictions aimed at curbing the spread of the virus. The quantification of those
                                          who have been exposed to infection is ideally done via direct testing for presence of the
                                          virus. Currently, naso and oropharyngeal swabs are the two main recommended upper
Copyright: © 2021 by the authors.
                                          respiratory tract specimen types for COVID-19 diagnostic testing, with detection of the
Licensee MDPI, Basel, Switzerland.
                                          virus being carried out via real-time reverse transcription-quantitative polymerase chain
This article is an open access article
                                          reaction (RT-PCR) [4–6]. However, identifying cases in this way is dependent on capturing
distributed under the terms and
                                          those cases while a person is shedding virus.
conditions of the Creative Commons
Attribution (CC BY) license (https://
                                                An alternative method is to estimate the exposure of the virus via the presence of
creativecommons.org/licenses/by/
                                          antibodies specific to SARS-CoV-2 in blood samples, which allow for a considerably longer
4.0/).

Int. J. Environ. Res. Public Health 2021, 18, 4640. https://doi.org/10.3390/ijerph18094640                       https://www.mdpi.com/journal/ijerph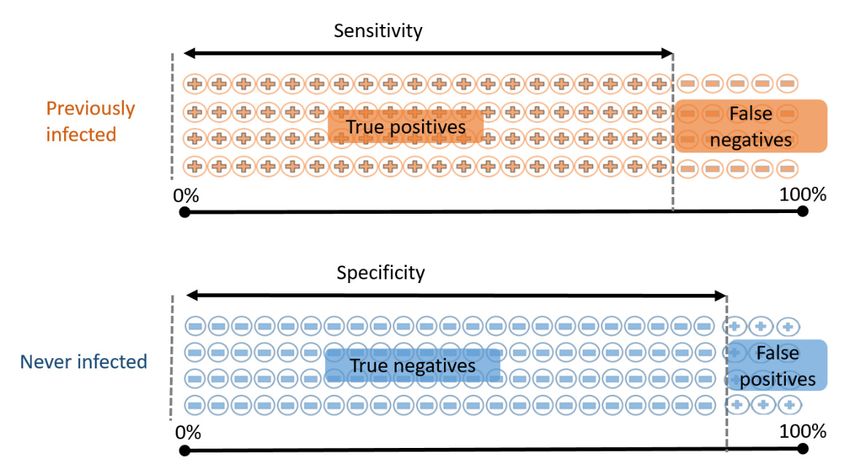
Int. J. Environ. Res. Public Health 2021, 18, 4640                                                                                                  2 of 19

                                        detection period [6]. At a population level, antibody tests can be used to carry out “sero-
                                        prevalence” studies, which estimate the proportion of people who have SARS-CoV-2
                                        antibodies in their blood (as a proxy for previous infection). Seroprevalence studies have
                                        been the subject of much recent attention; however, estimates of total case numbers arising
                                        from these studies can be highly uncertain. Overlooking the uncertainties and limitations
                                        of these studies can lead to a flawed understanding of the disease and its spread, and po-
                                        tentially to poor policy decisions as a result. An example of this can be seen in the reaction
                                        to an early seroprevalence study in Santa Clara County California [7], which generated
                                        considerable controversy at the time, and was frequently cited when debating the potential
                                        need for nonpharmaceutical interventions (NPIs) against COVID-19 [8]. More recently, a
                                        study of blood donors in Manaus, Brazil, suggested an historic infection rate of 76% in the
                                        city by October 2020, above most estimates of a herd immunity threshold and therefore
                                        making future waves of infection extremely unlikely [9]. Despite this, a large outbreak
                                        unexpectedly followed shortly afterward in December 2020 and January 2021 [10].
                                             These examples highlight the need for scientists and policy makers to critically eval-
                                        uate seroprevalence studies and recognize their limitations. In this article, we therefore
                                        examine the main sources of uncertainty and common misunderstandings that can arise
                                        from such studies, and outline how their impact may be assessed.

                                        2. Background
                                        2.1. The Problem with Confirmed Cases
                                                   As of 6 April 2021, there were a total of 238,144 confirmed cases of COVID-19 in
                                             Ireland [11]. As is the case in many (if not most) countries [2,12], there is good reason to
                                             believe that the true number of those who have been infected is considerably higher than
                                             official case numbers suggest, as outlined in Figure 1. Many of those who were infected
                                             were not tested at all, particularly in the earlier stages of the epidemic in Ireland, when
                                             testing was largely restricted to those showing two or more “typical” symptoms, healthcare
                                             workers, and high-risk groups. While testing is now more widespread, it is still likely that
                                             some mild or asymptomatic infections remain undiagnosed. Additionally, the RT-PCR
                                             tests used to detect active infection are not perfect [13]—according to one study [14], a
                                             currently infected person has at most a 67% chance of correctly testing positive (this figure
                                             can be much lower, depending on the length of time since exposure). This means that many
                                             infected people are recorded as testing negative and are not counted in the confirmed cases
   Int. J. Environ. Res. Public Health 2021, figures.
                                             18, x     While false positives (uninfected people testing positive) can also  3 ofoccur,
                                                                                                                                 20    these
                                             are much less common by comparison [15]. As a result, confirmed cases almost certainly
                                             underestimate total infection numbers to varying degrees around the world.

                                       Figure 1. Total confirmed COVID-19 cases in Republic of Ireland as of 6 April 2021. Official COVID-
                                       19 case numbers (HPSC [11] 6 April 2021) are based on RT-PCR positive tests only (a small number
                                       Figure 1. Total confirmed COVID-19 cases in Republic of Ireland as of 6 April 2021. Official
                                       of which may
                                       COVID-19         be false positives).
                                                  case numbers   (HPSC [11] The     true
                                                                              6 April     number
                                                                                       2021)       of infections
                                                                                              are based on RT-PCR also  includes
                                                                                                                     positive  testsanonly
                                                                                                                                       unknown
                                                                                                                                           (a smallnumber of
                                       people of
                                       number   who  were
                                                  which  mayeither  never
                                                               be false    tested, The
                                                                        positives).  or else
                                                                                         truefalsely
                                                                                              numbertested   negative.
                                                                                                       of infections also includes an unknown
                                       number of people who were either never tested, or else falsely tested negative.

                                       2.2. Seroprevalence Studies as A Solution
                                            When infected with SARS-CoV-2, a person’s immune system produces antibodies to
                                       fight the virus, which, in the majority of cases, become detectable typically within 14 to 21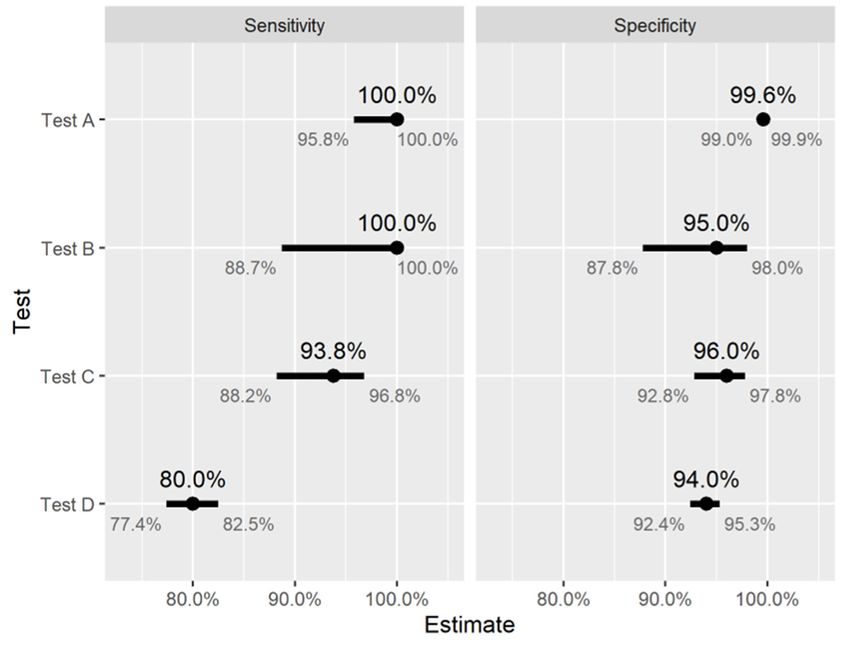
Int. J. Environ. Res. Public Health 2021, 18, 4640                                                                                3 of 19

                                             Underdetection and delayed reporting of (RT-PCR) confirmed COVID-19 cases is
                                        likely to have contributed to the wide ranges of predictions of future infections obtained
                                        from infectious disease models early in the pandemic [16]. The discrepancies between
                                        these predictions (sometimes arising from updating the same model with new data) lead
                                        to considerable confusion among policymakers, and may have eroded confidence in the
                                        usefulness of mathematical modeling in this context. Similarly, early estimates of case-
                                        fatality and case-hospitalization ratios varied considerably and were almost certainly
                                        affected by underdetection [17], potentially causing further confusion that influenced the
                                        public health response.

                                        2.2. Seroprevalence Studies as A Solution
                                             When infected with SARS-CoV-2, a person’s immune system produces antibodies to
                                        fight the virus, which, in the majority of cases, become detectable typically within 14 to 21
                                        days of infection [18] and remain detectable for at least several months afterward [19,20].
                                        There are a wide variety of test kits available for the detection of SARS-CoV-2 antibodies
                                        around the world [21], which work in different ways. Both point-of-care tests such as lateral
                                        flow immunoassays (LFIAs), and laboratory-based tests (e.g., enzyme linked immunosor-
                                        bent assays, chemiluminescent assays) can be used, which may detect different types of
                                        antibody (IgA, IgG, IgM) or a combination thereof using whole blood, serum, or plasma
                                        samples. These tests may also differ in terms of the target SARS-CoV-2 antigen(s) (spike,
                                        membrane, or nucleocapsid proteins) used. By carrying out antibody tests on a group
                                        of people, we can determine who has been previously infected. These tests enable us to
                                        estimate seroprevalence in a population, that is, the proportion of people with SARS-CoV-2
                                        antibodies in their blood, and thus estimate the total number of previous infections. A
                                        detailed introduction to some of the different study designs and antibody tests available,
                                        and how these may be chosen to align with the scientific question(s) being investigated,
                                        can be found in [22].
                                             Many seroprevalence studies have been carried out around the world. While the
                                        results have varied considerably between studies and locations, they have consistently
                                        indicated that the true number of people previously infected is considerably higher than
                                        the official number of confirmed cases. For example, since June 2020 the Health Protection
                                        Surveillance Centre (HSPC) has been carrying out a seroprevalence study (SCOPI) in
                                        Ireland [23,24]. Preliminary results published in August 2020 estimated that 1.7% of the
                                        population aged 12–69 years in Ireland had previously been infected, corresponding to
                                        59,500 total infections, which was approximately three times higher than the total number
                                        of confirmed cases in this age bracket at the time. Another example is the Prevalence of
                                        Antibodies to SARS-CoV-2 in Irish Healthcare Workers (PRECISE) study [25], designed to
                                        estimate seroprevalence among healthcare workers in two large Irish hospitals in October
                                        2020 and again in March/April 2021. This study indicated that 39% of healthcare workers
                                        with detectable antibodies had not previously received a positive RT-PCR diagnosis, despite
                                        high rates of testing for active infection among these workers.
                                             Studies such as these can provide useful information for researchers and policymakers
                                        in many ways. For example, comparing seroprevalence estimates in a broad population at
                                        various time points can give insight into the rate at which the disease has spread, which
                                        can in turn be used to assess the impact of nonpharmaceutical interventions (NPIs) during
                                        the given time period (e.g., [26,27]). Data from these studies can also be used to inform
                                        infectious disease models that aim to estimate the likely trajectory of the disease under
                                        various scenarios, and in turn to assess the impact of potential future NPIs accordingly.
                                        For example, seroprevalence studies have been used to estimate infection–fatality ratios
                                        (IFRs) [28,29], which can then be used in modeling studies to assess future policy decisions
                                        around NPIs or vaccination campaigns. Estimating seroprevalence among specific groups
                                        of interest (e.g., healthcare or other essential workers, residents of long-term care facilities,
                                        school-aged children) can provide further information about how the disease spreads in
                                        various settings and help to identify those that carry a high-risk of transmission, which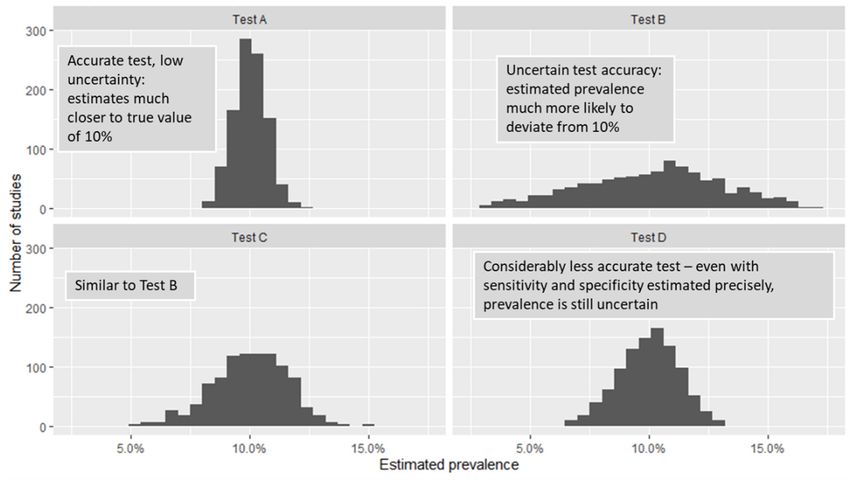
Int. J. Environ. Res. Public Health 2021, 18, 4640                                                                              4 of 19

                                        can also inform policy decisions. For example, the PRECISE study indicated that workers
                                        in one hospital (St. James’s Hospital in Dublin) were approximately 3.7 times more likely
                                        to have evidence of previous infection compared with those in the other hospital studied
                                        (University Hospital Galway), even after accounting for differences in rates of contact
                                        with COVID-19 patients in the hospital, indicating that many healthcare workers are
                                        becoming infected in the community rather than in hospital settings. Other key insights
                                        from this study included the identification of healthcare assistants as having a high risk of
                                        infection, and also the elevated risk associated with living with others, particularly other
                                        healthcare workers. Similarly, seroprevalence studies among university students have been
                                        used to study risk factors for SARS-CoV-2 infection, such as international travel, living
                                        arrangements, contact with a confirmed COVID-19 case, and demographic factors [30].
                                              With the rollout of mass vaccination campaigns, new applications of SARS-CoV-2
                                        “serosurveillance” (that is, carrying our regular seroprevalence studies in a population) may
                                        arise. Indeed, as vaccinated individuals should also have detectable antibody levels, sero-
                                        prevalence can provide a snapshot of the extent of COVID-19 immunity in the population
                                        at a given point in time, arising either from vaccination or from past infection [31]. While
                                        public health authorities will likely have reliable estimates of vaccine coverage in the popu-
                                        lation, there are concerns about infection- and vaccine-induced protection from COVID-19
                                        declining over time [32,33], or about the prevalence of vaccine “nonresponders” who do
                                        not develop antibodies. As such, vaccine coverage in the population may not provide
                                        sufficient information about population immunity for public health authorities: carrying
                                        out routine serosurveillance in this setting could potentially address this gap. Therefore, as
                                        mass vaccination campaigns progress around the world, studies like these could provide
                                        invaluable information in jurisdictions aiming for herd immunity via vaccination in the
                                        future.

                                        2.3. Uncertainty in Seroprevalence Studies
                                              Unless we test everybody in the population, using a perfect (i.e., 100% accurate) test,
                                        we cannot calculate seroprevalence exactly: we can only estimate it alongside the associated
                                        uncertainty. When presented with the results of such a study, the reader will often need to
                                        assess the extent to which the true prevalence may differ from the estimate. Some of this
                                        uncertainty can be quantified, and this is usually presented in the form of “confidence” or
                                        “credible” intervals (discussed in Section 3.3) in the results. For example, the SCOPI study
                                        suggested that a range of 1.1% to 2.4% seroprevalence among 12–69 year olds in Ireland
                                        was plausible in August 2020, corresponding to between 39,800 and 85,200 infections in
                                        this age group. Confidence intervals like these capture some but not all of the uncertainty
                                        in the study results, and it can therefore be challenging for the nonexpert to make sense of
                                        these figures. There is a risk that many readers will naturally assume that all reasonable
                                        sources of uncertainty are accounted for by this range of values, and proceed under the
                                        assumption that the true number of past infections will almost certainly lie within this
                                        range. In practice, the uncertainty captured by interval estimates may be overshadowed by
                                        other sources of uncertainty that cannot be easily represented numerically. In what follows,
                                        we discuss some of the major sources of this uncertainty: issues around whom we include
                                        and exclude from the study, how we recruit participants, the role of random chance, and
                                        the limitations of antibody tests themselves. Understanding these issues can help to better
                                        assess the certainty of evidence provided by seroprevalence studies, and to avoid drawing
                                        misleading conclusions as a result.

                                        3. Key Challenges in Seroprevalence Studies
                                             In this section we discuss some of the main challenges that arise in estimating sero-
                                        prevalence in a population, with a particular focus on how to interpret the results of studies
                                        and assess their limitations. These topics have been identified as a result of the Authors’
                                        past experiences of communicating more general statistical and methodological uncertainty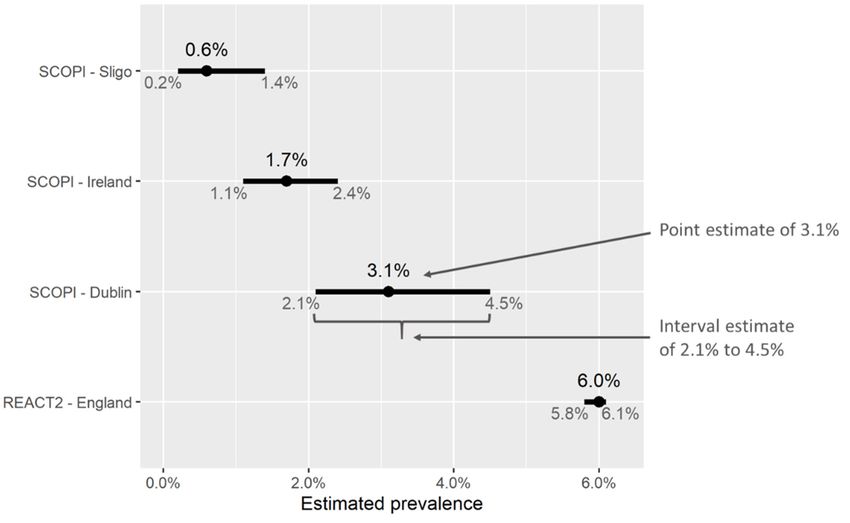
Int. J. Environ. Res. Public Health 2021, 18, 4640                                                                               5 of 19

                                        to scientists, clinicians and decision makers, together with a (nonsystematic) review of the
                                        issues arising in recent SARS-CoV-2 seroprevalence studies (particularly [7,9,24,25,27,34]).

                                        3.1. Populations and Generalization—Seroprevalence Among Whom?
                                             In a seroprevalence study, the group of people among whom we are trying to estimate
                                        prevalence of specific antibodies is called the population. Population could mean many
                                        things in this context: The Irish population as a whole, healthcare workers in Leinster,
                                        nursing home residents in Cork, etc. The study population is typically much larger than
                                        the group of people that we actually test, and care is needed to define it precisely: we may
                                        draw flawed conclusions from a study by generalizing the results to a population that is too
                                        different from those included in the study. For example, the SCOPI study enrolled people
                                        aged 12–69 [23]. It may be tempting to conclude that the prevalence of past SARS-CoV-2
                                        infection in the over 70s will be similar to that in the study population; however, there
                                        are a number of reasons why this may not be the case. For example, the government’s
                                        cocooning advice may have reduced infection rates in this age group, while on the other
                                        hand, it is likely that hospital and nursing home outbreaks disproportionately affected the
                                        over 70s. Similarly, seroprevalence studies carried out in England [34], Scotland [35], the
                                        Netherlands [36], among others, use samples collected from blood donors. Many people
                                        with long-term medical conditions are not eligible to donate blood and thus would not be
                                        included. Moreover, even among those who are eligible to donate blood, those who actually
                                        do donate may differ in important ways from those who do not. Perhaps healthcare workers
                                        are more likely to donate blood, or maybe blood donors typically follow social distancing
                                        guidance more than the average person. It is not immediately obvious whether or not
                                        donors will be more or less likely to have been exposed than the general population. In
                                        the Manaus seroprevalence study mentioned in the Introduction, one possible explanation
                                        for the failure of (apparent) herd immunity to prevent a resurgence of cases is that using
                                        blood donors as a proxy for the wider population may have overestimated infection rates
                                        considerably [37].
                                             The importance of limitations like these on the study population depends on how
                                        we intend to use the results. For example, given that the majority of COVID-19 deaths in
                                        Ireland occurred in the over 70s age group, it would be unwise to draw any firm conclusions
                                        about the overall infection fatality ratio (IFR) in Ireland from the SCOPI study (though it
                                        could be used to estimate the IFR among the under 70s). Indeed, failing to include high-risk
                                        groups in seroprevalence studies (such as nursing home residents, homeless individuals,
                                        or marginalized ethnic groups, for example) is a recognized challenge when attempting
                                        to estimate the IFR of the disease [29]. In general, it is essential for the reader to be aware
                                        of the population in which a seroprevalence has been carried out, as this is often more
                                        restrictive than we would like. While it may be case that seroprevalence is indeed similar
                                        in groups outside the study population (e.g., in the over 70s or among nonblood donors,
                                        respectively, in the two examples just discussed), drawing such a conclusion requires
                                        making assumptions, which represent an additional source of uncertainty that cannot be
                                        easily measured. The plausibility of these assumptions should be assessed using qualitative
                                        judgment and external information where possible.

                                        3.2. Selecting Appropriate Samples
                                             Typically, we cannot test everybody in a given population (except in cases where the
                                        population is small and easily identified, such as the residents of a specific nursing home).
                                        Instead, we select a sample of people to test, and based on the results, try to infer the
                                        prevalence in the population as a whole. However, we can only do this in a meaningful
                                        way if the sample is representative of the wider population, in terms of characteristics that
                                        affect the likelihood of having been previously infected.
                                             As an example, imagine that we selected a sample of the population that was pre-
                                        dominantly women (Sample 1 in Figure 2). While there may be no biological reason to
                                        suggest that either men or women are more or less likely to be infected, the prevalence of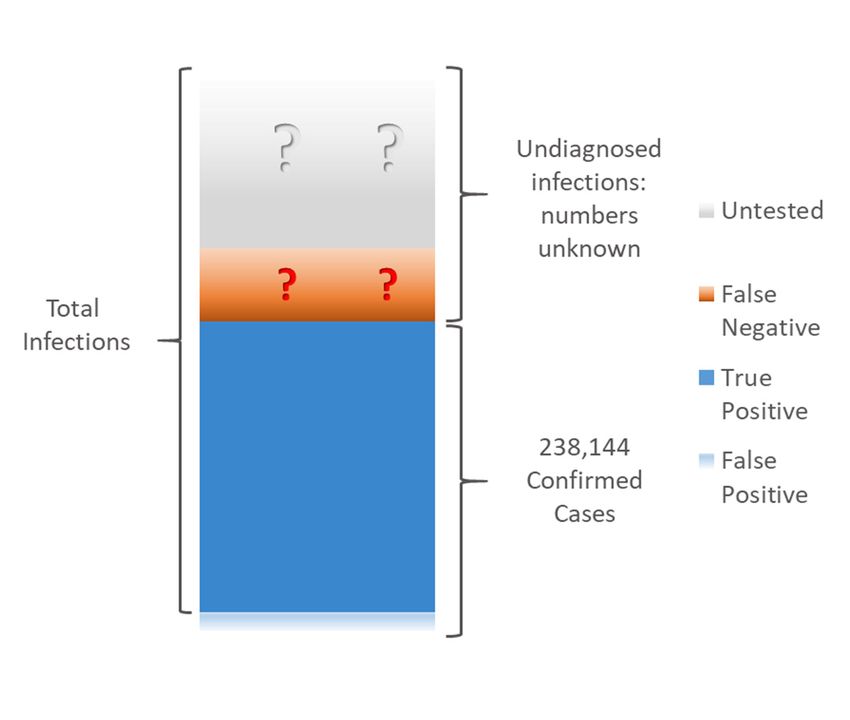
population is small and easily identified, such as the residents of a specific nursing home).
Instead, we select a sample of people to test, and based on the results, try to infer the prev-
alence in the population as a whole. However, we can only do this in a meaningful way if
the sample is representative of the wider population, in terms of characteristics that affect
the likelihood of having been previously infected.
Int. J. Environ. Res. Public Health 2021, 18, 4640 6 of 19
As an example, imagine that we selected a sample of the population that was pre-
dominantly women (Sample 1 in Figure 2). While there may be no biological reason to
suggest that either men or women are more or less likely to be infected, the prevalence of
SARS-CoV-2 inSARS-CoV-2
a sample like in this couldlike
a sample differ
thisfrom
could the general
differ frompopulation
the generalfor a numberfor a number of
population
of reasons. For reasons.
instance,Forit is instance,
quite plausible thatplausible
it is quite workers in sectors
that that in
workers aresectors
predominantly
that are predominantly
women (e.g., healthcare)
women (e.g., face a higher risk
healthcare) faceof being infected
a higher than infected
risk of being the workforce
than theat workforce
large. at large. If
If these workers are workers
these over-represented in the sample,
are over-represented then
in the the prevalence
sample, of SARS-CoV-2
then the prevalence of SARS-CoV-2 may
may be overestimated by this study.
be overestimated by thisBy contrast,
study. in a sample
By contrast, with approximately
in a sample with approximatelyequalequal numbers
numbers of men of men and women
and women (Sample
(Sample 2 in 2Figure
in Figure 2), this
2), this issue
issue does
does notnot arise,
arise, andand seroprevalence in
sero-
prevalence in the thesample
sampleisismuchmuchmore
morelikely
likelyto
tobebeclose
closeto tothe
thetrue
true(population)
(population) value.
value.
Figure 2. Importance of representative sampling. In this population, the rate of prior infection is higher among women.
Figure 2. Importance of representative sampling. In this population, the rate of prior infection is
As a result,higher
Sampleamong
1, which is predominantly
women. women,1,overestimates
As a result, Sample the prevalence
which is predominantly of prior
women, infection among
overestimates the the wider
population.prevalence
By contrastofthe prevalence
prior infectioninamong
Samplethe2,wider
whichpopulation.
contains approximately equal
By contrast the numbersinofSample
prevalence men and
2, women, is
much closerwhich
to thatcontains
of the wider population.
approximately equal numbers of men and women, is much closer to that of the
wider population.
There are many less obvious ways in which sample selection can introduce bias into
There are prevalence estimates.
many less obvious Forinexample,
ways an early
which sample antibody
selection canstudy in Santa
introduce biasClara,
into California [7]
recruited participants using targeted Facebook ads. This
prevalence estimates. For example, an early antibody study in Santa Clara, California, [7] could be a source of bias if
recruited participants using targeted Facebook ads. This could be a source of bias if Face- in ways that
Facebook users differ systematically from the population as a whole, and
book users differ affect the likelihood
systematically fromof COVID-19
the populationexposure; age profile,
as a whole, and infor example.
ways Similar issues can
that affect
the likelihood of COVID-19 exposure; age profile, for example. Similar issues can arise studies
arise in any study or survey in which participants self-enroll [38]. Other in [39] have
enrolled participants outside shopping centers. This approach
any study or survey in which participants self-enroll [38]. Other studies [39] have enrolled can be better, provided that
these areas cover a broad spectrum of the population in
participants outside shopping centers. This approach can be better, provided that these terms of age, sex, socioeconomic
status,
areas cover a broad and other
spectrum offactors. When studies
the population in termsareofcarried out socioeconomic
age, sex, with the involvement
status, of government
and other factors. When studies are carried out with the involvement of governmentthe
agencies, it is often possible to select a representative sample of population from
agen-
an official “list” such as the electoral register or similar, and inviting those selected to
cies, it is often possible to select a representative sample of the population from an official
participate. For example, the REACT study in England [27] selected participants at random
“list” such as the electoral register or similar, and inviting those selected to participate.
from the National Health Service (NHS) patient list, which contains everybody registered
For example, the REACT study in England [27] selected participants at random from the
with a general practitioner (GP) in England. Having an (almost) complete list like this
from which to choose a sample is ideal, as it is much less likely to systematically exclude
any large groups of the population, though this option is not always available to the
study investigators.
Irrespective of who we invite to participate in a study, it will not necessarily be the case
that all of those selected will agree to participate. This raises an important question—do
the infection rates differ among those who agreed to participate and those who did not?
For example, in some studies (e.g., [7,25] hereationsoflike these on the populationest both
to those who use this information acknowledge their limitations) participants have been
informed of their antibody test results afterward; it is possible that those who have recently
experienced flu-like symptoms would be more likely to seek a test, compared with others
in the population who had not. More generally, agreement to participate in a study could
be influenced by a number of factors that in turn are related to the likelihood of previous
exposure: socioeconomic status, trust in government or the medical profession, and manyInt. J. Environ. Res. Public Health 2021, 18, 4640 7 of 19
others. This issue is known as response bias, and is a common challenge that can influence
the results of epidemiological studies [40–42].
Some of these challenges in sample recruitment can be accounted for in the study
design, however, many cannot. In this case, the usual approach is to carry out an adjust-
ment on the results, in order to reflect what would be obtained from a sample that “looks
like” the population of interest in terms of predetermined characteristics (age, employment
status, employment sector, living arrangements, and so on). There are a number of methods
for doing this [43], and many well-designed studies will carry out some form of adjustment.
However, this is not easy to do well and the reliability of the results depends on choosing
appropriate factors to adjust [44,45]. Similarly, there are statistical methods available to
adjust for bias due to nonresponse, though again care is needed to carry these out appro-
priately [46,47]. An example of sample adjustment can be found in the study [26], which
selected numerous convenience samples of blood specimens that had been collected for
other medical tests as part of routine clinical practice, and used them to estimate seropreva-
lence in each US state at various time points. The samples were adjusted (weighted) so that
the resulting group of patients resembled the overall population of the corresponding US
state, in terms of age, sex, and metropolitan status of their area of residence. While these
factors likely explain some of the differences in exposure risk, there are potentially others
that have not been accounted for—individuals who receive more frequent medical tests
will still be over-represented in the sample, such as those with (multiple) underlying health
conditions or those with better access to healthcare. Thus, while adjustment can address
some of the issues with nonrepresentative samples, it is not a perfect solution.
Ultimately, sample selection is a key challenge that affects nearly all seroprevalence
studies—if the sample differs from the wider population in ways that affect the likelihood
of exposure to the virus, then the estimated seroprevalence may be unreliable.
3.3. Uncertainty from Sampling
No matter how carefully we choose our sample, it is unlikely that the prevalence
of past infection among those sampled will be exactly the same as that of the wider
population—some variation is inevitable due to random chance. Typically, this variation is
measured via the use of interval estimates (e.g., confidence interval and credible intervals).
While many readers will be familiar with these ideas, there is evidence suggesting that they
are widely misunderstood, even by experts [48]. For this reason, we will give a brief and
nontechnical introduction to interval estimates in the context of seroprevalence studies,
clarifying which sources of uncertainty are captured by these estimates, and which are not.
Detailed discussions on the interpretation (and misinterpretation) of these ideas can be
found elsewhere [49,50].
As a motivating example, imagine that the true prevalence of past SARS-CoV-2
infection in the population is 5%, and that we randomly selected a sample of 100 people
from the population. We would not be hugely surprised if the number of people in
the sample previously infected were not exactly 5. It is easy to imagine such a sample
containing 1, 3, 10, or even 12 previously infected people, simply due to chance. Thus in
a seroprevalence study of only 100 people, we could quite easily obtain very inaccurate
estimates of say 1% or 12%, from which we could draw misleading conclusions. In a much
larger sample of say 100,000 people, we still would not expect exactly 5000 (5%) to have
been previously infected. However, finding as few as 1000 or as many as 12,000 would be
extremely unlikely. Thus, as the sample size increases, estimates that are very wrong due
to chance become less likely, and we can be more confident that our results are close to the
true value—provided the sample has been selected appropriately. In fact, based on the
sample size, we can measure uncertainty due to random variation. We can calculate how
far away the estimate (i.e., the prevalence in the sample) could reasonably be from the true
value (the prevalence in the wider population), subject to an acceptable level of uncertainty.
To describe this, results of seroprevalence studies consist of two elements:Int. J. Environ. Res. Public Health 2021, 18, 4640 8 of 19
• A point estimate, i.e., a single “central” or “most likely” value for the percentage of
people who are estimated to have been previously infected.
• An interval estimate, or a range of values surrounding the point estimate. This could
be called a confidence/credible/uncertainty interval. They represent the range in
which we expect the “true” value of prevalence to lie, with a reasonable degree of
certainty, and we consider values outside this interval to be unlikely. Thus, a wider
interval suggests a greater degree of uncertainty compared with a narrow one.
Figure 3 shows some examples of point and interval estimates of prevalence obtained
from two different studies, SCOPI [24] in Ireland and REACT2 [51] in England. These inter-
vals account for uncertainty due to random variation, such as the difference in prevalence
between the sample measured and the wider population. The main factor influencing the
width of an interval estimate is the sample size; studies enrolling larger numbers of people
will result in less uncertainty, i.e., narrower intervals. As such, analyzing and comparing
subgroups of the study population usually results in wider confidence intervals due to
smaller sample sizes. In cases where prevalence estimates are adjusted (for example, so as
Int. J. Environ. Res. Public Health 2021,
to18,ensure
x that the adjusted sample better represents the target population) the width 9 ofof20
interval estimates will also be affected (for example, [43,52]).
Figure3.3. Point
Figure Point and interval estimates
estimates of
ofseroprevalence
seroprevalencefromfromtwo
twostudies, SCOPI[24]
studies,SCOPI [24]inin Ireland
Ireland
andREACT2
and [51] in England. Based
REACT2 [51] Basedon
onaasample
sampleofof913
913people
people inin
Dublin, thethe
Dublin, SCOPI
SCOPI study esti-
study esti-
mated seroprevalence at 3.1%. The corresponding interval estimate indicates that the
mated seroprevalence at 3.1%. The corresponding interval estimate indicates that the true value true value of
seroprevalence in the wider population in Dublin was likely to lie between 2.1% and
of seroprevalence in the wider population in Dublin was likely to lie between 2.1% and 4.5%. By4.5%. By con-
trast, the REACT2 study in England enrolled a large number of participants (ca. 100k), and thus
contrast, the REACT2 study in England enrolled a large number of participants (ca. 100k), and thus
the corresponding confidence interval for seroprevalence is narrow—greater sample sizes give
the corresponding confidence interval for seroprevalence is narrow—greater sample sizes give more
more precise estimates (provided they are indeed representative of the population).
precise estimates (provided they are indeed representative of the population).
Finally,
When it is equally
results important
are reported, to noteisthat
emphasis oftennotplaced
all sources
on theofpoint
uncertainty willand
estimate, be cap-
the
tured in these interval estimates. For example, if the sample of people
width of the corresponding interval estimate is ignored; media coverage of these studies that we have re-
cruited is not representative of the wider population (and we do not adjust
typically reflects this. This is problematic particularly when intervals are wide, as other it accordingly),
then the
values oftrue population
prevalence prevalence
(other than thatcould
givenstillby
bethequite far outside
point estimate)themay
interval. In general,
be likely. For
the validity
example, of any 3,
in Figure interval estimate
the upper end depends on theestimate
of the interval study methodology: design,inrecruit-
for seroprevalence Sligo
ment, collection,
(1.4%) is seven times and analysis.
higher thanSincethat
under real-world
of the conditions,
lower estimate nonewe
(0.2%); of these are likely
can conclude
that seroprevalence in Sligo was likely quite low (below 1.5%) but not zero, though weof
to be perfect, it is prudent to view interval estimates as “best-case scenario” estimates
uncertainty.
cannot be muchThe more
extentcertain
of additional uncertainty
than this. Similarly, notthe
captured
PRECISEby these
studyintervals is often
[25] estimates
a matter of qualitative judgment and should not be overlooked.
seroprevalence for a number of subgroups of hospital workers in Ireland (grouped by
age, sex, ethnicity, location, etc.)—while the point estimates vary considerably between
3.4. The Limitations of Antibody Tests
Like many medical tests, no SARS-CoV-2 antibody test is 100% accurate. There are
two different ways in which we want an antibody test to be accurate—those who have
been previously infected should test positive, and those who have never been infectedInt. J. Environ. Res. Public Health 2021, 18, 4640 9 of 19
groups, sample sizes are small and confidence intervals often overlap. This indicates that
some of these observed differences may have occurred by chance, which should be taken
into account if these estimates are used to inform infection-control strategies in hospitals
or vaccine prioritization. Thus, it is always better to focus on the “plausible range” of
prevalence values implied by a study, rather than focusing on the point estimate alone.
Finally, it is equally important to note that not all sources of uncertainty will be
captured in these interval estimates. For example, if the sample of people that we have
recruited is not representative of the wider population (and we do not adjust it accord-
ingly), then the true population prevalence could still be quite far outside the interval. In
general, the validity of any interval estimate depends on the study methodology: design,
recruitment, collection, and analysis. Since under real-world conditions, none of these are
likely to be perfect, it is prudent to view interval estimates as “best-case scenario” estimates
of uncertainty. The extent of additional uncertainty not captured by these intervals is often
a matter of qualitative judgment and should not be overlooked.
3.4. The Limitations of Antibody Tests
Like many medical tests, no SARS-CoV-2 antibody test is 100% accurate. There are
two different ways in which we want an antibody test to be accurate—those who have
been previously infected should test positive, and those who have never been infected
Int. J. Environ. Res. Public Health 2021, 18, x 10 of 20
should test negative. As such, test accuracy is usually described in terms of two separate
measurements (Figure 4):
• Sensitivity: the proportion of previously infected people who will correctly
collection
test and storage, contamination, laboratory conditions and practices, “cross-reactiv-
positive;
ity”
• of other types of antibody
Specificity: the with
proportion the target antigen,
of never-infected andwho
people many
willothers.
correctly test negative.
Sensitivityand
Figure4.4.Sensitivity
Figure and specificity
specificity of a SARS-CoV-2
SARS-CoV-2antibody
antibodytest.
test.InInaasample
sampleofofpreviously
previously infected
in-
fected people, some will correctly test positive (true positives) while others will incorrectly
people, some will correctly test positive (true positives) while others will incorrectly test negative test
negative (false negatives)—sensitivity
(false negatives)—sensitivity refers
refers to the to the proportion
proportion of previously
of previously infected
infected people who people whotest
correctly
correctly test positive. Similarly, never-infected people may correctly test negative (true nega-
positive. Similarly, never-infected people may correctly test negative (true negatives), or incorrectly
tives), or incorrectly test positive (false positives)—specificity is the proportion of never-infected
test positive (false positives)—specificity is the proportion of never-infected people who correctly
people who correctly test negative.
test negative.
To illustrate these
A “perfect” concepts
test would haveatboth
a cohort level, we
sensitivity andconsider a hypothetical
specificity SARS-CoV-
of 100%. However, false
2positive
antibody test that has 80% sensitivity and 94% specificity. This means that
and false negative results are inevitable when measuring a binary outcome (such
•as presence
If we testversus
100 people whoofhave
absence all previously
SARS-CoV-2 been infected,
antibodies), arising,weforexpect 80 offrom
example, themun-to
test positive.
predictable variations in biological or chemical reactions to blood samples from different
•individuals.
If we test 100 such
When people who
tests arehave never
designed been
there infected,
is often we expect
a tradeoff to be 94 of them
made, tosensi-
in that test
tivity can be increased at the expense of decreased specificity, or vice versa [53]. Separately,
negative.
To see why this matters we imagine an antibody study of 1000 people, 50 of whom
(5%) have previously been infected with SARS-CoV-2. We use this same test with 80%
sensitivity and 94% specificity. The results are broken down in Figure 5. One aspect jumps
out—there are more false positives than true positives, and estimated prevalence (9.7%)Int. J. Environ. Res. Public Health 2021, 18, 4640 10 of 19
there are practical challenges that may conceivably also affect test performance: sample col-
lection and storage, contamination, laboratory conditions and practices, “cross-reactivity”
of other types of antibody with the target antigen, and many others.
To illustrate these concepts at a cohort level, we consider a hypothetical SARS-CoV-2
antibody test that has 80% sensitivity and 94% specificity. This means that
• If we test 100 people who have all previously been infected, we expect 80 of them to
test positive.
• If we test 100 people who have never been infected, we expect 94 of them to test
negative.
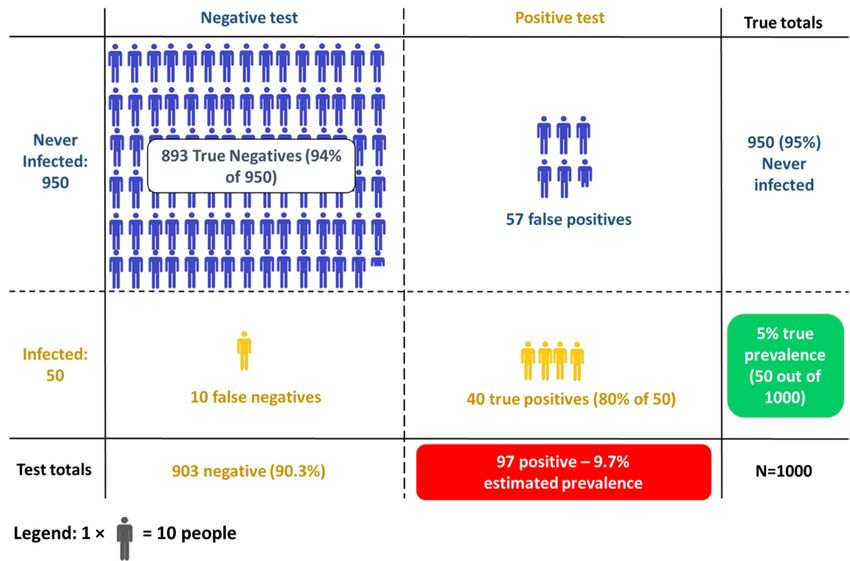
To see why this matters we imagine an antibody study of 1000 people, 50 of whom
(5%) have previously been infected with SARS-CoV-2. We use this same test with 80%
sensitivity and 94% specificity. The results are broken down in Figure 5. One aspect jumps
out—there are more false positives than true positives, and estimated prevalence (9.7%) is
considerably higher than true prevalence (5%). This occurs because:
• Of the 50 people who have been infected, 40 correctly test positive (80% sensitivity)
• x
Int. J. Environ. Res. Public Health 2021, 18, Of the 950 people who have not been infected, 893 correctly test negative (94%11speci-
of 20
ficity), and thus 57 test positive.
Figure 5. The outcome of testing 1000 people, 50 of whom have previously been infected, using an antibody test with 80%
Figure 5. The outcome of testing 1000 people, 50 of whom have previously been infected, using an antibody test with 80%
sensitivity and 94% specificity. The true prevalence is thus 5% (50 out of 1000), while the apparent prevalence, i.e., the
sensitivity and 94% specificity. The true prevalence is thus 5% (50 out of 1000), while the apparent prevalence, i.e., the
proportion of tests that give a positive result, is 9.7%.
proportion of tests that give a positive result, is 9.7%.
The magnitude
Adding of how far
these together wetheseeestimated seroprevalence
that 97 people willpositive,
in total test be from while
the truethepreva-
study
lence depends not only on the test, but also on the true prevalence
contained 50 true cases—thus, our estimate is almost twice the true value. in the population. Table
1 shows Thethe results obtained
magnitude using
of how far thethe same test
estimated as before on awill
seroprevalence sample of 1000
be from people.
the true If
preva-
the true prevalence is 2%, a study like this gives an estimated prevalence
lence depends not only on the test, but also on the true prevalence in the population. of 7.5%, which
isTable
almost four times
1 shows higher—an
the results overestimation
obtained using the same of this magnitude
test as before oncan lead us
a sample ofto very
1000 mis-
people.
leading conclusions. On the other hand, if the true prevalence is 20%, the
If the true prevalence is 2%, a study like this gives an estimated prevalence of 7.5%, which test performs
much better,
is almost with
four an estimate
times higher—anof 20.8% prevalence,of
overestimation which
this may well becan
magnitude “close
leadenough” for
us to very
many purposes.
misleading These examples
conclusions. showhand,
On the other that if
test
theaccuracy can potentially
true prevalence make
is 20%, the testaperforms
big dif-
ference to the estimated prevalence numbers and lead to very misleading
much better, with an estimate of 20.8% prevalence, which may well be “close enough” results in some
cases; when true underlying prevalence is low, tests with high specificity are needed to
obtain useful estimates. In other settings sensitivity may be a greater concern; for example,
in the PRECISE study of healthcare workers, a comparatively high-prevalence population,
obtaining high sensitivity was prioritized [25].
Estimates of the sensitivity of commercially available antibody test kits vary consid-Int. J. Environ. Res. Public Health 2021, 18, 4640 11 of 19
for many purposes. These examples show that test accuracy can potentially make a big
difference to the estimated prevalence numbers and lead to very misleading results in some
cases; when true underlying prevalence is low, tests with high specificity are needed to
obtain useful estimates. In other settings sensitivity may be a greater concern; for example,
in the PRECISE study of healthcare workers, a comparatively high-prevalence population,
obtaining high sensitivity was prioritized [25].
Table 1. Two examples of estimated seroprevalence using a test with sensitivity 80% and specificity 94%.
Example 1: True Prevalence 2% Example 2: True Prevalence 20%
Negative Positive Total Negative Positive Total
Never infected 921 59 980 752 48 800
20 200
Previously
4 16 (2% true 40 160 (20% true
Infected
prevalence) prevalence)
75 208
Total 925 (7.5% estimated 1000 792 (20.8% estimated 1000
prevalence) prevalence)
Estimates of the sensitivity of commercially available antibody test kits vary consider-
ably, with many exhibiting sensitivity below 80% [18,54,55]. Specificity is generally higher,
typically above 95% and in many cases above 98%; however, when true seroprevalence
is low this can still result in many false positives. By comparison when testing for active
infection via RT-pCR, specificity is generally understood to be very high (>99%), while
estimates of sensitivity vary (being highly dependent on swabbing location, technique, and
timing relative to infection) but are almost certainly lower than 95% in clinical practice
(possibly much lower) [13–15]. Thus, false positive RT-pCR tests are relatively rare, with
false negatives more common, while the corresponding rates for antibody tests depend on
the performance of the test kit used and the true underlying population prevalence.
The accuracy of antibody tests was central to the debate surrounding the Santa Clara
seroprevalence study (specifically concerning the potential overestimation of infection
numbers due to false positives), and has arisen in numerous other studies [7,8,56]. These
issues should not be overlooked when studying the spread of infection and developing
related policy; for example, the potential impact of imperfect test accuracy on estimated
seroprevalence should be explored, particularly in cases where the results are surprising.
The antibody test kit used in a seroprevalence study should be chosen with these concerns
in mind (taking into account expected prevalence in the population); otherwise, the results
obtained may be of limited value.
3.5. Challenges When Correcting for Imperfect Test Performance
When faced with imperfect tests in seroprevalence studies, we have two options:
• Accept that this is a limitation of the study, and that the true prevalence might therefore
differ from what was estimated in the study. In this case, we are estimating the
proportion of the population who would test positive, using the same test.
• Try to adjust or correct the results to account for imperfect test accuracy (i.e., attempt to
subtract the false positives and add the false negatives). In this case, we are estimating
the proportion of the population who have SARS-CoV-2 antibodies in their blood.
For example, in a study [34] of healthy blood donors in England, unadjusted sero-
prevalence at the end of September 2020 was estimated at 5.7% (with a confidence interval
of 5.2% to 6.3%), while adjusting for sensitivity and specificity gave an estimate of 6.1%
(confidence interval 5.4% to 6.8%). For most users of seroprevalence studies, the second
approach seems preferable, as it aims to adjust for the problems caused by imperfect test
performance and estimate the true quantity of interest—the prevalence of antibodies. IfInt. J. Environ. Res. Public Health 2021, 18, 4640 12 of 19
only unadjusted results are reported, the reader must assess the extent to which they may
be affected by imperfect test performance.
Correcting or adjusting “apparent prevalence”, that is, converting the proportion of
positive tests to an estimate of “true” seroprevalence, is a simple calculation once test
sensitivity and specificity are known [57]. However, in practice this is rarely the case, as
these parameters also need to be estimated using appropriately designed studies (often
called validation studies), which typically involve testing a number of blood samples
with “known” past COVID-19 infection status, to estimate test sensitivity and specificity.
Validation studies also come with all the challenges of population and sample selection, and
the effects of random variation, which gives rise to uncertainty in the resulting estimates of
sensitivity and specificity. As these parameters are used when calculating (test-adjusted)
seroprevalence, the latter is also affected by this uncertainty. This should be reflected in
the associated (confidence/credible) interval estimates for seroprevalence (though this
may be overlooked in some studies); different approaches are discussed in [57–61]. When
done correctly, adjustments for test accuracy usually result in wider confidence intervals,
compared with the unadjusted results, reflecting the additional unknowns (sensitivity
and specificity) in the calculation. It is important to note that while adjusting for test
performance results in wider interval estimates, the adjustment itself does not increase
uncertainty—these intervals merely acknowledge uncertainty that is already present.
Figure 6 shows estimated sensitivity and specificity, together with associated confi-
dence intervals for three commercially available tests, taken from the US Food and Drug
Administration (FDA) website [62] (Tests A, B and C correspond to Abbott Architect SARS-
CoV-2 IgG, Cellex qSARS-CoV-2 IgG/IgM Rapid Test, and Megna Health Rapid COVID-19
IgM/IgG Combo Test Kit, respectively). One possible reason for the differences in test
performance is the fact that Test A is laboratory-based chemiluminescent microparticle
immunoassay, while B and C are point-of-care LFIAs (which are generally regarded as
less accurate [18,55]). Moreover, the validation studies used to obtain these estimates
were carried out separately, using different samples and study designs, which may also
explain some of the differences in observed test performance. A recent review of studies
evaluating antibody tests noted that many of them were of low quality [55], and therefore
it is quite possible that the intervals in Figure 6 actually underestimate uncertainty, and
any comparison of these estimates between tests should be interpreted with caution. To
account for the possibility of test performance being lower, we have also included a fourth
(hypothetical) test with lower sensitivity and specificity (Test D), for illustrative purposes.
Studies carried out using highly accurate tests (i.e., those with point estimates of
sensitivity and specificity near 100%, and narrow interval estimates for these values) will
give the most precise estimates of seroprevalence in the population, compared to those
using antibody tests with low or uncertain estimates of sensitivity and specificity. These
factors limit how precisely we can estimate true seroprevalence in the population and can
vary considerably between tests. Figure 7 illustrates how this occurs by plotting the results
of 10,000 “simulated” (i.e., random, computer-generated) studies carried out using different
antibody tests. In each simulation, we pick a random sample of size 2500 from a very large
population, in which the true seroprevalence is 10%, and test them using Tests A, B, C, and
D from Figure 6. We then “correct” the results to account for sensitivity and specificity and
estimate the seroprevalence. The prevalence of antibodies in each sample differs randomly
from that of the true population, as do estimated sensitivity and specificity, to account for
what would happen in real-life.may also explain some of the differences in observed test performance. A recent review of
studies evaluating antibody tests noted that many of them were of low quality [55], and
therefore it is quite possible that the intervals in Figure 6 actually underestimate uncer-
tainty, and any comparison of these estimates between tests should be interpreted with
Int. J. Environ. Res. Public Health 2021,caution.
18, 4640 To account for the possibility of test performance being lower, we have also 13 ofin-
19
cluded a fourth (hypothetical) test with lower sensitivity and specificity (Test D), for illus-
trative purposes.
nviron. Res. Public Health 2021, 18, x 14 of 20
and D from Figure 6. We then “correct” the results to account for sensitivity and specificity
and estimate the seroprevalence. The prevalence of antibodies in each sample differs ran-
domly from that of the true population, as do estimated sensitivity and specificity, to ac-
count for what would happen in real-life.
The graphs show the distribution or “spread” of the results from these simulated
studies and illustrate how much these typically differ from the true prevalence of 10%. In
each plot, the horizontal axis represents the estimated prevalence, after adjusting for test
sensitivity and specificity. The height of the bars represents the number of simulated stud-
ies resulting in that particular estimate; thus, if the bars are clustered close together, the
corresponding test is likely to give very precise estimates of seroprevalence that are close
to the true value of 10%. These estimates are centered around the true value of 10% no
matter which test we use. However, those for Test A are typically much closer to the true
value than any of the other tests; this reflects the fact that Test A is both more accurate
(i.e., sensitivityFigure
and specificity
Estimated
6. Estimatedare sensitivity
closer to 100%), and alsoofthat
andspecificity
specificity we
four are more
different certaintests.
antibody about Tests A,and
B, and C
Figure 6. sensitivity and of four different antibody tests. Tests A, B, C are
these values (see Figure
are based 6). Note
on data that with
presented Test
on US D,
theFood even
US Food though we have very precise esti-
based on data presented on the and and
DrugDrug Administration
Administration website
website (for three
(for three different
different
mates of sensitivity and specificity, these values areillustrative
quite low; as a result, estimates of and specificity
commercially available
available tests),
tests), Test
TestDDisisfor
for illustrativepurposes.
purposes.Estimated
Estimatedsensitivity
sensitivity and specific-
seroprevalenceity are quite
for for
TestTest variable.
A are
A are both
both A
high, consequence
high, with
with a high
a high of this
degree
degree is that in
of certainty
of certainty many
(i.e.,
(i.e., situations,
narrow
narrow tests
interval
interval estimates).
estimates). For
For Tests
with low specificity
Tests (e.g.,
B andBC,and less
estimated than
C, estimated or equal
sensitivity to
sensitivity 100% prevalence)
and specificity
and specificity may
are more
are more produce
uncertain,
uncertain, estimates
whilewhile for D
for Test Test D these
these val-
values are
of seroprevalence ues that
are are too
definitely
definitely lower. uncertain
lower. to be of practical use (even when adjustment is
carried out correctly), e.g., [60].
Studies carried out using highly accurate tests (i.e., those with point estimates of sen-
sitivity and specificity near 100%, and narrow interval estimates for these values) will give
the most precise estimates of seroprevalence in the population, compared to those using
antibody tests with low or uncertain estimates of sensitivity and specificity. These factors
limit how precisely we can estimate true seroprevalence in the population and can vary
considerably between tests. Figure 7 illustrates how this occurs by plotting the results of
10,000 “simulated” (i.e., random, computer-generated) studies carried out using different
antibody tests. In each simulation, we pick a random sample of size 2500 from a very large
population, in which the true seroprevalence is 10%, and test them using Tests A, B, C,
Figure 7.ofEstimates
Figure 7. Estimates of seroprevalence
seroprevalence from 10,000 from 10,000studies,
simulated simulated studies,
using using
different different
antibody testsantibody tests results for
and adjusting
and adjusting
imperfect sensitivity results for imperfect
and specificity. sensitivity
Each simulation anda specificity.
selects random sampleEach of
simulation selects a from
2500 participants random
a population with
sample of 2500
an overall prevalence participants
of 10%. The extent from a population
to which estimatedwith an overalldiffers
prevalence prevalence of 10%.
from true The extent
prevalence to
on average depends
which estimated prevalence differs from true prevalence on average depends on the test used—
on the test used—lower and/or more uncertain values of sensitivity and specificity result in more uncertain estimates of
lower and/or more uncertain values of sensitivity and specificity result in more uncertain esti-
prevalence.
mates of prevalence.
The uncertainty just described can be incorporated into interval estimates for sero-
prevalence, though some studies may fail to do so correctly. However, there is potentially
much more uncertainty than the simulations in Figure 7 suggest. Indeed, the confidence
intervals in Figure 6 only capture uncertainty arising from random chance, and simply
reflect the sample size of the validation study—the width of the intervals essentially de-You can also read