Immune responses in COVID-19 respiratory tract and blood reveal mechanisms of disease severity
←
→
Page content transcription
If your browser does not render page correctly, please read the page content below
Immune responses in COVID-19 respiratory tract
and blood reveal mechanisms of disease severity
Wuji Zhang
 University of Melbourne https://orcid.org/0000-0001-7460-4956
Brendon Chua
 University of Melbourne
Kevin Selva
 University of Melbourne
Lukasz Kedzierski
 Peter Doherty Institute for Infection and Immunity
Thomas Ashhurst
 The University of Sydney https://orcid.org/0000-0001-7269-7773
Ebene Haycroft
 University of Melbourne
Suzanne Shoffner
 University of Michigan https://orcid.org/0000-0003-0010-6318
Luca Hensen
 Peter Doherty Institute for Infection and Immunity
David Boyd
 St. Jude Children's Research Hospital
Fiona James
 Austin Hospital
Effie Mouhtouris
 Austin Hospital
Jason Kwong
 Austin Health
Kyra Chua
 Austin Hospital
George Drewett
 Austin Hospital
Ana Copaescu
 Austin Hospital
Julie Dobson
 Austin Hospital
Louise Rowntree
                                                Page 1/34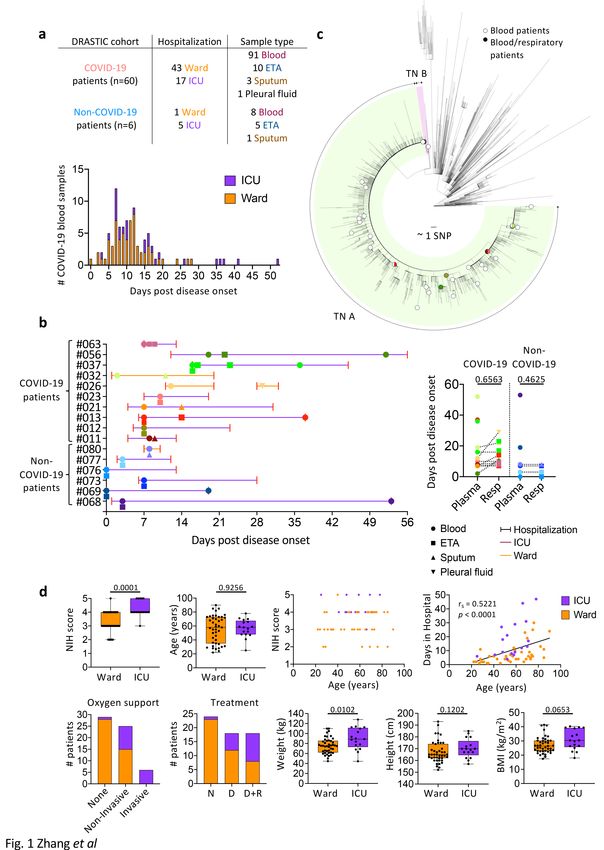
Peter Doherty Institute for Infection and Immunity
Jennifer Habel
 University of Melbourne
Lilith Allen
 University of Melbourne
Hui-Fern Koay
 University of Melbourne https://orcid.org/0000-0002-3236-9609
Jessica Neil
 University of Melbourne
Matthew Gartner
 University of Melbourne
Christina Lee
 University of Michigan https://orcid.org/0000-0002-9393-2178
Patiyan Andersson
 Doherty Institute
Torsten Seemann
 Doherty Institute
Norelle Sherry
 University of Melbourne https://orcid.org/0000-0002-7789-8360
Fatima Amanat
 Icahn School of Medicine at Mount Sina https://orcid.org/0000-0002-8029-8227
Florian Krammer
 Icahn School of Medicine at Mount Sinai https://orcid.org/0000-0003-4121-776X
Sarah Londrigan
 University of Melbourne at the Peter Doherty Institute for Infection and Immunity,
 https://orcid.org/0000-0003-0989-4971
Linda Wakim
 University of Melbourne
Nicholas King
 Charles Perkins Centre, University of Sydney https://orcid.org/0000-0002-3877-9772
Dale Godfrey
 University of Melbourne https://orcid.org/0000-0002-3009-5472
Laura Mackay
 University of Melbourne https://orcid.org/0000-0002-8496-6632
Paul Thomas
 St. Jude Children's Research Hospital https://orcid.org/0000-0001-7955-0256
Suellen Nicholson
 Doherty Institute https://orcid.org/0000-0001-6585-7150
Kelly Arnold

                                                 Page 2/34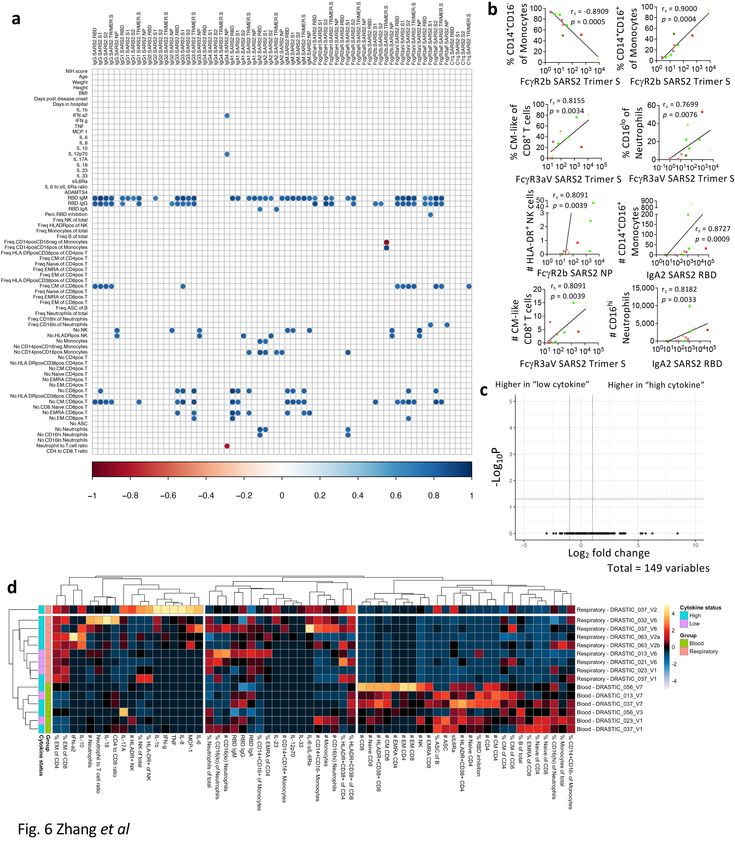
University of Michigan-Ann Arbor https://orcid.org/0000-0003-4756-7461
Amy Chung
University of Melbourne https://orcid.org/0000-0003-0020-9704
Natasha Holmes
Austin Hospital
Olivia Smibert
Austin Hospital
Jason Trubiano
Austin Hospital
Claire Gordon
Austin Hospital
Thi Nguyen
University of Melbourne https://orcid.org/0000-0002-9294-7693
Katherine Kedzierska ( kkedz@unimelb.edu.au )
Department of Microbiology and Immunology, University of Melbourne at the Peter Doherty Institute for
Infection and Immunity, Melbourne, Victoria, Australia https://orcid.org/0000-0001-6141-335X
Article
Keywords: Immune responses, COVID-19, SARS-CoV-2, respiratory immune responses
Posted Date: August 26th, 2021
DOI: https://doi.org/10.21203/rs.3.rs-802084/v1
License: This work is licensed under a Creative Commons Attribution 4.0 International License.
Read Full License
Page 3/34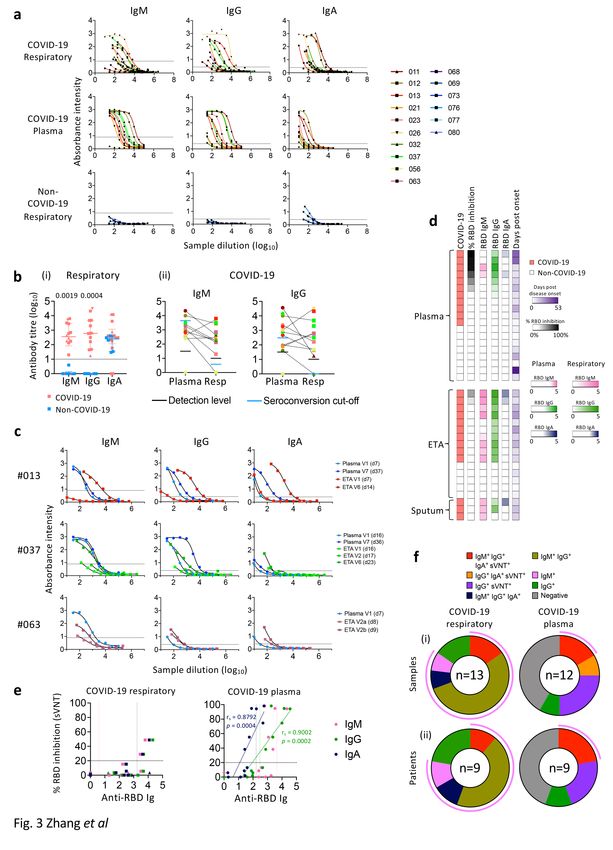
Abstract
Although the respiratory tract is the primary site of SARS-CoV-2 infection and the ensuing
immunopathology, respiratory immune responses are understudied and urgently needed to understand
mechanisms underlying COVID-19 disease pathogenesis. We collected paired longitudinal blood and
respiratory tract samples (endotracheal aspirate, sputum or pleural fluid) from hospitalized COVID-19
patients and non-COVID-19 controls. Cellular, humoral and cytokine responses were analysed and
correlated with clinical data. SARS-CoV-2-specific IgM, IgG and IgA antibodies were detected using ELISA
and multiplex assay in both the respiratory tract and blood of COVID-19 patients, although a higher
receptor binding domain (RBD)-specific IgM and IgG seroconversion level was found in respiratory
specimens. SARS-CoV-2 neutralization activity in respiratory samples was detected only when high levels
of RBD-specific antibodies were present. Strikingly, cytokine/chemokine levels and profiles greatly
differed between respiratory samples and plasma, indicating that inflammation needs to be assessed in
respiratory specimens for the accurate assessment of SARS-CoV-2 immunopathology. Diverse immune
cell subsets were detected in respiratory samples, albeit dominated by neutrophils. Importantly, we also
showed that dexamethasone and/or remdesivir treatment did not affect humoral responses in blood of
COVID-19 patients. Overall, our study unveils stark differences in innate and adaptive immune responses
between respiratory samples and blood and provides important insights into effect of drug therapy on
immune responses in COVID-19 patients.

Introduction
Symptoms of SARS-CoV-2 infection, known as coronavirus disease 2019 (COVID-19), vary from
asymptomatic or mild disease to critical illness, including respiratory failure and death1. Global efforts
focused on developing new drugs and vaccines. While vaccines showed immunogenicity and safety
towards SARS-CoV-22, 3, 4, effects of drug treatments remain controversial. Dexamethasone, a synthetic
glucocorticoid drug, can lower the 28-day mortality rate in COVID-19 patients receiving oxygen support,
prolong ventilator-free days and improve oxygen partial pressure to fractional inspired oxygen
(PaO2/FiO2) ratio compared to placebo or standard care5, 6, 7. However, SARS-CoV-2 RNA can be detected
for longer in patients receiving glucocorticoid treatment8. Treatment with remdesivir, a nucleoside
analogue inhibiting RNA-dependent RNA polymerase (RdRp) in COVID-19 can shorten time to recovery
and provide better clinical outcomes9, 10, 11. However, the effects of dexamethasone and/or remdesivir on
humoral and cellular immune responses are unclear.

Immunity towards SARS-CoV-2 infection has been studied, predominantly in peripheral blood. While
robust, broad and transient immune responses precede patients’ recovery in non-severe cases12, 13, 14, 15,
severe COVID-19 can be associated with exuberant cytokine responses, hyperactivation of innate immune
cells, reduced T-cell numbers12, 14, 16, 17 and high titres of SARS-CoV-2-specific antibodies16. In contrast,
immune responses in the respiratory tract are understudied. High levels of IL-6, IL-10, monocyte
chemoattractant protein (MCP)-1, macrophage inflammatory protein (MIP)-1a and MIP-1b are detected in

                                                   Page 4/34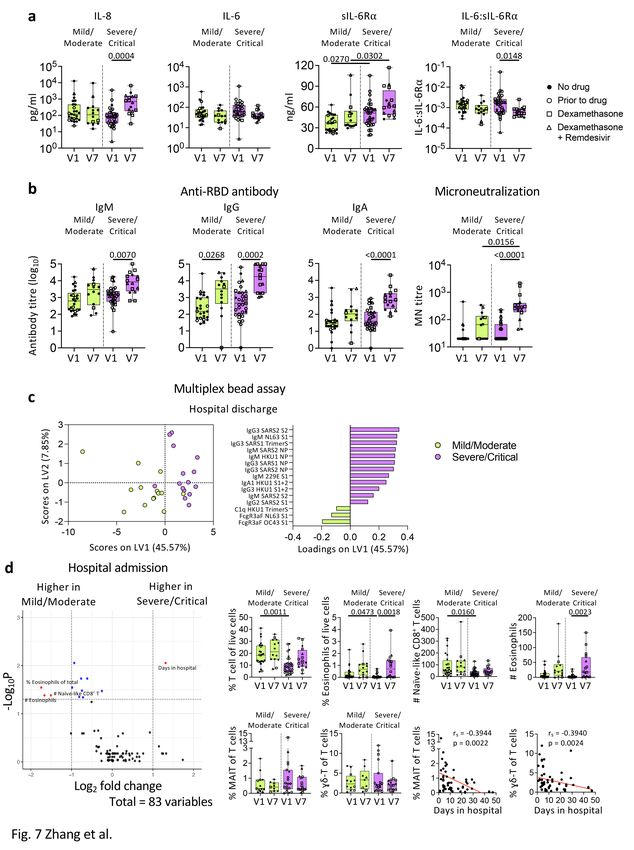
bronchoalveolar lavage fluid (BALF) of COVID-19 patients, indicating inflammatory environment with high
monocyte chemoattractants18, 19. While IFN-a and IFN-b were undetectable, IL-10, IL-17A, IL-18 were
variably detected in COVID-19 BALF, with higher RNA and/or protein levels of IL-6, MCP-1, IL-33 and lower
IL-6 receptor (IL-6R) observed in COVID-19 BALF compared to healthy BALF19, 20. Granulocytes and
monocytes/macrophages dominate in COVID-19 airways, especially intermediate (CD14+CD16+) and
non-classical (CD14−CD16+) monocytes18, 21. Conversely, low frequencies of T-cells were detected in
COVID-19 airways with increased expression of activation markers CD38/HLA-DR and a tissue-resident
phenotype18, 19. Increased frequency of activated T-cells in the airway is associated with improved
survival18.

To dissect the breadth of immune responses during SARS-CoV-2 infection in the respiratory tract
compared to those detected in blood, we collected paired longitudinal blood and respiratory samples
from hospitalised COVID-19 patients and non-COVID-19 controls to investigate innate, adaptive and
humoral immunity. While discordant cytokine levels were detected in respiratory samples across COVID-
19 patients, higher IgM and IgG seroconversion was found in respiratory samples compared to paired
blood. While higher frequencies of neutrophils and effector memory (EM)-like CD4+ and CD8+ T-cells were
found in COVID-19 respiratory samples, higher antibody levels also correlated with activated cellular
immunity. Elevated soluble IL-6R alpha (sIL-6Ra) levels and more robust humoral responses were
detected in blood of patients with severe disease, and importantly, dexamethasone and/or remdesivir
therapy did not reduce immune responses in COVID-19 patients. Overall, our study unveils stark
differences in innate and adaptive immune responses between respiratory and blood samples of COVID-
19 patients and provides insights into potential biomarkers and immunotherapies for severe COVID-19.

Results
DRASTIC patient cohort
We recruited 66 patients hospitalized at Austin Hospital (Victoria, Australia) with suspected COVID-19 into
the preDictoRs of diseAse Severity in criTically Ill COVID-19 (DRASTIC) cohort prior to their PCR result
(Fig. 1a, Supplementary Table 1). Sixty patients had PCR-confirmed SARS-CoV-2 infection, including 43
ward patients (34.9% requiring non-invasive oxygen support) and 17 patients requiring admission to the
ICU (35.3% requiring mechanical ventilation; 58.8% requiring non-invasive oxygen support), while 6
patients were SARS-CoV-2-negative and respiratory IgG RBD ELISA-negative (1 ward; 5 ICU patients;
Supplementary Table 2). 12 ward patients and six ICU patients were on dexamethasone treatment, while
8 ward patients and 10 ICU patients were on dexamethasone (with/without remdesivir) treatment. The
median age of COVID-19 patients was 58 years (range 22–90) and 46.7% were females. The median age
was 58 years within both ward and ICU patients (Supplementary Table 2).

97% of blood samples were collected at hospital admission (Visit 1/V1) or discharge (V7; n = 62 and n =
35 out of 99 blood samples, respectively), with others collected during hospitalization (V2:ICU admission,

                                                 Page 5/34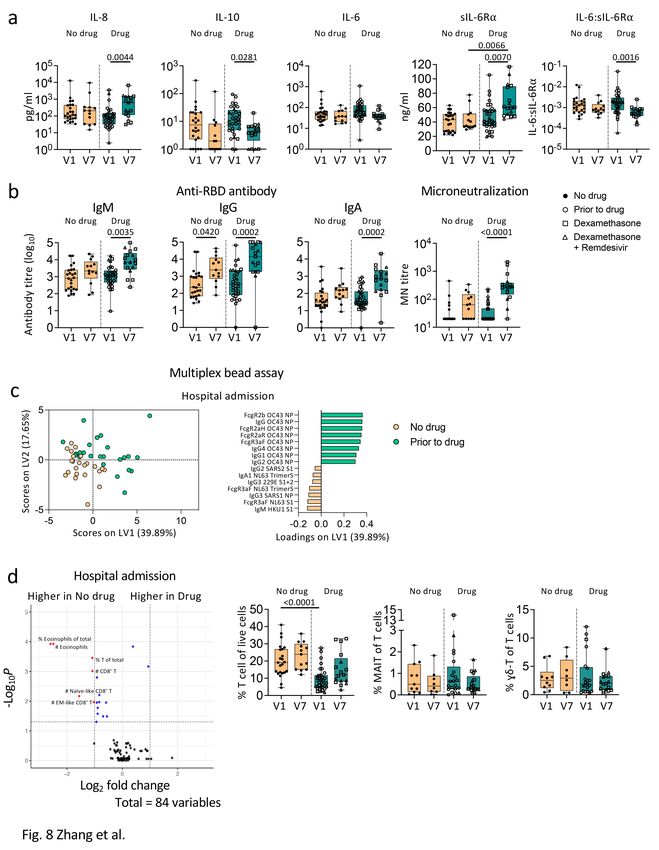
V3:acute respiratory distress syndrome/cytokine release syndrome diagnosis, V5:24–48 hours post drug
therapy, V6:7–14 days post drug therapy). While 83 out of 91 blood samples from 53 COVID-19 patients
were collected within 24 days post disease onset (median 10 days, range 0–24 days) (Fig. 1a), 6 patients
had longer hospital stays (median 32 days, range 26–52 days) (Supplementary Table 1).

Additionally, 20 respiratory samples (15 endotracheal aspirate (ETA), 4 sputum, 1 pleural fluid) were
obtained from 16 DRASTIC patients (10 COVID-19 patients and 6 non-COVID-19 patients) at 0 days
(median) after first blood collection (range 0–9 days), with no significant differences between time of
blood versus respiratory specimen collection (Fig. 1b). The pleural fluid was collected at re-admission
(Fig. 1b). Respiratory samples were obtained from 2 ward COVID-19 patients and 8 ICU COVID-19
patients. While ETA samples were collected from intubated patients, sputum samples were collected from
non-intubated patients. Respiratory samples were also collected from 5 non-COVID-19 hospitalized ICU
patients requiring invasive ventilation and 1 ward patient requiring non-invasive oxygen support (Fig. 1a,
b).

SARS-CoV-2 genome sequence data, available from 41 out of 60 COVID-19 patients, showed that patients
were infected with SARS-CoV-2 viruses belonging to the transmission network (TN)-A, representing a
highly clonal and dominant network during the second wave of COVID-19 epidemic in Victoria22, except
for 1 patient belonging to TN-B (DRASTIC-009) (Fig. 1c).

ICU admission associated with higher NIH severity score,
oxygen therapy, drug treatment and weight
Disease severity within the DRASTIC cohort was stratified according to whether COVID-19 patients were
hospitalized in the ward or ICU. COVID-19 patients were also graded according to the NIH severity score of
1–5 according to their symptoms (Supplementary Table 3). ICU patients had significantly higher NIH
scores compared to ward patients (p = 0.0001, Fig. 1d) and more ICU patients received oxygen support (p
< 0.0001) and drug treatments, either dexamethasone alone or dexamethasone with remdesivir (p =
0.0009) (Supplementary Table 2). Interestingly, ICU patients also had significantly increased body weight
(p = 0.0102). Age correlated with the length of hospital stay (p < 0.0001, Fig. 1d), but no differences in age,
gender, height, ethnicity, immunosuppressant drugs or smoking were observed between ICU and ward
patients (Fig. 1d, Supplementary Table 3).
Inflammatory cytokines in respiratory samples are not
reflective of plasma inflammation
There are scarce data on inflammatory milieu in COVID-19 respiratory specimens. To determine
cytokine/chemokine levels and composition in respiratory samples compared to paired plasma, we
measured cytokines/chemokines (IL-1β, IFN-⍺2, IFN-γ, TNF, MCP-1, IL-6, IL-8, IL-10, IL-12p70, IL-17A, IL-18,
IL-23, IL-33), sIL-6R⍺ and an extracellular matrix protein “disintegrin and metalloproteinase with
thrombospondin motifs-4” (ADAMTS4)23. Cytokine levels varied across both COVID-19 patients in
respiratory samples and between paired respiratory and plasma samples. Five COVID-19 ICU patients
                                                   Page 6/34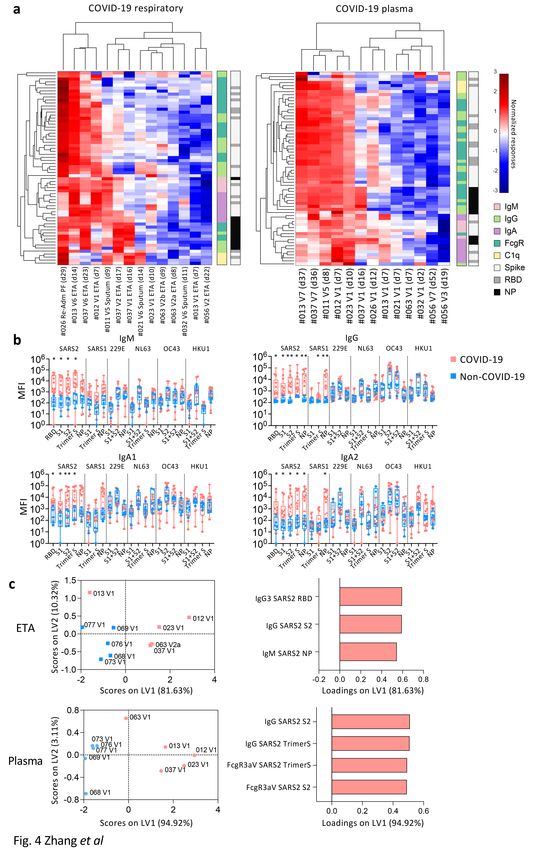
(DRASTIC-011, -012, -013, -021, -023) had no detectable cytokines across 13 cytokines/chemokines, while
high IL-18 levels were detected in plasma of DRASTIC-011, -012, -013- and − 023 patients (Fig. 2a).
Amongst the remaining COVID-19 patients, greatly elevated levels of inflammatory cytokines/chemokines
were detected in respiratory samples, with concentrations being 60× (MCP-1), 400× (IL-6) and 780× (IL-8)
higher than in plasma for DRASTIC-032, -037, -056, -063. While IL-18 dominated in plasma, IL-6, IL-8 and
MCP-1 were most prevalent in respiratory samples in patients with high cytokines/chemokines (Fig. 2a,
Supplementary Fig. 1a).

This disparity was also reflected when cytokine and sIL-6R⍺ levels were standardized separately for
respiratory and plasma samples. With the red color indicating higher cytokine levels, donors with high
cytokine concentration in the respiratory samples did not necessarily display high levels of the same
cytokine in their plasma (Fig. 2b). For instance, patient DRASTIC-063 displayed higher IFN-⍺2, IL-10, IL-
12p70 and IL-17A in ETA (d8) than other COVID-19 respiratory samples, while the plasma (d7) level of
IFN-⍺2 was also higher, DRASTIC-063 had higher plasma level of IL-18 but not IL-10, IL-12p70 or IL-17A
(Fig. 2b).

In contrast, respiratory samples from non-COVID-19 ICU patients showed significantly higher levels of
several cytokines, including IL-6, IL-6:sIL-6Ra ratio, IL-1b, IL-8, IL-10, IL-18, IL-23, TNF, MCP-1 compared to
matched plasma samples (7-440× higher) (Fig. 2a, Supplementary Fig. 1b), reflecting consistent levels of
those cytokines across non-COVID-19 ICU patients. sIL-6R⍺ in non-COVID-19 respiratory samples was
lower compared to plasma, while comparable to COVID-19 respiratory samples (Supplementary Fig. 1b).

Overall, while the inflammatory cytokine/chemokine levels were excessively higher in respiratory fluid
compared to plasma in some COVID-19 patients, they were highly variable across COVID-19 patients,
indicating that the plasma inflammatory milieu does not reflect the airway inflammation and that
hospitalized/ICU COVID-19 patients should be monitored for inflammation in airways to understand
disease severity and potential benefits of immunomodulatory treatments.

High RBD-specific IgM and IgG seroconversion in COVID-19
respiratory samples
SARS-CoV-2-specific antibodies in respiratory samples are relatively unexplored. We measured SARS-CoV-
2 RBD-specific IgM, IgG and IgA antibodies in paired respiratory and blood samples using RBD-ELISA and
surrogate virus neutralisation test (sVNT) (Fig. 3). Compared to non-COVID-19, COVID-19 patients
displayed higher levels of RBD IgM (p = 0.0019) and IgG (p = 0.0004) in respiratory samples (Fig. 3a, b),
but not RBD IgA levels, which was possibly due to either technical issues or cross-reactivity of IgA
antibodies (Fig. 3bi). Moreover, comparable titres of RBD IgM and IgG were found in COVID-19 respiratory
samples and plasma (Fig. 3bii). In 3 DRASTIC patients (-013, -037, -063) with sequential ETAs collected,
RBD-specific IgM, IgG, and IgA antibody titres increased in both plasma and ETA samples over time
(Fig. 3c).

                                                   Page 7/34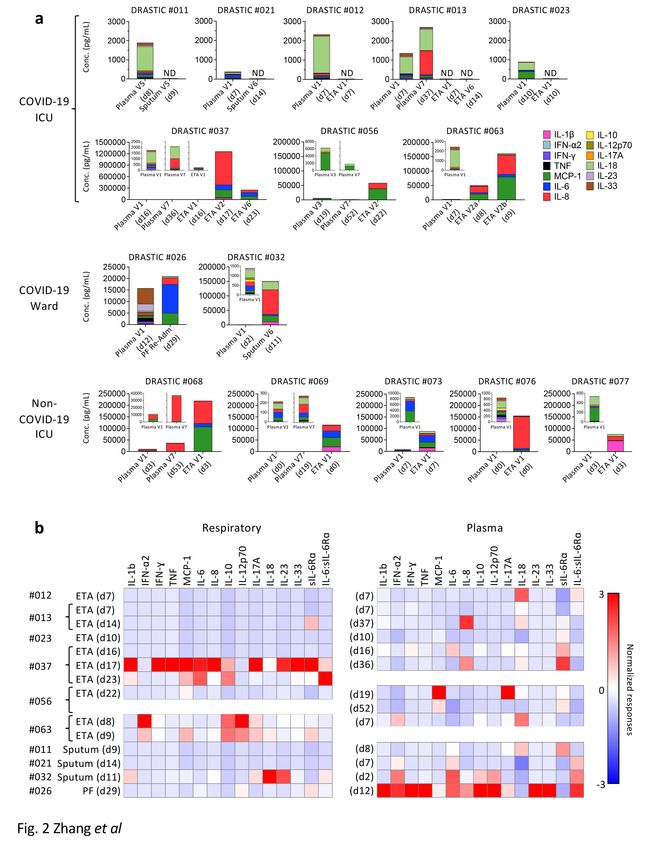
Using sVNT, two ETA samples from DRASTIC-012 and − 013 (with low cytokine levels) had detectable
neutralizing activity, associated with high levels of RBD-specific IgM, IgG, and IgA antibodies (Fig. 3d, e).
Neutralizing activity was not detected in the remaining respiratory samples at the acute time-points.
Plasma samples with high neutralizing activity had high levels of all three IgM, IgG and IgA isotypes of
RBD-specific antibodies, and anti-RBD IgG and IgA positively correlated with the neutralizing activity (p =
0.0002; p = 0.0004 respectively, Fig. 3d, e). Seroconverted levels of RBD-specific IgM and IgG antibodies
were detected in the majority of COVID-19 respiratory samples (10/13) and patients (6/9) at 77% and
67% (Fig. 3f), suggesting prominence of RBD-specific IgM and IgG in respiratory samples during acute
COVID-19.

High prevalence of SARS-CoV-2-NP-specific IgM antibodies
in respiratory samples
While anti-RBD antibodies are essential for the neutralization of SARS-CoV-224, non-neutralizing
antibodies are important role in antiviral immunity25. To understand in-depth antibody profiles and cross-
reactivity in respiratory samples, we adapted a multiplex bead array assay25 (Supplementary Table 5).
Antibodies targeting RBD, S proteins, NP of SARS-CoV-2, SARS-CoV-1 and human coronaviruses (229E,
NL63, OC43, HKU1) along with isotypes/subclasses (IgM, IgG, IgG1-4, IgA1-2), binding with FcgR
(FcgR2aH, FcgR2aR, FcgR2b, FcgR3aV, FcgR3aF) and C1q, totaling 315 features, were assessed in 14
COVID-19 and 5 non-COVID-19 respiratory samples, and paired plasma. Intermediate to high antibody
levels across different SARS-CoV-2 antigens and isotypes were detected in a subset of COVID-19
respiratory and plasma samples (Fig. 4a), especially in patients who lacked inflammatory cytokines in
their respiratory samples (DRASTIC-011, -012, -013, -021, -023). Conversely, patients with low anti-SARS-
CoV-2 antibodies (DRASTIC-032, -056, -063) could still have variable antibody responses towards other
human coronavirus in plasma and/or respiratory samples (Supplementary Fig. 2a).

When comparing COVID-19 and non-COVID-19 respiratory samples, high levels of SARS-CoV-2-specific
IgM, IgG, IgA1 and IgA2 were detected in COVID-19 (Fig. 4b). While low level SARS-CoV-1 IgG and IgA2
levels were detected, no significant differences in antibodies against other human coronaviruses (229E,
NL63, OC43, HKU1) were found (Fig. 4b). IgG1 and IgG3 were the most prominent subclasses
(Supplementary Fig. 2b). SARS-CoV-2 antibodies with FcgR binding abilities were detected at low levels in
COVID-19 respiratory samples (Supplementary Fig. 2b).

To investigate the most prominent antibody features different between COVID-19 and non-COVID-19
patients, Partial Least-Squares Discriminant Analysis (PLSDA) was performed (Fig. 4c). As few as 3
antibody features were sufficient to separate COVID-19 and non-COVID-19 ETA, with higher SARS-CoV-2-
specific IgG and IgM in COVID-19 ETA, consistent with higher anti-RBD IgG and IgM in ELISA (Fig. 3b, 4c).
In contrast, higher SARS-CoV-2-S-specific IgG antibodies and antibodies with FcgR binding activities were
strongly featured in COVID-19 plasma compared to non-COVID-19 plasma (Fig. 4c).

                                                   Page 8/34
Overall, high anti-SARS-CoV-2 antibodies were detected in COVID-19 airways. While anti-SARS-CoV-2 IgM
and IgG were prominent in COVID-19 airways, anti-SARS-CoV-2 antibodies with FcgR binding activities
were more prevalent in COVID-19 plasma.
Increasing cellular infiltrates in respiratory specimens
during disease progression
To determine cellular immunity in respiratory specimens of COVID-19 patients, samples underwent multi-
parameter flow cytometry and analysis using the Spectre R package26. Cells were clustered using Flow
Self-Organizing Map (FlowSOM)27 and plotted using Fast Interpolation-based t-distributed Stochastic
Neighbour Embedding (FIt-SNE)28. Two flow cytometry panels were used to ensure accurate profiling of
myeloid and lymphoid cell populations (Supplementary Fig. 3a, 4a, 4b, Supplementary Table 6).
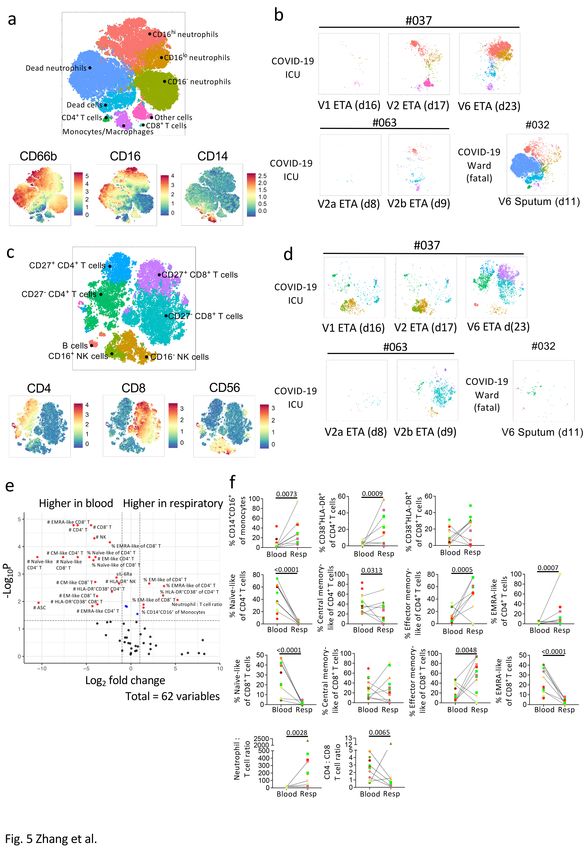
Clustering of respiratory samples in the myeloid panel revealed that CD66b+neutrophils dominated, with
varying levels of CD16 expression (Fig. 5a). CD14+macrophages and CD4+ and CD8+ T-cells were also
detected but at lower frequencies. While the cellular component was variable across samples, CD16hi and
CD16lo neutrophils were present in all COVID-19 patients apart from DRASTIC-056 (BMT recipient; Fig. 5a,
Supplementary Fig. 4c). Although there were only two COVID-19 patients (DRASTIC-037, -063) with
multiple ETA samples, we still observed an increase in cellular infiltrates was detected over time, including
CD16lo neutrophils (Fig. 5b). In the respiratory specimens of 6 non-COVID-19 patients, lower levels of
neutrophils and macrophages were detected (Supplementary Fig. 4c). DRASTIC-073 had a large
population of CD16− neutrophils, while a high frequency of CD16loneutrophils was detected in blood,
indicating a dominant immature neutrophil population in this patient (Supplementary Fig. 4c, e).
After excluding neutrophils and monocytes/macrophages in respiratory samples, CD8+ T-cells were the
major population of lymphocytes, with varying levels of CD4+ T-cells and natural killer (NK) cells (Fig. 5c,
Supplementary Fig. 4d). Increasing infiltrates of T-cells over time were found in patients 037 and 063
(Fig. 5d), similar to neutrophils. Interestingly, in patient 037, the lymphocyte population was dominated by
NK cells early (V1 and V2) and T-cells gradually infiltrated and dominated over time (V6). Low lymphocyte
levels were detected in fatal patient-032.
A volcano plot was generated to determine fold-differences in immunological features between
respiratory and plasma samples (Fig. 5e, f). While cell numbers were higher in blood, higher frequencies
of intermediate (CD14+CD16+) monocytes/macrophages, activated (HLADR+CD38+) and EM-like
(CD27−CD45RA−) CD4+ and CD8+ T-cells were found in COVID-19 respiratory specimens compared to
blood. Respiratory specimens had higher neutrophil to T-cell ratio (Fig. 5f). Conversely, the ratio of CD4+
to CD8+ T-cells was lower in respiratory samples (p = 0.0065), indicating high prevalence of CD8+ T-cells
in respiratory specimens (Fig. 5f).
Overall, neutrophils (CD16+/−) dominated in the respiratory samples of COVID-19 patients, with varying
levels of monocytes/macrophages, T-cells (CD4+ and CD8+), NK cells, and B cells. T cells in the
Page 9/34respiratory samples exhibited an activated and EM-like phenotype compared to paired blood samples,
with lower CD4+ to CD8+ T-cell ratio.
Respiratory antibody levels correlated with CD14+CD16+
monocytes, HLA-DR+ NK and CM/EM-like CD8+ T cells
To understand associations between immunological features in the respiratory specimens, correlations
between plasma (cytokines, sIL-6R⍺, ADAMTS4, anti-RBD IgM, IgG, IgA) and cellular features were
performed (Fig. 6a, b). Lower classical (CD14+CD16−) monocytes and higher intermediate (CD14+CD16+)
monocytes correlated with higher FcγR2b SARS-CoV-2-Trimer-S-specific antibodies (p = 0.0005; p =
0.0004). Higher SARS-CoV-2-specific antibodies correlated with frequencies of (CM)-like (CD27+CD45RA−)
and CD16loneutrophils (p = 0.0034; p = 0.0076). Numbers of intermediate (CD14+CD16+) monocytes, HLA-
DR+ NK, CD8+ T-cells (CM-like; EM-like) and CD16hineutrophils correlated with antibody levels (p =
0.0009–0.0039). Although cytokine profiles varied across COVID-19 respiratory samples, no significant
differences were found in their cellular immunity (Fig. 6c). Unsupervised clustering also revealed distinct
immunological features between respiratory and blood samples, with higher EM-like CD4+ and CD8+ T-cell
frequencies and lower cell numbers (apart from neutrophils) in the respiratory samples (Fig. 6d).
COVID-19 patients with higher NIH scores had more robust
humoral immune responses
More patients with higher 4–5 NIH scores required ICU during hospitalization (Fig. 1d), while NIH scores
of 2–3 were in the mild/moderate group. Although there were no differences in the overall
cytokines/chemokines levels between the two NIH severity groups, IL-8 levels in the severe/critical group
increased at discharge (V7) compared to admission (V1) (p = 0.0004; Fig. 7a), indicating delayed or
prolonged innate immune activation. Levels of sIL-6R⍺ were significantly higher in the severe/critical
group than the mild/moderate group at both V1 (p = 0.027) and V7 (p = 0.0302), with the severe/critical
group having higher sIL-6R⍺ and lower IL-6:sIL-6R⍺ ratio at V7 than V1 (Fig. 7a).
Anti-RBD IgG titres increased in both severity groups at discharge (p = 0.0268; p = 0.0002; Fig. 7b). The
severe/critical group also displayed substantially higher microneutralization (MN) activity at discharge
compared to admission (p < 0.0001). PLSDA revealed that at discharge the severe/critical group had
higher IgM and IgG antibodies targeting SARS-CoV-2 proteins compared to the mild/moderate group
(Fig. 7c).
COVID-19 patients in the severe/critical group had comparable frequencies of immune cells, while they
had lower T-cell and eosinophil frequencies (p = 0.0011; p = 0.0473) than the mild/moderate group at
admission (V1; Fig. 7d). Interestingly, frequencies of mucosal associated invariant T (MAIT) cells and ɣδ
T-cells negatively correlated with days stayed in hospital (p = 0.0022 and p = 0.0024 respectively; Fig. 7d).
Page 10/34Overall, while cytokine levels were similar between the two severity groups, patients with more severe
symptoms had more robust antibody responses towards the SARS-CoV-2.
Dexamethasone did not alter immune responses in COVID-
19 patients
Effects of dexamethasone, corticosteroid anti-inflammatory drug, with/without remdesivir on immune
responses are unclear. We found very few differences in immune profiles between patients with/without
dexamethasone. IL-8 and sIL-6Ra levels at discharge were significantly higher than at admission in the
dexamethasone (with/without remdesivir) group, but similar levels were observed without treatment
(Fig. 8a). Patients on treatment had lower anti-inflammatory IL-10 levels at discharge (p = 0.0281;
Fig. 8a). Conversely, humoral responses of patients receiving drugs were not compromised. Patients
receiving dexamethasone (with/without remdesivir) generated robust SARS-CoV-2-specific antibody
responses (Fig. 8b). Given that 29/33 severe/critical patients were on treatment, compared to 7/27
mild/moderate patients, high antibody levels in the drug group were likely due to disease severity rather
than drug treatment. PLSDA revealed that patients prior to drug therapy had higher antibodies against the
NP of human coronavirus OC43 rather than SARS-CoV-2 (Fig. 8c). No significant differences were found
in cellular responses, apart from lower T-cell frequency in the drug group (Fig. 8d).
Discussion
Immunity to SARS-CoV-2 in the respiratory tract, the primary site of infection, is incompletely understood.
We found discordant inflammatory status in the respiratory tract of COVID-19 patients, whereas non-
COVID-19 hospitalized patients had consistently high respiratory cytokine levels. While high SARS-CoV-2-
specific IgG and IgM were detected in COVID-19 respiratory samples, IgG with FcγR binding profiles were
more prominent in blood. We found higher frequencies of neutrophils, intermediate
CD14+CD16+monocytes, activated HLA-DR+CD38+, EM-like CD4+ and CD8+ T-cells in COVID-19 respiratory
compared to blood samples, and similar immune responses with dexamethasone (with/without
remdesivir) treatment.
High levels of cytokines are commonly found in blood of COVID-19 patients29, 30, 31, 32. In respiratory
samples, variable cytokine levels (IL-10, IL-17A, IL-18) were detected, while monocyte chemoattractants
(MCP-1, MIP-1a, MIP-1b) and innate cytokines (IL-6, IL-10) were at high levels18, 19. We found
hypercytokinemia in respiratory samples compared to blood, but only in selected COVID-19 patients with
high IL-6, IL-8, and MCP-1, indicating an inflammatory environment that attracts leukocytes, including
neutrophils and monocytes33, 34. Since most patients did not have similar cytokine profiles in blood and
respiratory samples, thus measuring both blood and respiratory inflammation might be needed to
accurately determine the inflammatory status of the patients.
SARS-CoV-2-specific IgG and IgA were detected previously in BALF, sputum and saliva of COVID-19
patients35, 36, 37. We found detectable anti-RBD IgM, IgA and IgG in COVID-19 respiratory samples, with
Page 11/34higher IgM and IgG than non-COVID-19 respiratory samples. Although only two COVID-19 ETAs had
detectable neutralizing activity, both samples had high levels of anti-RBD IgM, IgG, and IgA. While most
attention focused on IgA at mucosal surfaces, SARS-CoV-2-specific IgM also was detected in sputum,
BALF and saliva from severely-ill COVID-19 patients35, 37. Unlike IgAs38, anti-RBD IgM in saliva of COVID-
19 patients strongly correlated with serum levels37. As IgM might affect the immunopathology in the
respiratory tract, this warrants further investigations.
Similar to previous studies, neutrophils dominated in COVID-19 respiratory samples21. Longitudinal ETA
samples indicated increases in cellular infiltrates during disease progression, while presence of CD16lo
neutrophils showed recruitment of immature neutrophils likely derived from emergency myelopoiesis in
bone marrow39. RNA-sequencing of COVID-19 BALF neutrophils found similar immature states40. Higher
frequencies of intermediate CD14+CD16+ monocytes and activated CD38+HLA-DR+CD4+ T-cells in
respiratory samples reveal activated signatures in the respiratory tract. Although low in frequency, high
activated respiratory T-cells are associated with improved survival in COVID-1918.
As an anti-inflammatory drug, dexamethasone can reduce proinflammatory cytokines including IL-6 and
IL-841, 42. We found no significant difference in cytokine/chemokine levels between COVID-19 patients
receiving dexamethasone and untreated patients. Although it has been speculated that dexamethasone
can reduce the ability of antibody production in B cells43, we showed similar antibody levels in patients
receiving dexamethasone. Therefore, severely-ill COVID-19 patients might benefit from dexamethasone
treatment as reported5, 6, 7, and such treatment does not dampen humoral immunity.
There are limitations to the current study. Firstly, ETA samples were only collected from patients with
severe disease requiring invasive oxygen support, therefore, it is unclear whether COVID-19 patients with
milder symptoms had less robust immune responses in the respiratory tract. Additionally, most patients
in the severe/critical group received dexamethasone, which could be an intercorrelating factor for the
differences observed between severity groups. Moreover, while the non-COVID-19 controls provided
insights onto the immune status in hospitalized individuals, the comparisons will benefit more if there
were larger numbers of non-COVID patients with more homogenous diseases.
Overall, innate and adaptive immune responses are generated in respiratory and blood samples of COVID-
19 patients. While immunological features detected in the peripheral blood can be associated with robust
immune responses and predict clinical outcomes, monitoring immune responses in the respiratory
samples can be of a benefit prior to initiation of therapeutic interventions for COVID-19 patients.
Declarations
ACKNOWLEDGMENTS
We acknowledge all DRASTIC (The use of cytokines as a preDictoR of disease Severity in criTically Ill
COVID-19) investigators from Austin Health, and thank the participants involved. We acknowledge
Page 12/34Francesca L. Mordant and Kanta Subbarao for their contributions to the microneutralization assay. We
acknowledge Adam K. Wheatley for kindly providing SARS-CoV-2 and HKU-1 spike trimers and Bruce D.
Wines and P. Mark Hogarth for kindly providing FcγR dimers. The RBD proteins were produced under
HHSN272201400008C and obtained through BEI Resources, NIAID, NIH: Spike Glycoprotein RBD from
SARS-Related Coronavirus 2, Wuhan-Hu-1 with C-Terminal Histidine Tag, Recombinant from HEK293F
Cells, NR-52366. We thank the staff at the diagnostic microbiology laboratories at Austin Pathology,
Melbourne Pathology, Dorevitch Pathology, 4Cyte Pathology, Microbiological Diagnostic Unit Public
Health Laboratory, Northern Pathology Victoria, Eastern Health Pathology for performing initial diagnostic
testing for the detection of SARS-CoV-2 nucleic acid. This work was supported by the NHMRC Leadership
Investigator Grant to KK (#1173871), Research Grants Council of the Hong Kong Special Administrative
Region, China (#T11-712/19-N) to KK, the MRFF Award (#1202445) to KK and AWC, NIH contract CIVC-
HRP (HHS-NIH-NIAID-BAA2018) to PGT and KK, NHMRC Senior Principal Research Fellowship
(#1117766) to DIG, NHMRC Emerging Leadership Level 1 Investigator Grant to THON (#1194036) and
NHMRC Early Career Fellowships to HFK (#1160333), CLG (#1160963) and JAT (#1139902). WZ and
JRH are supported by the Melbourne Research Scholarship from The University of Melbourne. LH is
supported by the Melbourne International Research Scholarship (MIRS) and the Melbourne International
Fee Remission Scholarship (MIFRS) from The University of Melbourne. We acknowledge the Melbourne
Cytometry Platform (Peter Doherty Institute and Melbourne Brain Centre nodes) for provision of flow
cytometry services. PGT is supported by NIH NIAID R01 AI136514-03 and ALSAC at St. Jude.
AUTHOR CONTRIBUTIONS
KK, THON, CLG and JAT supervised the study. KK, THON, CLG, JAT, WZ, BYC, KJS, LK, HFK, SN and AWC
designed the experiments. WZ, BYC, KJS, LK, ERH, LH, LCR, JRH, LFA, HFK, JAN, MG, SN and THON
performed and analysed experiments. WZ, TMA, SKS, CYL, PA, TS, NLS, and KBA analysed data. DFB, FA,
FK and PGT provided reagents. FJ, EM, JK, KYLC, GD, AC, JED, NEH, OCS, JAT, CLG recruited the patient
cohorts and provided clinical data. WZ, SLL, LMW, NJCK, DIG, LKM, PGT, SN, KBA, AWC, JAT, CLG, THON
and KK provided intellectual input into the study design and data interpretation. WZ, THON and KK wrote
the manuscript. All authors reviewed and approved the manuscript.
Declaration of Interests
The authors declare no competing interests.
Methods
DRASTIC study participants and specimens. We enrolled 60 SARS-CoV-2 PCR-positive patients admitted
to Austin Health (Victoria, Australia) and six PCR-negative patients as negative serological controls. Two
COVID-19 patients and three SARS-CoV-2 PCR-negative patients died during the study. Peripheral blood
was collected in heparinized or ethylenediaminetetraacetic acid (EDTA) tubes during hospitalization.
Peripheral blood monocular cells (PBMCs) were isolated via Ficoll-Paque separation. Single cell
Page 13/34suspensions were isolated from tissues as previously described44, 45. ETA samples were obtained as part
of routine suctioning of the endotracheal tube airway and involved the passage of a catheter for
suctioning into a sterile sputum trap. Sputum samples were spontaneously collected into a sterile
container. Pleural fluid was collected by thoracentesis as part of a routine procedure. The thoracentesis
involved percutaneous insertion of a catheter into the pleural space and collection of pleural fluid into a
sterile container. Demographic, clinical and sampling information for COVID-19 patients are described in
Supplementary Table 1.
Ethics statement. Experiments conformed to the Declaration of Helsinki Principles and the Australian
National Health and Medical Research Council Code of Practice. Written informed consent was obtained
from all blood donors prior to the study. The study was approved by the Austin Health
(HREC/63201/Austin-2020) and the University of Melbourne (#2057366.1, #2056901.1 and #1955465.3)
Human Research Ethics Committees.
Genomic sequencing and bioinformatic analysis. Extracted RNA from RT-PCR positive samples
underwent tiled amplicon PCR and Illumina short-read sequencing, quality control, consensus sequence
generation and alignment as previously described46. A single sequence per patient was used for
phylogenetic analysis22, with a maximum-likelihood phylogenetic tree generated using IQ-Tree47 and
visualized using the ggtree package in R48. Genomic clusters were defined using a hierarchical clustering
algorithm; genomic transmission networks grouped multiple clusters supported by epidemiological and
genomic data.
Phenotypic whole blood immune analyses. Fresh whole blood (200μl per stain) was used to measure
CD4+CXCR5+ICOS +PD1+ follicular T cells (Tfh) and CD3-CD19+CD27hiCD38hi antibody-secreting B cell
(ASC; plasmablast) populations as described15, 49 as well as activated HLA-DR+CD38+CD8+ and HLA-
DR+CD38+CD4+ T cells, intermediate CD14+CD16+ and classical CD14+ monocytes, activated CD3-CD56+
NK cells, MAIT cells, ɣδ-T cells, as per the specific antibody panels (Supplementary Table 6; gating
strategy is presented in Supplementary Fig. 4b, c). After whole blood was stained for 20 minutes at room
temperature in the dark, samples were lysed with BD FACS Lysing solution, washed and fixed with 1%
PFA. AccuCheck Counting Beads (Thermo Fisher Scientific) were added for calculating absolute numbers
just prior to acquisition. All samples were acquired on a LSRII Fortessa (BD). Flow cytometry data were
analyzed using FlowJo v10 software.
Phenotypic immune analyses in respiratory samples. Respiratory samples (ETA, sputum, or pleural fluid)
were diluted in PBS and centrifuged. Supernatant was collected and the pellet was filtered through a
45μm filter prior to separation of respiratory fluid and cellular contents. The respiratory fluid was frozen at
-20ºC, and the cell pellet was washed with EDTA-BSS. Washed cells were stained with FcR block (Miltenyi
Biotec) for 15 minutes followed by 30 minutes staining on ice with specific antibody panels
(Supplementary Table 6). After fixing with 1% PFA, the samples were acquired on a LSRII Fortessa (BD).
AccuCheck Counting Beads were added for calculating absolute numbers just prior to acquisition. Flow
cytometry data were analyzed using FlowJo v10 software.
Page 14/34SARS-CoV-2 RBD ELISA. RBD-specific ELISA for detection of IgM, IgG and IgA antibodies was performed
as previously described31, 50, 51, using flat bottom Nunc MaxiSorp 96-well plates (Thermo Fisher
Scientific) for antigen coating (2µg/ml), blocking with PBS (with w/v 1% BSA) and serial dilutions in PBS
(with v/v 0.05% Tween and w/v 0.5% BSA). Inter- and intra-experimental measurements were normalised
using a positive control plasma from a COVID-19 patient run on each plate. Endpoint titres were
determined by interpolation from a sigmodial curve fit (all R-squared values >0.95; GraphPad Prism 9) as
the reciprocal dilution of plasma that produced >15% (for IgA and IgG) or >30% (for IgM) absorbance of
the positive control at a 1:31.6 (IgG and IgM) or 1:10 dilution (IgA). Seroconversion was defined when
titres were above the mean titre (plus 2 standard deviations) of non-COVID-19 control respiratory or
plasma samples.
Microneutralization assay. Microneutralization activity of serum samples was assessed as previously
described52. SARS-CoV-2 isolate CoV/Australia/VIC01/202053 was propagated in Vero cells and stored at
-80°C. Sera were heat-inactivated at 56°C for 30 min and serially diluted. Residual virus infectivity in the
serum/virus mixtures was assessed in quadruplicate wells of Vero cells incubated in serum-free media
containing 1μg/ml of TPCK trypsin at 37°C and 5% CO2. Viral cytopathic effect was read on day 5. The
neutralizing antibody titer was calculated using the Reed-Muench method52.
SARS-CoV-2 surrogate virus neutralisation test (sVNT). The plasma samples were tested in neat, and the
respiratory samples were tested at 1:9 dilution or at their original dilutions for more diluted samples. The
sVNT blocking ELISA assay (manufactured by GenScript, NJ, USA) was carried out essentially as
described51, which detects circulating neutralizing SARS-CoV-2 antibodies that block the interaction
between RBD and ACE2 on the cell surface receptor of the host. HRP-conjugated recombinant SARS-CoV-
2 RBD fragment bound to any circulating neutralizing antibodies to RBD preventing capture by the human
ACE2 protein in the well, which was subsequently removed in the following wash step. Substrate reaction
incubation time was 20 mins at room temperature and results were read spectrophotometrically. Colour
intensity was inversely dependent on the titre of anti-SARS-CoV-2 neutralizing antibodies.
Coupling of carboxylated beads. As previously described25, a custom multiplex bead array was designed
and coupled with SARS-CoV-2 spike 1 (Sino Biological), spike 2 (ACRO Biosystems), RBD (BEI Resources)
and nucleoprotein (ACRO Biosystems), as well as SARS and hCoV (229E, NL63, HKU1, OC43) spikes and
nucleoproteins (Sino Biological) (Supplementary Fig. 5). In addition, SARS-CoV-2 and HKU-1 spike trimers
(kind gifts from Adam K. Wheatley), as well as SARS-CoV and NL63 spike trimers (BPS Bioscience) were
also coupled. Tetanus toxoid (Sigma-Aldrich), influenza hemagglutinin (H1Cal2009; Sino Biological) and
SIV gp120 (Sino Biological) were also included in the assay as positive and negative controls
respectively. Antigens were covalently coupled to magnetic carboxylated beads (Bio Rad) using a two-
step carbodiimide reaction and blocked with 0.1% BSA, before being resuspended and stored in PBS
0.05% sodium azide.
Luminex bead-based multiplex assay. Using the coupled beads mentioned above, a custom CoV
multiplex assay was formed to investigate the isotypes and subclasses of pathogen-specific antibodies
Page 15/34present in collected plasma samples25. Briefly, 20µl of working bead mixture (1000 beads per bead
region) and 20µl of diluted plasma (final dilution 1:200) or 20µl of diluted respiratory secretions (final
dilution 1:800) were added per well and incubated overnight at 4°C on a shaker. Fourteen different
detectors were used to assess pathogen-specific antibodies. Single-step detection was done using
phycoerythrin (PE)-conjugated mouse anti-human pan-IgG, IgG1-4 and IgA1-2 (Southern Biotech;
1.3µg/ml, 25µl/well). C1q protein (MP Biomedicals) was first biotinylated (Thermo Fisher Scientific), then
tetramerized with Streptavidin R-PE (SAPE; Thermo Fisher Scientific) before dimers or tetrameric C1q-PE
were used for single-step detection. For the detection of FcγR-binding, soluble recombinant FcγR dimers
(higher affinity polymorphisms FcγRIIa-H131, lower affinity polymorphisms FcγRIIa-R131, FcγRIIb, higher
affinity polymorphisms FcγRIIIa-V158, lower affinity polymorphisms FcγRIIIa-F158; 1.3µg/ml, 25µl/well;
kind gifts from Bruce D. Wines and P. Mark Hogarth) were first added to the beads, washed, and followed
by the addition of SAPE. For the detection of IgM, biotinylated mouse anti-human IgM (mab MT22;
Mabtech; 1.3µg/ml, 25µl/well) was first added to beads, washed, followed by SAPE. Assays were read on
the Flexmap 3D and performed in duplicates.
Data normalization. For all multivariate analysis, Tetanus, H1Cal2009, and BSA antigens (positive
controls) were removed, as well as SIV (negative control). Low signal features were removed when the
75th percentile response for the feature was lower than the 75th percentile of the BSA positive control.
Right shifting was performed on each feature (detector–antigen pair) individually if it contained any
negative values, by adding the minimum value for that feature back to all samples within that feature.
Following this, all data were log-transformed using the following equation, where x is the right-shifted
data and y is the right-shifted log-transformed data: y = log10(x + 1). This process transformed the
majority of the features to having a normal distribution. In all the subsequent multivariate analyses, the
data were furthered normalized by mean centering and variance scaling each feature using the z-score
function in Matlab. Plasma and respiratory samples were analysed separately. When analysing samples
at time of hospital discharge, to adjust for the confounder of time from symptom onset, each of the
features were iteratively regressed with ordinary least squares regression, using the residuals as input for
the analysis54.
Feature selection using Elastic Net/PLSDA. To determine the minimal set of features (signatures) needed
to predict categorical outcomes (COVID-19 diagnosis, NIH scores, drug therapies), a three-step process
was developed55. First, the data were randomly sampled without replacement to generate 2000 subsets.
The resampled subsets spanned 80% of the original sample size, or sampled all classes at the size of the
smallest class for categorical outcomes, which corrected for any potential effects of class size
imbalances during regularization. Elastic-Net regularization was then applied to each of the 2000
resampled subsets to reduce and select features most associated with the outcome variables. The
Elastic-Net hyperparameter, α, was set to have equal weights between the L1 norm and L2 norm
associated with the penalty function for least absolute shrinkage and selection (LASSO) and ridge
regression, respectively 56. By using both penalties, Elastic-Net provides sparsity and promotes group
selection. The frequency at which each feature was selected across the 2000 iterations was used to
Page 16/34determine the signatures by using a sequential step-forward algorithm that iteratively added a single
feature into the PLSDA model starting with the feature that had the highest frequency of selection, to the
lowest frequency of selection. Model prediction performance was assessed at each step and evaluated
by 10-fold cross-validation classification error for categorical outcomes. The model with the lowest
classification error within a 0.01 difference between the minimum classification error was selected as the
minimum signature. If multiple models fell within this range, the one with the least number of features
was selected and if there was a large disparity between calibration and cross-validation error (over-
fitting), the model with the least disparity and best performance was selected.
PLSDA. Partial least squares discriminant analysis (PLSDA), performed in Eigenvectors PLS toolbox in
Matlab, was used in conjunction with Elastic-Net, described above, to identify and visualize signatures
that distinguish categorical outcomes (COVID-19 diagnosis, NIH scores, drug therapies). This supervised
method assigns a loading to each feature within a given signature and identifies the linear combination
of loadings (a latent variable, LV) that best separates the categorical groups. A feature with a high
loading magnitude indicates greater importance for separating the groups from one another. Each
sample is then scored and plotted using their individual response measurements expressed through the
LVs. The scores and loadings can then be cross-referenced to determine which features are loaded in
association with which categorical groups (positively loaded features are higher in positively scoring
groups, etc.). All models go through 10-fold cross-validation, where iteratively 10% of the data is left out
as the test set, and the rest is used to train the model. Model performance is measured through
calibration error (average error in the training set) as well as cross-validation error (average error in the
test set), with values near 0 being best. All models were orthogonalized to enable clear visualization of
results.
Hierarchical clustering. We visualized the clustering of DRASTIC respiratory and blood samples based on
only SARS-CoV-2 antigens or all features using unsupervised average linkage hierarchical clustering of
normalized data using MATLAB 2017b (MathWorks, Natick, MA). Euclidean distance was used as the
distance metric.
Cytokine analysis. Patients’ plasma and respiratory samples were measured for IL-1β, IFN-α2, IFN-γ, TNF,
MCP-1 (CCL2), IL-6, IL-8 (CXCL8), IL-10, IL-12p70, IL-17A, IL-18, IL-23 and IL-33 using the LEGENDplex™
Human Inflammation Panel 1 kit, as per manufacturer’s instructions (BioLegend, San Diego, CA, USA).
sIL-6Rα and ADAMTS4 ELISAs. Soluble protein levels were all measured using DuoSet ELISA kits for each
protein (R&D Systems, Minneapolis, MN, USA) according to the manufacturer’s instructions. DuoSet
ELISA ancillary reagent kit (R&D Systems) was used for respiratory fluids and in-house reagents with the
same composition were used for plasma samples. In brief, 96-well R&D ELISA microplates (respiratory
fluids) or 96-well Nunc Maxisorp ELISA plates (ThermoFisher, plasma) were coated with capture antibody
overnight, followed by blocking with 1% w/v BSA for a minimum of 1 hour. Samples and standard
proteins were added and incubated for 2 hours at room temperature, followed by detection antibody for a
further 2 hours. Lastly, streptavidin-HRP, substrate solution and stop solution (2N H2SO4) were added
Page 17/34subsequently for 20 minutes each. Plasma samples were diluted in 1:300 for sIL-6Rα ELISAs. Respiratory
fluids were diluted in 1:50/1:150 for sIL-6Rα ELISA accounting in the original dilution factors and tested
without further dilution for ADAMTS4 ELISA.
Computational flow cytometry analysis. Computational analysis of data was performed using the
Spectre R package26 (https://github.com/ImmuneDynamics/Spectre). Samples were initially prepared in
FlowJo, and populations of interest were exported as CSV files containing raw (scale value) data. In R,
data were subject to arcsinh transformation and clustering using FlowSOM 27. For visualisation, cells in
the myeloid panel were subjected to sample-weighted downsampling based on absolute cells/uL counts
in the blood, whereas cells in the lymphoid panel were unchanged to preserve samples with low cell
numbers. Cells from the lymphoid panel, and downsampled cells from the myeloid panel, were then
distributed in 2D via dimensionality reduction (DR) using Fast Interpolation-based t-distributed Stochastic
Neighbour Embedding (FIt-SNE)28. Data from both the lymphoid and myeloid panel were subject to two
rounds of clustering and DR. The initial round of clustering and DR was used to filter out cellular debris
and non-immune cells exhibiting high autofluorescence, using arcsinh transformed expression of CD45,
CD3, CD4, CD8, CD14, CD16, CD19, CD64, CD66b, CD38, HLA-DR, and Live-Dead for the myeloid panel;
and CD45, CD3, CD4, CD8, TCR-γδ, CD45RA, CD27, CD56, CD19, CD16, CD14, CD38, HLA-DR, PD-1, and
Live-Dead for the lymphoid panel. A second round of clustering and DR was then used for detailed
immunophenotyping of cells in the respiratory tract, using arcsinh transformed expression of CD4, CD8,
CD14, CD16, CD38, CD45, CD64, CD66b, HLA-DR, and Live-Dead for the myeloid panel; and CD45, CD3,
CD4, CD8, TCR-γδ, CD45RA, CD27, CD56, CD19, CD16, CD38, and HLA-DR for the lymphoid panel.
Immune cell lineages were manually annotated based on marker expression: neutrophils
(FSCintSSCintCD66b+), monocytes (FSCintCD14+), B cells (CD19+), NK cells (CD56+), gamma-delta T cells
(TCR-γδ+), CD4+ T cells (CD4+CD14-), CD8+ T cells (CD8+), and dead cells (Live-Dead+). Interestingly, CD3
expression on T cell subsets was not apparent in respiratory samples, and we did not find distinct
eosinophil phenotypes. Subsequently, population subsets were manually annotated based on marker
expression: neutrophils (CD16hi, CD16lo, CD16-, dead neutrophils Live-Dead+), monocytes (classical
CD14+CD16- and intermediate CD14+CD16+), B cells (naïve CD27-CD38-, memory CD27+CD38-, ASC
CD27+CD38+), NK cells (CD56bri and CD56dim ), CD4+ T cells (naïve-like CD45RA+CD27+, EMRA-like
CD45RA+CD27-, CM-like CD45RA-CD27+, and EM-like CD45RA-CD27-), and CD8+ T cells (naïve-like
CD45RA+CD27+, EMRA-like CD45RA+CD27-, CM-like CD45RA-CD27+, and EM-like CD45RA-CD27-). Given
that NK cells were classified as CD56+ cells, the subset might include other unconventional T cells.
Subsets were evaluated for expression of CD38, HLA-DR, and PD-1 expression using manual gating in
FlowJo.
Volcano plots and heatmaps were created using the Spectre R package26, where comparisons were
performed using a Wilcoxon rank-sum test (equivalent to the Mann-Whitney test) with the wilcox.test
function in R. Statistics displayed in volcano plots were corrected with a False Discovery Rate (FDR)
adjustment.
Page 18/34Statistical analyses. Statistical significance was assessed using Mann-Whitney, Wilcoxon signed-rank
test or Kruskal-Wallis test with Dunn’s correction for multiple comparisons in Prism 9 (GraphPad) unless
stated otherwise. Correlations were assessed using Spearman’s correlation coefficient (rs) and visualized
in R 3.6.2 as heatmaps using the corrplot package or using the online Morpheus heatmap software
(https://software.broadinstitute.org/morpheus; the Broad Institute, MA, USA) and p-values of correlations
were corrected for multiple comparisons by FDR in R 3.6.2. P-values lower than 0.05 were considered
statistically significant.
Data availability. The published article includes all datasets generated or analyzed during the study.
References
1. Gallo Marin B, et al. Predictors of COVID-19 severity: A literature review. Reviews in Medical Virology
31, e2146 (2021).
2. Baden LR, et al. Efficacy and Safety of the mRNA-1273 SARS-CoV-2 Vaccine. New England Journal
of Medicine 384, 403–416 (2020).
3. Xia S, et al. Safety and immunogenicity of an inactivated SARS-CoV-2 vaccine, BBIBP-CorV: a
randomised, double-blind, placebo-controlled, phase 1/2 trial. The Lancet Infectious Diseases 21,
39–51 (2021).
4. Keech C, et al. Phase 1–2 Trial of a SARS-CoV-2 Recombinant Spike Protein Nanoparticle Vaccine.
New England Journal of Medicine 383, 2320–2332 (2020).
5. Rana MA, et al. Comparison of Efficacy of Dexamethasone and Methylprednisolone in Improving
PaO2/FiO2 Ratio Among COVID-19 Patients. Cureus 12, e10918-e10918 (2020).
6. The RECOVERY Collaborative Group. Dexamethasone in Hospitalized Patients with Covid-19 —
Preliminary Report. New England Journal of Medicine, (2020).
7. Tomazini BM, et al. Effect of Dexamethasone on Days Alive and Ventilator-Free in Patients With
Moderate or Severe Acute Respiratory Distress Syndrome and COVID-19: The CoDEX Randomized
Clinical Trial. JAMA 324, 1307–1316 (2020).
8. Ling Y, et al. Persistence and clearance of viral RNA in 2019 novel coronavirus disease rehabilitation
patients. Chinese Medical Journal 133, (2020).
9. Beigel JH, et al. Remdesivir for the Treatment of Covid-19 — Final Report. New England Journal of
Medicine, (2020).
10. Spinner CD, et al. Effect of Remdesivir vs Standard Care on Clinical Status at 11 Days in Patients
With Moderate COVID-19: A Randomized Clinical Trial. JAMA 324, 1048–1057 (2020).
11. Antinori S, et al. Compassionate remdesivir treatment of severe Covid-19 pneumonia in intensive care
unit (ICU) and Non-ICU patients: Clinical outcome and differences in post-treatment hospitalisation
status. Pharmacol Res 158, 104899–104899 (2020).
12. Kuri-Cervantes L, et al. Comprehensive mapping of immune perturbations associated with severe
COVID-19. Science immunology 5, eabd7114 (2020).
Page 19/3413. Long QX, et al. Clinical and immunological assessment of asymptomatic SARS-CoV-2 infections. Nat
Med 26, 1200–1204 (2020).
14. Mathew D, et al. Deep immune profiling of COVID-19 patients reveals distinct immunotypes with
therapeutic implications. Science 369, eabc8511 (2020).
15. Thevarajan I, et al. Breadth of concomitant immune responses prior to patient recovery: a case report
of non-severe COVID-19. Nature Medicine 26, 453–455 (2020).
16. Laing AG, et al. A dynamic COVID-19 immune signature includes associations with poor prognosis.
Nature Medicine 26, 1623–1635 (2020).
17. Lucas C, et al. Longitudinal analyses reveal immunological misfiring in severe COVID-19. Nature 584,
463–469 (2020).
18. Szabo PA, et al. Longitudinal profiling of respiratory and systemic immune responses reveals
myeloid cell-driven lung inflammation in severe COVID-19. Immunity 54, 797–814.e796 (2021).
19. Saris A, et al. Distinct cellular immune profiles in the airways and blood of critically ill patients with
COVID-19. Thorax, thoraxjnl-2020-216256 (2021).
20. Xiong Y, et al. Transcriptomic characteristics of bronchoalveolar lavage fluid and peripheral blood
mononuclear cells in COVID-19 patients. Emerging Microbes & Infections 9, 761–770 (2020).
21. Sánchez-Cerrillo I, et al. COVID-19 severity associates with pulmonary redistribution of CD1c + DCs
and inflammatory transitional and nonclassical monocytes. The Journal of Clinical Investigation
130, (2020).
22. Lane CR, Sherry, Norelle L., Porter, Ashleigh F., Duchene, Sebastian, Horan, Kristy, Andersson, Patiyan,
Wilmot, Mathilda, Turner, Annabelle, Dougall, Sally, Johnson, Sandra, Sait, Michelle, Gonçalves da
Silva, Anders, Ballard, Susan A., Hoang, Tuyet, Stinear, Timothy P., Caly, Leon, Sintchenko, Vitali,
Graham, Rikki, McMahon, Jamie, Smith, David, Leong, Lex EX, Meumann, Ella M., Cooley, Louise,
Schwessinger, Benjamin, Rawlinson, William, van Hal, Sebastian, Stephens, Nicola, Catton, Mike,
Looker, Clare, Crouch, Simon, Sutton, Brett, Alpren, Charles, Williamson, Deborah, Seemann, Torsten,
Howden, Benjamin,. Genomics-Informed Responses in the Elimination of COVID-19 in Australia.
Available at SSRN: https://ssrncom/abstract=3830366 or http://dxdoiorg/102139/ssrn3830366,
(2021).
23. Boyd DF, et al. Exuberant fibroblast activity compromises lung function via ADAMTS4. Nature,
(2020).
24. Premkumar L, et al. The receptor binding domain of the viral spike protein is an immunodominant
and highly specific target of antibodies in SARS-CoV-2 patients. Science immunology 5, eabc8413
(2020).
25. Selva KJ, et al. Systems serology detects functionally distinct coronavirus antibody features in
children and elderly. Nature Communications 12, 2037 (2021).
26. Ashhurst TM, et al. Integration, exploration, and analysis of high-dimensional single-cell cytometry
data using Spectre. Cytometry Part A n/a, (2021).
Page 20/34You can also read