A conserved role for the ALS-linked splicing factor SFPQ in repression of pathogenic cryptic last exons - Nature
←
→
Page content transcription
If your browser does not render page correctly, please read the page content below
ARTICLE
                  https://doi.org/10.1038/s41467-021-22098-z                 OPEN

                  A conserved role for the ALS-linked splicing factor
                  SFPQ in repression of pathogenic cryptic last exons
                  Patricia M. Gordon1,2 ✉, Fursham Hamid                       1,2,   Eugene V. Makeyev1 & Corinne Houart1 ✉

                  The RNA-binding protein SFPQ plays an important role in neuronal development and has
                  been associated with several neurodegenerative disorders, including amyotrophic lateral
1234567890():,;

                  sclerosis (ALS), frontotemporal dementia (FTD), and Alzheimer’s disease. Here, we report
                  that loss of sfpq leads to premature termination of multiple transcripts due to widespread
                  activation of previously unannotated cryptic last exons (CLEs). These SFPQ-inhibited CLEs
                  appear preferentially in long introns of genes with neuronal functions and can dampen gene
                  expression outputs and/or give rise to short peptides interfering with the normal gene
                  functions. We show that one such peptide encoded by the CLE-containing epha4b mRNA
                  isoform is responsible for neurodevelopmental defects in the sfpq mutant. The uncovered
                  CLE-repressive activity of SFPQ is conserved in mouse and human, and SFPQ-inhibited CLEs
                  are found expressed across ALS iPSC-derived neurons. These results greatly expand our
                  understanding of SFPQ function and uncover a gene regulation mechanism with wide rele-
                  vance to human neuropathologies.

                  1 Centre for Developmental Neurobiology and MRC Centre for Neurodevelopmental Disorders, IoPPN, Guy’s Campus, King’s College London, London SE1 1UL, UK.
                  These authors contributed equally: Patricia M. Gordon, Fursham Hamid. ✉email: patricia.gordon@kcl.ac.uk; corinne.houart@kcl.ac.uk
                  2

                  NATURE COMMUNICATIONS | (2021)12:1918 | https://doi.org/10.1038/s41467-021-22098-z | www.nature.com/naturecommunications                              1
ARTICLE                                                                 NATURE COMMUNICATIONS | https://doi.org/10.1038/s41467-021-22098-z

N
         eurons are highly polarized cells with specialized com-             genes with significant changes in the relative expressions of splice
         partments that must be able to respond to growth cues as            variants in the mutants (q ≤ 0.05; Supplementary Data 3). GO
         well as to form and modify their synapses in an activity-           analysis of these genes again showed an over-representation of
dependent manner. Each compartment of a neuron is able to                    neuron-specific terms including axonogenesis, axon guidance, and
achieve functional specificity by maintaining a unique tran-                  dendrite formation (Supplementary Data 4). Surprisingly, 52 of
scriptome and proteome1–4. This points to the importance of                  the 112 genes were predicted to express a splice variant containing
post-transcriptional regulation of gene expression in this biolo-            a cryptic alternate last exon, not annotated in the current zebrafish
gical context. Indeed, RNAs from neuronal tissue are regulated by            assembly (Supplementary Fig. 1a). To verify this, we analyzed the
a complex array of alternative splicing, intron retention, tele-             dataset with Whippet41, a tool that sensitively detects changes in
scripting, recursive splicing, and alternative cleavage and poly-            the usage of alternative exons and quantifies gene expression
adenylation events5–16.                                                      changes. Whippet also uncovered a high proportion of down-
   Splicing Factor Proline/Glutamine Rich (SFPQ) is a ubiqui-                regulated genes in sfpq−/− embryos (Fig. 1b). More importantly,
tously expressed RNA-binding protein of the DBHS family with                 the analysis confirmed that alternate last exons are the most
diverse roles in alternative splicing, transcriptional regulation,           abundant category of SFPQ-regulated splicing events accounting
microRNA targeting, paraspeckle formation, and RNA transport                 for 18.5% of the total (Fig. 1c). Systematic classification of these
into axons17–24. Inactivation of the sfpq gene causes early                  exons into known and “cryptic” corroborated that the majority of
embryonic lethality in mouse and zebrafish as well as impaired                these events (113 out of 157) have not been previously annotated
cerebral cortex development, reduced brain boundary formation,               (Fig. 1d and Supplementary Data 5). These last exons were
and axon outgrowth defects23,25–27. In humans, sfpq mutations                expressed from 103 genes, 25 of which were also detected by
have been linked to neurodegenerative diseases such as Alzhei-               Cufflinks (Supplementary Fig. 1b). In 65 of the 103 genes, the
mer’s, ALS, and FTD, and SFPQ interacts with the ALS-                        cryptic last exons were predicted to give rise to truncated peptides
associated RNA-binding proteins TDP-43 and FUS28–33.                         with missing C-terminal domains (Supplementary Data 6). We
   While SFPQ is known to play a role in alternative splicing, only          refer to this pervasive splicing defect, in which the transcript
a few RNA targets of SFPQ have been identified. Intriguingly,                 undergoes premature termination after the inclusion of a pre-
SFPQ has opposing effects on splicing, depending on the target: it           viously unknown exon, as Cryptic Last Exons (CLEs; Fig. 1e).
represses inclusion of exon 10 of tau and exon 4 of CD45, but
conversely it promotes inclusion of the N30 exon of non-muscle
                                                                             The use of CLEs inversely correlates with expression of full-
myosin heavy‐chain II‐B19,30,34–36. In addition to its role in
                                                                             length transcripts. Of the 103 CLE-containing genes, 97%
splicing, SFPQ has been shown to be part of the 3′-end processing
                                                                             exhibited increased splicing of CLEs in sfpq−/− (Supplementary
complex, where it enhances cleavage and polyadenylation at
                                                                             Data 5). Notably, almost half of these genes were downregulated
suboptimal polyadenylation sites37–39. The mechanisms by which
                                                                             in mutants, indicating concurrent alterations in expression level
SFPQ regulates mRNA processing are still unclear, however, and
                                                                             and splicing for these genes (~13-fold enrichment over the
more work is necessary to understand its contribution to normal
                                                                             number expected by chance; Fisher’s exact test p = 4.66 × 10−49;
and pathological cell states.
                                                                             Fig. 1f). Indeed, we saw a significant negative correlation between
   To understand the molecular functions of SFPQ in developing
                                                                             CLE inclusion and overall gene expression levels (Pearson cor-
neurons, we performed an RNA-seq analysis of sfpq homozygous
                                                                             relation r = −0.27, p = 3.2 × 10⁻³; Supplementary Fig. 1c). The
null mutant and sibling zebrafish embryos at 24 hpf, the stage of
                                                                             full-length (non-CLE) isoforms showed an even stronger
phenotypic onset, and undertook a multi-level comparative
                                                                             enrichment for the downregulation effect (exceeding the expec-
analysis. Our results reveal an important role for the protein: loss
                                                                             tation ~25-fold; Fisher’s exact test p = 6.03 × 10−80), suggesting
of SFPQ causes premature termination of transcription as a result
                                                                             that CLEs often dampen the production of full-length transcripts
of previously unannotated pre-mRNA processing events that we
                                                                             (Fig. 1g). To verify these results, we analyzed five selected CLE-
refer to as Cryptic Last Exons (CLEs). Here we describe the
                                                                             containing genes, nbeaa, gdf11, epha4b, trip4, and b4galt2, by
formation of CLEs and show that not only do the truncated
                                                                             reverse transcription-quantitative PCR (RT-qPCR). In all cases,
transcripts act as a form of negative regulation of gene expression
                                                                             cryptic exons showed a substantial increase in expression level in
levels, but they also directly contribute to the sfpq pathology. This
                                                                             sfpq−/− mutants compared to siblings (Supplementary Fig. 1d–h).
function of SFPQ is conserved across vertebrates and is likely to
                                                                             Additionally, we detected a strong downregulation of the full-
be implicated in human SFPQ-mediated disease states.
                                                                             length isoforms in four of the five genes, suggesting that the loss
                                                                             of sfpq causes upregulation of the CLE isoforms at the expense of
                                                                             their full-length counterparts (Supplementary Fig. 1e–h). These
Results
                                                                             results argue that SFPQ may maintain stable gene expression by
Identification of the SFPQ-dependent splicing regulation
                                                                             repressing CLEs.
program. To examine the effect of SFPQ on gene expression
and RNA splicing, we analyzed total RNA extracted from 24 hpf
sfpq−/− zebrafish embryos and their heterozygous or wild-type                 CLE-terminated transcripts are cleaved and polyadenylated at
siblings by RNA sequencing (RNA-seq). Differential gene                      the 3′ end. The last exons included into mature mRNAs are
expression analysis using the TopHat/Cufflinks workflow40                      expected to acquire a 3′-terminal poly(A) tail as a result of pre-
uncovered 189 genes that were upregulated and 1044 genes that                mRNA cleavage and polyadenylation. To check if CLEs contained
were downregulated in the mutant samples by a factor of at least             this feature, we analyzed poly(A)-proximal mRNA sequences by
1.3-fold with q ≤ 0.05 (Fig. 1a). These results are consistent with          3′ mRNA-seq and identified putative cleavage/polyadenylation
our previous microarray study, which showed the vast majority of             positions as major clusters of 3′ mRNA-seq reads (see Methods
genes with differential expression in sfpq−/− embryos as being               section). Notably, 84 out of the 113 CLEs contained or were
downregulated26. Gene ontology (GO) analysis of the new dataset,             immediately followed by cleavage/polyadenylation clusters (Sup-
using total transcribed genes as a background gene set, showed               plementary Fig. 2a, b). The incidence of cleavage/polyadenylation
enrichment for neuron-specific terms, including neuronal differ-              clusters was similar for the constitutive last exons (Supplementary
entiation and axon guidance (Supplementary Data 1 and 2). Using              Fig. 2b). Importantly, cleavage/polyadenylation events down-
Cufflinks’ differential isoform switch analysis, we identified 112             stream of CLEs tended to be significantly upregulated in sfpq−/−

2                NATURE COMMUNICATIONS | (2021)12:1918 | https://doi.org/10.1038/s41467-021-22098-z | www.nature.com/naturecommunications
NATURE COMMUNICATIONS | https://doi.org/10.1038/s41467-021-22098-z ARTICLE
a c f Fisher’s exact test Fisher’s exact test
10,000 p=4.66E-49 p=8.75E-2
189 Cufflinks 20 Fold enrichment = Fold enrichment =
13.2 4.1
% regulated by SFPQ
Gene expression in
sfpq-/- (FPKM)
10
10
1,173 42 61 179 2 101
0.01
1,044
0
CE FE LE SD SA RI Down- CLE Up-
0.01 10 10,000 CLE
regulated genes regulated
genes
Gene expression in Alternative splicing (AS) events genes genes
siblings (FPKM)
b d Known Cryptic
g
Fisher’s exact test Fisher’s exact test
10,000 n = 2,642 166 157 233 346 165 p=6.03E-80 p=1.12E-83
181 Whippet 100
Fold enrichment = Fold enrichment =
25.2 0.8
Gene expression in
sfpq-/- (TpM)
100
% of events
50
1 606 77 264 75,307 258 83
1,215
0
CE FE LE SD SA RI Down- Non-
1 100 10,000 Annotated Annotated
regulated regulated
isoforms isoforms
Gene expression in Regulated AS events isoforms isoforms
siblings (TpM)
e nbeaa epha4b
chr10 > 34,550,000 34,650,000 34,750,000 chr2 > 40,500,000 40,600,000
6 Siblings 15 Siblings
TpM
TpM
0 0
Splice Splice
track track
6 sfpq-/- CLE 15 sfpq-/-
TpM
TpM
CLE
0 0
Splice Splice
track track
ENSDART00000102566 ENSDART00000170089
ENSDART00000144529 ENSDART00000114630 ENSDART00000037292
CLE isoform ENSDART00000164036
CLE isoform 1
CLE isoform 2
Fig. 1 SFPQ regulates the formation of cryptic last exons (CLEs). a, b Scatter plot showing expression values of genes in sfpq−/− and siblings, analyzed
using Cufflinks (a) or Whippet (b) pipelines. FPKM fragments per kilobase of transcript per million, TpM transcripts per million. c Alternative last exons is a
major category of SFPQ-controlled events. CE cassette exon, FE first exon, LE last exon, SD splice donor, SA splice acceptor, RI retained intron. d Majority
of SFPQ-regulated last exon events are cryptic. e Sashimi plots showing example CLE formation in nbeaa and epha4b. Top tracks: plot of read coverage from
siblings (upper) and sfpq−/− (lower). Bottom tracks: isoforms discovered for each gene. f Genes expressing CLE-containing isoforms tend to be
downregulated in sfpq−/−. Two-sided Fisher’s exact test was performed. g Normal long isoforms (annotated isoforms) from CLE-expressing genes tend to
be downregulated in sfpq−/−. Two-sided Fisher’s exact test was performed.
mutants, while the use of cleavage/polyadenylation sites in the CLEs tend to occur in long introns and show evidence of
corresponding constitutive last exons was often reduced interspecies conservation. In order to understand under what
(Fig. 2a–c and Supplementary Fig. 2c). Metaplots of the change in conditions CLEs form, we examined CLE-containing introns and
3′ mRNA-seq read coverage confirmed this effect (Fig. 2d). compared them to all other introns from the same genes. We first
To validate the 3′ mRNA-seq results, we performed 3′ RACE asked whether CLE-containing introns have a specific position
on 10 CLE-containing transcripts: bcas3, dlg5a, epha4b, gdf11, within their genes and found no significant bias (Fig. 3a). How-
gli2b, immp2l, nbeaa, sema5ba, trip4, and vti1a (Fig. 2e). Of the ever, when we ranked the introns by length, we found that CLEs
10 CLEs, 7 had the canonical polyadenylation signal (PAS) are frequently located in the longest intron of the gene (Fig. 3b)
AATAAA just upstream of the predicted cleavage site, while the and that CLE-containing introns are significantly longer than
remaining 3 had common one-base substitutions ATTAAA and other introns in general (Fig. 3c). To test if CLEs are more
AATATA42. These results indicate that normal expression of commonly found in long introns due to simple probabilistic
SFPQ is required to repress cryptic cleavage/polyadenylation sites. considerations, we performed a weighted random sampling of
NATURE COMMUNICATIONS | (2021)12:1918 | https://doi.org/10.1038/s41467-021-22098-z | www.nature.com/naturecommunications 3ARTICLE NATURE COMMUNICATIONS | https://doi.org/10.1038/s41467-021-22098-z Fig. 2 CLEs are cleaved and polyadenylated. a, b Representative coverage plots from RNA-seq (light blue) and 3′ mRNA-seq (red) experiments showing cryptic last and constitutive last exons. Only clustered reads are shown in the 3′ mRNA-seq profile and consensus polyadenylation signals (PASs) are marked by red arrowheads. c Four-way dot plot representing the change in relative cleavage site usage (sfpq vs sib) for CLEs (x-axis) against its corresponding constitutive last exons (y-axis; control). A positive value on each axis represents an increased CS usage in sfpq−/− null. Genes showing significantly changing CS usage in both CLE and control (FDR < 0.05) are colored red and the total number of significantly regulated genes is indicated for each quadrant. d Metaplot of the normalized change in 3′ mRNA-seq coverage within regions surrounding CLEs (red) and constitutive last exons (blue; control). e Sanger sequencing of 3′RACE PCR products of CLE isoforms. PAS hexamers are shown within red boxes. introns from CLE-containing genes setting the probability of each conservation scores as compared to sequences within the same intron to be selected proportional to its length (Supplementary intron that do not contain CLEs (Supplementary Fig. 3e). In fact, Fig. 3a). This revealed that the actual lengths of CLE-containing 18% of these sequences displayed a mean PhastCons score of at introns are significantly longer than expected by chance. least 0.5 (as opposed to 12% of non-CLE sequences; Fisher’s exact Consistent with the above results, CLE-containing genes were test: 5.71 × 10−51). However, few CLEs showed overall phyloP significantly longer than most zebrafish genes (Supplementary scores above 0.5 (Supplementary Fig. 3f, g). Next, we calculated Fig. 3b). Within the intron, location of the CLE was biased toward the mean base conservation scores of each CLE together with 250 the 5′ end, with the median position 22.4% of the way into the bp flanking sequences (Fig. 3f). In the sequences with higher intron (95% confidence interval of 18.1% to 26.7%; Fig. 3d). The overall PhastCons scores, we found that conservation was the distance between the CLE and the upstream exon was generally highest in the region surrounding the start of the exon (Fig. 3f).
NATURE COMMUNICATIONS | https://doi.org/10.1038/s41467-021-22098-z ARTICLE
a b c
Wilcoxon test Wilcoxon test Wilcoxon test
p = 0.59 p = 3.56E-52 p = 5.97E-57
3’ proximal Longer
1.0 1.0 1E+6
Intron length (bp)
Intron scored by
relative position
Intron scored
by length
0.5 0.5 1E+3
0.0 0.0 1E+0
5’ proximal Shorter
CLE- Non-CLE CLE- Non-CLE CLE- Non-CLE
containing containing containing containing containing containing
Introns from CLE-expressing genes Introns from CLE-expressing genes Introns from whole transcriptome
d e f
Median: 22.4% Median: 8.5 kb
10 15 PhastCons CLE
95% CI: 18.1 - 26.7 % 95% CI: 5.5 - 11.4 kb 0.6
Number of CLEs
≥ 0.5
Number of CLEs
Mean PhastCons
10 < 0.5
5
0.3
5
0 0
0.0
0 50 100 0 50 100 150 -250 -125 0 0 125 250
Distance between CLE Position relative to CLE (bp)
Relative position of CLE within intron, %
and upstream exon, kb
Fig. 3 Molecular properties of CLEs. a, b CLE containing (n = 109) and non-CLE (n = 1557) containing introns from CLE-expressing genes were scored by
their relative position (a) and relative length (b), and the distributions of these scores were plotted. Note that CLE-containing introns show no gene
position bias but tend to be among the longest introns in the gene. The box bounds represent the first and third quartiles and the black lines at the middle
of the boxes show the medians. Top and/or bottom whiskers represent 1.5x of the range between the third and the first quartiles (interquartile range).
Circles represent outliers. Two-sided Wilcoxon rank sum test was performed. c CLE-containing introns (n = 109) are longer compared to all other introns
in the zebrafish transcriptome (n = 209,012). The box bounds represent the first and third quartiles and the black lines at the middle of the boxes show the
medians. Top and/or bottom whiskers represent 1.5x of the range between the third and the first quartiles (interquartile range). Circles represent outliers.
Two-sided Wilcoxon rank-sum test was performed. d CLEs tend to occur relatively close to the 5′ end of their host introns. e CLEs are found within 10 kb of
the upstream constituitive exon. f Metaplot showing the conservation score of sequences surrounding conserved (blue) and non-conserved (red) CLEs. In
all, 280 bp of surrounding intron/CLE junction sequence (250 bp intron and 30 bp exon) were binned into 10 bp windows and the mean PhastCons score
for each bin is shown ±SEM.
question of whether SFPQ represses CLEs in a direct manner. CRISPR/Cas9 to delete the b4galt2 CLE, injecting Cas9 along with
SFPQ binds promiscuously to a wide range of RNA two guide RNAs that targeted directly upstream of the cryptic
sequences24,36, making binding prediction difficult. That said, an exon and at the 3′ end of the exon (Fig. 5a). Injected founder
SFPQ-binding motif deduced in vitro45, was significantly enri- embryos (crispants) will show mosaicism, so a complete loss of
ched upstream of cryptic exon sequences compared to control last the cryptic exon would not be expected in every cell of the
exons (Fig. 4a). To verify this observation, we purified SFPQ- embryo. With expected variation between individuals, PCR ana-
RNA complexes in 24 hpf embryos using standard CLIP protocol lysis of the “crispants” showed a detectable deletion band for six
and quantified the relative amount of bound CLE RNA fragments out of eight tested embryos (Fig. 5a). Encouraged by this result,
for a handful of randomly picked CLE candidates, using RT- we performed RT-qPCR on pooled injected sfpq−/− embryos to
qPCR. Our results confirmed that SFPQ binds either within the measure the expression levels of the normal b4galt2 transcripts
CLE or in adjacent 5′ or 3′ intronic regions of at least three CLE and saw a significant rescue of the longer transcripts compared to
transcripts (Fig. 4b–d). These results support the idea that SFPQ the uninjected sfpq−/− control, despite the natural variability in
directly binds to region surrounding CLEs to regulate their the targeting efficiency (Fig. 5a). Therefore, the b4galt2 CLE
inclusion. prevents the expression of full-length transcripts. Since CRISPR/
Cas9 targeting of CLEs in two other genes did not produce similar
rescue effects (example gdf11 CLE, Supplementary Fig. 5a), we
CLEs can dampen the expression of full-length transcripts. The concluded that CLEs regulate expression levels of normal splice
reciprocal relationship between CLEs and the abundance of full- variants of some but likely not all of the SFPQ-inhibited CLE-
length transcripts (Fig. 1f and Supplementary Fig. 1c) suggests containing genes.
that these exons may act as negative regulators of gene expres-
sion. If production of CLE transcripts is a mechanism for down-
regulating the normal full-length transcripts, then eliminating the Truncated protein derived from CLE-containing epha4b tran-
cryptic exon in sfpq−/− mutants should rescue their expression. scripts accounts for the boundary defects in sfpq−/− brain. In
To test this possibility, we used the gene b4galt2 as case study, as addition to affecting the expression levels of normal isoforms,
it shows a very strong loss of expression of its three normal CLE transcripts could impact the sfpq phenotype through aber-
isoforms in the mutant (Supplementary Fig. 1g). We used rant functions of the truncated RNAs or the short peptides they
NATURE COMMUNICATIONS | (2021)12:1918 | https://doi.org/10.1038/s41467-021-22098-z | www.nature.com/naturecommunications 5ARTICLE NATURE COMMUNICATIONS | https://doi.org/10.1038/s41467-021-22098-z
a b
Predicted sfpq
binding sites
0.5 ~100nt pA
CLE nbeaa CLE
sfpq binding sites
0.4 Cryptic LE
Mean number of
qPCR region 1 2 3 4 5 6 7 8 9 10
Control LE
0.6
0.3
CLIP Signal
0.2 0.4
0.1 0.2
0.0 0
-150 0 0 150 IgG α-sfpq
Distance relative to CLE(bp) CLIP-qPCR quantitation
c d
Predicted sfpq Predicted sfpq
binding sites binding sites
pA ~100nt pA
~100nt
sema5ba CLE epha4b CLE
qPCR region 1 2 3 4 5 6 7 8 qPCR region 1 2 3 4 5 6 7 8 9 10
0.5 1.0
CLIP Signal
CLIP Signal
0.5
0 0
IgG α-sfpq IgG α-sfpq
CLIP-qPCR quantitation CLIP-qPCR quantitation
Fig. 4 SFPQ directly binds to CLE-adjacent RNA sequences. a Metaplot showing the distribution of predicted SFPQ-binding sites surrounding CLEs (red)
and constitutive last exons of each CLE-containing gene (blue). In total, 200 bp of surrounding intron/CLE junction sequence (150 bp intron and 50 bp
exon) were binned into 50 bp windows and the mean number of predicted motifs is shown ±SEM. b–d Top: location of SFPQ-binding motifs predicted using
the MEME suite. Bottom: RT-qPCR quantitation showing the relative enrichment of SFPQ-interacting regions surrounding CLEs. RT-qPCR primer pairs were
designed for each 100-bp sequence window demarcated by alternating gray and white areas. Abundance of SFPQ- or IgG(control)-crosslinked RNAs were
normalized to input and the mean value from three replicates were shown ±SD. Source data are provided as a Source Data file.
produce. We focused on the candidate gene epha4b, which with an early stop inserted into exon 1, prematurely terminating
expresses a CLE-containing short mRNA in sfpq null embryos, translation. We found that this mutated transcript did not alter
while showing no change in expression of the normal transcripts hindbrain boundary formation (Fig. 5c), indicating that the
(Supplementary Fig. 1d). This gene is one of two zebrafish boundary defect occurs as a result of expression of the truncated
paralogues of the human ALS-associated gene Epha446,47, coding EphA4B protein.
for a protein-tyrosine kinase of the Ephrin receptor family known We then asked whether repressing the epha4b CLE in sfpq−/−
to regulate hindbrain boundary formation48,49. Hindbrain embryos could rescue the sfpq hindbrain boundary defect. We
boundary defects are a prominent component of the sfpq−/− used a splice junction morpholino (MO) that targeted the 3′
phenotype, and we asked whether expression of the epha4b CLE- splice acceptor site of the CLE to prevent the cryptic exon from
containing transcript could account for this abnormality. Trun- being used in sfpq mutants.Although MOs frequently have off-
cated forms of EPH receptors have been shown to act as domi- target effects, those effects are generally the opposite of what we
nant negatives by competing with full-length versions of the would expect to see from a rescue (i.e. increased cell death and
protein for ligand binding50. The predicted peptide produced by off-target phenotypes, never rescue of phenotypes). However, as
the epha4b CLE-containing short transcript would contain the MOs have been shown to have non-specific phenotypic effects on
ligand binding domain but not the transmembrane and intra- the hindbrain51 and also cause increases in the signal strength in
cellular domains and thus would be predicted to be a dominant in-situ hybridization, we used mismatch controls to ensure that
negative (Supplementary Data 6). our results were specific to the epha4b CLE splice-MO. We tested
To assess possible effects of the shortened epha4b, we first the MO efficiency using RT-PCR with primers both within the
performed an in-situ hybridization using a probe for the cryptic cryptic exon and across the exon junction (Supplementary
exon. We found that in 24 hpf sfpq−/− embryos, but not in Fig. 5b). We then examined the effects of the MO on hindbrain
siblings, the epha4b CLE was expressed strongly in the midbrain development using the boundary-specific rfng marker (Fig. 5d)
and hindbrain (Fig. 5b), where the gene is normally transcribed at and the pan-neuronal marker DeltaA (Fig. 5e). We observed that
that developmental stage. We then tested whether, in wild-type the CLE splice junction MO, but not the mismatch control,
fish, injection of the CLE transcript would induce defects in the rescued formation of rhombomere boundaries in sfpq−/−
midbrain or hindbrain. Using the early hindbrain boundary mutants. Taken together, these results demonstrate that the
marker rfng, we found that injection of the short epha4b hindbrain boundary defect in sfpq−/− embryos is driven by the
transcript did not affect formation of the midbrain but did cause dominant-negative effects of the epha4b CLE transcript.
a severe loss of hindbrain rhombomere boundaries similar to that
seen in the sfpq−/− mutant (Fig. 5c). In order to distinguish
whether the effect was the result of the mRNA or its translation in Repression of CLEs by SFPQ is conserved across vertebrates
a truncated protein, we also injected the short epha4b transcript and relevant to human neuropathologies. Given the importance
6 NATURE COMMUNICATIONS | (2021)12:1918 | https://doi.org/10.1038/s41467-021-22098-z | www.nature.com/naturecommunicationsNATURE COMMUNICATIONS | https://doi.org/10.1038/s41467-021-22098-z ARTICLE
a pA 1.5
b4galt2
downstream
Relative expression
b4galt2 CLE
p = 4.29E-2
sgRNA 1 PAM bp 1.0
atgactttctagttaggatgaattgaaggtcACTGGA
AAACTTTCAACTTGGATCATGGAGCAAGATGTTTATT 1000
TGCCCTGTTACAGGCCTAGTTTATCTGCAGCCATTTA 500 0.5
ACATCAGAGTCAAACACTGCATTTTTATCACAATCTG
TAAACCTGCTCTGTCTTTTAAGTTTTTTTTTTTTTTC
AAGCTCTGTTTCCAGCATCTCTGTTAATGTTTGATAT 100
ATAGACTCATTTTTCAGTACACGTTATATTTTGGAAA 0
AAGACTTTGTGTGCAACTCTGGAACAGAAATCAGTTG Uninjected sgRNAs injected Sib sfpq-/- sfpq-/-
sgRNA 2 PAM sgRNAs - - +
PCR verification RT-qPCR quantitation
b c
Siblings sfpq-/-
Uninjected + epha4b CLE isoform + epha4b CLE isoform with early stop
epha4b CLE isoform
rfng
d
Uninjected siblings Uninjected sfpq-/- 200
1 2 3 4 5 6 1 2 3 4 5 6
180
In-situ staining intensity
160
rfng
140
120
epha4b MO in sfpq-/- epha4b mismatched MO in sfpq-/-
1 2 3 4 5 6 1 2 3 4 5 6 100
0 100 200 300 400 500
Distance (pixels)
rfng
sibling
sfp q
sfpq ; Epha4b MO
sfpq ; Epha4b mismatch MO
e ns
Uninjected siblings Uninjected sfpq-/- 15
Number of deltaA cluster pairs
***
10
5
deltaA
epha4b MO in sfpq-/- epha4b mismatched MO in sfpq-/-
0
Uninjected Uninjected epha4b MO epha4b mismatch
siblings sfpq-/- in sfpq-/- MO in sfpq-/-
of SFPQ in human neurodegenerative diseases we explored conditions. However, if the molecular function of SFPQ were
whether SFPQ represses CLEs in mammals. We therefore ana- conserved, we would still be able to identify CLE formation
lyzed publicly available RNA-seq datasets from sfpq loss-of- among the expressed genes. Using RNA-seq dataset from a mouse
function experiments. Analyses done on different developmental model with a conditional mutation inactivating Sfpq in the cer-
stages or tissues than our RNA-seq experiment would not be ebral cortex23, we identified a total of 191 Sfpq-inhibited last
expected to pick up many of the same CLEs because different exons, 144 of which were cryptic (Fig. 6a and Supplementary
groups of genes would be transcribed under those differing Data 7). Importantly, the properties of CLE-containing introns in
NATURE COMMUNICATIONS | (2021)12:1918 | https://doi.org/10.1038/s41467-021-22098-z | www.nature.com/naturecommunications 7ARTICLE NATURE COMMUNICATIONS | https://doi.org/10.1038/s41467-021-22098-z
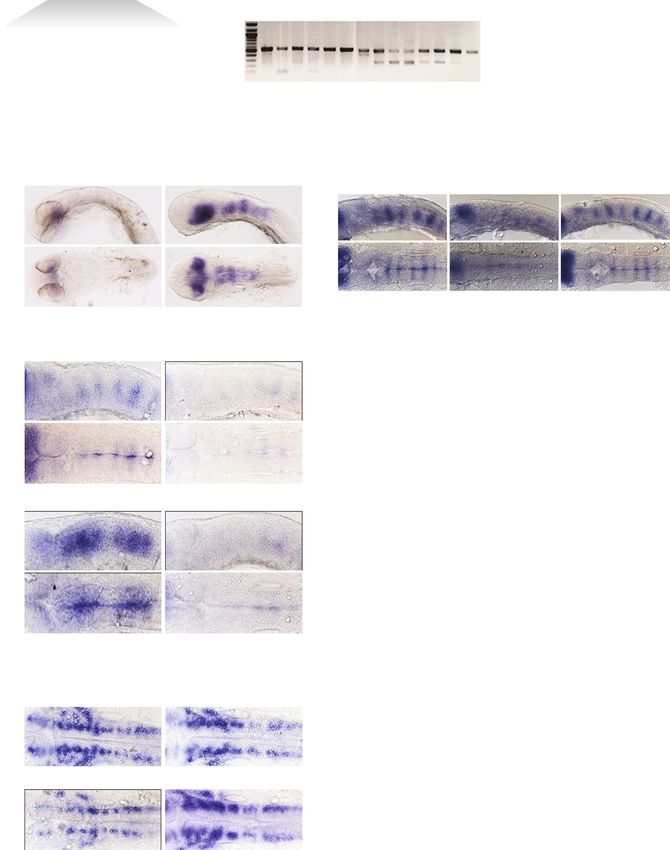
Fig. 5 CLEs have functional impacts. a Deletion of the b4galt2 CLE using CRISPR/Cas9 rescues expression of downstream exons. Left: cut sites of the
b4galt2 sgRNAs. CLE is indicated by capital letters. Center: PCR verification of Cas9 cleavage after injection of sgRNAs. Representative image; experiment
performed five times. Right: RT-qPCR quantitation of the relative expression of the downstream b4galt2 exons in sfpq−/− embryos compared to siblings
(±SD); n = 3 biologically independent replicates. Two-tailed unpaired t-test was performed. b In-situ hybridization of the epha4b CLE at 24 hpf, displaying
strong expression in the midbrain and hindbrain of sfpq−/− embryos. c In-situ hybridization of rfng shows rhombomere boundary defects at 22ss after
injection into WT embryos of the epha4b cryptic transcript or a mutated transcript with an early stop codon. Loss of boundaries seen in 8/10 embryos.
d Left: in-situ hybridization of rfng shows rhombomere boundary defects of sfpq−/− embryos are rescued by injection of the epha4b cryptic splice junction
morpholino but not a mismatch morpholino. Rhombomere boundaries are numbered. Right: quantification of staining in rhombomeres in three lateral view
samples for each condition. Representative images; defect seen in 13/15 embryos. e Left: in-situ hybridization of DeltaA shows a loss of discrete neuronal
clusters in sfpq−/− which is rescued by injection of the epha4b cryptic splice junction morpholino but not a mismatch morpholino. Right: quantification
of number of DeltaA clusters in each condition. Each data point represents one embryo; embryos examined over two independent experiments. Two-tailed
t-test was performed, ***p = 0.0005. c–e Upper: lateral view. Lower: dorsal view. Source data are provided as a Source Data file.
the mouse cortex were similar to those in zebrafish: they showed SFPQ binding within or directly adjacent to CLEs. Moreover, the
no positional bias along the gene and were often the largest in a bias of CLEs towards the 5′ end of long introns is consistent with
gene and statistically larger than other mouse introns (Fig. 6b and previous analyses of SFPQ localization on RNA23. These data
Supplementary Fig. 6a, b). Using the CLIP-seq dataset from the argue that SFPQ may play a direct role in repressing cryptic exon
same study, we found an enrichment in Sfpq-binding peaks in formation. SFPQ is known to interact with Pol II, promoting Ser
region surrounding CLEs but not in constitutive last exons 2 phosphorylation, and transcriptional elongation22,23, and our
(Fig. 6c). Among these 144 Sfpq-repressed CLEs, three orthologs results are consistent with a mechanism in which SFPQ recruit-
of zebrafish CLE-containing genes were found: Cpped1, Fam172a, ment to CLE-containing introns directly inhibits recognition and
and Exoc4 (Fig. 6d and Supplementary Fig. 6d, e). Surprisingly, splicing of the cryptic exon. However, further work will be
the constitutive exons flanking these mouse CLEs share high required to distinguish between suppression of splicing versus
sequence homology (57–77%) to the exons flanking its ortholo- blocking of the polyadenylation site.
gous zebrafish CLEs (Fig. 6d and Supplementary Fig. 6d, e). Since The relationship between SFPQ and CLEs extends our under-
low-abundance CLE-containing isoforms may escape detection standing of the regulation possibilities afforded by long introns.
by alternative splicing workflows, we manually inspected the Long introns have been previously shown to control gene
transcriptome for other conserved CLEs. We found exonic and expression through interplay between premature cleavage/poly-
junction reads mapping to the beginning of intron 3 of the mouse adenylation and the U1 snRNP-dependent antitermination
Epha4 gene, the closest orthologue of zebrafish epha4b (Fig. 6e mechanism known as “telescripting“14,15,53–56. SFPQ-mediated
and Supplementary Fig. 6c). Similarly, exons 3 and 4 of these CLE repression also operates in long introns (Fig. 3b), but the
orthologs share exceptionally high sequence similarity (Fig. 6e). underlying mechanisms appear to be quite different. Telescripting
As SFPQ has been recently linked to ALS in human, we also is thought to control cleavage/polyadenylation in a splicing-
examined RNA-seq results from iPSCs derived from ALS independent manner, whereas the formation of CLEs is a bona
patients, which show loss of nuclear SFPQ expression31. In total, fide splicing event possibly involving interactions of the
we found 68 CLE events upregulated in ALS-mutant backgrounds U2 snRNP or/and U2AF with the cleavage/polyadenylation
in at least one neuronal differentiation stage (Fig. 6f and machinery57. Moreover, U1-dependent antitermination often
Supplementary Data 8). This is probably an underestimation function close to the 5′ end of the gene55,56, whereas CLEs do
since the sequencing depth in this dataset was lower than that of not show such a gene location bias. The distinction between the
the mouse knockout study. While most of these CLEs appear in a two mechanisms is further highlighted by our recent RNA-seq
development-specific manner, CLEs spliced from PRPF6 and analyses performed on embryos with a null mutation in snRNP70,
DPYSL3 genes showed consistent upregulation in three time- a conserved component of the U1 snRNP58. We found that cryptic
points (Fig. 6f, g and Supplementary Fig. 6f). The latter gene is last exons only represent 0.3% of the total number of regulated
involved in positive regulation of axon guidance and genetic exons in the snRNP70 null mutants, with no overlap between the
variants of this gene have been previously implicated in ALS rare cryptic exons found in snrnp70 and those formed in sfpq
patients52. These results indicate that CLE repression is a mutants. These results indicate that SFPQ-mediated repression of
conserved function of SFPQ, and that CLE-terminated transcripts cryptic exons is independent from telescripting.
may play a role in SFPQ-associated disease states. Long introns have been also shown to be subject to recursive
splicing (RS), a multistep process promoting accuracy and efficiency
of intron excision59,60. Like CLEs, RS-sites appear primarily in long
Discussion introns in genes with neuronal function. RS-sites initially produce
Our study uncovers a critical role of SFPQ in repression of cryptic an RS-exon that is spliced to the upstream exon prior to being
last exons (CLEs). We show that CLEs are functionally relevant as excised at the subsequent round of splicing reactions. However,
regulators of gene expression output or/and a mechanism for typical RS-exons do not contain cleavage/polyadenylation
producing deleterious protein isoforms. Moreover, the CLE- sequences, so their inclusion does not truncate the transcript. In
repressing function of SFPQ is conserved in mouse and human, addition, recursive splicing creates a stereotypical saw-tooth pattern
indicating an important developmental role, with implications for of RNA-seq reads, which is not seen in the sfpq−/− RNA-seq data.
human pathology. Therefore, SFPQ and CLEs provide a distinct regulation modality
compared to telescripting and recursive splicing.
Mechanism of CLE formation. The presence of strong poly-
adenylation sites in CLE sequences suggests that the paucity of Pathology of cryptic transcripts. A notable feature of the SFPQ-
CLE-containing isoforms under normal physiological conditions repressed CLEs is the detrimental effect that they have on the
is due to active suppression of CLE cleavage/polyadenylation or/ function of their host genes. Upregulation of a cryptic exon could
and splicing. Our CLIP-qPCR experiments provide evidence for affect gene regulation and function through both co- and post-
8 NATURE COMMUNICATIONS | (2021)12:1918 | https://doi.org/10.1038/s41467-021-22098-z | www.nature.com/naturecommunicationsNATURE COMMUNICATIONS | https://doi.org/10.1038/s41467-021-22098-z ARTICLE
a Fisher’s exact test
b Wilcoxon test c
p = 3.8E-8 p = 1.20E-47 Cryptic LE
Control LE
Longer
n = 2,366 191
Mean Sfpq CLIP peaks
% of last exon events 100 1.0
Known
Intron scored
by length
0.1
Cryptic
0.5
50
0.0 0.0
Shorter
-150 0 0 150
0
CLE- Non-CLE
Distance relative to CLE(bp)
ed ted containing containing
lat ula
re gu eg
ot -r
N S fpq Introns from CLE-expressing genes
d e
Chr 6: 33450000 33550000 Chr 1: 77460000 77500000
CLIP peaks CLIP peaks
250 sfpqfl/fl 250 sfpqfl/fl
coverage
coverage
Read
Read
0 0
250 250 sfpq-/-
coverage
coverage
sfpq-/-
Read
Read
CLE CLE
0 0
Exon 9 Exon 10 Exon 3 Exon 4
Intron 9 Intron 3
mouse Exoc4 mouse Epha4
Homology: 77% 76% Homology: 73% 71%
zebrafish exoc4 CLE zebrafish epha4b CLE
Exon 9 Exon 10 Exon 3 Exon 4
f g
Chr 20: 62,613,000 62,614,000
Intron 1
50
∆PSI
VCPmu ctrl
(VCPmu vs ctrl)
iPSC
0
68 CLE up-regulated in VCPmu
50
0.6
0
0.4
50
VCPmu ctrl
0.2
NPC
0
0.0 50
0
50
VCPmu ctrl
pMN
0
50 CLE
0
iPSC NPC pMN MN mMN PRPF6
Fig. 6 The CLE-repressing function of SFPQ is conserved in mouse and human. a Bar plot of the proportion of unannotated (cryptic) last exons from
mouse cortical neurons grouped based on their regulation by Sfpq. Two-sided Fisher’s exact test was performed. b Introns from mouse CLE-expressing
genes were scored by their relative length and the distribution of these scores were plotted. The box bounds represent the first and third quartiles and the
black lines at the middle of the boxes show the medians. Top and/or bottom whiskers represent 1.5x of the range between the third and the first quartiles
(interquartile range). Circles represent outliers. Two-sided Wilcoxon rank-sum test was performed. c Metaplot of the mean number of Sfpq CLIP peaks
(±SEM) in region surrounding cryptic last exons or constitutive last exons of the same gene (control). d, e CLIP-seq peak distribution (top) and RNA-seq
coverage plots (mid) from representative CLE-containing introns. The Y-axis scale of the read coverage plots is optimized for CLE/intronic reads. Sequence
homology of flanking exons from orthologous CLE-containing genes is compared and the relative position of zebrafish CLEs is shown at the bottom.
f Heatmap illustrating increased inclusion (ΔPSI) of 68 CLEs upregulated in ALS-mutant background at different stages of neuronal differentiation. ΔPSI
values of non-significant events are set to 0. Induced pluripotent stem cells (iPSC); neural precursors (NPC); “patterned” precursor motor neurons (ventral
spinal cord; pMN); post-mitotic but electrophysiologically immature motor neurons (MN); electrophysiologically mature MNs (mMN). g Representative
RNA-seq coverage plots from ALS-derived iPSC dataset of CLEs upregulated in VCPmu samples.
NATURE COMMUNICATIONS | (2021)12:1918 | https://doi.org/10.1038/s41467-021-22098-z | www.nature.com/naturecommunications 9ARTICLE NATURE COMMUNICATIONS | https://doi.org/10.1038/s41467-021-22098-z
transcriptional effects. Premature termination has been shown to growth. Wild-type fish were AB strain from the Zebrafish International Resource
act as a means of transcriptional control61, and while the exact Center (ZIRC), while sfpq null mutants were sfpqkg4126.
relationship between the use of CLEs and the expression of full-
length transcripts depends on the gene (Fig. 1f, g and Supple- RNA-seq and 3′ mRNA-seq. RNA was extracted from 24 hpf sfpq−/− embryos
mentary Fig. 1c), at least a subset of CLEs appear to form at the and their heterozygous or homozygous wild-type siblings using the RNeasy Mini
Kit (Qiagen). Enriched mRNA was sequenced using the Illumina HiSeq 2500 with
expense of longer isoforms. Once transcribed, CLE transcripts 50 bp paired-end reads. Libraries for 3′ mRNA-seq was prepared and sequenced by
with their differing 3′-terminal sequences may show altered Lexogen using using QuantSeq 3′ mRNA-Seq Library Prep Kit FWD for Illumina.
patterns of stability, subcellular localization, or translation.
Indeed, changes to last exon usage have been shown to be par- 3′ RACE. RNA was extracted from 24 hpf sfpq−/− embryos using the RNeasy Mini
ticularly important in localizing transcripts to particular neuronal Kit (Qiagen). Reverse transcription was performed using the 3′ RACE System for
compartments9. Finally, once translated, some short peptides may Rapid Amplification of cDNA Ends (ThermoFisher). cDNA was amplified in two
have novel or dominant negative functions compared to the full- subsequent PCR reactions, using the adapter primer as a reverse primer and the
length protein products. primers listed in Supplementary Data 9 as forward primers. After the second
amplification step, PCR products were gel-purified and sequenced directly.
We previously showed that loss of sfpq leads to an array of
morphological and neurodevelopmental abnormalities in zebra-
fish embryos, including loss of brain boundaries and altered CLIP-qPCR. Dechorionated 24 hpf wild-type fish were irradiated (twice at 0.8 J/
cm2, 254 nm) and deyolked using high calcium Ringer’s solution (116 mM NaCl,
motor axon morphology26. However, the mechanism by which 2.9 mM KCl, 10 mM CaCl2, 5 mM HEPES, pH 7.2) with 0.3 mM PMSF and 1 mM
those abnormalities formed was unresolved. Here, we found that EDTA. After several washes, embryos were lysed using PXL buffer (0.1% SDS, 0.5%
CLEs contribute to at least one aspect of the sfpq phenotype: the deoxycholate, 0.5% NP-40) and homogenized using a plastic pestle. Lysates were
dominant negative epha4b truncated transcript induces hindbrain treated with 10 μL diluted RNAseI (1:500 dilution; Thermo Fisher) and 2 μL Turbo
DNase (Thermo Fisher) at 37 °C for 3 min on a shaking incubator. Protein-RNA
boundary defects. Moreover, a subset of the CLE-terminated complexes were purified by centrifugation and 5% of the lysate was retained as
short transcripts identified in sfpq−/− is predicted to affect axon input. The remaining lysate were split into two and its volume were topped up to
growth and connectivity. 100 μL using PXL buffer. In all, 100 μL of protein A Dynabeads (Thermo Fisher)
While CLE formation is clearly detectable under pathological primed with 10 μg of either anti-SFPQ antibody (ab38148) or anti-IgG antibody
(MA5-14453) were added to each lysate and incubated at 4 °C for an hour on a
conditions of loss of sfpq, our data do not preclude the possibility of rotator. Bound SFPQ-RNA complexes were purified and washed thrice in high salt
CLEs being expressed under non-pathological conditions. Although wash buffer (50 mM Tris-HCL, pH 7.4, 1 M NaCl, 1 mM EDTA, 1% Igepal, 0.1%
the CLEs are not annotated in the current zebrafish, mouse, and SDS, 0.5% sodium deoxycholate). Subsequently, bound complexes were washed
human genomes, it is possible that they may be regulated in a twice in PNK wash buffer (20 mM Tris-HCL, pH 7.4, 10 mM MgCl2, 0.2% Tween-
20) and followed by proteinase K digestion (Thermo Fisher). Bound RNAs were
spatio-temporal manner such that they only appear in select tissues purified using phenol–chloroform extraction followed by reverse transcription to
or cell types at specific developmental time points. Indeed, this generate cDNAs. Relative amounts of SFPQ-bound RNAs was quantified by qPCR
possibility is supported by the relatively low expression of SFPQ in using primers: (Supplementary Data 9).
non-neuronal tissue25,26, and by low-level detection of the epha4b
CLE transcript in siblings by RT-PCR (Supplementary Fig. 5c). CRISPR/Cas9. gRNAs were formed from chemically synthesized Alt-R®-modified
Early termination of long pre-mRNAs has been shown to be a crRNAs from Integrated DNA Technologies (IDT). Each crRNA was suspended in
developmentally controlled regulatory mechanism: the RNA- duplex buffer to 100 μM concentration, then a crRNA:tracrRNA duplex was
binding protein Sex-lethal promotes the formation of truncated formed by combining 3 μl crRNA, 3 μl 100 μM tracrRNA, and 19 μl duplex buffer
at 95 °C for five minutes, then cooled to room temperature and stored at −20 °C.
transcripts during short nuclear cycles in Drosophila62, and To make gRNA:Cas9 RNP complexes, a mix was formed as follows: 1.5 μl each
downregulation of the cleavage and polyadenylation factor PCF11 gRNA, 0.75 μl 2 M KCl, 1.25 μl EnGen Spy Cas9 NLS (NEB). The mix was incu-
during differentiation of mouse C2C12 myoblast cells suppresses bated at 37 °C for 5 min, then brought to room temperature. One nanoliter of the
intronic polyadenylation to promote expression of long genes63. gRNA:Cas9 complex was injected into embryos at the 1-cell stage. The gRNAs used
are listed in Supplementary Data 9.
Further examination of CLE expression in wild-ype animals across
development may identify possible role of these truncated
transcripts in normal tissues. RNA and morpholino injections. The epha4b cryptic transcript was amplified
from cDNA and inserted into the multi-cloning site of plasmid pCS2 + (Addgene).
To make the early stop-containing transcript, site-directed mutagenesis was per-
Cryptic exons in neurodegenerative disease. Neurodegenerative formed using Quikchange Site-Directed Mutagenesis Kit (Agilent). The in-vitro
transcription reaction was performed on linearized plasmid using the mMessage
diseases such as Alzheimer’s, ALS, and FTD are frequently mMachine SP6 Transcription Kit (ThermoFisher), and the RNA was purified using
characterized by altered localization and function of splicing a Mini Quick Spin Column (Roche). In all, 100 pg RNA was injected into the
factors32,64–66. The ALS-associated proteins transactivation embryo at the one-cell stage.
response element DNA-binding protein 43 (TDP-43) and fused For morpholino knockdown of the epha4b cryptic exon, embryos were injected
in sarcoma (FUS) regulate alternative splicing and alternative into the yolk at the one-cell stage with 0.1 pmol of Epha4b splice junction
morpholino or mismatch (Supplementary Data 9).
polyadenylation67–72. TDP-43 has been shown to act as a
repressor of cryptic exons, a minority of which contain poly-
adenylation sites and thus would form CLEs72. Stathmin-2 is one In situ hybridization. Linearized plasmids containing the antisense sequence for
rfng73, deltaA74, or the epha4b cryptic exon were transcribed into RNA probes
of the latter and rescue of its normal full-length expression in using DIG labeling mix (Roche) according to the manufacturer’s instructions.
TDP-43-knockdown cell culture improves axonal growth in this Probes were purified using Mini Quick Spin Columns (Roche). In situ hybridiza-
model70,71, indicating that CLEs are pathogenic across various tion reaction was performed by fixing embryos in 4% PFA overnight, followed by
splicing protein-dependent pathologies. These findings place washing in PBST and methanol. Embryos were then rehydrated in PBST and
treated with 1 μl of 10 mg/ml Proteinase K (Sigma) in 1000 ml PBST for 15 min.
CLEs at the center of priority for understanding molecular Embryos were then fixed again in 4% PFA for 20 min and pre-blocked in Hyb mix
mechanisms of neurodegenerative diseases and developing new (1% Boehringer Block, 50% formamide, 4X SSC, 1 mg/ml torula mRNA, 0.1%
ways to diagnose and treat these increasingly prevalent disorders. CHAPS, 0.1% Tween-20, 5 mM EDTA, 100 μg/ml Heparin) for 4–6 h at 65 °C. In
total, 25 μl probe was diluted in 300 μl Hyb mix and incubated overnight with
embryos at 65 °C. Embryos were then washed in Hyb mix, followed by 2x SSC/
Methods CHAPS and 0.2x SSC/CHAPS. This was followed by a wash in MAB buffer (150
Zebrafish husbandry. Zebrafish (Danio rerio) were reared in accordance with the mM NaCL, 100 mM Maleic Acid, 0.1% Tween-20) and incubation in MAB/
Animals (Scientific Procedures) Act 1986 under CH Home Office Project License blocking solution (2% Roche Blocking Solution in 1x MAB), both at room tem-
70/7577. Fish were maintained on a 14-h light/10-h dark cycle at 28 °C. Embryos perature. Anti-DIG-AP antibody (Roche) was added 1:4000 overnight at 4 °C.
were cultured in fish water containing 0.01% methylene blue to prevent fungal Embryos were washed in MAB for a full day, then developed using NTMT (50 mM
10 NATURE COMMUNICATIONS | (2021)12:1918 | https://doi.org/10.1038/s41467-021-22098-z | www.nature.com/naturecommunicationsNATURE COMMUNICATIONS | https://doi.org/10.1038/s41467-021-22098-z ARTICLE
MgCl2, 100 mM NaCl, 100 mM Tris-HCl pH 9.5, 0.1% Tween-20) supplemented (ftp://ftp.ensembl.org/pub/release-75/gtf/homo_sapiens/Homo_sapiens.
with NBT/BCIP (Roche). GRCh37.75.gtf.gz) files.
To construct CLE-containing transcripts, read alignments from Whippet were
qPCR. RNA was extracted from 24 to 28 hpf sfpq−/− embryos and heterozygous sorted, indexed and assembled using the StringTie program76. Ensembl’s GRCz10
transcriptome was used as reference and assembly was done for each biological
or WT siblings using the RNease Mini Kit (Qiagen). Embryos were identified based
replicate as follows:
on phenotype, and 30 embryos were pooled together for each RNA extraction. In
stringtie -p -o- G
all, 1 μg of extracted RNA was used in a reverse transcriptase reaction using the
Assembled transcripts from each sample were subsequently combined using
Superscript III First Strand cDNA Synthesis Kit (Invitrogen). In all, 250 ng of
StringTie’s merge function using GRCz10 annotations as reference. CLE-
cDNA was used in qPCR reactions with the LightCycler 480 SYBR Green I Master
containing isoforms were identified by intersecting exon coordinates from the
Mix (Roche). Each sample was compared against a B-actin control reaction.
merged transcript assembly with CLE coordinates from Whippet delta analysis
output. Intersection operation was done in R using Bioconductor’s GenomicRanges
Bioinformatics. For expression and splicing analyses of 24 hpf sfpq−/− RNA-seq package77. Analyses on the coding potential of CLE isoforms and its functional loss
data using Cufflinks package40, reads were mapped to zebrafish GRCz9 assembly of protein domains were carried out using custom R-scripts.
and differential expression analysis were carried out using default settings. For the analyses of introns from which the CLEs were spliced from, intronic
For expression and splicing analyses of 24 hpf sfpq−/− RNA-seq data using features were extracted from the custom-assembled transcript in R using
Whippet pipeline41, a GRCz10 Ensembl-based index was generated using Bioconductor’s GenomicFeatures package77. A list of the largest, non-overlapping
Whippet’s index building function from the Ensembl-based fasta (ftp://ftp.ensembl. introns was generated and annotated for an overlap with a CLE segment using
org/pub/release-91/fasta/danio_rerio/dna/Danio_rerio.GRCz10.dna.toplevel.fa.gz) GenomicRanges’ reduce and subsetByOverlaps functions respectively. The relative
and gene annotation files (ftp://ftp.ensembl.org/pub/release-91/gtf/danio_rerio/ position of CLEs within its intron was determined using psetdiff operation followed
Danio_rerio.GRCz10.91.gtf.gz). Quantification of aligned RNA-seq reads were by extracting the width of the upstream intronic segment. To determine if CLEs are
done as follows: spliced from very large introns by chance, we applied weights to each intron found
whippet-quant.jl read1.fastq.gz read2.fastq.gz --biascorrect -x index.jls in CLE-containing genes proportional to its size and sampled, with replacement,
-o --sam one intron per gene for 10 or 100 iterations using the sample() function in R.
The above quantification function outputs gene and isoform level read count For the analyses of CLE conservation, 8-way PhastCons and PhyloP score data
matrices. Differential gene or isoform expression analyses were identified using the were downloaded from UCSC (http://hgdownload.soe.ucsc.edu/goldenPath/
edgeR package with the estimateGLMRobustDisp function75. Differential splicing danRer7/phastCons8way/fish.phastCons8way.bw and http://hgdownload.soe.ucsc.
events were identified using Whippet’s delta analysis function with default edu/goldenPath/danRer7/phyloP8way/fish.phyloP8way.bw). Coordinates of CLE-
parameters. An event with a Probability score exceeding 80% is classified as containing introns were converted to GRCv9 using UCSC’s LiftOver function and
significantly regulated. Type of splicing event for each alternative exon was binned into 1 kb sequence using a sliding window technique (1 bp steps). Average
determined from Whippet’s output file under column Type. Alternative exons PhastCons score of each bin was calculated using bedtools’ “map” function and
which are not currently annotated in the GRCz10 assembly are classified as bins containing CLE were annotated through intersection. Conservation scores of
“cryptic” using custom R-scripts. each CLE and 250 nt of its flanking introns were calculated using the same tool. To
To determine if CLE-containing transcripts are polyadenylated, 3′ mRNA-seq refine the conservation regions surrounding the intron-CLE borders, average
data were trimmed to remove adapter contamination, polyA read-through and PhastCons score were calculated for 10 nt windows including 30 nt of each
low-quality tails using BBDuk (https://jgi.doe.gov/data-and-tools/bbtools/bb-tools- exonic ends.
user-guide/bbduk-guide/): For the analyses of SFPQ-binding motifs within sequences surrounding CLEs,
bbduk.sh in = input_1.fastq out = output_1.fastq ref = rbpmap.technion.ac.il/download.html) and manually converted into a MEME
k = 13 ktrim = r useshortkmers = t mink = 5 qtrim = r trimq = 10 minlength = 20 motif format (http://meme-suite.org/doc/meme-format.html). Occurrence of SPFQ
Trimmed reads were aligned to GRCz10 genome using HISAT2 (https://www. binding sites was analyzed using MEME’s FIMO program (http://meme-suite.org/
nature.com/articles/s41587-019-0201-4) with spliced alignment disabled: doc/fimo.html) using the following parameters:
hisat2 -p --no-spliced-alignment -x fimo --thresh 0.005 --o
-U trimmed_read1.fastq -S output.sam The average number of SFPQ-binding motifs were calculated for 25 nt windows
Reads mapping upstream of internal (A) homopolymers (10 consecutive of flanking intronic sequence including 25 nt of each exonic ends.
adenosines with one allowed mismatch within a 20-nt window) were removed For the analyses of acceptor splice site strengths, 23 nt sequence of the intron-
using custom scripts. The last nucleotide of the remaining reads mapping to known exon border (20 nt intron and 3 nt exon) of CLEs or control last exons were
genes was annotated as a cleavage site (CS). Clusters of CSs were then generated by generated using custom R scripts. Scores for each sequence were predicted using
merging CSs which are within ≤10 nt of each other across all experimental samples. MaxEntScan model (Yeo and Burge, https://pubmed.ncbi.nlm.nih.gov/15285897/).
CS clusters were further refined by keeping clusters containing ≥3 reads in at least Sequence logo depicting the consensus 3′ splice site sequence was plotted using
one sample as well as having a consensus PAS hexamer (ATTAAA or AATAAA) WebLogo (https://weblogo.berkeley.edu/logo.cgi)
within a 50-nt window (40 nt upstream and 10 nt downstream) of the middle of CS
clusters.
Reporting summary. Further information on research design is available in the Nature
CS clusters were next assigned to CLE-containing genes (Supplementary
Research Reporting Summary linked to this article.
Fig. 2a). Clusters are assigned to cryptic last exons if located between the start of
CLE and 3′ end of its downstream intron. Clusters belong to control last exons if
found within the last constitutive exon of its gene or within 50-nt downstream Data availability
padding. Quantification of relative cleavage/polyadenylation efficiency (RCE) for The RNA-seq data analyzed in Figs. 1 and 3 is available at ArrayExpress, accession
each last exon was calculated as number E-MTAB-9113. The 3′ mRNA-seq data analyzed in Fig. 2 is available at
ArrayExpress, accession number E-MTAB-9899. The data supporting the findings of this
Ne
RCE ¼ ð1Þ study are available from the corresponding authors upon reasonable request. Source data
∑ni¼0 Ni are provided with this paper.
where Ne is the total number of reads matching cleavage/polyadenylation clusters
belonging to exon e, and n is the total number of reads mapping to cleavage/ Code availability
polyadenylation clusters in the same gene. Statistical significance changes in Computer code used in this study is described in the Methods section.
cleavage efficiency was determined using two-tailed Fisher’s exact test by
comparing Ne and (∑ni¼0 Ni Nk ) values between experiments. FDR was calculated
using Benjamini-Hochberg correction method. Normalized change in RCE statistic Received: 5 April 2020; Accepted: 24 February 2021;
between experimental (e) and control (c) samples were calculated as
RCEe RCEc
ΔRCEnorm ¼ ð2Þ
RCEe þ RCEc
For analyses of conditional Sfpq knock-out mouse model23 dataset, the above References
Whippet pipeline was carried out using Ensembl’s GRCm38 fasta (ftp://ftp. 1. Holt, C. E. & Schuman, E. M. The central dogma decentralized: new
ensembl.org/pub/release-99/fasta/mus_musculus/dna/Mus_musculus.GRCm38. perspectives on RNA function and local translation in neurons. Neuron 80,
dna.toplevel.fa.gz) and annotation (ftp://ftp.ensembl.org/pub/release-99/gtf/ 648–657 (2013).
mus_musculus/Mus_musculus.GRCm38.99.gtf.gz) files. For analyses of conditional 2. Hanus, C. & Schuman, E. M. Proteostasis in complex dendrites. Nat. Rev.
ALS-derived iPSC differentiation dataset31, the above Whippet pipeline was carried Neurosci. 14, 638–648 (2013).
out using Ensembl’s GRCh37 fasta (ftp://ftp.ensembl.org/pub/grch37/current/fasta/ 3. Cagnetta, R., Frese, C. K., Shigeoka, T., Krijgsveld, J. & Holt, C. E. Rapid cue-
homo_sapiens/dna/Homo_sapiens.GRCh37.dna.toplevel.fa.gz) and annotation specific remodeling of the nascent axonal proteome. Neuron 99, 29–46 (2018).
NATURE COMMUNICATIONS | (2021)12:1918 | https://doi.org/10.1038/s41467-021-22098-z | www.nature.com/naturecommunications 11You can also read