ACTIVE TECTONICS OF THE ONSHORE HENGCHUN FAULT USING UAS DSM COMBINED WITH ALOS PS-INSAR TIME SERIES (SOUTHERN TAIWAN) - NHESS
←
→
Page content transcription
If your browser does not render page correctly, please read the page content below
Nat. Hazards Earth Syst. Sci., 18, 829–845, 2018
https://doi.org/10.5194/nhess-18-829-2018
© Author(s) 2018. This work is distributed under
the Creative Commons Attribution 3.0 License.

Active tectonics of the onshore Hengchun Fault using UAS DSM
combined with ALOS PS-InSAR time series (Southern Taiwan)
Benoit Deffontaines1 , Kuo-Jen Chang2 , Johann Champenois3 , Kuan-Chuan Lin4 , Chyi-Tyi Lee5 , Rou-Fei Chen6 ,
Jyr-Ching Hu4 , and Samuel Magalhaes7
1 LAREG   Unit (IGN-UDD-IPGP-UPEM), LaSTIG (IGN-UPEM), Université Paris-Est,
77454 Marne-la-Vallée, France
2 Department of Civil Engineering, National Taipei University of Technology,

10654 Taipei, Taiwan
3 Laboratoire Tectonique et Mécanique de la lithosphère, IPGP, 75005 Paris, France
4 Department of Geosciences, National Taiwan University, 10617 Taipei, Taiwan
5 Department of Applied Geology, Central Taiwan University, 32001 Chungli, Taiwan
6 Department of Geology, Chinese Culture University, 11114 Taipei, Taiwan
7 Alphageomega, 62 Rue du Cardinal Lemoine 75005 Paris, France

Correspondence: Kuo-Jen Chang (epidote@ntut.edu.tw)

Received: 31 January 2017 – Discussion started: 14 February 2017
Revised: 13 January 2018 – Accepted: 12 February 2018 – Published: 15 March 2018

Abstract. Characterizing active faults and quantifying their      lateral transpressive fault. As the Hengchun ridge was the lo-
activity are major concerns in Taiwan, especially following       cation of one of the last major earthquakes in Taiwan (26 De-
the major Chichi earthquake on 21 September 1999. Among           cember 2006, depth: 44 km, ML = 7.0), Hengchun Peninsula
the targets that still remain poorly understood in terms of ac-   active tectonics must be better constrained in order if possi-
tive tectonics are the Hengchun and Kenting faults (South-        ble to prevent major destructions in the near future.
ern Taiwan). From a geodynamic point of view, the faults af-
fect the outcropping top of the Manila accretionary prism of
the Manila subduction zone that runs from Luzon (northern
Philippines) to Taiwan. In order to better locate and quantify    1   Introduction
the location and quantify the activity of the Hengchun Fault,
we start from existing geological maps, which we update           The island of Taiwan is the location of the rapid NW–SE-
thanks to the use of two products derived from unmanned air-      trending oblique convergence of the Eurasian and Philippine
craft system acquisitions: (1) a very high precision (< 50 cm)    sea plates (e.g., Ho, 1986, 1988). A southwest propagation
and resolution (< 10 cm) digital surface model (DSM) and          of the deformation in Taiwan was proposed by Suppe (1981,
(2) a georeferenced aerial photograph mosaic of the studied       1984). It has been confirmed by continuous GPS measure-
area. Moreover, the superimposition of the resulting struc-       ments that highlight displacements in Southern Taiwan of
tural sketch map with new Persistent Scatterer Interferomet-      about 60 mm yr−1 (e.g., Yu et al., 1997). This local shorten-
ric Synthetic Aperture Radar (PS-InSAR) results obtained          ing rate is the maximum range in the world. We focus on the
from PALSAR ALOS images, validated by Global Position-            Southern Taiwan area (Hengchun Peninsula) that is geody-
ing System (GPS) and leveling data, allows the characteriza-      namically interpreted as the Taiwan incipient collision zone
tion and quantification of the surface displacements during       (Lallemand et al., 2001, Fig. 1), which is the transition of
the monitoring period (2007–2011). We confirm herein the          the Manila subduction area toward onshore Taiwan collision.
geometry, characterization and quantification of the active       The Hengchun Peninsula is situated at the summit of the out-
Hengchun Fault deformation, which acts as an active left-         cropping onshore Manila accretionary prism (Malavieille et
                                                                  al., 2002; Chang et al., 2003).

Published by Copernicus Publications on behalf of the European Geosciences Union.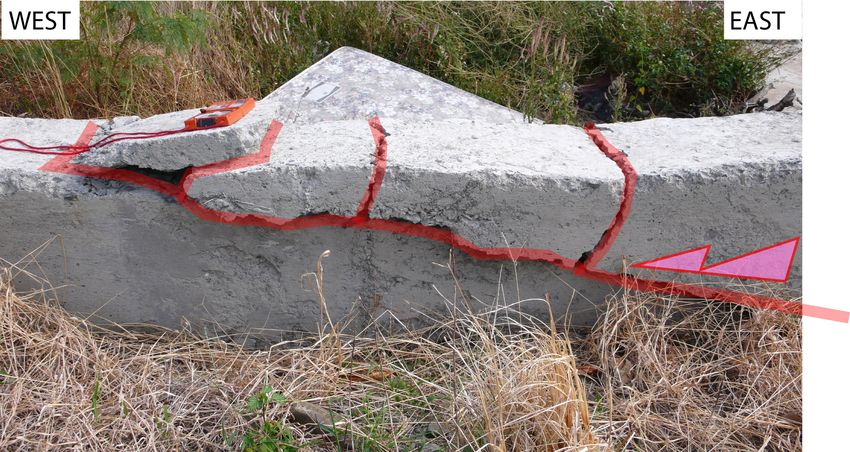
830                                                     B. Deffontaines et al.: Active tectonics of the onshore Hengchun Fault

                                                                       This is a geologically complex area, as its lithology is
                                                                    composed of both soft folded turbidites (Mutan formation)
                                                                    and the Kenting Mélange, situated close to the Hengchun
                                                                    Fault zone (Fig. 1) and composed of highly deformed shales
                                                                    and large blocks of various lithologies. Evidence of this
                                                                    structural complexity are the five different 1/50 000 scale ge-
                                                                    ological maps (Huang et al., 1997, 2006; Chang et al., 2003,
                                                                    2009b; Zhang et al., 2016) that have been drawn indepen-
                                                                    dently and that are geologically incompatible. Two different
                                                                    major NNW–SSE-trending fault zones (Hengchun and Kent-
                                                                    ing faults) are parallel to the eastern side of the 15 km long
                                                                    Hengchun Valley and have been recognized by previous au-
                                                                    thors as potentially active (e.g., Huang et al., 1997, 2006;
                                                                    Chang, et al., 2003, 2009a). In addition, these two faults af-
                                                                    fect soft, muddy and alluvial deposits and classical microtec-
                                                                    tonics; structural studies are impossible as there is no clear
                                                                    preserved fault plane and it is impossible to get any tectonic
                                                                    markers. As the Hengchun Peninsula is the location of sen-
                                                                    sitive structures, such as the Taipower Nuclear Power Plant
                                                                    No. 3 (Maanshan Nuclear Power Plant), it is a major concern
                                                                    to better decipher the neotectonics and the active tectonics
                                                                    of the area. Consequently, we address in this paper an in-
                                                                    direct approach using an unmanned aircraft system (UAS),
                                                                    a digital elevation model (DEM), structural photointerpreta-
                                                                    tion and quantitative measurements in order to locate, char-
                                                                    acterize and quantify the active deformation of the Hengchun
                                                                    Fault.
                                                                       Below, we first focus on the inputs of a high-resolution
                                                                    DEM and the orthorectified images of the Hengchun Fault
                                                                    zone acquired from UAS in order to locate active faults.
                                                                    From a terminological point of view, we used a UAS,
Figure 1. Location of the Hengchun and Kenting faults within        which encompasses all the aspects of deploying those air-
Southern Taiwan. (a) Location of the Hengchun Peninsula (mod-       crafts and is less restrictive than an unmanned aerial ve-
ified from Google Earth; studied area: white quadrangle; EUP:       hicle (UAV), which corresponds only to the platform it-
Eurasian Plate; PSP: Philippine Sea Plate). The rate convergence    self. Then, following the classical photointerpretation tech-
of the Philippine Sea Plate toward Eurasia is 82 mm yr−1 (Yu et     niques (e.g., Deffontaines et al., 1991), we carefully mapped
al. 1997). (b) Western Hengchun Peninsula hill shade from the       and interpreted the new morphostructures in terms of geo-
5 m ground-resolution digital terrain model: the heavy red lines    logical mapping, revealing the active tectonic structures us-
are Hengchun and Kenting faults (modified from Sung, 1991,
                                                                    ing a high-resolution and high-precision UAS digital surface
and Chang et al., 2009b). The black triangles are GPS stations;
blue and yellow arrows represent horizontal and vertical GPS dis-
                                                                    model (DSM). In order to characterize and quantify their tec-
placements, respectively; and the green quadrangle corresponds to   tonic activity, we benefit from Persistent Scatterer Interfer-
the UAS-monitored area. A–A’ is the location of the (c) W–E-        ometry Synthetic Aperture Radar (PS-InSAR hereafter) re-
trending synthetic geological cross section (modified from Chang    sults derived from ALOS radar images that give us the active
et al., 2009b; Zhang et al., 2016). Ma: Ma’anshan formation; Mt     interseismic displacement along the line of sight (LOS) of
and Mtg: different facies of Mutan formation (Mtg: Loshui sand-     the radar through the 2007–2011 period. The latter is val-
stone; CGS geological map); HcL: Hengchun limestone; Al: Allu-      idated by two E–W-trending precise leveling lines across
vial deposits; KeM: Kenting Mélange; HeF: Hengchun Fault; KeF:      the Hengchun Fault and a few GPS stations (see Academia
Kenting Fault. (1) Black circles are cities (CC: Checheng; HC:      Sinica GPS, 2018, with a reference line in between Taipei
Hengchun; FS: Fang-Shan); (2) red circle is the location of pho-    and the Penghu Island) that give the local vertical and abso-
tograph in Fig. 6); (3) orange circle is the Nuclear Power Plant
                                                                    lute 3-D displacements, respectively. Finally, the discussion
No. 3; (4) white star is the GPS ground fixed station GS59 and
base of this PS-InSAR data set. The fault displacements come from
                                                                    leads us to propose a simple geodynamic and active tectonic
Chang et al. (2003).                                                model for the Hengchun Fault that fits with all the available
                                                                    data.

Nat. Hazards Earth Syst. Sci., 18, 829–845, 2018                             www.nat-hazards-earth-syst-sci.net/18/829/2018/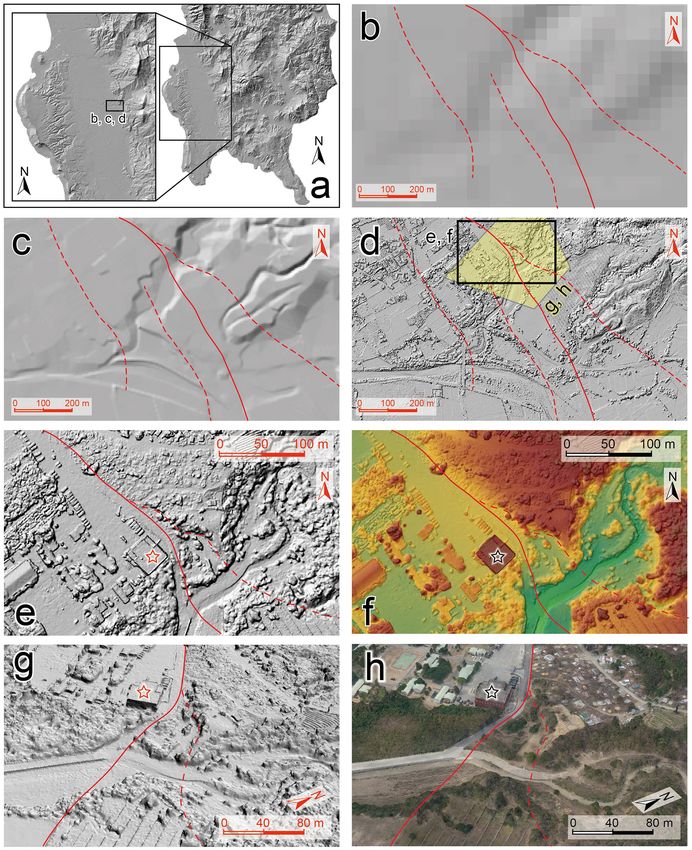
B. Deffontaines et al.: Active tectonics of the onshore Hengchun Fault                                                                       831

Figure 2. (a) UAS digital terrain model (DTM) and (b) mosaic of orthorectified images. The black hexagons, red circles and rectangles indi-
cate cities, ground control points and check points, respectively. One may notice the contrasting relief on both sides of the Hengchun Valley:
its western flank is a homogenous structural surface slightly dipping east, in contrast with the highly eroded eastern part. For both (a) and (b),
the black and white hill-shade DTMs correspond to a part of the 5 m ground-resolution Taiwan DTM.

2   High-resolution DSM obtained from UAS                                  pling distance. The coverage of the adjacent photos is kept
                                                                           at 85 % overlap and 45 % side lap. The raw images are pro-
                                                                           cessed by ContextCapture and Pix4Dmapper software mutu-
A UAS, commonly known as a drone, is an aircraft without                   ally; the data sets generated in this study are orthoimages and
human pilot on board that flies autonomously and is being                  DSMs, with a grid spacing of 10 cm. Prior to the morpho-
used in many areas because of its convenience, high resolu-                tectonic analysis (e.g., Deffontaines and Chorowicz, 1991;
tion, etc. (Huang and Chang, 2014; Fernandez Galarreta et                  Deffontaines et al., 1993, 1994, 1997, 2017; Pubellier et al.,
al., 2015; Giordan et al., 2015; Tokarczyk et al., 2015; Büh-              1994), the quality of the data set (see whole data set in Fig. 2)
ler et al., 2016; Deffontaines et al., 2017). The UAS used in              needs to be evaluated. Eighteen ground control points are
this study is a modified version of the already-available Sky-             extracted with grid size of 2 m resolution of airborne light
walker X8 delta-wing aircraft reinforced by carbon fiber rods              detection and ranging (lidar) data set and from the airborne
and covered partially by Kevlar fiber sheets. The drone is                 lidar-associated 25 cm resolution orthorectified image. Most
launched by hand, flies and takes photos autonomously, then                of the ground control points are situated on crossroads, tar-
glides back down to the ground by using a pre-programmed                   geted and georeferenced from orthorectified images, and the
flight plans organized by a ground control system; it is con-              elevation is from the airborne lidar data. The comparison of
trolled by the ground control station and remote controller.               the UAS DSM with airborne lidar data gives a root-mean-
The autopilot system used in this study is composed of and                 square deviation of 4.1 cm with maximum error of 42.5 cm
modified from the open-source APM (ArduPilot Mega 2.6                      from 26 sites of open, bare ground area, e.g., roads, school
autopilot) firmware and open-source software Mission Plan-                 playgrounds, unvegetated terrains and parking lots. The ele-
ner, transmitted by ground–air XBee telemetry. In order to                 vation of the check points is averaged from an area of 4 m2 ,
generate a high-resolution DSM (defines the terrain data in-               equal to the grid size of airborne lidar data. The distribution
cluding buildings and tree canopy) and mosaic orthorectified               of the ground control points and checked points are located in
images, a total of 3767 photos were gathered by Sony ILCE-                 Fig. 2b. Figure 3 highlights the precision and resolution dif-
QX1 camera mounted on the crafts, during five fly missions,                ference on the available topographic data sets. The 40 m grid
for a total coverage area of 33 km2 with 8 cm ground sam-

www.nat-hazards-earth-syst-sci.net/18/829/2018/                                       Nat. Hazards Earth Syst. Sci., 18, 829–845, 2018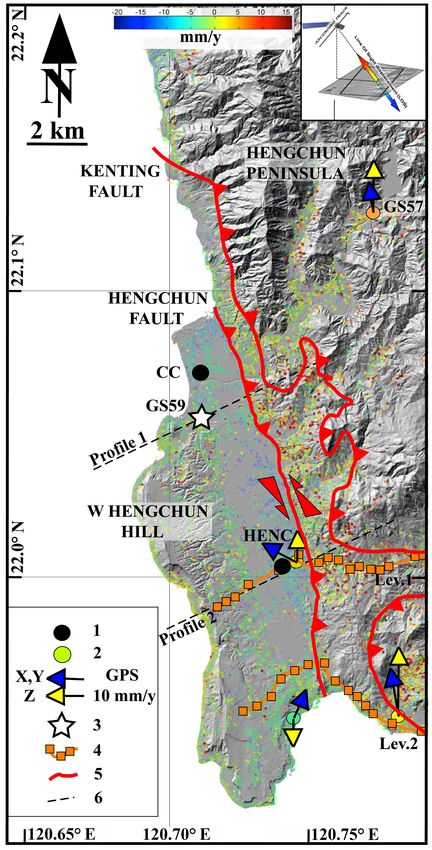
832                                                         B. Deffontaines et al.: Active tectonics of the onshore Hengchun Fault

Figure 3. Comparisons of topographic digital data sets for the same area acquired from different sources, including 40 m DTM, 5 m DEM and
0.13 m UAS DSM. Heavy and dashed (inferred) red lines correspond to fault lines. (a) Location of the data set of panels (b, c, d); (b) 40 m
resolution DTM commonly used in Taiwan; (c) 5 m resolution DEM generated in 2003; (d) 0.13 m resolution UAS-derived DSM generated
in this study. There are great differences in the quality of the different digital topography. Panels (e) and (f) highlight different parts of the
UAS DSM: (e) enlargement of the hill-shaded UAS DSM, (f) enlargement of color-shaded UAS DSM, (g) side view of the hill-shaded true
3-D model and (h) side view of the image draped onto the true 3-D model (g). The side views of panels (g) and (h) are captured at the same
position and orientation. The star indicates the same building shown in panels (f), (g) and (h). The locations of panels (b), (c) and (d) are
indicated in panels (a), whereas panels (e) and (f) are indicated in panel (d). One can see the quality of the newly acquired UAS DSM that
enable us to photointerpret precisely the location of the geology and the faults.

DEM was generated in 1986 by the Aerial Survey Office                      istry of the Interior. The airborne lidar data were acquired
from aerial photos, the 5 m grid DEM was generated by sev-                 in 2011 and used to generated a 2 m grid DTM (defines the
eral aerial photogrammetric agencies in 2004, whereas most                 geomorphologic elevation after removing the buildings, trees
of the aerial photos were acquired in 2003. The project to                 and vehicles) and DSM, but this data set is not authorized to
create a 5 m DEM data set was funded by the Taiwan Min-                    be published even though it was generated by the authors.

Nat. Hazards Earth Syst. Sci., 18, 829–845, 2018                                      www.nat-hazards-earth-syst-sci.net/18/829/2018/
B. Deffontaines et al.: Active tectonics of the onshore Hengchun Fault 833
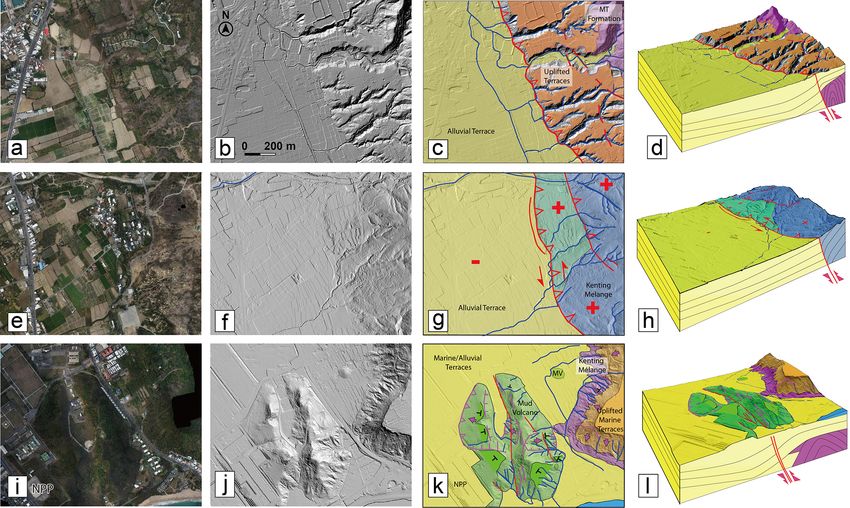
Figure 4. Three geological photointerpretation case examples taken from north to south of the Hengchun UAS digital elevation model
(DEM). Each box covers the same area (1.3 km × 1.1 km): (a, e, i) mosaic of the georeferenced aerial photographs (orthophoto) of each
study area. (b, f, j) Black and white hill-shading relief from UAS-derived DTM. (c, g, k) Geological map from the high-resolution hill-shade
DTM where the heavy red line corresponds to the Hengchun Fault and the blue line to the drainage. In light yellow are the quaternary alluvial
and marine terraces, in purple and light blue, due to the DTM transparency, is the Kenting Mélange, in brown are the uplifted marine terraces,
in light green is the mud volcano and in dark green its associated structural surface (chevrons with radial outward dips in black line). Purple
lines are the boundaries of landslides; + are the uplifted areas; − is the subsiding area; NPP is Taiwan Nuclear Power Plant No. 3 (see
location Fig. 1) mud volcano. (d, h, l) 3-D geological mapping with associated geological cross sections, showing the Hengchun Fault at
depth (red arrows: active fault displacements; blue lines: rivers). The first line of images highlights the active tectonic scarp of the Hengchun
Fault, which differentiates two blocks: uplifted (+), locally eroded terraces to the east and a flat lowland sedimentation area to the west. The
second line of images highlights the left-lateral offset geometry (red arrows) of tributaries (blue line) on a glacis which is uplifted (+) to the
east of the Hengchun Fault. The third line of images shows a deformed N–S-trending elongated mud volcano (MV – Ma’anshan) previously
evidenced by Giletycz (2015), situated close to NPP (see infrastructures on the lower left corner of the deformed mud volcano) and a flat,
uplifted (+) terraces (paleosurface of Fig. 6) on the western side of the captions.
The ground control points used in this study were extracted 3 Geology of the Hengchun area
from the airborne lidar data set we acquired some years ago.
Figure 3 highlights visually the difference of quality, preci- 3.1 Hengchun geological state of the art
sion and resolution of each digital topographic data set. One
can see the low quality of the 40 m DEM in contrast to the
From a geologic and geodynamic point of view, the
precision and resolution of our UAS DSM. Figure 4 illus-
Hengchun Peninsula is interpreted as the northern tip of the
trates some case examples of the quality of both the UAS
Manila accretionary prism (Malavieille et al., 2002; Chang
DSM as well as the orthorectified image of the Hengchun
et al., 2003). It is mainly composed of several lithologi-
Fault. The morphostructures analyses based on photo inter-
cal formations that are described below from the older to
pretation are conducted accordingly (Fig. 4c, d, g, h, k, and
the younger ones (see their location on the cross section of
i).
Fig. 1c).
The Mutan formation is the largest outcropping formation
of the Hengchun Peninsula. Middle-to-late Miocene in age,
it is composed of folded classical turbidites made of shales
www.nat-hazards-earth-syst-sci.net/18/829/2018/ Nat. Hazards Earth Syst. Sci., 18, 829–845, 2018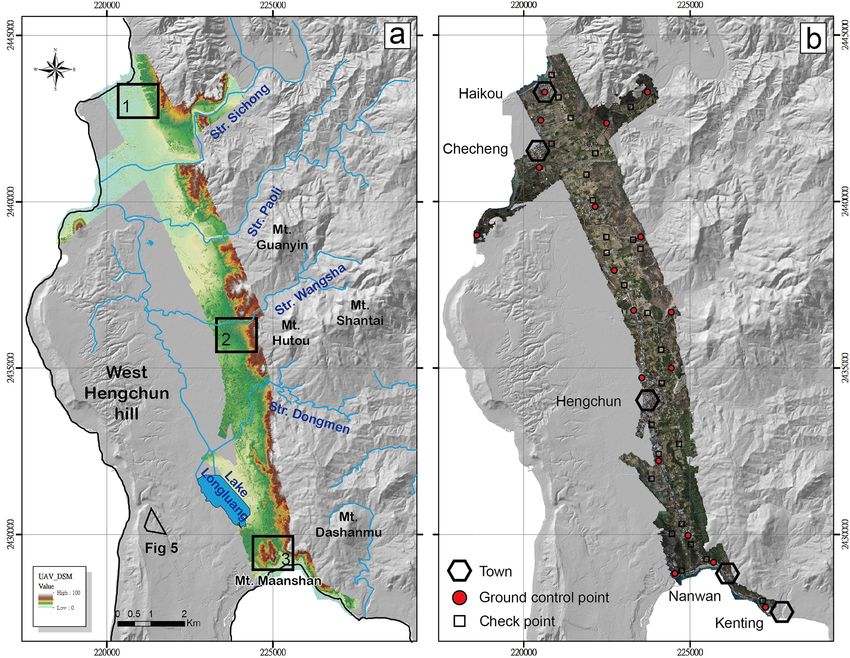
834                                                        B. Deffontaines et al.: Active tectonics of the onshore Hengchun Fault

Figure 5. Panorama of the Hengchun Fault observed from the western Hengchun Hill to the east. Red lines (1) correspond to the left-lateral
compressive Hengchun Fault. Note the isolated summits within the Kenting Mélange that are composed of highly deformed shales with
various huge blocks (possibly olistoliths) interpreted herein as a tectonic breccia. The location and the direction of the photos where it were
taken are indicated in Fig. 2a.

interbedded with sandstones and conglomerates (channels                   2009a, b; Deffontaines et al., 2016; Zhang et al., 2016;
and levees) (Sung and Wang, 1986; Sung, 1991). The Mu-                    Malavieille et al., 2016). It is interpreted as a chaotic
tan formation is a very thick pile (locally several thousands             tectonostratigraphic unit containing blocks of various origin
of meters) and highly deformed turbidites (locally even over-             (ophiolitic and sedimentary), size and lithology embedded in
turned: e.g., CGS geological map by Sung, 1991; Chang et                  a sedimentary matrix (Malavieille et al., 2016). It is herein
al., 2003).                                                               interpreted as a large tectonic breccia of composite ages that
   The soft complex Ma’anshan formation, late Miocene–                    ranges from 1 to 10 Ma (see Malavieille et al., 2016) as it
Quaternary in age, is a mix of submarine erosion and de-                  mixes various sizes of different blocks and different turbiditic
pressions filled in with both muddy Mutan and Kenting for-                and shale bodies (Page and Lan, 1983; Lin and Wang, 2001;
mations (Cheng and Haung, 1975; Page and Lan, 1983; Lin                   Chang et al., 2003). In our opinion, this shaly, blocky tec-
and Wang, 2001; Huang, 2006). The Ma’anshan formation                     tonic mélange is injected (intruded) within the major fault
is folded and outcrops partly in the south of the Hengchun                zones south of Taiwan due to both the plate convergence
Basin (CGS geological map by Sung, 1991); see panorama of                 and high pressure of fluids at depth (see also Deffontaines
the Hengchun Basin in Fig. 5. We believe that the Ma’anshan               et al., 2016). Future scientific work is needed regarding the
formation composes partly the basement of the Hengchun                    differing, incompatible assumptions and hypotheses in order
Basin and the offshore Manila accretionary prism to the south             to both characterize the processes that create this tectonic
(Lundberg et al., 1992, 1997; Reed, et al., 1992).                        Kenting Mélange and to reconstruct (or inverse) its evolution
   The Kenting Mélange, which only outcrops east of the                   through time (see synthesis in Malavieille et al., 2016).
Hengchun Basin, is known as a tectonic mélange (e.g.,                        The slightly tilted Hengchun limestone overlays the un-
Tsan, 1974; Page and Lan, 1983; Huang, 1984; Pelletier                    conformable Ma’anshan formation on the western side of the
and Stephan, 1986; Huang et al., 1997; Chang et al., 2003,                Hengchun Valley and overlying the Kenting Mélange on the

Nat. Hazards Earth Syst. Sci., 18, 829–845, 2018                                    www.nat-hazards-earth-syst-sci.net/18/829/2018/
B. Deffontaines et al.: Active tectonics of the onshore Hengchun Fault 835
the topography, index 2 for instance). We also added on the
Hengchun Fault geological mapping, geomorphological ob-
jects such as paleosurfaces (index 5 in Fig. 7), which are
easily recognized by smooth textures, and structures above
the Kenting Mélange. Those paleosurfaces are slightly tilted,
folded and uplifted east of the Hengchun Fault and are wit-
nesses of the vertical uplift of the transpressive tectonic ac-
tivity of the Hengchun Fault. Unfortunately, due to the slight
tilt, it remains difficult to extract fold axes from those pale-
osurfaces. It would be interesting to date these paleosurfaces
in order to get the mid- to long-term activity of the deforma-
tion. We select also the chevrons from the morphostructural
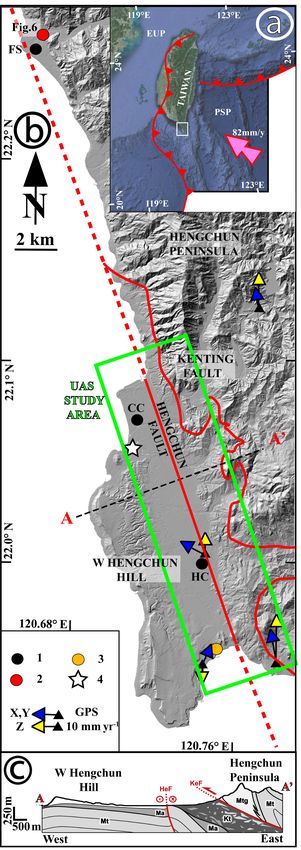
Figure 6. Field photograph of compressive features affecting re- analysis of the high-resolution UAS DSM (index 6 in Fig. 7).
cent concrete dykes after the Hengchun earthquake (26 Decem-
Chevrons correspond to the top of harder rocks of the tilted
ber 2006, ML =7.0); see location in Fig. 1 near the Fang-Shan
structural surfaces within the Kenting Mélange east of the
village (22.26◦ N, 120.66◦ E). The red compass gives the scale of
the outcropping deformation (20 cm). The thrust is associated with Hengchun Fault. They reveal opposite tilted strata, indicat-
three back thrusts, highlighting a small pop-up (below the compass). ing the presence of folds (anticlines and synclines, index 7 in
The red arrow reveals the thrusting component that affects the new Fig. 7) close and parallel to the Hengchun Fault zone. Some
concrete dykes. tectonically offset and eroded mud volcanoes are also iden-
tified and mapped herein (index 3, in Fig. 6), especially in
the South Hengchun Basin and close to Taipower Nuclear
eastern side of the Hengchun Fault. As the Hengchun lime- Power Plant No. 3. Those situated to the south of the study
stone is folded differently and continuously on both sides of area were already evidenced by Giletycz (2015). They ap-
the Hengchun Fault, it is unfortunately difficult to use the ex- pear in the UAS DSM as characteristic “elongated conic vol-
isted dating results to estimate a precise vertical uplift rate canic” shape relief above the flat marine and alluvial lowland
in the absence of the precise location of sampling (Chen and terrace. Their western side is locally affected by landslides
Liu, 1993). (Fig. 7). We interpret these mud volcanoes as the outcrop-
ping traces of the shale intrusions within the Hengchun Fault
3.2 Updated Hengchun geology and neotectonics zone, very probably due to fluids overpressure at depth in
relation to the intense transpressive tectonic stress (see also
Geological mapping in the fields lead us to look for active Deffontaines et al., 2016).
tectonic cracks within anthropic concrete dykes. They reveal The Hengchun Fault is recognized as active (Bonilla,
the clear lateral transpressive and thrusting component of the 1976; Hsu and Chang, 1979; Lee, 1999; Lin et al., 2000;
northern part of the Hengchun Fault (Fig. 6). As the con- Lin et al., 2009; Deffontaines et al., 2001, 2016). Effectively,
crete dykes are manmade and very recent, it is easy to recon- geological mapping in the field reveals many active cracks
struct and inverse the deformation following the Angelier’s within anthropic concrete dykes. These cracks highlight the
methodology settled along the longitudinal valley fault (see clear transpressive and thrusting component of the Hengchun
also Lee et al., 1998, 2000, 2001, 2003, 2005, 2006). Fault (Figs. 5 and 6). We cannot recognize clearly in the to-
From a structural point of view, the Hengchun Fault geo- pography the trace of the Hengchun Fault as a unique straight
logical map that we propose (Fig. 7) is the result of (1) field line thrusting (see Fig. 7) in contrast to the CGS geological
studies (Figs. 5 and 6 taken 3 January 2007), (2) the synthesis mapping (Sung, 1991) or its sinusoidal shape on the CPC ge-
of previous geological mappings (Rokkaku and Makiyama, ological map (1993). We only highlight herein the Hengchun
1934; CPC, 1993; CGS in Sung, 1991; Chang et al., 2003; Fault zone, which is made of locally aligned segments of
Chen et al., 2005; Giletycz et al., 2015) and (3) a detailed faults that affect the eastern part of the very recent Hengchun
photointerpretation of both the orthorectified mosaic of the Basin deposits (see index 2 in Fig. 7). Note that regional ge-
UAS aerial photograph as well as the hill shading of the high- ological maps aim to show both stratigraphy and structure,
resolution UAS-derived DSM (Fig. 7). The detailed struc- where the fault trace is at the maximum (or just approxi-
tural photointerpretation of the Hengchun Fault area checked mately) stratigraphic separation. In contrast, the active fault
in the field takes into account the basic morphostructural trace is situated strictly at active lines where last rupture is
principles (Deffontaines et al., 1991, 1993, 1997; Pubel- located. Thus, these two facts may create large differences.
lier et al., 1994) such as the geometry of the drainage pat- Moreover, on land, the last fault rupture can only be identi-
tern (bayonet tracks, curves and alignments) and the align- fied by geomorphic features, not by drilling or geophysical
ments of small scarps present in the flat Hengchun Basin prospecting.
(Fig. 4e, f, g, h, and Fig. 7, index 5) that help to charac- To date the deformation, the vertical long-term slip rate
terize the morphotectonic features (Fig. 7, faults that affect has been deduced in marine terrace studies and estimated
www.nat-hazards-earth-syst-sci.net/18/829/2018/ Nat. Hazards Earth Syst. Sci., 18, 829–845, 2018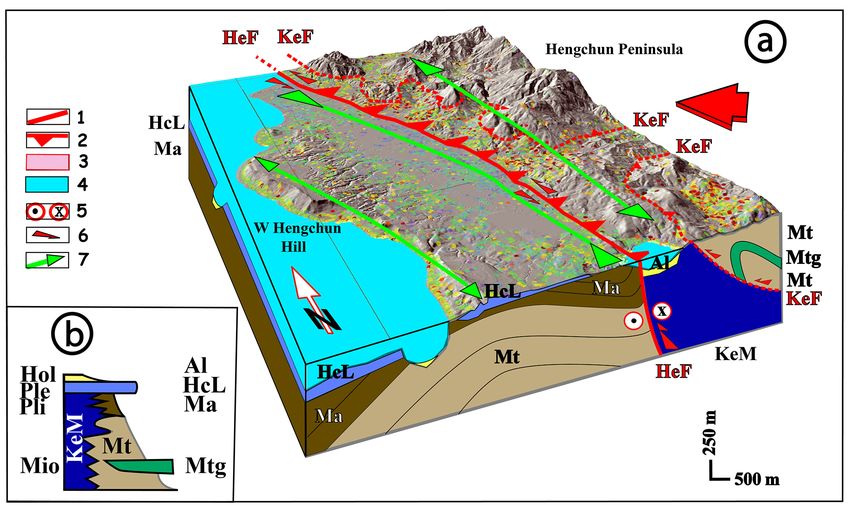
836 B. Deffontaines et al.: Active tectonics of the onshore Hengchun Fault
350◦ E of N) between 17 January 2007 and 28 January 2011,
thus providing 4 years of monitoring, through StaMPS soft-
ware (Hooper et al., 2007). A series of 12 interferograms
has been generated, all with respect to a unique “super mas-
ter” as a reference image situated in the mid-time series that
minimizes both spatial and temporal decorrelation (Pathier
et al., 2003; Champenois, 2011, Champenois et al., 2011,
2012, 2014, Fig. 8). Note that their perpendicular baselines
situated between −1194 and 2417 m are significantly below
the critical limit where all interferometric coherence is lost
(Hooper, 2009). We used the 40 m ground-resolution Taiwan
DTM in order to remove both the topographic and orbital
components of the interferometric phase. All interferograms
shows an excellent coherence in the Hengchun Plain as well
as in the hilly area. The method identifies 20 133 PS pixels
with an average density on the whole Hengchun Peninsula of
120 PS km−2 (see Fig. 9), characterized by their phase sta-
bility over the whole period. PS analyses lead us to extract a
map of mean LOS surface velocities for each PS and also to
catch their displacements through time series. Note that these
LOS data are not projected onto the vertical component. The
PS-InSAR base (fixed GPS station GS59 corresponds to the
black and white star see its location close to Checheng and
north of the Hengchun Valley in Figs. 1 and 9) is chosen as it
presents a stable (to very low) continuous deformation dur-
ing the monitoring time period. Nevertheless, this location
might be subject to small continuous uplift or small contin-
uous subsidence that may explain local discrepancies with
the GPS average annual displacement. We compare our PS-
InSAR results (Champenois, 2011; Champenois et al., 2011,
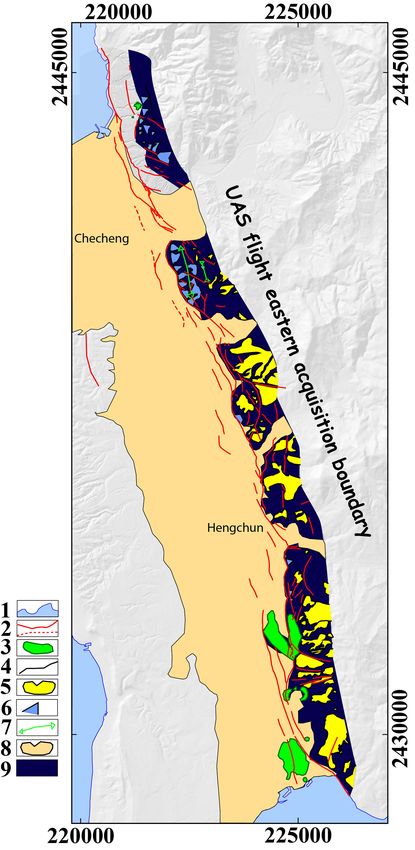
Figure 7. Morphostructural map of the Hengchun Fault: (1) shore- 2014) to three fixed GPS stations (HENC, GS57, GS59; see
line; (2) faults (red lines: certain faults; red dashed lines: inferred); Fig. 9) and two leveling lines acquired in the same monitor-
(3) mud volcano; (4) lithological boundaries; (5) paleosurfaces; ing time period (see Fig. 10). For each of the three fixed GPS
(6) chevron corresponding to tilted structural surface; (7) fold axes; stations (HENC, GS57, GS59), an average displacement has
(8) Hengchun Valley alluvial and marine deposits; (9) Kenting been calculated, projected into the radar LOS by taking into
Mélange. Note that the Hengchun Fault is made of numerous small consideration the various local incidence angles along the
parallel faults affecting a rather wide area of the eastern Hengchun distance axis (Hanssen, 2001; Cigna et al., 2011).
Valley. It is associated with a N–S-trending fold close to Checheng.
The results (Fig. 9) show an impressive density of PS
Some folds that tilt paleosurfaces and NE–SW, E–W and NW–SE
oblique faults affect the Kenting Mélange. The western extension of
(more than 140 PS km2 in the surroundings of the Hengchun
the Hengchun alluvial plain (8) is deduced from the 5 m DTM. Fault) in this area, where both human activity and luxu-
riant vegetation prevail. The PS map reveals a clear con-
tinuous difference in LOS velocities across the Hengchun
at 6.3 mm yr−1 at Hăikŏu (northern Hengchun Valley; see Fault where the Hengchun Valley (western side of the
Fig. 2) and 3.8–6.1 mm yr−1 at Nanwan (south of Hengchun Hengchun Fault) subsides, with values ranging from −5 to
Valley; see Chen and Liu, 1993). Other marine terrace studies −10 mm yr−1 , in contrast with the westernmost Hengchun
from Chen et al. (2005) show similar long-term slip rate. ridge, which is uplifting. This is evidenced in Fig. 9 by a
rapid transition from blue/green to orange/red PS dots. Tak-
ing into account the PALSAR ascending satellite orbit and
4 Inputs of PS-InSAR interferometry on the Hengchun the NNW–SSE Hengchun Fault, trending of both geome-
Fault tries is close to the best configuration to detect and mea-
sure the fault displacements (Champenois, 2011). Conse-
In order to deduce the regional tectonic activity of the quently, Fig. 9 led us to draw, with much more accurate
Hengchun Fault, we processed 13 radar images (ALOS PAL- detail than Shyu et al. (2005) or Lin et al. (2009), a new
SAR images acquired in L-band; λ = 23.6 cm, average in- place for this active Hengchun Fault within the Hengchun
cidence angle = 34.3◦ ) in ascending mode (flight direction Plain (Champenois, 2011). The eastern side of the Hengchun
Nat. Hazards Earth Syst. Sci., 18, 829–845, 2018 www.nat-hazards-earth-syst-sci.net/18/829/2018/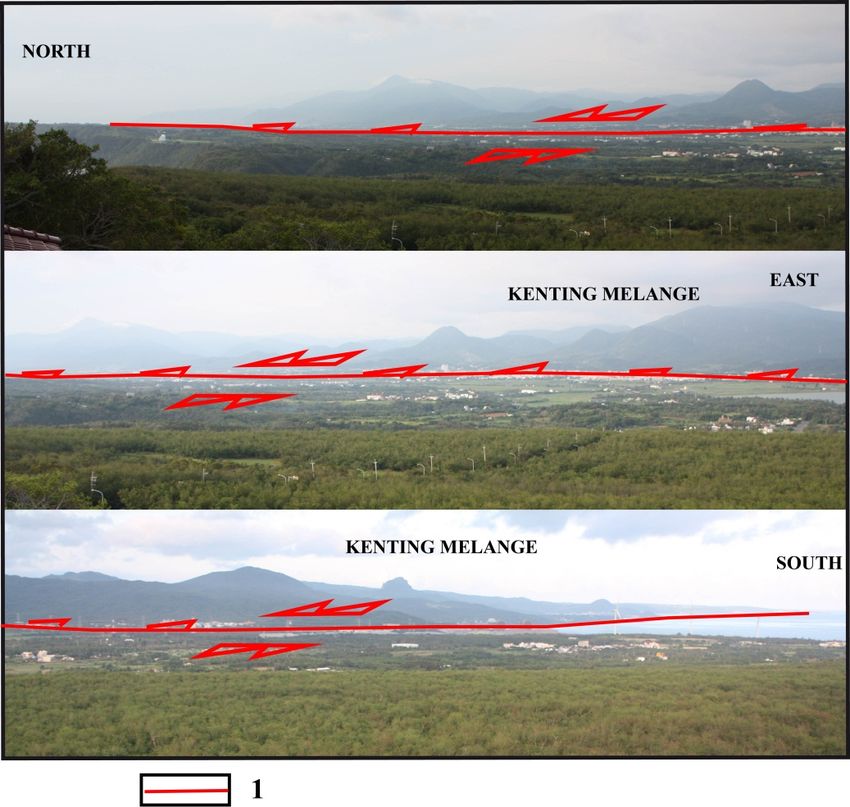
B. Deffontaines et al.: Active tectonics of the onshore Hengchun Fault                                                                   837

Figure 8. Available ALOS SAR images and their associated per-
pendicular baselines. All slave images are linked to the best master
image chosen in the middle of the time series that maximizes the
sum correlation of all interferogram (Hooper et al., 2007).

Fault is characterized by the rapid increasing uplift of the
Kenting Mélange up to a maximum that seems to parallel
the Hengchun Fault. Farther east the PS LOS velocities de-
crease with the distance to the Hengchun Fault so the east-
ern Hengchun Peninsula appears to be slightly tilted. We ob-
serve in the Hengchun Peninsula a similar dissymmetric ac-
tive vertical behavior as in the coastal range (eastern Taiwan):
the western part of the relief is highly actively uplifting and
folding in contrast to the eastern part, which is characterized
by a decreasing uplifting and which is slightly tilted to the          Figure 9. Mean LOS velocities of PS-InSAR between January 2007
east (see also Deffontaines et al., 2017). We note in Figs. 10b        and January 2011, superimposed onto the shaded 40 m ground-
and 11 the coherence of the PS LOS velocities and the GPS              resolution Southern Taiwan digital terrain model. The large black
measurements (colored large dots that we put into the same             circles are the GPS points and the color in the circles indicates their
LOS radar geometry). Consequently, those PS-InSAR results              average LOS velocity component during the monitoring time pe-
offer a precise mapping of the active interseismic splays of           riod. The black and white star (situated close to Hăikŏu – see loca-
the Hengchun Fault and allow the quantification of the tec-            tion in Figs. 1 and 2) corresponds to the GPS ground fixed station
tonic displacements.                                                   GS59 and is the base of this PS-InSAR data set. Blue and yellow ar-
   Regarding the Kenting Fault, with the data used in this             rows give their horizontal and vertical velocity. Red line: Hengchun
                                                                       Fault. Location of profiles 1 and 2 (see Fig. 11). Note the active
study we see no gradient of PS LOS velocity nor notice-
                                                                       surrection and folding east of the Hengchun Fault in contrast to the
able differential displacements on the GPS stations situated           subsidence of its western part (Hengchun Valley).
around the Kenting Fault (see Fig. 9 and profiles of Fig. 10a–
b). Moreover, from the geological mapping analysis (Chang
et al., 2003), the Kenting Fault has a sinusoidal planimetric
geometry that follows more or less the topographic isocon-             ing time period have been compared with the radar LOS. We
tour of the relief. So the Kenting Fault is a low-dipping thrust       compared also these PS results with leveling data acquired
fault. Consequently, this fault may be either locked at the sur-       during the same period of time (between March 2008 and
face or an inherited inactive fault, or it may have a tectonic         April 2011, during three campaigns of measurement). Fig-
activity that we do not observe on this PS-InSAR data set              ure 10 compares the leveling data, the mean LOS velocities
during the monitoring time period.                                     of PS along the leveling lines and GPS data for the two sta-
   We note a great coherence in between the PS and the avail-          tions situated close to the leveling lines. Note the agreement
able GPS measurements (colored large dots in Fig. 9) pro-              between all of them. The local heterogeneity of the displace-
vided on two stations. For comparison purposes, the average            ments (e.g., small subsidence and small uplift) within the
annual GPS displacements acquired in the InSAR monitor-                Hengchun Valley is highlighted by both the HENC GPS sta-

www.nat-hazards-earth-syst-sci.net/18/829/2018/                                  Nat. Hazards Earth Syst. Sci., 18, 829–845, 2018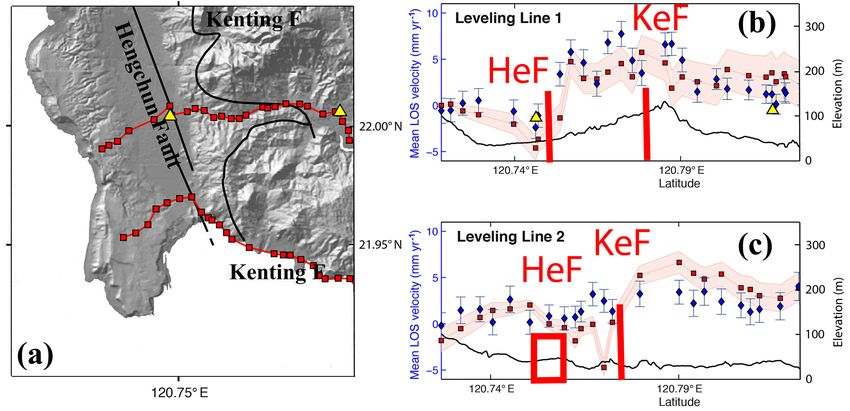
838                                                         B. Deffontaines et al.: Active tectonics of the onshore Hengchun Fault

Figure 10. (a) Location of the leveling lines on the Hengchun Peninsula. (b) and (c) Associated PS mean velocity with error bars (blue
dots), leveling data (red square and in pink: error bar) and GPS stations data (yellow triangle), projected on LOS. Leveling lines highlight the
vertical component of the deformation. The easternmost and westernmost reference points are on an enclosed curve line of the class 1 level
reference net defined by Taiwan’s Satellite Survey Center of Department of Land Administration (see SSCDLA, 2018). As leveling line 2
parallels the Hengchun Fault (points 6 to 8), it is represented as a red quadrangle. Note the general agreement of both interseismic leveling
and PSI vertical topographic displacements on those two transverse profiles across the whole Southern Hengchun Peninsula. They show
subsidence in the western part of the Hengchun Fault (HeF) contrasting with uplifting due to active folding on its eastern side. In addition,
there is little significative vertical interseismic displacement on the Kenting Fault location on both profiles during the monitoring time period.

tion that gives the absolute uplift displacement and the PS-               riod, which reveals, using two linear regressions calculated
InSAR data with various colored dots, ranging from blue to                 on both side of the Hengchun Fault, the clear tectonic ac-
orange, situated on both sides of the O value.                             tivity of the Hengchun Fault (Fig. 12). Note the good coher-
   Moreover, in order to better characterize the Hengchun                  ence between slip rates derived from PS analysis and the GPS
Fault activity and quantify the LOS velocity variation on                  measurement (projected in LOS by taking into account each
both sides of Hengchun Fault, we computed the LOS ve-                      local incidence angle along the distance axis) represented by
locity offset across the fault, using 31 profiles perpendic-               the yellow triangle in see Fig. 12. This good fit between the
ular to the fault line. Each 10 km long PS profile is per-                 fixed GPS stations validates our PS results. This is a major re-
pendicular to the Hengchun Fault and characterized by an                   sult from this study as it demonstrates the along-strike inter-
equidistance of 400 m. In addition, each PS data point sit-                seismic activity of the fault (Champenois, 2011; Champenois
uated on both sides (200 m vicinity) is projected on each                  et al., 2011, 2012; this study) and allows us to obtain the aver-
PS profile. Each data point is only represented on only one                age annual interseismic LOS displacement of the Hengchun
profile. The number of PS dots per profile varies between                  Fault and its spatial variation along the fault. Variations of
400 and 1200 (Champenois, 2011). This offset characterizes                 the along-strike velocity offset of Hengchun Fault need to be
the slip rate of the fault. We present two specific profiles in            carefully monitored and analyzed in order to better character-
Fig. 11 (see location Fig. 9). The two PS profiles, which run              ize potential seismic hazards, especially the low interseismic
transverse to the Hengchun Fault, one north of the Hengchun                creeping areas where stress may accumulate (see Fig. 12) and
Valley close to the Checheng city and the second one south-                may correspond to a partially locked part of the fault source
ward (close to Hengchun city), show LOS offset less than                   of future earthquakes (close to Hengchun Township, for in-
10 ± 2.5 mm yr−1 . Note the high number of PS reflectors sit-              stance).
uated in the cities of Checheng and Hengchun that confirm                     StaMPS also gives access to time series of displacement,
that on both profiles we evidence a clear jump in the PS mag-              from 2007 to 2011 (see Champenois, 2011; Champenois et
nitude that corresponds to the aseismic displacement of the                al., 2011, 2012). We can thus derive at each image acquisition
Hengchun Fault (Champenois, 2011).                                         date the displacement related to the fault (a cumulated slip
   So thanks to a series of more than 30 profiles perpendicu-              value) and then monitor its slip variation through time. The
lar to the fault, we computed the interseismic LOS velocity                time series of slip values (Fig. 13) does not show any clear
offset along the fault, from north to south, with LOS val-                 seasonal accelerations or decelerations, but only expresses a
ues (from min 4.9 mm yr−1 to max 10.2 mm yr−1 ), reaching                  rather linear behavior of the fault during the monitoring time
an average 8 ± 2.5 mm yr−1 during the monitoring time pe-                  period. This time series should be updated with new SAR im-

Nat. Hazards Earth Syst. Sci., 18, 829–845, 2018                                      www.nat-hazards-earth-syst-sci.net/18/829/2018/
B. Deffontaines et al.: Active tectonics of the onshore Hengchun Fault                                                                  839

Figure 11. E–W projection of mean LOS velocity in mm yr−1 (blue dots with error bars, E on the right) on two profiles transverse to the
northern part of Hengchun Valley (close to the cities of Checheng and Hengchun; see profile location in Fig. 9). Black line: topography; yel-
low triangle: GPS point; HeF: Hengchun Fault; KeF: Kenting Fault. Note that Figs. 10 and 11 both show similar topographic displacements:
the LOS offsets close to 10 ± 2.5 mm yr−1 associated with the Kenting Mélange uplift east of the Hengchun Fault, which contrasts with the
generally subsiding Hengchun Valley. Kenting Fault has no vertical interseismic offset during the monitoring time period.

Figure 12. Hengchun Fault along-strike variation of LOS velocity offset (perpendicular to the fault, in mm yr−1 ) including Hengchun
and Checheng. Note the active interseismic displacement and its along-strike variations which confirms that Hengchun Fault is an active
interseismic creeping fault of Taiwan. Furthermore the LOS velocities’ variations are important in terms of seismic hazards as they reveal
the location of slowly creeping areas where stress may accumulate at depth, such as those areas close to both Checheng and Hengchun and
higher active tectonic areas such as in between Checheng and Hengchun or south of Hengchun Valley. Part of the deformation may also be
distributed in the eastern part of the Hengchun Fault (e.g., the Kenting Fault and/or within the intrusion of the Kenting Mélange in between
both Hengchun and Kenting faults; see Fig. 14).

ages in order to get a longer monitoring period (Champenois,
2011; Champenois et al., 2011). It will help to know whether
the Hengchun Fault has a linear displacement through time
(or not).

5   Discussion: updated Hengchun active tectonic model

Many different tectonic models have been proposed on                     Figure 13. Time series of cumulated slip (on profiles 1 and 2) where
the active Hengchun Fault zone (thrust, left-lateral strike-             no particular seasonal effects prevail.
slip, transpression and transtension; see Chang et al., 2003,
2009b). However, they miss both structural and active tec-
tonic arguments to better understand the Hengchun Fault

www.nat-hazards-earth-syst-sci.net/18/829/2018/                                    Nat. Hazards Earth Syst. Sci., 18, 829–845, 2018
840                                                         B. Deffontaines et al.: Active tectonics of the onshore Hengchun Fault

Figure 14. (a) Simplest model of active interseismic tectonic deformation of the Hengchun Fault during the monitoring time period. It is
compatible with the oblique geodynamic convergence (large red arrow on the right), GPS, leveling, interferometric active displacements, and
the detailed UAS DSM photointerpretation. In addition, it is compatible with Rokkaku and Makiyama (1934) and CGS and CPC geological
mappings (Chang et al., 2009b; Deffontaines et al., 2016). 1: Fault; 2: Thrust; 3: Fault plane; 4: Taiwan Strait/South China Sea; 5: Left-lateral
component; 6: Transpressive left-lateral component; 7: Fold (anticline and syncline). The GPS data and PS mean LOS velocities imply that
Hengchun Fault acts as a left-lateral transpressive strike-slip fault with an actively folding and uplifting anticline (hanging wall) contrasting
with the aligned active subsidence of the Hengchun Valley that acts as a trending parallel to the Hengchun Fault. One can see the Hongtsai
canyon at sea (see Deffontaines et al., 2016). (b) Simplified lithostratigraphic column of the Hengchun formations in the western Hengchun
Peninsula. Al: alluvial deposits; HcL: Hengchun limestone; Ma: Ma’anshan formation; Mt and Mtg: different facies of Mutan formation
(Mtg: Loshui sandstone – CGS geological map); KeM: Kenting Mélange; HeF: Hengchun Fault; KeF: Kenting Fault; Mio: Miocene; Pli:
Pliocene; Ple: Pleistocene; Hol: Holocene strata (modified from CGS, CPC and previous references).

(e.g., Liew and Lin, 1987; Sung, 1991; CPC, 1993; Chen and                 riod, with an average value of 8 mm yr−1 along the LOS, con-
Liu, 1993, 2000; Chang et al., 2003, 2009a, b; Chen et al.,                firmed by the leveling monitoring (see leveling line 1: 8 mm
2005; Vita-Finzi and Lin, 2005).                                           offset – Fig. 10b). The variation of displacements on both
   The simplest model that we propose herein (Fig. 14) that                sides of the Hengchun Fault zone also reveals the progres-
fits with the oblique NW-trending Taiwan geodynamic con-                   sive folding of the Hengchun Fault zone: the eastern hang-
vergence (Suppe, 1984), the E–W displacements measured                     ing wall is progressively shortening and uplifting (as revealed
by GPS data (Yu et al., 1997), the geological data set and                 by GS57 and the two leveling lines) contrasting to the pro-
the geological mapping (CPC, 1993; CGS in Sung, 1991;                      gressive subsidence of the Hengchun Basin (footwall situated
Chang et al., 2003, 2009b; Giletycz et al., 2015), our de-                 west of Hengchun Fault – see Figs. 10b, c and 11, profiles 1
tailed high-resolution UAS DSM photointerpretation (Fig. 7)                and 2). These displacement results (Figs. 9, 10 and 11) com-
and our interferometric 2009–2011 PS LOS displacements                     bined with the structural photointerpretation (Fig. 7) show
(Champenois, 2011; Champenois et al., 2011, 2014, Fig. 9)                  that the fault is only locally outcropping and that active fold-
is given for the western part of the onshore Hengchun Penin-               ing occurs, increasing progressively with time, stress and
sula (Fig. 14).                                                            strain at depth.
   From all used geodetic techniques (GPS, leveling lines                     Consequently, due to the rectilinear structural geometry,
and interferometric), if we generalize the two leveling sec-               the Hengchun Fault appears to act as an almost vertically ac-
tions, which are coherent to both the three fixed GPS stations             tive left-lateral transpressive strike-slip fault with an active
and the PS-InSAR results, the western Hengchun Peninsula                   uplifting and folding (anticline) on its eastern hanging wall,
is slowly uplifting (less than +10 mm yr−1 ), contrasting the              in contrast to the active subsidence of the western footwall
slow subsidence of the eastern part of the Hengchun Penin-                 (which corresponds to the easternmost part of the dissym-
sula (0 to −2.5 mm yr−1 ). So as we reveal a continuous ac-                metric Hengchun Basin, Fig. 14). Moreover, the Hengchun
tive differential displacement across both sides of Hengchun               Fault is not outcropping along one small, straight, continuous
Fault, which is deduced from leveling lines, GPS and PS-                   north-to-south line but is instead a rather large “fault zone”
InSAR, Hengchun Fault shows the existence of a clear inter-                made of little active fault segments (see location mapped in
seismic creeping component during the monitoring time pe-                  details, Fig. 7). One may note that the thrusting and left-

Nat. Hazards Earth Syst. Sci., 18, 829–845, 2018                                     www.nat-hazards-earth-syst-sci.net/18/829/2018/
B. Deffontaines et al.: Active tectonics of the onshore Hengchun Fault                                                        841

lateral strike-slip motion have been deduced from both from        tion, especially for the active geological structures, the ter-
the morphostructural analysis of the high-resolution DTM           rain is easily modified by human activity in Taiwan: cities
(see Fig. 4c, d, g and h) and the obliquity of the GPS ar-         and farmland are rapidly growing in some areas, conceal-
rows already evidenced in the bibliography (see blue arrows        ing morphotectonic structures. Fortunately, the orthomosaic
in Figs. 1 and 9, and Chang et al., 2003). Consequently,           images help to recognize those artifacts. Overall, the au-
Fig. 14 proposes a simple model where the Hengchun Fault           tonomous UAS and well-developed photogrammetry tech-
acts as a 160◦ E N-trending transpressive left-lateral strike-     nique allow us to generate conveniently highly detailed topo-
slip fault zone. Its active hanging wall is overthrusting and      graphic information and help to carry out large-scale, high-
is actively folding the topographic surface that tilts and folds   resolution morphotectonic study. Integrating leveling lines,
the paleosurfaces: the Hengchun limestone and marine ter-          three fixed GPS stations and PS-InSAR processing that gives
races (see Liew and Lin, 1987, and Chen and Liu, 1993).            the short-term active movement of the Hengchun Fault and
The Hengchun Basin (Hengchun Fault footwall and west of            high-resolution DSM structural photointerpretation acquired
it) under the transpression is also folded and is actively sub-    from UAS demonstrates longer-term topographic deforma-
siding with a parallel to the fault syncline axis that create      tions and anomalies, thus providing one new scope that may
the lagoonal/marine deposition of the Pleistocene–Holocene         be able to locate, characterize and quantify the active tecton-
Hengchun Basin (Chen et al., 1991).                                ics features.
   Thus, the Hengchun Fault, as many faults in central and            Then with these useful high-resolution topographic data,
southern Taiwan, presents both left-lateral strike-slip and        we undertook a classical geological and geomorphological
thrusting components such as the Chelungpu Fault reacti-           photointerpretation that led us to update and refine the pre-
vated during the Chichi earthquake (21 September 1999) as          existing CPC (1993) and CGS (Sung, 1991) geological maps
well as any Taiwan foothill transfer fault zones (e.g., Def-       on both sides of the Hengchun Fault (see Figs. 4 and 7).
fontaines et al., 1997).                                           The latter led us to characterize the structural geometry of
   Regarding the amplitude and the components of the ac-           the Hengchun Fault in the peninsula (Fig. 7). Moreover,
tive Hengchun Fault deformation, the two leveling lines re-        the leveling lines and the PS-InSAR interferometric process-
veal the vertical offset of the Hengchun Fault, consistent with    ing that we carried out over the Hengchun Peninsula from
interferometric displacement toward the LOS, with a value          2007 to 2011 with more than 12 coherent interferograms
of 8 ± 2 mm yr−1 , which corresponds to the vertical geodetic      reveals clear interseismic displacements of the Hengchun
interseismic slip rate. Note that this short-term value is a bit   Fault. Moreover, our interferometric results, which are in
different than the vertical long-term slip rate deduced from       agreement with leveling lines and fixed GPS data, reveal the
the marine terraces dating 6.3 mm yr−1 at Hăikŏu and 3.8–        active sections and folding of the eastern hanging wall of the
6.1 mm yr−1 at Nanwan (Liew and Lin, 1987; Chen and Liu,           Hengchun Fault of about 8 ± 2 mm yr−1 . Furthermore, the
1993). From this slight difference in between the long-term        footwall is also subject to a complementary active subsidence
and the vertical geodetic slip rates, we may deduce the fact       related to the development of an active syncline parallel to
that the Hengchun Fault may be not only a creeping fault.          the Hengchun Fault. These displacements are a cumulative
But due to the folding component of the eastern side of the        vector that takes into account both planimetric and vertical
Hengchun Fault, it is needed to locate much precisely the in       components of the deformation. Our PS-InSAR results are
situ dated samples (Chen and Liu, 1993) to reconstruct and         fully coherent with both E–W-trending leveling lines across
inverse correctly the long-term deformation history.               the Hengchun Fault and three continuous GPS stations sit-
   Chang et al. (2003) characterized the active horizontal slip    uated on both sides of the Hengchun Fault. Consequently,
rate of the western Hengchun Peninsula by comparing the di-        we expand our interpretation due to the PS density (more
rections and amplitude of the three fixed GPS stations. Note       than 140 PS km−2 ), which offers a spatial density of mea-
that these values take into account both Hengchun and Kent-        surements that is greatly higher than that offered by GPS,
ing faults without individualization.                              allowing us a global and whole coverage and mapping of the
                                                                   active Hengchun Fault deformations (Fig. 9).
                                                                      From the active tectonics conclusions, we deduce that
6   Conclusions and perspectives                                   the Hengchun Fault, characterized by a high dip angle,
                                                                   acts as a large, creeping interseismic left-lateral strike-slip
First, the flights of UAS with image acquisition allow us to       fault zone with a clear transpressive vertical component of
produce through photogrammetry a high-resolution DSM of            8 ± 2 mm yr−1 (leveling lines and LOS) associated with ac-
the Hengchun Fault area with a less than 7 cm ground res-          tive folding. We show that the Hengchun Fault presents a
olution and less than 40 cm precision. However, for some           different tectonic behavior from north to south: in its north-
places, the texture may change rate quicker and higher than        ern part, the Hengchun Fault is narrow and clearly out-
the image capture acquisition, such as the lakes or water          crops below the marine terrace with a measurable offset (see
surfaces due to sunlight reflection, which causes noises in        Fig. 4d). That contrasts with the central and southern part of
DEMs. In addition, concerning the DEM photointerpreta-             the Hengchun Fault, where it is wider or larger (see many

www.nat-hazards-earth-syst-sci.net/18/829/2018/                             Nat. Hazards Earth Syst. Sci., 18, 829–845, 2018
842 B. Deffontaines et al.: Active tectonics of the onshore Hengchun Fault
parallel and collinear faults and cracks that offset the topog- Special issue statement. This article is part of the special issue
raphy in Fig. 7) and submitted to active folding, and the fault “The use of remotely piloted aircraft systems (RPAS) in monitor-
is only locally partially locked (close to the Hengchun city, ing applications and management of natural hazards”. It is a result
see Fig. 12). In the central and southern parts, as the PS of the EGU General Assembly 2016, Vienna, Austria, 17–22 April
interferogram spectrum increases rather continuously from 2016.
west to east, transverse and above the whole Hengchun Fault
zone, the Hengchun Fault actively folds at depth. More-
Acknowledgements. We are grateful to Andy Hooper for having
over, the lack of clear along-strike PS discontinuity across
developed and permitting to use the “StaMPS/MTI” algorithms.
the Hengchun Fault zone proves that it is not clearly offset-
We thank also the Japan Aerospace Exploration Agency (JAXA)
ting the topography (and outcropping) during the acquisition for the ALOS data in the scope of PI 112-0001 project (project
monitoring time period (2007–2011). This should sign the no. 5226904000; PI Benoit Deffontaines). Erwan Pathier (UJF
slow continuous increase of tectonic stress at depth, which is Grenoble) and Benedicte Fruneau (UPE) are also deeply thanked
a major indicator of a future earthquake in that area. for their support during Johann Champenois’s PhD thesis. This
Unfortunately, the active differential displacement on both project was partially supported by LIA ADEPT (now D3E)
sides of the Kenting Fault is much more difficult to highlight no. 536, French CNRS-NSC (now MOST) and Taiwan MOST
with the present geodetic data sets and our PS-InSAR results 105-2116-M-027-003.
due to (1) the low fault dip angle deduced from its mapping
geometry, (2) an inherited inactive fault, (3) a locked fault Edited by: Yuichi S. Hayakawa
Reviewed by: four anonymous referees
at the surface, and possibly (4) the ductile rheology of the
underlying formation (Mutan clay turbidites – MT). Conse-
quently, better geologically mapping and monitoring of the
Kenting Fault is needed in order to better understand its ge- References
ometry, rheology and active tectonic behavior.
Nevertheless, the shallow seismicity (Deffontaines et al., Academia Sinica GPS: available at: http://gps.earth.sinica.edu.tw/
2016) confirms the high onshore shallow tectonic activity index.jsp, last access: 12 March 2018.
that hits the Hengchun Peninsula. The major, deep offshore Bonilla, M. G.: Summary of Quaternary faulting and elevation
changes in Taiwan, Mem. Geol. Soc. China, 2, 43–55, 1976.
Hengchun earthquake (26 December 2006, depth: 44 km,
Bühler, Y., Adams, M. S., Bösch, R., and Stoffel, A.: Mapping
ML = 7.0) also participated in the active deformation of the
snow depth in alpine terrain with unmanned aerial systems
Hengchun Peninsula. (UASs): potential and limitations, The Cryosphere, 10, 1075–
Further dating ought to first be done with respect to the 1088, https://doi.org/10.5194/tc-10-1075-2016, 2016.
Hengchun Peninsula folding then undertaken in order to bet- Champenois, J.: Caractérisation des déformations tectoniques inter-
ter characterize the ages of the terraces, paleosurfaces and sismiques de l’île de Taiwan par interférométrie radar, Geo-
the different deposits of the Hengchun Basin in order to physics, Université Paris-Est, 244 pp., 2011 (some parts in
inverse and reconstruct its tectonic history (Liew and Lin, French).
1987; Chen and Liu, 1993). Champenois, J., Deffontaines, B., Fruneau, B., Pathier, E., Lin,
Finally, due to the average Hengchun Fault along-strike K. C., and Hu, J. C.: Persistent Scatterer InSAR applied to
variations (around 8 ± 2 mm yr−1 displacement toward the the Hengchun Peninsula (S. Taiwan), Neotectonic implications,
Fringe, 2011.
LOS confirmed by leveling lines – Fig. 12), it is definitely
Champenois, J., Fruneau, B., Pathier, E., Deffontaines, B., Lin,
important to better constrain the Hengchun Peninsula’s ac-
K.-C., and Hu, J.-C.: Monitoring of active tectonic defor-
tive tectonics in order to prevent major destruction and major mations in the Longitudinal Valley (Eastern Taiwan) us-
failure in the near future, such as damage to sensitive energy ing Persistent Scatterer InSAR method with ALOS PAL-
industries (e.g., Taiwan Nuclear Power Plant No. 3, situated SAR data, Earth Planet. Sc. Lett., 337–338, 144–155,
along the southern tip of the Hengchun Fault). https://doi.org/10.1016/j.epsl.2012.05.025, 2012.
Champenois, J., Fruneau, B., Pathier, E., Deffontaines, B., and Hu,
J. C.: From Collision to subductions, monitoring of ground dis-
Data availability. The ALOS SAR images were obtained from the placements of the Hengchun Peninsula using Persistent Scatterer
Japan Aerospace Exploration Agency. UAS data were acquired by Interferometry (Southern Taiwan), Int Coll. Hualien, Novem-
the authors. The UAS data can be obtained upon request to the cor- ber 2014.
responding author (epidote@ntut.edu.tw). Chang, C. P., Angelier, J., Lee, T. G., and Huang, C.: From conti-
nental margin extension to collision orogen: structural develop-
ment and tectonic rotation of the Hengchun peninsula, southern
Competing interests. The authors declare that they have no conflict Taiwan, Tectonophysics, 361, 61–82, 2003.
of interest. Chang, C. P., Angelier, J., and Lu, C. Y.: Polyphase deformation in
a newly emerged accretionary prism: Folding, faulting and ro-
tation in the southern Taiwan mountain range, Tectonophysics,
466, 395–408, 2009a.
Nat. Hazards Earth Syst. Sci., 18, 829–845, 2018 www.nat-hazards-earth-syst-sci.net/18/829/2018/You can also read