A Quantitative Affinity-Profiling System That Reveals Distinct CD4/CCR5 Usage Patterns among Human Immunodeficiency
←
→
Page content transcription
If your browser does not render page correctly, please read the page content below
JOURNAL OF VIROLOGY, Nov. 2009, p. 11016–11026                                                                            Vol. 83, No. 21
0022-538X/09/$12.00 doi:10.1128/JVI.01242-09
Copyright © 2009, American Society for Microbiology. All Rights Reserved.

         A Quantitative Affinity-Profiling System That Reveals Distinct
          CD4/CCR5 Usage Patterns among Human Immunodeficiency
           Virus Type 1 and Simian Immunodeficiency Virus Strains䌤
   Samantha. H. Johnston,1,2 Michael A. Lobritz,3† Sandra Nguyen,2 Kara Lassen,4‡ Shirley Delair,1,2
           Filippo Posta,5 Yvonne J. Bryson,1 Eric J. Arts,3 Tom Chou,5 and Benhur Lee2*
 Division of Pediatric Infectious Diseases1 and Department of Microbiology, Immunology, and Molecular Genetics,2 David Geffen School of
   Medicine, UCLA, Los Angeles, California 90095; Division of Infectious Diseases3 and Department of Molecular Biology and
           Microbiology,4 Case Western Reserve University School of Medicine, Cleveland, Ohio 44106; and Departments of
                                   Biomathematics and Mathematics, UCLA, Los Angeles, California 900955

                                                                                                                                            Downloaded from http://jvi.asm.org/ on March 3, 2020 by guest
                                              Received 15 June 2009/Accepted 6 August 2009

             The affinity of human immunodeficiency virus (HIV) envelope for CD4 and CCR5 appears to be associated
          with aspects of R5 virus (virus using the CCR5 coreceptor) pathogenicity. However, entry efficiency results from
          complex interactions between the viral envelope glycoprotein and both CD4 and CCR5, which limits attempts
          to correlate viral pathogenicity with surrogate measures of envelope CD4 and CCR5 affinities. Here, we present
          a system that provides a quantitative and comprehensive characterization of viral entry efficiency as a direct
          interdependent function of both CD4 and CCR5 levels. This receptor affinity profiling system also revealed
          heretofore unappreciated complexities underlying CD4/CCR5 usage. We first developed a dually inducible cell
          line in which CD4 and CCR5 could be simultaneously and independently regulated within a physiologic range
          of surface expression. Infection by multiple HIV type 1 (HIV-1) and simian immunodeficiency virus isolates
          could be examined simultaneously for up to 48 different combinations of CD4/CCR5 expression levels, resulting
          in a distinct usage pattern for each virus. Thus, each virus generated a unique three-dimensional surface plot
          in which viral infectivity varied as a function of both CD4 and CCR5 expression. From this functional form,
          we obtained a sensitivity vector along with corresponding metrics that quantified an isolate’s overall efficiency
          of CD4/CCR5 usage. When applied to viral isolates with well-characterized sensitivities to entry/fusion inhib-
          itors, the vector metrics were able to encapsulate their known biological phenotypes. The application of the
          vector metrics also indicated that envelopes derived from elite suppressors had overall-reduced entry efficien-
          cies compared to those of envelopes derived from chronically infected viremic progressors. Our affinity-
          profiling system may help to refine studies of R5 virus tropism and pathogenesis.

   Human immunodeficiency virus (HIV) enters cells via en-             patients with R5 virus. There are many host and viral factors
gagement of its envelope glycoprotein with CD4 and a core-             that account for the varied clinical outcomes of HIV-infected
ceptor (CCR5 or CXCR4), which induces fusion of the viral              patients. Among viral factors, the role of coreceptor tropism in
and target cell membranes (4). Although many chemokine                 viral pathogenicity is complex. For clade B infections, up to
receptors can serve as coreceptors for HIV in vitro, only              half of patients develop CXCR4 (X4)-tropic HIV type 1
CXCR4 and CCR5 have a major role in vivo (29). The majority            (HIV-1) variants prior to or during the onset of clinical AIDS
of viruses transmitted use CCR5 as a coreceptor exclusively            (28, 30, 51); however, X4 tropism can be rare in other clades
(R5 virus) (24, 43, 47). This is underscored by the observation        (e.g., clades A and C) that predominate in countries where
that individuals homozygous for a 32-bp deletion in the CCR5           patients still clearly progress to AIDS (3, 12). For patients with
receptor gene are highly resistant to HIV infection and that           R5 viruses, HIV progression has been associated with en-
heterozygous individuals have a delayed progression to disease         hanced macrophage tropism (1a, 22, 46), the increased ability
(reviewed in reference 33).                                            to use low levels of CCR5 (11, 44), and an increasing replica-
   While it is clear that the appearance of virus using the            tive fitness (45) and relative entry efficiency of the infecting
CXCR4 coreceptor correlates with progression to AIDS, many             virus (26, 39). Neurovirulence is also correlated with an iso-
slow and rapid progressors harbor R5 virus throughout their            late’s ability to use low levels of CD4 and/or CCR5 present on
clinical course (4, 29, 41, 46). Thus, viral tropism alone does        microglial cells (8, 10, 27). Furthermore, R5 viruses with in-
not explain differences in disease progression among those             creased fitness or derived from late as opposed to early disease
                                                                       show not only increased CCR5 usage but also greater resis-
                                                                       tance to inhibition by various CCR5 ligands or antagonists (11,
  * Corresponding author. Mailing address: BSRB 257, 615 Charles E.
Young Drive East, UCLA, Los Angeles, CA 90095. Phone: (310)            15, 17, 23, 31). Finally, in the simian immunodeficiency virus
794-2132. Fax: (310) 267-2580. E-mail: bleebhl@ucla.edu.               SIVmac model, R5 SIV strains can clearly become virulent
  † Present address: Department of Internal Medicine, Stanford Uni-    without coreceptor switching (13, 14). Thus, it seems likely that
versity Medical Center, Stanford, CA 94305.
                                                                       the relative use/affinity of the CD4/CCR5 receptors during
  ‡ Present address: Gladstone Institute of Virology and Immunology,
University of California, San Francisco, San Francisco, CA 94158.      disease, rather than a simple switch from R5 to X4 coreceptor
  䌤
    Published ahead of print on 19 August 2009.                        tropism, is a better predictor of viral pathogenicity.

                                                                   11016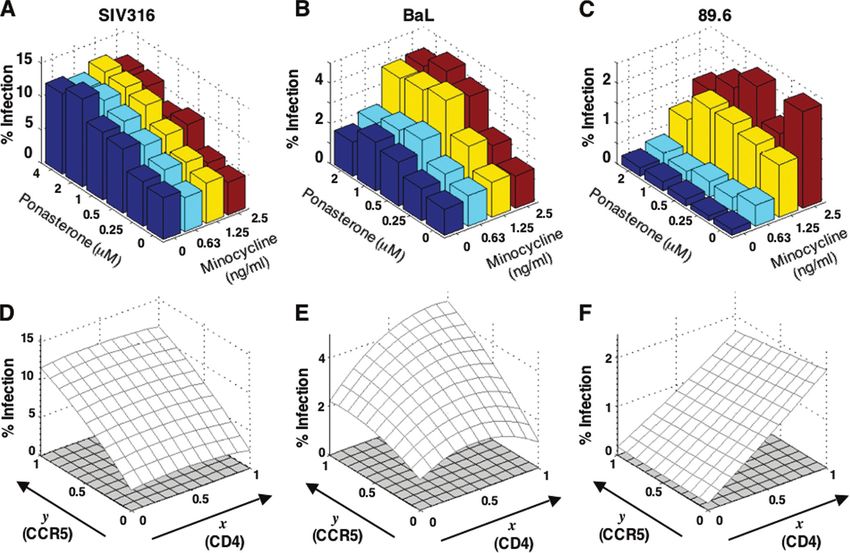
VOL. 83, 2009 AFFINITY PROFILING OF CD4/CCR5 USAGE PATTERNS 11017
Downloaded from http://jvi.asm.org/ on March 3, 2020 by guest
FIG. 1. Schema for generation of 293-Affinofile cells where CD4 and CCR5 expression can be simultaneously and independently induced and
regulated. A dually inducible, quadruply stable cell line termed 293-Affinofile cells was generated as described in Materials and Methods. CD4
expression is under the control of the Trex (Tet-On) system, in which the addition of tetracycline or related analogs (e.g., minocycline) releases
a repressor protein (expressed from pcDNA6/TR) (1) upstream of a Tet-O-CMV fusion promoter that controls CD4 expression (pcDNA5/TO-
CD4) (3). This release allows CD4 expression to proceed. PonA regulates CCR5 expression by dimerizing two subunits of a functional ponasterone
receptor expressed from its transactivator (expressed from pcVgRXR) (2). This allows them to bind a region upstream of the ponA-responsive
promoter and activate CCR5 expression (pIND-R5) (4). CD4 and CCR5 expression can thus be independently regulated using minocycline and
ponA, respectively. ⫹/⫺Tet or ⫹/⫺Pon, presence or absence of tetracycline or ponasterone, respectively. In the schematic for 293 affinofile cells,
red circles correspond to CD4 immunoglobulin domains, and the green cartoon corresponds to CCR5.
To date, most attempts at determining the efficiency of CD4 efficiency profiles in our Affinofile system. Our Affinofile sys-
and CCR5 usage have relied on indirect competition studies tem and vector metrics may help to refine how R5 virus tro-
with soluble receptor, antibodies, or ligand. Some studies have pism and pathogenesis are studied and defined.
used the clonal cell lines derived by the Kabat laboratory which
express large or small amounts of CD4 or CCR5 (16, 34), MATERIALS AND METHODS
resulting in useful but relatively binary information regarding Viruses. 293T cells were used to make stocks of pseudotyped pNL-GFP
whether a particular isolate can use high or low levels of CD4 SIV316 reporter viruses as previously described (2). Replication-competent
and/or CCR5. Overall, the efficiency of HIV-1 entry into cells stocks of 89.6 and Ba-L viruses were supplied by the Bryson laboratory. Stocks of
both viruses were made via propagation in phytohemagglutinin-stimulated pe-
within the human host likely results from a complex interplay
ripheral blood mononuclear cells (PBMCs), and viral supernatant was collected
in the engagement of HIV-1 env glycoproteins with the CD4 at day 7. Viral titers were determined by measuring viral capsid protein concen-
and CCR5 receptors. The efficiency with which CCR5 is used trations (p24) for PBMC-propagated viral stocks.
for entry may depend on the level of CD4 present and vice 293-Affinofile cells. A quadruply stable cell line (HEK 293 background) ex-
versa. pressing both the transactivators and the inducible promoters driving CD4 and
CCR5 expression was made sequentially by using the selective reagents indicated
Here, we developed a receptor affinity-profiling (Affinofile) in Fig. 1. The cell line was single cell cloned at each stage (labeled 1 to 4
system that can directly quantify the relative efficiencies of sequentially in Fig. 1) to select for the clone with the best properties: a low basal
CD4 and CCR5 usage as an interdependent function of one level of expression and induced expression within the physiologic range of CD4
another’s expression levels. This Affinofile system relies on a and CCR5 expression. A dually inducible cell line (293-Affinofile) was eventually
generated in which the expression of CD4 and CCR5 was simultaneously and
dually inducible cell line with independent regulation of CD4
independently controlled with minocycline and ponasterone A (ponA), respec-
and CCR5 surface expression. The infection efficiency of any tively. 293-Affinofile cells were maintained in Dulbecco’s modified Eagle’s me-
given isolate could be measured under multiple combinations dium–10% dialyzed fetal calf serum (D10F) supplemented with 50 g/ml blas-
of CD4/CCR5 expression levels. Mathematical transformation ticidin (D10F/B). Blasticidin was sufficient for maintaining short-term (⬍3
of the data and analysis of a “sensitivity vector” provided a months), stable, inducible expression of both CD4 and CCR5.
PBMCs. Normal donor PBMCs stimulated with phytohemagglutinin were
quantitative, sensitive, and comprehensive measure of an iso- maintained in RPMI-1640 medium with 20% fetal bovine serum, 1% L-glu-
late’s CD4 and CCR5 usage efficiencies. The results of deter- tamine, 1% penicillin–streptomycin, and 10 units/ml interleukin-2 (RPMI growth
mining this sensitivity vector for viral isolates with well-char- medium).
acterized sensitivities to entry and fusion inhibitors suggest Reagents and plasmids. Minocycline (Sigma Aldrich, St. Louis, MO) was
dissolved in either dimethyl sulfoxide or sterile water to generate a stock con-
that our vector metrics not only reflected known biological
centration of 1 mg/ml. PonA (Invitrogen, Carlsbad, CA) was dissolved in 100%
phenotypes but also quantified complex biological properties ethanol to generate a stock of 1 mM. Enfuvirtide, soluble CD4 (sCD4), TAK-
that have not been hitherto appreciated. Further application of 779, and nevirapine were acquired from the AIDS Research and Reference
vector metrics indicated that envelope clones derived from Reagent Program. Blasticidin HCl (Invitrogen, Carlsbad, CA) was dissolved in
elite suppressors (ES) had overall reduced entry efficiencies sterile water to generate a stock solution of 5 mg/ml. pNL4-3-GFP was obtained
from the NIH AIDS Research and Reference Reagent Program and contains
compared to those from chronically infected viremic progres- green fluorescent protein (GFP) within the envelope gene reading frame. The
sors (CP). The use of the vector metrics was also able to cluster SIV316 envelope plasmid was also obtained from the NIH AIDS Research and
ES envs as being distinct from CP envs based on their entry Reference Reagent Program.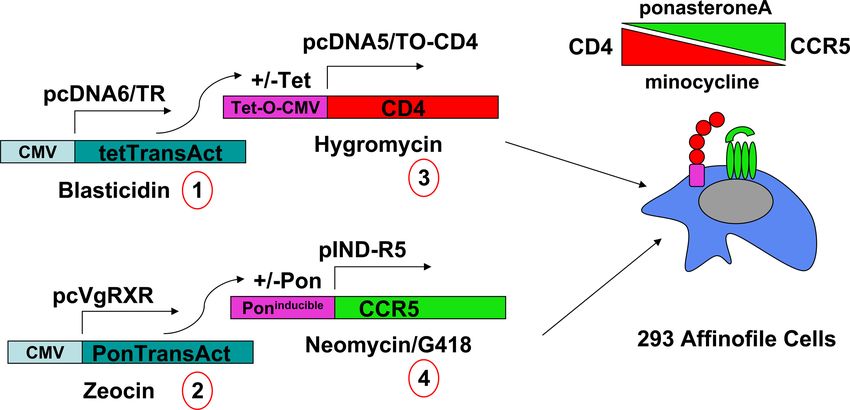
11018 JOHNSTON ET AL. J. VIROL.
Downloaded from http://jvi.asm.org/ on March 3, 2020 by guest
FIG. 2. CD4 and CCR5 can be independently and simultaneously regulated in the dually inducible 293-Affinofile cell line. Minocycline (A) and
PonA (B) induced CD4 and CCR5 expression without affecting one another. The dually inducible cells were seeded in 24-well plates 24 h before
induction with the indicated concentrations of minocycline or ponA. At 18 h after induction, CD4 and CCR5 expression levels were determined
by FACS analysis as described in Materials and Methods. Raw histogram data from a representative experiment are presented. (C) Quantification
of CD4 and CCR5 expression. Data shown are nonlinear regression curves for CD4 and CCR5 expression levels over the indicated range of
minocycline and ponA concentrations. Each minocycline and ponA data point is from six and five independent measurements, respectively. The
average numbers of ABS/cell ⫾ standard deviations are shown, although error bars are too small to be visible in some cases.
CD4 and CCR5 cell surface expression. Duplicate 24-well plates were seeded ison, WI). Samples were assessed for luciferase activity on a Bio-Rad Lumimark-
with 1.2 ⫻ 105 dually inducible 293-Affinofile cells/well, and expression of CD4 plus (Bio-Rad, Hercules, CA).
and CCR5 was induced the following day with minocycline and ponA, respec- Mathematical analysis. Minocycline and ponA concentrations were rescaled
tively. Cells were induced in a matrix format in serial dilutions from 0 to 5 ng/ml according to
of minocycline (CD4) and 0 to 4 M ponA (CCR5) and allowed to induce at
37°C for 18 h. Cells were then processed for quantitative fluorescence-activated
cytometry (qFACS) analysis (21) by using either phycoerythrin-conjugated anti-
ln冋关CD4兴
关CD4min兴 册 ln冋 关CCR5兴
关CCR5min兴 册
冋 册 冋 册
x⫽ and y ⫽ (1)
human CD4 antibody (clone Q4120; Invitrogen, Carlsbad, CA) or phycoerythrin- 关CD4max兴 关CCR5max兴
conjugated mouse anti-human CCR5 antibody (clone 2D7; BD Biosciences, San ln ln
关CD4min兴 关CCR5min兴
Jose, CA). Receptor expression levels were quantified by using a QuantiBRITE
fluorescence quantitation system (BD Biosciences, San Jose, CA) (20, 21). Re- where [CD4] and [CCR5] are the corresponding surface receptor densities (ABS/
gression curves were generated in Graphpad PRISM, where minocycline and cell) for each minocycline or ponA concentration. We indicate the minimum and
ponA concentrations could be converted to their corresponding cell surface maximum levels of the receptor CD4 as [CD4min] and [CD4max], respectively.
concentrations of CD4 and CCR5 in units of antibody binding sites per cell Likewise, [CCR5min] and [CCR5max] indicate the minimum and maximum levels
(ABS/cell ⫻ 103). of coreceptor. For the experiments performed with SIV316, BaL, and 89.6, the
Infection of 293-Affinofile cells. Twenty-four-well plates were seeded and in- averages (across all samples) of the minimum CD4 and CCR5 concentrations
duced as described above. Cells were then infected with 5 or 10 ng of p24 of each were independently measured to be [CD4min] ⫽ 2,189 and [CCR5min] ⫽ 1,199
virus (SIV316, 89.6, or BaL) in the presence of 40 g/ml DEAE-dextran. In- ABS/cell, respectively. Similarly, the averages of the maximum levels of receptor
fected cells were spinoculated for 2 h at 2,000 rpm and 37°C. The infection and coreceptor densities across all samples were measured to be [CD4max] ⫽
medium was then replaced with fresh D10F/B, and cells were incubated for 48 h 92,715 and [CCR5max] ⫽ 18,717. For all other experiments, we obtained mini-
at 37°C and 5% CO2. Infection was assessed by intracellular p24 staining (KC57- mum and maximum receptor and coreceptor levels by converting the minocycline
RD1 monoclonal antibody) according to the manufacturer’s instructions (Beck- and ponA concentrations according to the master regression curves shown in Fig.
man Coulter, Fullerton, CA). Mock-infected cells with various concentrations of 2C. The results of all of these experiments were analyzed using [CD4min] ⫽
minocycline and ponA were used as negative controls. For each viral isolate used, 1,800, [CCR5min] ⫽ 1,274, [CD4max] ⫽ 113,952, and [CCR5max] ⫽ 23,235. Using
additional wells were prepared as described above and infected in the presence these values for the physiological ranges of receptor and coreceptor in the scaling
of 50 M TAK-779 to determine the specificity of CCR5-mediated infection. defined in equation 1, the effective CD4 and CCR5 surface concentrations were
Single-cycle assays with luciferase reporter viruses. Envelope-pseudotyped represented by the variables x and y, respectively. The relevant ranges of x and y
luciferase reporter viruses were generated by cotransfection of 293T cells with 1 varied from approximately 0 for minimum surface concentrations to approxi-
g of the luciferase-encoding pseudotyping vector pNL-Luc.AM (37) and 1 g of mately 1 for maximum-level concentrations. With this rescaling, the viral infec-
envelope expression vector. Cells were washed after 24 h, and pseudoviruses tivity as a function of [CD4] and [CCR5] levels can be expressed as a function of
were collected after a subsequent 48 h. The relative numbers of particles were x and y, F(x, y), with the common relevant range of surface concentrations
determined by limiting-dilution reverse transcriptase (RT) assay (25). All defined by x 僆 [0, 1] and y 僆 [0, 1]. We find numerical values of F(x, y) for each
pseudotyped reporter viruses were used within the linear range of the assay. viral envelope by a two-dimensional least squares fit to the polynomial
Equivalent amounts (RT activity) of pseudotyped viruses were added to 293-
Affinofile cells previously induced with the indicated matrix formulation of F共x, y兲 ⫽ a ⫹ bx ⫹ cy ⫹ dx2 ⫹ ey2 ⫹ fxy (2)
minocycline and ponA. Forty-eight hours later, cells were washed with phos-
phate-buffered saline and lysed with 100 l of Glo lysis buffer (Promega, Mad- with the additional constraint that a ⱖ 0. This assumed form imposes a positive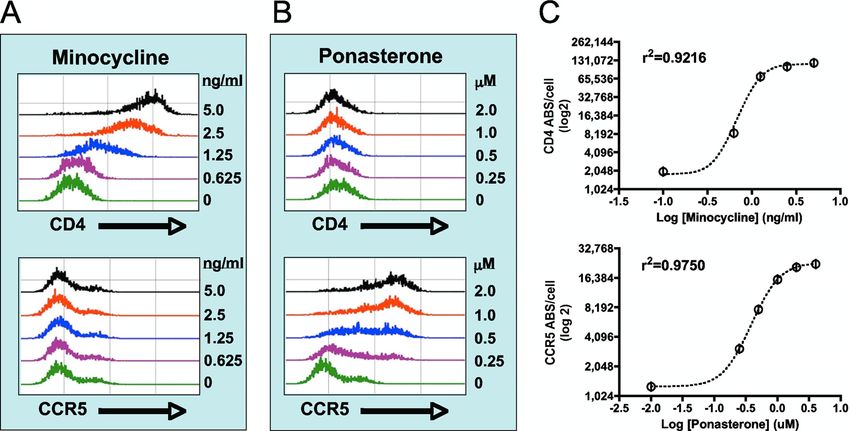
VOL. 83, 2009 AFFINITY PROFILING OF CD4/CCR5 USAGE PATTERNS 11019
level of infectivity at the minimum physiologic concentrations (x, y) ⫽ (0, 0). generated a dually inducible cell line in which the expression of
Each isolate results in a set of best-fit parameters (a, b, c, d, e, and f). Three- CD4 and CCR5 can be simultaneously and independently con-
dimensional (3-D) surface plots representing the least squares fit to the rescaled
data for each induction-infection experimental data set are independently de-
trolled with various concentrations of minocycline and ponA,
scribed in Results and shown in Fig. 3 and 5. From the function F(x, y), we find respectively (Fig. 2A and B). We used qFACS to measure the
the relative sensitivity of a viral isolate’s infectivity to variations in [CD4] and number of ABS/cell and found that specific concentrations of
[CCR5] by first defining the normalized gradient in the x-y plane minocycline and ponA reproducibly induced the same level of
F共x, y兲 F共x, y兲 CD4 and CCR5 expression on these cells (Fig. 2C). Thus,
ⵜF共x, y兲 ⫽ x̂ ⫹ ŷ (3) absolute CD4 and CCR5 expression levels (ABS/cell) could be
x y
inferred from the concentrations of minocycline and ponA
We define the “sensitivity vector,” , by integrating the gradient over the rele-
used (Fig. 2C). Minocycline induction of CD4 resulted in
vant ranges of x and y as follows:
⬃1,800 to 110,000 ABS/cell, while ponA induction of CCR5
冕冕
1 1
resulted in ⬃1,200 to 23,000 ABS/cell (Fig. 2C). These levels
ⵜF共x, y兲
Sជ ⫽ dx dy ⫽ Sx x̂ ⫹ Sy ŷ (4) are within the ranges of physiologic CD4 and CCR5 expression
兩ⵜF共x, y兲兩
0 0 found on primary targets of HIV-1 infection (21), as CD4 on
activated primary T cells can range upwards of 70,000 ABS/
Downloaded from http://jvi.asm.org/ on March 3, 2020 by guest
The direction of measures the relative sensitivity to changes in CD4 and
CCR5 expression levels. For example, if points predominantly in the x̂ direc- cell, whereas CCR5 on macrophages and T-cell subsets can
tion, viral entry is sensitive to changes in [CD4] but insensitive to variations in range from ⬃1,000 to 12,000 ABS/cell.
[CCR5]. The direction of can be summarized by the angle HIV-1 and SIV isolates have differential patterns of CD4
⫽ tan⫺1 冉冊Sy
Sx
(5)
and CCR5 usage that can be represented by distinct 3-D sur-
face plots. Next, we sought to determine if our dually inducible
cell lines could be used to reveal differences in the relative
The sensitivity vectors of the individual induction-infection experiments for
various viral isolates could be represented on polar plots as described in the
efficiency of CD4 and CCR5 usage among various R5 or R5X4
specific section in Results and shown in the figures indicated there. The vector isolates. As proof of principle, we first examined three well-
end points corresponding to were marked by circles of different colors, each characterized SIV and HIV-1 isolates. Infection was per-
color corresponding to a specific viral isolate. The vectors corresponding to each formed using 20 to 24 different concentrations of minocycline
isolate may exhibit various magnitudes, indicating a varying absolute sensitivity
and ponA, resulting in 20 to 24 distinct CD4 and CCR5 levels
to levels of surface CD4 or CCR5. This variation may arise from uncontrollable
factors, such as heterogeneity in the susceptible cell surface area and, more (ABS/cell) as measured by qFACS.
likely, variations in the viral stock used. Note that the vector magnitudes for the Infection with the “CD4-independent” SIV316 envelope
cloned SIV316 envelope-pseudotyped GFP reporter virus stock were much less pseudotyped on an NL4-3 backbone (Fig. 3A) resulted in a
variable than those for the primary BaL and 89.6 stocks expanded in primary pattern of infection that was relatively insensitive to changes in
PBMCs. Thus, these variations can be minimized by using cloned envelopes and
as more automated and high-throughput implementations of our assay provide
CD4 levels. That is, increasing CD4 alone (0 to 2.5 ng/ml of
larger numbers of measurements. Nonetheless, the relative sensitivities to minocycline) at any given level of CCR5 did not increase in-
changes in [CD4] and [CCR5] would be expected to vary less from sample to fection efficiency, whereas increasing CCR5 (0 to 4 uM ponA)
sample. This is demonstrated by the clustering of the sensitivity vector angles at any given level of CD4 markedly increased the percentage of
for the various viral isolates mentioned in Results.
infected cells (Fig. 3A). These findings are consistent with the
Both the vector magnitudes and angles were generally more tightly clustered
for the cloned envelopes pseudotyped onto an NL4-3 luciferase reporter back- known CD4 independence of SIV316 (5, 35) and indicate that
bone. Moreover, for these assays, we also determined the mean induction levels, our system can recapitulate known phenotypes.
M, (i.e., overall infectivity induced) for each sample as defined by The greatest variation for infectivity for differential expres-
sion of both CD4 and CCR5 was observed with BaL (Fig. 3B),
冕冕
1 1
M⫽ dx dy F共x, y兲 (6)
a lung-derived macrophage R5-tropic HIV-1 virus. Infection
with BaL increased as both CD4 and CCR5 levels were in-
0 0
creased. However, note that at the lowest level of CCR5, no
The circles marking the endpoints of are drawn with areas proportional to M amount of CD4 could “rescue” infection, whereas at the lowest
(equation 6; see second polar plot in relevant Results section). Larger circles
correspond to samples with an overall-higher level of induction. These luciferase-
level of CD4, increasing CCR5 expression allowed for a mod-
based measurements appear to be less noisy than the p24-based measurements; erate, two- to threefold increase in infection. This suggests that
this is suggested not only by clustered magnitudes of but also by consistency CCR5 levels are more limiting for virus entry and that low
of M. levels of CD4 (in comparison to CCR5) could be “scavenged”
Automated computational analysis. The analysis described above was imple-
more efficiently by the infecting virus.
mented via a user-friendly Web-based computing tool (VERSA [Viral Entry
Receptor Sensitivity Analysis]) found at http://versa.biomath.ucla.edu. The Web- 89.6 (Fig. 3C) is a blood-derived, dually tropic R5X4 virus.
site accepts raw or normalized data as an array of infectivity values as a function In direct contrast to SIV316 and BaL, at the lowest levels of
of CD4 and CCR5 concentrations. The program automatically normalizes and CCR5 expression (0 M ponA), increasing CD4 expression (0
rescales the CD4 and CCR5 concentrations to range between 0 and 1 and finds to 2.5 ng/ml minocycline) markedly increased infection effi-
the best-fit coefficients (a, b, c, d, e, and f) of the surface F(x, y). The mean
induction, sensitivity vector magnitude, and direction (the angle ) are also
ciency. However, at the lowest levels of CD4, no amount of
compiled. CCR5 could rescue infection. In effect, 89.6 could efficiently
use the low basal levels of CCR5 (⬃1,200 ABS/cell) for infec-
tion but was critically dependent on the level of CD4 present.
RESULTS
This was not due to the ability of 89.6 to use the low endoge-
CD4 and CCR5 can be independently and simultaneously nous level of CXCR4 present on 293 cells, as infection by all
regulated in a dually inducible cell line. In order to quantita- three isolates tested could be inhibited by TAK779 (⬎80%
tively assess the efficiency of CD4 and CCR5 usage, we first inhibition) under all induction conditions (data not shown),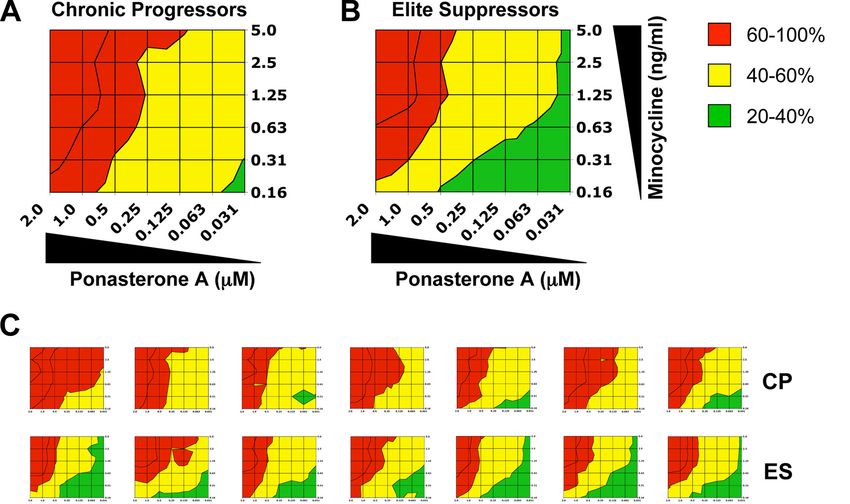
11020      JOHNSTON ET AL.                                                                                                               J. VIROL.

                                                                                                                                                      Downloaded from http://jvi.asm.org/ on March 3, 2020 by guest
   FIG. 3. HIV-1 and SIV isolates have differential patterns of CD4 and CCR5 usage that can be represented by distinct 3-D surface plots. The
infectivity of pseudotyped SIV316 (A) or replication-competent clones of BaL (B) and 89.6 (C) was tested under 20 to 24 different induction
conditions, as indicated. Infection was detected by intracellular p24 staining and quantified by FACS at 48 h postinfection. Data shown for each
virus are from a single experiment with representative results. To ensure that p24-positive cells represented infection from one infectious virion,
the titer of infectivity was determined so that maximum infection was less than ⬃10% p24-positive cells in a given experiment. On three
independent occasions, 89.6 infections gave maximum infectivity of 2.4%, 4.4%, and 8.8%; BaL infections gave maximum infectivity of 3.5%, 9.3%,
and 4.6%; and SIV316 gave maximum infectivity of 8.8%, 10.6%, and 8.5%. The patterns of CD4 and CCR5 usage, illustrated by the bar graphs
(A to C) for each virus, can be mathematically transformed into corresponding 3-D surface plots (D to F) which describe the percentage of infected
(p24 positive) cells (z axis) as a function of changes in CD4 (x axis) and CCR5 (y axis) levels (see equation 2 in Materials and Methods).

which underscores the CCR5-dependent behavior of these iso-                 represent the biological properties of a viral isolate in terms of
lates in our system.                                                        its efficiency of CD4 and CCR5 usage. To do this, we derived
   The distinct patterns of CD4 and CCR5 usage exhibited by                 a vector-based metric that quantifies the relative sensitivity of
each viral isolate (Fig. 3A to C) could be mathematically fitted            a viral isolate’s infectivity to changes in CD4 and CCR5 levels
to the corresponding 3-D surface plots shown in Fig. 3D to F.               from the function F(x, y). For each unit gradient on the math-
The efficiency of virus infection as a function of CD4 and                  ematical surface described by F(x, y), we first define a vector in
CCR5 levels was described by the topology of the surface plot,              the x-y plane that describes whether the viral infectivity is more
which could be expressed as a least squares fit to the polyno-              or less responsive to changes in CD4 (x axis) versus the re-
mial function F(x, y) ⫽ a ⫹ bx ⫹ cy ⫹ dx2 ⫹ ey2 ⫹ fxy, where                sponse to changes in CCR5 (y axis) levels. We then derive an
x and y were mathematically rescaled quantities representing                overall sensitivity vector, , by integrating the normalized gra-
the absolute cell surface expression levels (ABS/cell) of CD4               dient of the surface plot over the relevant ranges of x and y (see
and CCR5 (see Materials and Methods). The topology of the                   “Mathematical analysis”). The vector is therefore the normal-
surface plot for each virus was relatively distinct and stable              ized average of the local gradient in F(x, y) over the relevant area
from experiment to experiment (see Fig. 4 below). This sug-                 in the x-y plane; in other words, the direction of measures the
gested that the fitting surfaces could serve as a “fingerprint” of          relative sensitivity of virus infectivity to changes in CD4 versus
each individual isolate’s pattern of CD4 and CCR5 usage.                    CCR5 levels within the range of expression defined by the data
   Derivation of an angular metric that can quantify the effi-              shown in Fig. 2C. For example, if points predominantly in the
ciency of CD4 and CCR5 usage. In order to compare the                       y direction, the viral entry is more sensitive to changes in CCR5
mathematical surface plots associated with different isolates,              than CD4 levels. This is further illustrated in Fig. 4.
we sought to quantify their gross features that can effectively                Figure 4A shows a polar plot representing the sensitivity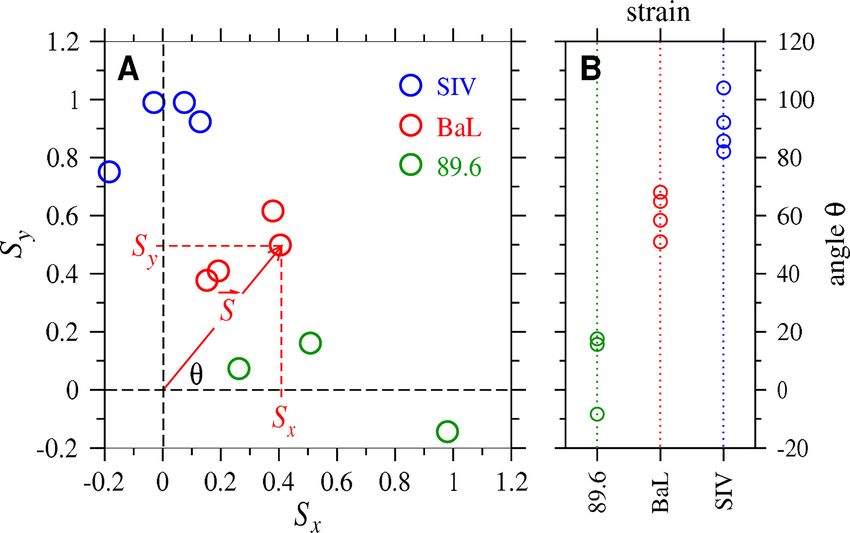
VOL. 83, 2009 AFFINITY PROFILING OF CD4/CCR5 USAGE PATTERNS 11021
peptide inhibitor), and sCD4 have been carefully evaluated
(23). To demonstrate the utility of our dually inducible cells for
a higher-throughput characterization of CD4 and CCR5 usage
patterns, we determined the relative infectivity of these HIV-1
envelope-pseudotyped luciferase reporter viruses using 48 dif-
ferent combinations of minocycline and ponA concentrations
in a single experiment. The four envelopes used were (i) a pri-
mary clade B R5 HIV-1 isolate (B5), B5-91US056 [B5(YA)]; (ii)
an isogenic B5 variant containing two V3 crown mutations
(Y318A319 to R318T319) that increase susceptibility to entry
inhibitors [B5(RT)]; (iii) a chimeric NL4-3 envelope with the
V3 region from a primary clade A R5 HIV-1 isolate (NL4-3-
A1), A1-92RW009 [NL43(YA)]; and (iv) the above-described
homologous V3 crown mutations in this context [NL43(RT)]
(23). The V3 crown mutations invariably rendered the enve-
Downloaded from http://jvi.asm.org/ on March 3, 2020 by guest
FIG. 4. Sensitivity vector angles reflect distinct patterns of CD4
and CCR5 usage. (A) Polar plot of the sensitivity vectors derived from lope more susceptible to CCR5 and fusion peptide inhibitors
each surface plot shown in Fig. 3. The results of each independent (23 and data not shown).
induction-infection experiment resulting in a surface plot are repre- For the B5 envelope, B5(YA) (Fig. 5A), there is a threshold
sented by a circle, defining the end point of its sensitivity vector (see
text and “Mathematical analysis” for details). The vector end points level of CD4 that is required for efficient infection. Notably, at
corresponding to are marked by colored circles, each color corre- the lowest level of CD4 expression (0.16 ng/ml minocycline),
sponding to a particular viral isolate. Each circle therefore represents no amount of CCR5 could rescue infection (Fig. 5A). How-
the results of an independent induction-infection experiment consist- ever, above 0.31 ng/ml of minocycline, increasing CCR5 levels
ing of one isolate infecting the cells at 20 to 24 different levels of CD4
(ponA) resulted in a corresponding increase in infectivity. In-
and CCR5. The three viruses examined are clustered into three qual-
itatively distinct groups (indicated by different colors). (B) The CD4/ deed, at any given ponA concentration, increasing CD4 levels
CCR5 usage pattern for each isolate is reflected by its sensitivity angle, also increased infectivity. Primary envelopes like B5 have de-
⫽ tan⫺1(Sy/Sx). The angles for each isolate exhibit clustering and are creased susceptibility to sCD4 neutralization compared with
significantly different from each other when plotted (P ⬍ 0.0002, one- the susceptibility of the chimeric NL4-3-A1 envelope (data not
way ANOVA).
shown), suggesting a lower affinity for CD4 and, thus, a greater
dependence on the level of cell surface CD4 for efficient in-
fection. Both B5(YA) and B5(RT) exhibited the same CD4
vectors for all viral isolates examined in Fig. 3. The angle usage pattern and sensitivity to sCD4 (Fig. 5A and B and data
of is a scalar metric describing the relative sensitivity of virus not shown).
entry to changes in CD4 (Sx) and CCR5 (Sy) levels. Note that In contrast, the chimeric NL43(YA) envelope shows a dif-
the sensitivity vectors of the different viral isolates clustered ferent pattern of infection with respect to CD4 usage (Fig. 5C).
into significantly different groups (P ⬍ 0.0002, one-way analysis NL4(YA) contains the CD4 binding site derived from the
of variance [ANOVA]) (Fig. 4A and B), suggesting that each T-cell line-adapted virus NL4-3, and consequently, these vi-
independent induction gave a reproducible and quantifiable ruses are significantly neutralized by sCD4 (data not shown),
metric for a given virus. For example, Fig. 4B shows that the suggesting a higher affinity for CD4. Consistent with this, in-
SIV316 vectors were clustered with close to 90°, suggesting fection with NL4-3-A1, even at the lowest CD4 level (0.16
that SIV316 infection, under our assay conditions, was much ng/ml minocycline), was significantly enhanced as CCR5 levels
more sensitive to changes in [CCR5] than in [CD4]. On the (ponA) were increased (Fig. 5C). Note that the B5(YA) enve-
other hand, the 89.6 vectors were clustered near the x axis ( ⬍ lope exhibited no increase in infection under similar conditions
30°), indicating that 89.6 could scavenge the low basal levels of (compare Fig. 5A and C). The higher affinity of the NL4-3-A1
CCR5 in our system and that infection was sensitive to changes envelope for CD4 is underscored by its ability to scavenge the
in CD4 but not CCR5 levels. The for BaL had angles 50° ⱕ low basal levels of CD4 in our system: above a minimal level of
ⱕ 80°, indicating that BaL infection was slightly more sensi- CD4 (0.31 ng/ml minocycline), the efficiency of infection de-
tive to changes in CCR5 levels. Our results show that the pended almost exclusively on CCR5 expression levels. Again,
angles captured the overall direction of the surface F(x, y) the CD4 usage pattern was similar for both NL43(YA) and
and provided a quantitative measure to compare the efficiency NL43(RT).
of CD4 and CCR5 usage between viral isolates. Note that the The Y318A319-to-R318T319 V3 crown mutations rendered en-
SIV316 vectors clustered more tightly than the BaL or 89.6 velopes more susceptible to CCR5 and fusion peptide inhibi-
vectors, as SIV316 infections were performed with cloned- tors (23), which was reflected in the pattern of CCR5 usage for
envelope-pseudotyped NL4-3-GFP reporter viruses, while BaL both B5 and NL4-3-A1. B5(RT) exhibited a reduced efficiency
and 89.6 were primary isolates expanded in primary PBMCs. of CCR5 usage compared to that of B5(YA). Notably, at the
CD4 and CCR5 usage patterns reflect sensitivities to entry lowest level of CCR5 (0.015 M ponA), infection efficiency
inhibitors. Our sensitivity vectors and angular metrics could was much less enhanced for B5(RT) than for B5(YA) as CD4
also be used to predict the susceptibility of a given envelope levels were increased (compare Fig. 5A and B). Moreover, the
glycoprotein to various entry inhibitors. To show this, we chose half-maximal infection response was achieved at significantly
four HIV-1 envelopes (two paired sets) whose sensitivities to lower CCR5 levels for B5(YA) than for B5(RT) (Fig. 5 and
CCR5 inhibitors (TAK-779 and 2D7), enfuvirtide (a fusion data not shown). Similar trends were observed for NL43(YA)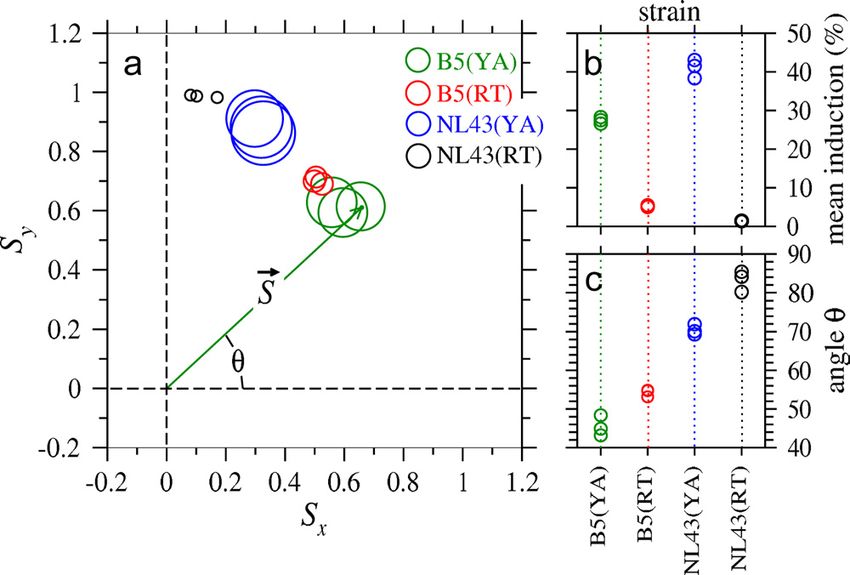
11022 JOHNSTON ET AL. J. VIROL.
Downloaded from http://jvi.asm.org/ on March 3, 2020 by guest
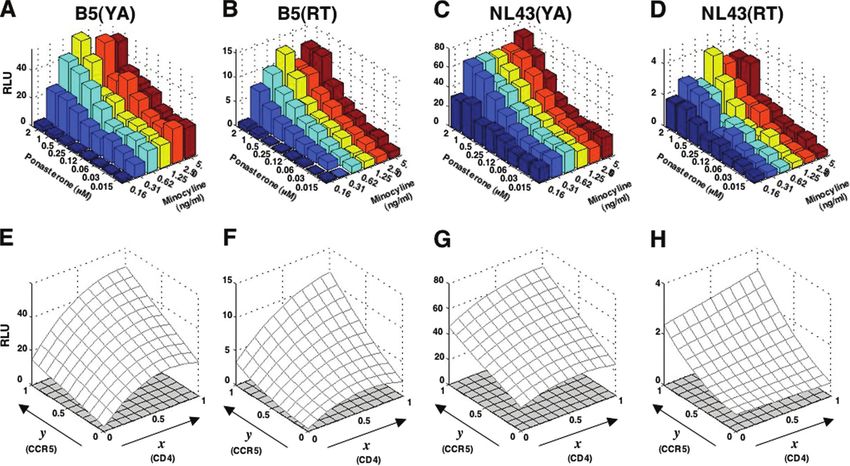
FIG. 5. CD4 and CCR5 usage patterns reflect sensitivities to entry inhibitors. Four HIV-1 envelopes (two paired sets) with well-characterized
differential sensitivities to CCR5 inhibitors (TAK-779 and 2D7), enfuvirtide (a fusion peptide inhibitor), and sCD4 were chosen. Equivalent
amounts (RT activity) of four HIV-1 envelope-pseudotyped luciferase reporter viruses, B5(YA) (A, E), B5(RT) (B, F), NL43(YA) (C, G), and
NL43(RT) (D, H), were used to infect the dually inducible cells at 48 different combinations of minocycline (0.015 to 5.0 ng/ml) and ponA (0.015
to 2.0 uM) concentrations. Each infection was performed in triplicate. Data shown are from one replicate; raw luciferase values (relative light units
[RLU]) are shown to illustrate that the V3 R318T319 mutants reproducibly resulted in less-efficient viral entry at any given level of CD4/CCR5
compared to the viral entry of their V3 Y318A319 counterparts. This property was also captured by the radii of the circles at the end points of the
sensitivity vectors in the polar plot shown in Fig. 6. The standard deviation for each data point was less than 10% of the value shown. The patterns
of CD4 and CCR5 usage, illustrated by the 3-D bar graphs (A to D) for each virus, were mathematically transformed into corresponding 3-D
surface plots (E to H) which describe the efficiency of virus infection as a function of changes in CD4 and CCR5 levels, F(x, y).
versus NL43(RT), where the V3 RT mutant also showed a isolates clustered farther away from the CD4 (Sx) axis ( ⬎ 70°)
reduced efficiency of CCR5 usage compared to that of the YA than both B5 isolates ( ⬍ 55°) (Fig. 6A and C), indicating that
counterpart (Fig. 5C and D). Thus, our Affinofile system pro- the infection efficiency of NL4-3-A1 isolates was less sensitive
vides direct evidence that increased sensitivity to CCR5 inhib- to changes in CD4 levels. This is consistent with the higher
itors could be due to a decreased efficiency of CCR5 usage. affinity of laboratory-adapted strains (NL4-3) for CD4 and
Figure 5E to H shows the corresponding 3-D surface plots their corresponding increase in susceptibility to sCD4 neutral-
for the isolates examined in Fig. 5A to D. These were gener- ization (36).
ated using the same function, F(x, y), that was described for Furthermore, for both B5 and NL4-3-A1 viruses, the V3 RT
Fig. 3. In contrast to the distinct topologies exhibited for crown mutants shifted their sensitivity angles toward the CCR5
SIV316, BaL, and 89.6 in Fig. 3, the surface plot topologies (Sy) axis relative to those of their V3 YA counterparts (Fig. 6A
for the B5 and NL4-3-A1 viruses were relatively similar. While and C, increases of 5 to 15°), indicating increased sensitivity
this is consistent with their dependence on both CD4 and to changes in [CCR5]. Thus, although overall CD4/CCR5 us-
CCR5 levels, it does not immediately reveal their efficiency of age as represented by the surface plots was somewhat similar
CD4 and CCR5 usage. Thus, we derived the sensitivity vector among the isolates, as shown in Fig. 5E to H, the sensitivity
for each surface plot for a more quantitative comparison. vectors were able to reveal clear differences among the strains
Our sensitivity vector-based angular metric can quantify that were consistent with their biological phenotypes. Of note,
subtle differences in CD4 and CCR5 usage patterns. Fig. 6 for the viruses examined here, both V3 RT mutants exhibited
shows a polar plot representing the sensitivity vectors for the overall lower levels of viral entry (M ⬍ 10%) than their V3 YA
surface plots shown in Fig. 5E to H. As described for Fig. 4, the counterparts (M ⬎ 25%) (Fig. 6B), as represented by the circle
vector end points corresponding to are marked by colored sizes at the vector end points (mean induction values; see
circles, with each color corresponding to a particular viral equation 6 in “Mathematical analysis”) and consistent with
isolate. The induction-infection experiment was performed in their decreased replicative fitness (23). Thus, the sensitivity
triplicate. The sensitivity vectors for the different isolates were angles, , and the mean induction levels, M, as an overall
tightly clustered based on their angular metric. Both NL4-3-A1 measure of CD4/CCR5 usage efficiency, were clearly able toVOL. 83, 2009 AFFINITY PROFILING OF CD4/CCR5 USAGE PATTERNS 11023
Downloaded from http://jvi.asm.org/ on March 3, 2020 by guest
FIG. 6. Sensitivity vector metrics can quantify and differentiate
subtle differences in CD4 and CCR5 usage patterns. (a) Polar plot of
the sensitivity vectors shown in Fig. 5 for each isolate. The radius of
each circle is proportional to the mean induction level, M, of virus
entry for each sample. See “Mathematical analysis” (equation 6) for
the formula for M. Larger circles correspond to samples with an overall
higher level of virus entry. (b) Circle radii, indicative of the overall
level of infection (M) induced by changes in CD4/CCR5 expression
levels, were plotted and compared for each isolate. M is expressed as
a percentage of the induction level at the highest values of CD4 and
CCR5. (c) Virus isolates were clustered by their sensitivity angles, ⫽
tan⫺1(Sy/Sx). values for each isolate are plotted and show robust
clustering (P ⬍ 0.01, one-way ANOVA).
distinguish even between viral isolates that gave grossly similar
surface plots.
Sensitivity vector analysis of envelope clones derived from FIG. 7. Sensitivity vector analysis reveals differences between en-
ES versus CP. Recently, using the Affinofile cells, ES envelope velope clones derived from ES and those from CP. Normalized infec-
clones were shown to have reduced entry efficiency at fixed tion data using ES- and CP-derived envelope clones were imported to
(high and low) CD4 and CCR5 concentrations compared to VERSA according to the detailed instructions on the Website (http:
that of CP clones (19). Curiously, due to the large variation in //versa.biomath.ucla.edu). Sensitivity vector angles and magnitudes
and mean induction levels were obtained for each envelope clone. The
50% inhibitory concentrations between individual env clones, number of independent envelope clones obtained for each patient
the difference between envelopes from the ES and CP groups ranged from 2 to 12. The vector metrics were first averaged for each
with regard to their susceptibility to inhibition by CCL5 individual, and the averaged metrics from the seven individuals in each
(RANTES), TAK779, or Enfuvirtide appears less marked (19), group (CP or ES, n ⫽ 14) were then compared. The median values and
interquartile ranges of the sensitivity vector angles (A), mean induc-
suggesting that indirect or surrogate markers for entry receptor tion levels (B), and magnitudes (C) for the CP and ES groups are
usage efficiencies may not always reveal underlying differences shown. The entire comparison was performed in duplicate. P values
in their biological phenotypes. The study of Lassen et al. (19) were generated by the nonparametric unpaired t test. NS, not signifi-
evaluated the infectivity of more than 70 independent plasma cant.
virus envelope clones derived from seven ES and seven CP at
42 distinct CD4/CCR5 expression levels using six and seven
different combinations of minocycline and ponA concentra- values exhibited by the CP group (Fig. 7A) also indicated that
tions, respectively. In order to apply sensitivity vector analysis the infection efficiencies of CP envs were more sensitive to
to this large data set, we developed a Web-based automated CCR5 expression levels, and, in combination with their higher
computational platform (http://versa.biomath.ucla.edu) known M, reflected the more efficient use of CCR5 at any given level
as VERSA (Viral Entry Receptor Sensitivity Analysis), where of CD4 expression than was found for the ES envs. This is
anyone using the Affinofile cells can upload raw or normalized further illustrated by the color-coded surface area projection
infection data and obtain sensitivity vector metrics (vector an- graphs shown in Fig. 8, which are the averaged induction-
gle, magnitude, and mean induction levels) (see Materials and infection responses from the more than 70 envelopes for the
Methods). CP versus the ES group. Note that at any given CD4 level,
The VERSA results indicated that the vector angles () and efficient (⬎60%) or moderate (40 to 60%) infectivity was
mean induction levels (M) were significantly lower in the ES achieved at lower CCR5 levels for the CP than for the ES
than in the CP group (Fig. 7A and B, respectively). The lower envelope clones (Fig. 8A and B, respectively). In other words,
mean induction (M) of ES clones is consistent with their over- in every row represented by a minocycline concentration, effi-
all reduced entry efficiency compared to that of CP clones, as cient and moderate infectivity results always occupied a pro-
described in Lassen et al. (19). However, the higher angle portionately greater area for the CP group than for the ES11024 JOHNSTON ET AL. J. VIROL.
Downloaded from http://jvi.asm.org/ on March 3, 2020 by guest
FIG. 8. CP envelopes are more efficient than ES envelopes at using CCR5 for viral entry. Normalized viral infectivity data were obtained for
CP and ES envelope clones, as described in Lassen et al. (19). The infectivity (relative light units) at the highest minocycline and ponA
concentrations was set at 100%. The relative infectivity for each envelope clone was obtained at 42 different combinations of minocycline and ponA
concentrations, and the infectivity averaged for all CP clones (A) versus ES clones (B). A 3-D surface plot of the relative infectivity at each
minocycline ([CD4]) and ponA ([CCR5]) concentration was projected onto a 2-D surface using a standard Excel function, and the information on
the z axis (relative infectivity, % maximal infection) was color coded as indicated. (C) The averaged infectivity responses for individual CP (n ⫽
7) and ES (n ⫽ 7) are shown. Data are presented and color coded exactly as described for panels A and B.
group. This pattern also held true when envelope clones from Fig. 6 and 7, may be used to correlate the efficiency of CD4 and
each individual patient from the CP and ES groups were com- CCR5 usage with various aspects of viral pathogenicity. For
pared (Fig. 8C). This increased efficiency of CCR5 usage was example, the increased pathogenicity and/or fusogenicity of
not apparent from the results of competition studies with AIDS versus pre-AIDS R5 strains has been attributed to their
CCR5 inhibitors, as ES and CP clones did not show significant increased efficiency of CD4 and/or CCR5 usage, as demon-
differences in their susceptibility to CCL5 (RANTES) and strated by increased resistance to various entry inhibitors (31,
TAK779 (19). 44). Conversely, acutely transmitted “founder” viruses, though
R5 tropic, can grow in activated PBMCs but not primary mac-
DISCUSSION rophages (42). Indeed, increased macrophage tropism has
been used as a surrogate marker for the ability to use low levels
Our Affinofile system provides a more comprehensive
of CCR5 (7, 9). However, Goodenow and Collman (7) have
method to characterize the CD4 and CCR5 usage pattern of
cautioned that coreceptor preference can be distinct from tar-
extant R5 isolates; in essence, their efficiency of CD4 and
get cell tropism. Thus, not all R5-tropic strains can use CCR5
CCR5 usage generates a signature 3-D surface plot which can
on macrophages, and dually X4R5-tropic strains may use one
then be correlated with the clinical or pathogenic characteris-
coreceptor on one cell type and not the other. 293-Affinofile
tics of the virus. We wish to emphasize that each virus always
cells present a unique opportunity to directly examine the
gave its signatory surface curve in multiple independent exper-
iments and that its vector metrics, derived from the function efficiency of CD4 and CCR5 usage of viral isolates over a
F(x, y) that describes the topology of the surface plot, can be wide range of expression levels; the ability to ascribe a quan-
used for quantitative comparisons of CD4 and CCR5 usage titative metric that defines an isolate’s overall CD4/CCR5 us-
patterns. The robustness of the assay system and the mathe- age efficiency may illuminate the complexities that underlie the
matical transformation that results in the sensitivity vectors is biological phenotypes mentioned above.
underscored by the clustering of the values for each of the Recently, entry inhibitors, such as enfurtivide (T-20) and
viral isolates examined (Fig. 4 and 6). We propose to call our maraviroc (a CCR5 antagonist), have emerged as a new class
system 293-Affinofile cells to reflect their ability to profile the of drugs to treat HIV. Not surprisingly, viral resistance mech-
receptor affinities of viral isolates. anisms have already been identified (40, 49). Current CDC
Primary biological isolates from well-defined cohorts can be HIV treatment guidelines recommend the use of coreceptor
subjected to the same analysis, and their patterns of CD4 and tropism assays (Trofile) prior to starting maraviroc. The Trofile
CCR5 usage, reduced to the metrics whose results are shown in assay is also proscribed in the case of treatment failure whileVOL. 83, 2009 AFFINITY PROFILING OF CD4/CCR5 USAGE PATTERNS 11025
on a regimen including an entry inhibitor (32). The use of CCR5 usage, but the application of sensitivity vector analysis
293-Affinofile cells may complement the Trofile assay to better to clinical isolates may have implications for guiding entry
predict the success of regimens that include entry inhibitors inhibitor use.
and may also provide better insights into mechanisms under-
ACKNOWLEDGMENTS
lying CCR5 inhibitor resistance. For example, for CCR5 in-
hibitor-resistant isolates that have been shown to use the in- S.H.J. was supported in part by NIH grant T32 AI 060567. M.A.L.
hibitor-bound form of CCR5 (37, 48, 49), Moore and was supported in part by NIH grant T32 GM07250 and the Case
Medical Scientist Training Program. This work was supported by NIH
colleagues used our 293-Affinofile cells to show that the degree
grants AI49170, AI57005, and AI058894 to E.J.A.; National Science
of resistance is inversely proportional to the level of CCR5 cell Foundation (DMS-0349195) and NIH (K25 AI41935) grants to T.C.;
surface expression (38). In addition, the extent of inhibitor and NIH grants AI52021 and AI55305 and a Burroughs Wellcome
resistance, as measured by the plateau inhibitory effect (and Fund Career Development Award to B.L. We also acknowledge sup-
represented by the maximal percent inhibition value) in the port from the UCLA AIDS Institute, the UCLA Center for AIDS
Research (UCLA CFAR grant, NIH AI28697), and the Pendleton
presence of a saturating amount of inhibitor (vicriviroc or Charitable Trust.
maraviroc), can vary significantly between two different inhib-
REFERENCES
itor-resistant isolates, especially when CCR5 levels are limiting
Downloaded from http://jvi.asm.org/ on March 3, 2020 by guest
1. Agrawal-Gamse, C., F.-H. Lee, B. Haggarty, Y. Yi, B. Lee, R. G. Collman,
(38). This nuance may not be appreciated when using the J. A. Hoxie, R. W. Doms, and M. M. Laakso. 2009. Adaptive mutations in a
commercial Trofile assay to generate resistance profiles, as the human immunodeficiency virus type 1 envelope protein with a truncated V3
Trofile assay relies on U87-CD4/CCR5 cells (50) that express loop restore function by improving interactions with CD4. J. Virol. 83:
11005–11015.
very high levels of CCR5. It would be of interest to determine 1a.Blaak, H., L. J. Ran, R. Rientsma, and H. Schuitemaker. 2000. Susceptibility
how inhibitor resistance phenotypes would be reflected in of in vitro stimulated PBMC to infection with NSI HIV-1 is associated with
changes in sensitivity vector metrics. levels of CCR5 expression and beta-chemokine production. Virology 267:
237–246.
In the case of the V3 RT isolates, the angular metric sug- 2. Blanpain, C., B. Lee, M. Tackoen, B. Puffer, A. Boom, F. Libert, M. Sharron,
gests that their infection efficiency is more sensitive to changes V. Wittamer, G. Vassart, R. W. Doms, and M. Parmentier. 2000. Multiple
nonfunctional alleles of CCR5 are frequent in various human populations.
in CCR5 levels ( shifts closer to 90°) and, thus, would be more Blood 96:1638–1645.
sensitive to CCR5 inhibitors and, by extension, fusion peptide 3. Brown, B. K., J. M. Darden, S. Tovanabutra, T. Oblander, J. Frost, E.
inhibitors. We have confirmed this experimentally (23 and data Sanders-Buell, M. S. de Souza, D. L. Birx, F. E. McCutchan, and V. R.
Polonis. 2005. Biologic and genetic characterization of a panel of 60 human
not shown). The decreased efficiency of CCR5 usage likely immunodeficiency virus type 1 isolates, representing clades A, B, C, D,
prolongs the target window of opportunity for CCR5 inhibitors CRF01_AE, and CRF02_AG, for the development and assessment of can-
or peptide inhibitors of six-helix bundle formation to work. didate vaccines. J. Virol. 79:6089–6101.
4. Doms, R. W., and J. P. Moore. 2000. HIV-1 membrane fusion: targets of
However, sensitivity angles should only be interpreted in the opportunity. J. Cell Biol. 151:F9–F14.
context of their mean induction levels (M). For the V3 crown 5. Edinger, A. L., J. L. Mankowski, B. J. Doranz, B. J. Margulies, B. Lee, J.
Rucker, M. Sharron, T. L. Hoffman, J. F. Berson, M. C. Zink, V. M. Hirsch,
mutants, the YA-to-RT mutations also led to a decrease in M, J. E. Clements, and R. W. Doms. 1997. CD4-independent, CCR5-dependent
indicating an overall decrease in infection efficiency for the RT infection of brain capillary endothelial cells by a neurovirulent simian im-
mutants due to their dependence on higher levels of CCR5 for munodeficiency virus strain. Proc. Natl. Acad. Sci. USA 94:14742–14747.
6. Reference deleted.
efficient infection. On the other hand, for the comparison of 7. Goodenow, M. M., and R. G. Collman. 2006. HIV-1 coreceptor preference is
the CP versus ES clones, the increase in both sensitivity vector distinct from target cell tropism: a dual-parameter nomenclature to define
angles and mean induction levels (M) for the CP clones (Fig. 7) viral phenotypes. J. Leukoc. Biol. 80:965–972.
8. Gorry, P. R., G. Bristol, J. A. Zack, K. Ritola, R. Swanstrom, C. J. Birch,
indicates that their overall increased infection efficiency is J. E. Bell, N. Bannert, K. Crawford, H. Wang, D. Schols, E. De Clercq, K.
likely due to their more efficient usage of CCR5 (Fig. 8). Kunstman, S. M. Wolinsky, and D. Gabuzda. 2001. Macrophage tropism of
human immunodeficiency virus type 1 isolates from brain and lymphoid
Conversely, it implies that ES clones have reduced entry effi- tissues predicts neurotropism independent of coreceptor specificity. J. Virol.
ciencies and a reduced ability to use low levels of CCR5. 75:10073–10089.
There is a growing body of evidence that the ability to use 9. Gorry, P. R., M. Churchill, S. M. Crowe, A. L. Cunningham, and D.
Gabuzda. 2005. Pathogenesis of macrophage tropic HIV-1. Curr. HIV Res.
low levels of CD4 and coreceptor contributes to expanded 3:53–60.
cellular tropism and disease pathogenesis. Until now, studies 10. Gorry, P. R., J. Taylor, G. H. Holm, A. Mehle, T. Morgan, M. Cayabyab, M.
have been limited by using surrogate or indirect assays for the Farzan, H. Wang, J. E. Bell, K. Kunstman, J. P. Moore, S. M. Wolinsky, and
D. Gabuzda. 2002. Increased CCR5 affinity and reduced CCR5/CD4 depen-
efficiency of CD4 and CCR5 usage. Our 293-Affinofile cells can dence of a neurovirulent primary human immunodeficiency virus type 1
be used to directly measure and profile the CD4/CCR5 usage isolate. J. Virol. 76:6277–6292.
11. Gray, L., J. Sterjovski, M. Churchill, P. Ellery, N. Nasr, S. R. Lewin, S. M.
efficiency of any given viral isolate and provide novel quanti- Crowe, S. L. Wesselingh, A. L. Cunningham, and P. R. Gorry. 2005. Uncou-
tative metrics that can be used for multiple comparisons. We pling coreceptor usage of human immunodeficiency virus type 1 (HIV-1)
have automated the complex computational analysis required from macrophage tropism reveals biological properties of CCR5-restricted
HIV-1 isolates from patients with acquired immunodeficiency syndrome.
to derive the sensitivity vector metrics on a Web-based plat- Virology 337:384–398.
form (http://versa.biomath.ucla.edu) so that anyone using our 12. Huang, W., S. H. Eshleman, J. Toma, S. Fransen, E. Stawiski, E. E. Paxinos,
Affinofile cells can obtain the vector metrics by imputing the J. M. Whitcomb, A. M. Young, D. Donnell, F. Mmiro, P. Musoke, L. A. Guay,
J. B. Jackson, N. T. Parkin, and C. J. Petropoulos. 2007. Coreceptor tropism
raw infectivity data as described above. In an accompanying in human immunodeficiency virus type 1 subtype D: high prevalence of
study, Doms and colleagues used our Affinofile cells and CXCR4 tropism and heterogeneous composition of viral populations. J. Vi-
rol. 81:7885–7893.
VERSA, in part, to show that a V3 loop-truncated R5 virus 13. Kimata, J. T., J. J. Gosink, V. N. KewalRamani, L. M. Rudensey, D. R.
envelope compensated for its inefficient usage of CCR5 by Littman, and J. Overbaugh. 1999. Coreceptor specificity of temporal variants
increasing its ability to use low levels of CD4 (1). Not only is of simian immunodeficiency virus Mne. J. Virol. 73:1655–1660.
14. Kimata, J. T., L. Kuller, D. B. Anderson, P. Dailey, and J. Overbaugh. 1999.
our system a valuable tool for better understanding the rela- Emerging cytopathic and antigenic simian immunodeficiency virus variants
tionship between viral pathogenesis and the efficiency of CD4/ influence AIDS progression. Nat. Med. 5:535–541.You can also read