Weather systems and extreme rainfall generation in the 2019 north Queensland floods compared with historical north Queensland record floods
←
→
Page content transcription
If your browser does not render page correctly, please read the page content below
CSIRO PUBLISHING

Journal of Southern Hemisphere Earth Systems Science, 2021, 71, 123–146
https://doi.org/10.1071/ES20005

     Weather systems and extreme rainfall generation in the
     2019 north Queensland floods compared with historical
     north Queensland record floods

     Jeff Callaghan

     Retired. Formerly of Bureau of Meteorology Brisbane, Queensland, Australia.
     Email: jeffjcallaghan@gmail.com

     Abstract. Earlier papers have addressed floods from warm-air advection (WAA) in southeast Australia and around the
     globe, and extreme rainfall in US hurricanes and Australian tropical cyclones (TCs). This is the first paper to address the
     WAA phenomena in causing monsoon and TC floods and in TC-like systems which develop over the interior of northern
     Australia. The inland events help explain Australia’s worst tropical flooding disaster in 1916. A disastrous series of floods
     during late January and early February 2019 caused widespread damage in tropical north Queensland both in inland
     regions and along the coast. This occurred when some large-scale climate influences, including the sea surface
     temperatures suggested conditions would not lead to major flooding. Therefore, it is important to focus on the weather
     systems to understand the processes that resulted in the extreme rainfall responsible for the flooding. The structure of
     weather systems in most areas involved a pattern in which the winds turned in an anticyclonic sense as they ascended from
     the low to middle levels of the atmosphere (often referred to as WAA) which was maintained over large areas for 11 days.
     HYSPLIT air parcel trajectory observations were employed to confirm these ascent analyses. Examination of a period
     during which the heaviest rain was reported and compared with climatology showed a much stronger monsoon circulation,
     widespread WAA through tropical Queensland where normally its descending equivalent of cold-air advection is found,
     and higher mean sea level pressures along the south Queensland coast. The monsoon low was located between strong deep
     monsoon westerlies to the north and strong deep easterlies to the south which ensured its slow movement. This non-TC
     event produced heavy inland rainfall. Extreme inland rainfall is rare in this region. Dare et al. (2012), using data from 1969/
     70 to 2009/10, showed that over north Queensland non-TC events produced a large percentage of the total rainfall. The
     vertical structure associated with one of the earlier events that occurred in 2008 had sufficient data to detect strong and
     widespread WAA overlying an onshore moist tropical airstream. This appears to have played a crucial role in such extreme
     rainfall extending well inland and perhaps gives insight to the cause of a 1916 flooding disaster at Clermont which claimed
     around 70 lives. Several other events over the inland Tropics with strong WAA also help explain the 1916 disaster.

     Keywords: extreme rainfall, floods, historical records, monsoon rainfall, natural disaster, tropical weather, warm-air
     advection.

     Received 17 August 2020, accepted 25 February 2021, published online 29 March 2021

1 Introduction                                                         Weather Service web site comes the following warming, ‘In the
This is the first paper to address the anticyclonic turning of the     last 30 years, inland flooding has been responsible for more than
winds with height (warm-air advection (WAA) phenomena) in              half the deaths associated with tropical cyclones in the United
causing monsoon and tropical cyclone (TC) floods in the northeast      States’.
Australian tropics and in TC-like systems which develop over the           Hurricane Harvey was a catastrophic example of this and is
interior of northern Australia. We earlier addressed floods from       the second-most costly hurricane in US history (Blake and
WAA in southeast Australia and around the globe, and extreme           Zelinsky 2018), after accounting for inflation, behind only
rainfall in US hurricanes and Australian TCs.                          Katrina (in 2005). At least 68 people died most from freshwater
    Inland freshwater flooding can have catastrophic conse-            flooding from the direct effects of the storm in Texas, the largest
quences. Czajkowski et al. (2017) showed that freshwater               number of direct deaths from a TC in that state since 1919.
flooding economic losses were twice as high as storm surge             There were 52 deaths from Hurricane Florence (in 2018), with
losses from all substantial TCs in the US between 2001 and             the majority resulting from freshwater flooding (Stewart and
2014. Furthermore, the losses from inland flooding were nearly         Berg 2019). This makes Florence the ninth-most-destructive
as great as those from coastal flooding. From the US National          hurricane to affect the US. Both these events were associated

Journal compilation Ó BoM 2021 Open Access CC BY-NC-ND                                                    www.publish.csiro.au/journals/es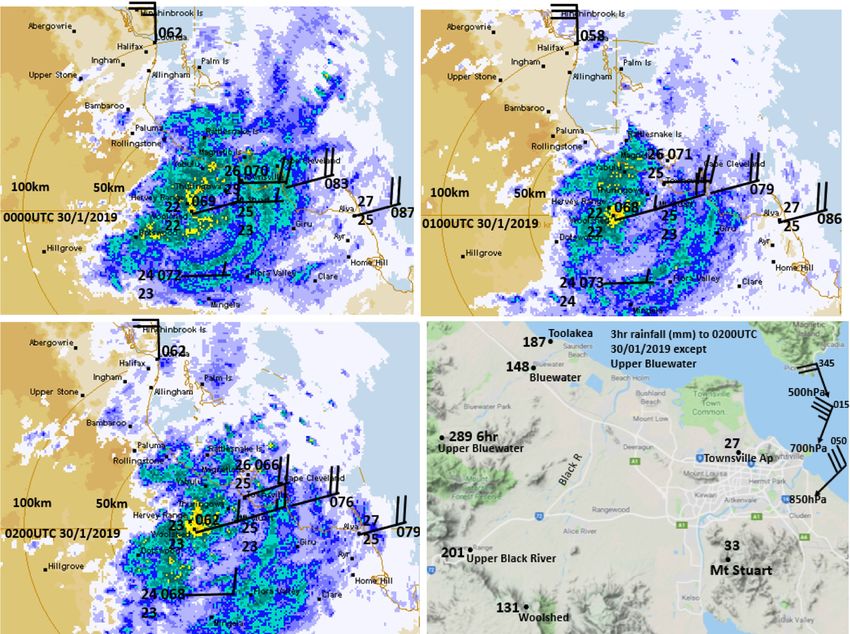
124     Journal of Southern Hemisphere Earth Systems Science                                                                     J. Callaghan

with isentropic ascent, characterised by a wind structure where           8–108C below normal and wind gusts above 70 km/h. The event
the winds turned anticyclonically with height as detailed below.          caused the loss of five human lives, flooded thousands of houses
Additionally, the weather systems involved were relatively                and caused livestock losses of more than 664 000. In Townsville
slow moving.                                                              alone, the Insurance Council of Australia state that the insurance
    Another example of extreme tropical rainfall with winds               costs reached at A$1.24 billion, with around 30 000 insurance
turning anticyclonically with height (Callaghan 2017a)                    claims (Australian Financial Review 4 August 2019).
occurred when Mumbai (Santacruz) recorded 944.2 mm in the                    Across the whole of northern Queensland, Deloitte Access
24-h period ending 1400UTC 27 July 2005, which was one of                 Economics 2019 (Ogge 2019) determined that the combined
the highest daily totals ever recorded in India. Numerical                social and economic cost may reach A$5681 million. The results
weather forecasting models failed to predict this extreme event           from a study by Adekunle et al. (2019) have consistently shown
(Sahany et al. 2010). There were at least 445 fatalities, with lack       that a flooding event like this in Townsville is likely to increase
of public information apparently adding to the chaos. Radio               the number of mosquito-borne infections and increase the
stations and many television stations claim that they did not             carrying capacity of the vector population and thus affect the
receive any weather warnings or alerts by the civic agencies.             health of the population.
Anjaria (2006) described problems in managing this disaster.                 The paper is organised as follows with a location map
    In this paper, the anticyclonic turning of winds with height is       provided in Fig. 1. Data sources are listed in Section 2.
shown to have been a dominant feature of the 2019 north                   Mechanisms causing extreme rainfall are presented in Section 3.
Queensland floods. The Bureau of Meteorology (2019a) pro-                 Climate drivers and forecast problems are discussed in Section 4.
duced Special Climate Statement 69, which describes an                    Section 5 describes the 2019 events and in Section 6 this event is
extended period of record-breaking heavy rainfall and flooding            compared with the most disastrous historical north Queensland
in tropical Queensland which occurred between 26 January and              flood events to place the 2019 event into perspective. Rainfall
7 February 2019. A quasi-stationary monsoon depression with               rates in some of these earlier events were greater than those in
flooding extending over this period driving daily rainfall                2019. This was especially evident about the tropical central
accumulations exceeding 200 mm/day, maximum temperatures                  interior of Queensland where two events, one causing

                      10°S

                       15°S

                        20°S

                         25°S
                                              145°E               150°E
                          140°E

                                    Approximate
                                    Location of
                                    700hPa cold pool

                                                          Fig. 1. Location map.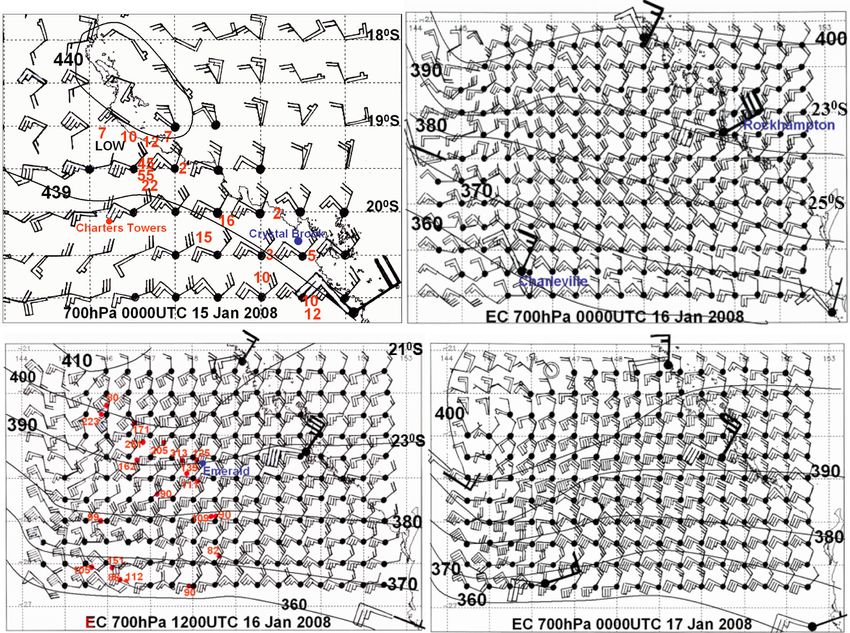
North Queensland floods                                                    Journal of Southern Hemisphere Earth Systems Science      125

unprecedented loss of life are described in detail. A conclusion is   be associated with winds that turn anticyclonically with height
reached in Section 7.                                                 in most heavy rain-bearing systems, including the tropics and
                                                                      subtropics. Two Australian studies (Callaghan and Power 2014,
2 Data                                                                2016) examined extreme rainfall and major flooding events
Most of the data come from the Bureau of Meteorology (BOM)            in coastal catchments and more broadly over southeastern
website (www.bom.gov.au); however, the following websites             Australia. Using radiosonde and reanalysis data they examined
were used to obtain data after the event:                             the vertical structure of these systems in the period for which
                                                                      upper wind data became available. In every case (i) atmospheric
 archived radar data were obtained from the Weather Chasers          moisture content was high and (ii) the low-level winds were
  web site www.theweatherchaser.com/radar-loop/;                      onshore, and in almost every case (iii) the wind-direction turned
 archived synoptic weather observations from www.meteo-              anticyclonically with increasing height up to 500 hPa. Further
  manz.com/?l¼1;                                                      details of this wind structure can be found in Callaghan and
 archived upper wind observations from the University of             Power (2016).
  Wyoming website at weather.uwyo.edu/upperair/sounding.                  Table 1 illustrates, using a greater than 50-year climatology,
  html.                                                               how heavy rainfall results from a WAA wind profile both in the
                                                                      deep tropics (at Cairns) and in the subtropics (at Brisbane). The
    Archived European Centre for Medium-Range Weather
                                                                      response is greater at Cairns as the winds are lighter and the
Forecasts analyses from routinely received analyses at BOM
                                                                      700 hPa wind component normal to the 850 to 500 hPa shears are
Head Office at the time were used for the January 2008 event.
                                                                      lighter signifying weaker WAA. Thus, the response to a weak
    Seasonal composites (averages) of the mean or anomalies of
                                                                      temperature gradient at 700 hPa in the tropics, where there is
variables from the United States National Centers for Environ-
                                                                      more available moisture, is greater than that at high latitudes.
mental Prediction (NCEP) reanalysis and other datasets at the
                                                                          The other factor critical to the disastrous effects of the 2019
following site: https://psl.noaa.gov/cgi-bin/data/composites/
                                                                      floods was the slow movement of the monsoon low. The
printpage.pl/hour/index.html.
                                                                      monsoon low was located between strong deep monsoon
    The NOAA HYSPLIT model for air parcel trajectory
                                                                      westerlies to the north and strong deep easterlies to the south
analyses using the Global Data Assimilation System (GDAS)
                                                                      giving it a relatively symmetric structure which ensured its slow
0.58 global model September 2007 to June 2019 at the following
                                                                      movement (more details of this are shown below).
site: https://www.ready.noaa.gov/HYSPLIT.php.
                                                                          The common summer wind pattern in north Queensland is a
                                                                      CAA wind structure which contributes to convective suppres-
3 Mechanisms which produce extreme rainfall                           sion. This is illustrated in Fig. 2, which shows the winds turning
The extreme rainfall diagnostic used in this paper is based on the    clockwise (cyclonic) with height over much of the state on
thermal wind relationship (e.g. Holton 2004), which has been          average through January, February and March (see https://psl.
used to diagnose isentropic ascent and descent regions for            noaa.gov/data/composites/day/). The rainfall associated with
decades, in which a component of the geostrophic wind is              this pattern is heavy rain in the monsoon trough across the Gulf
aligned with the thickness gradient, giving the appearance of         of Carpentaria and Cape York and light rainfall further south.
WAA and cold-air advection (CAA) respectively. While the                  In the Queensland Severe Weather Section, we observed this
common derivation assumes geostrophic and hydrostatic bal-            daily especially from the 1990s onwards when we had access to
ance, the relationship also holds for gradient wind balance (Tory     numerical weather prediction models such as that from the
2014), which means it is applicable to most intense rain-bearing      European Centre model. The author spent the active 1973/
systems at any latitude. In this paper, WAA is analysed between       1974 summer on Willis Island Meteorological Station and with
the 850 and 500 hPa levels representing much of the lower             monotonous regularity the radar balloon flight showed low-
troposphere. When sufficient moisture is present, widespread          level southeast winds turning clockwise with height through
isentropic ascent in this layer often triggers broadscale and         southerly winds up to south-westerly at 500 hPa. During this
persistent convective rainfall.                                       time only light rainfall was observed. It was only when a vortex
    The presence of the WAA wind structure in heavy rain-             developed, or an upper trough system extended up into the
bearing systems is quite common, and the causal relationship          tropics (see example Appendix 1) that a WAA pattern and heavy
well established. As stated above, the disastrous freshwater          rainfall was observed.
flooding associated with Hurricanes Harvey and Florence and               A WAA pattern occurred during a short period in 2019 and
the 2005 Mumbai floods were associated with WAA winds                 is illustrated in Fig. 3. This shows an intense monsoon low in
(Callaghan 2017a, 2018, 2020). Goff and Hanson (2012) found           the southeast Gulf of Carpentaria, the 850 hPa monsoon winds
this to be the case in the middle latitudes of the US. Previous       peak at over 19 m/s over Cape York Peninsula and strong east
studies (Bonell et al. 2005; Bonell and Callaghan 2008;               to northeasterlies at over 16 m/s south of the monsoon trough.
Callaghan and Tory 2014; Tory 2014; Callaghan and Power               At 500 hPa a trough system was located through western
2016) examined winds associated with extreme rainfall in both         Queensland, producing WAA at 700 hPa over much of tropical
the tropics and the mid-latitudes of Australia. Further studies       Queensland. The 500 hPa trough over western Queensland
(Callaghan 2017a, 2019) found this to apply in many cases             helped produce thunderstorm activity in that region. The
around the globe. Theoretical arguments (Tory 2014) suggest,          evolution of a cold pool just west of the Charleville to Cobar
assuming gradient wind balance, that isentropic uplift is likely to   region that contributed to the WAA is described in Appendix 1.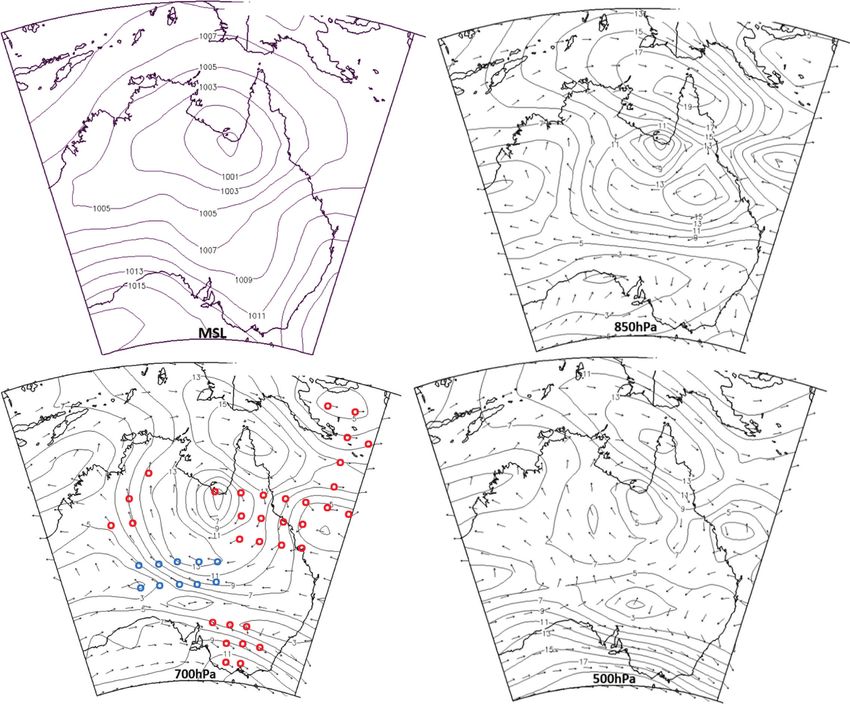
126      Journal of Southern Hemisphere Earth Systems Science                                                                                    J. Callaghan

Table 1. Cairns and Brisbane average rainfall and their relationship with upper winds showing direction clockwise from north and speed in metres
                                                                         per second
Average vector winds (m/s) 12 h before reading the rain gauge at (a) Brisbane (latitude 27.39 S) and (b) Cairns Airport (latitude 16.87 S) 1 January 1950 to 31
                                                                        January 2008

                                          Nil rainfall   .2 mm rainfall      .25 mm rainfall      .50 mm rainfall      .75 mm rainfall      .100 mm rainfall

(a) Brisbane Airport
500 hPa                                   258/12.5          277/08.5            305/08.5             319/08.0             335/08.0              007/06.5
600 hPa                                   247/07.5          274/04.0            315/04.5             340/05.0             011/06.0              045/09.5
700 hPa                                   227/05.0          223/01.0            014/02.0             029/04.0             052/05.5              069/09.0
850 hPa                                   203/03.0          117/03.5            085/05.5             081/07.0             086/09.5              097/13.0
900 hPa                                   161/01.0          108/04.5            087/06.0             086/07.5             092/09.0              107/13.0
950 hPa                                   092/01.0          113/03.5            098/04.5             097/06.0             103/07.0              121/09.0
850 to 500 hPa wind shear                 271/11.05         283/11.80           290/13.17            290/13.13            297/14.45             305/14.10
700 hPa wind speed normal to shear         –03.59            –00.86               þ1.99                þ3.97                þ4.98                 þ7.46
Lifting parameter shear times 700 hPa      –39.67            –10.15              þ26.20               þ52.10               þ71.96                þ105.19
 normal wind (m2/s2)
(b) Cairns Airport
500 hPa                                   267/06.0          277/03.5            360/01.5             035/02.0             028/03.0              044/03.5
600 hPa                                   248/04.0          252/01.0            075/02.0             071/03.0             064/03.5              071/04.0
700 hPa                                   200/03.5          123/03.0            094/05.0             090/05.5             087/06.0              091/07.0
850 hPa                                   128/05.0          119/08.0            109/07.5             107/08.0             104/08.5              105/09.0
900 hPa                                   128/05.0          127/08.0            116/08.0             116/08.0             112/09.0              112/09.5
950 hPa                                   143/04.0          144/06.5            139/06.0             135/06.5             132/06.5              132/07.0
850 to 500 hPa wind shear                 286/10.31         292/11.30           299/08.11            301/07.63            305/08.30             308/07.69
700 hPa wind speed normal to shear          –3.49             –0.55               þ2.12                þ2.75                þ3.69                þ4.21
Lifting parameter shear times 700 hPa      –35.98             –6.22              þ17.19               þ20.98               þ30.62                þ57.36
 normal wind (m2/s2)

Mean sea level pressures over southeast Queensland were a                             In Fig. 6, Townsville upper winds from 2300UTC 25 January
little stronger than climatology so the strong east to northeast                  2019 to 2300UTC 06 February 2019 are plotted that show
flow over Queensland was driven by pressure falls in the                          anticyclonic turning of the winds between 850 and 500 hPa
monsoon trough and pressure rises in the subtropical ridge.                       was dominant with only two exceptions marked by the red wind
Pressures over Auckland in New Zealand were 5 hPa higher                          plots. The corresponding rainfall in the Townsville Airport over
than climatology (not shown). We can see that the monsoon                         this period was 1270.6 mm.
circulation from Fig. 3 was trapped between strong deep
monsoon westerlies to the north and strong deep subtropical
easterlies to the south ensuring it was not swept either east-                    4 Climate drivers and predictability
wards or westwards and therefore remained quasistationary.                        The role of natural climate drivers such as El Niño–Southern
This of course resulted in rain falling over river catchments for                 Oscillation (ENSO), the Indian Ocean Dipole and Southern
extended periods.                                                                 Annular Mode (SAM) in the event is likely to have been limited
    The model precipitation rates over this limited period for                    given that all were near neutral in early 2019 (Bureau of
climatology and composite mean are shown in Fig. 4. The                           Meteorology 2019a).
maximum rate in the climatology is only 15 mm per day in a                            The intra-seasonal tropical wave known as the Madden–
small area about the monsoon trough. In the composite mean                        Julian Oscillation (MJO) was active across the Australian region
there is a huge area of 30 mmor more per day extending around                     during the second half of January.
the low in the southeast Gulf of Carpentaria and then through                         From fig. 20 in the Special Climate Statement 69 (Bureau of
much of tropical Queensland consistent with the WAA pattern                       Meteorology 2019), sea surface temperatures (SSTs) around
described above. The large area of extreme rainfall in the                        Townsville and the Gulf of Carpentaria showed a cooling trend
southeast Gulf is associated with thunderstorms around the                        to below normal during the heavy rain, so we need to understand
monsoon low. The winds in this area turned anticyclonically                       if this was a negative factor in the rainfall generation. Lau and
with height in a shallower layer from 850 to 700 hPa, which is a                  Wu (2011) found using Tropical Rainfall Measuring Mission
pattern shown to be associated with intense rainfall in tropical                  data (1998–2009) that extreme rain events are most sensitive to
thunderstorms in an earlier paper (Callaghan 2017b).                              the changes in tropical mean SST.
    The actual registered rainfall shows the heavy band of                            Cowan et al. (2019) reported that the tropical convective
rainfall extending westward from Townsville in the WAA zone                       signal of the MJO was over the western Pacific, and likely
(Fig. 5). The heavy rainfall in Mount Isa and southeast Gulf was                  contributed to the heavy rainfall. Over the northern Tasman Sea,
mostly associated with tropical thunderstorms.                                    an anticyclone helped maintain a positive phase of the SAM and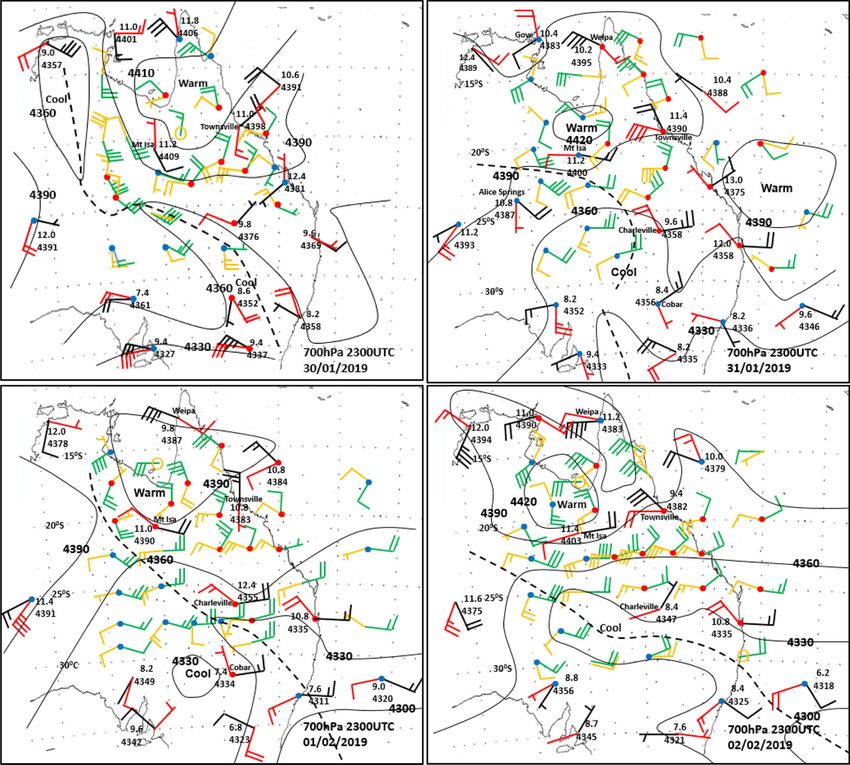
North Queensland floods                                                                      Journal of Southern Hemisphere Earth Systems Science                  127

  5S                                                                                  5S
                                             NOAA Physical Sciences Laboratory                                                 NOAA Physical Sciences Laboratory

  0S                                                                                  10S

  5S                                                                                  15S

  0S                                                                                  20S

  5S                                                                                  25S

  0S                                                                                  30S

  5S                                                                                  35S

  0S                                                                                  40S

  5S                                                           45S
   105E 110E 115E 120E 125E 130E 135E 140E 145E 150E 155E 160E   105E 110E 115E 120E 125E 130E 135E 140E 145E 150E 155E 160E
         850mb Vector Wind (m/s) Climatology (1981–2010 Climatology)                        700mb Vector Wind (m/s) Climatology (1981–2010 Climatology)
                                 1/1 to 3/31                                                                        1/1 to 3/31
                          NCEP/NCAR Reanalysis                                                               NCEP/NCAR Reanalysis

  5S                                     NOAA Physical Sciences Laboratory       5S                                   NOAA Physical Sciences Laboratory
                                                                                                                                                                   14
 10S                                                                         10S

                                                                                                                                                                   12
 15S                                                                         15S

 20S                                                                         20S                                                                                   10

 25S                                                                         25S                                                                                   8

 30S                                                                         30S
                                                                                                                                                                   6
 35S                                                                         35S

                                                                                                                                                                   4
 40S                                                                         40S

 45S                                                          45S                                                                                                  2
   105E 110E 115E 120E 125E 130E 135E 140E 145E 150E 155E 160E 105E 110E 115E 120E 125E 130E 135E 140E 145E 150E 155E 160E
       500mb Vector Wind (m/s) Climatology (1981–2010 Climatology)               Surface Precipitation Rate (mm/day) Climatology (1981–2010 Climatology)
                               1/1 to 3/31                                                                      1/1 to 3/31
                        NCEP/NCAR Reanalysis                                                              NCEP/NCAR Reanalysis

 Fig. 2. Seasonal composite wind and rainfall climatology for 850 hPa (top left), 700 hPa (top right) and 500 hPa (lower left) with rainfall composite (lower
 right) from https://psl.noaa.gov/data/composites/day/ for January, February and March in the Australian region.

promoted onshore easterly flow. Somewhat consistent with                                speeds. Ensemble-mean weekly rainfall amounts, however,
these climate drivers, the monthly rainfall outlook for February                        were considerably underestimated by the prediction system,
issued by the BOM on 31 January provided no indication of the                           even in forecasts initialised at the start of the peak flooding
event, yet forecasts, not available to the public, of weekly-                           week, consistent with other state-of-the-art dynamical predic-
averaged conditions by the BOM’s dynamical subseasonal-to-                              tion systems. Cowan et al. (2019) concluded that predicting this
seasonal prediction system were more successful. For the week                           exceptional event beyond two weeks appears beyond our current
of 31 January to 6 February, the prediction system forecast a                           capability, despite the dynamical system forecasts showing
more than doubling of the probability of extreme (highest                               good skill in forecasting the broadscale atmospheric conditions
quintile) weekly rainfall a week prior to the event, along with                         north of Australia a week prior.
increased probabilities of extremely low (lowest quintile)                                 In recent times, computer forecasting models have still
maximum temperatures and extreme (highest quintile) wind                                shown failures in forecasting extreme rainfall. Here some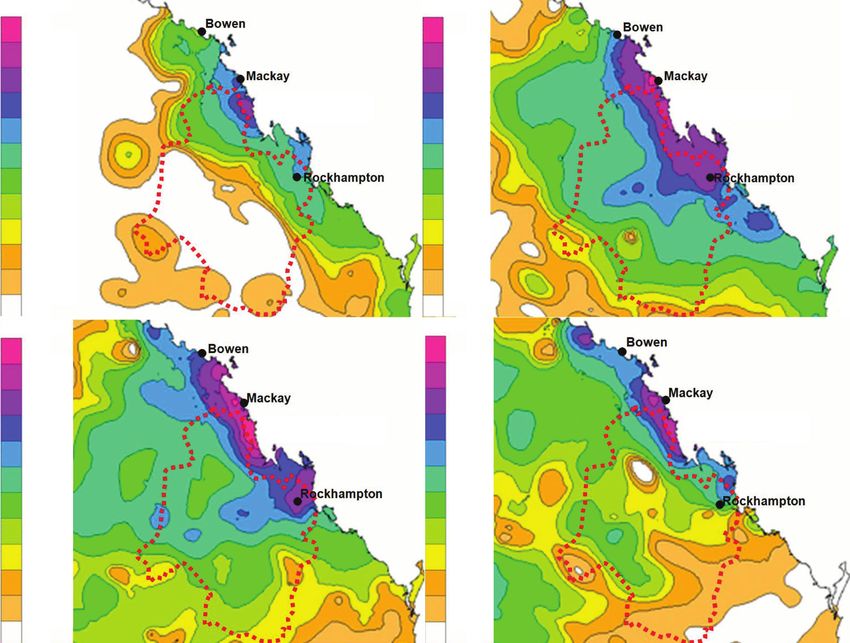
128    Journal of Southern Hemisphere Earth Systems Science                                                                                   J. Callaghan

                                        NOAA Physical Sciences Laboratory                                         NOAA Physical Sciences Laboratory

                                                                                                               NOAA Physical Sciences Laboratory
                                     NOAA Physical Sciences Laboratory

  Fig. 3. NCEP/NCAR reanalysis composite mean for 29 January to 4 February 2019. Mean sea level (top left), 850 hPa wind vectors (m/s) (top right),
  700 hPa wind vectors (m/s) red highlighting where winds turn anticyclonic from 850 through 700 to 500 hPa (warm-air advection) and blue highlighting
  cold-air advection wind plots (lower left) and 500 hPa wind vectors (m/s) (lower right).

                                    NOAA Physical Sciences Laboratory                                         NOAA Physical Sciences Laboratory     50
                                                                         16

                                                                                                                                                    45
                                                                         14
                                                                                                                                                    40

                                                                         12                                                                         35

                                                                                                                                                    30
                                                                         10
                                                                                                                                                    25

                                                                         8                                                                          20

                                                                                                                                                    15
                                                                         6
                                                                                                                                                    10

                                                                         4
                                                                                                                                                    5

  Fig. 4. Surface precipitation rate (mm per day) for period 29 January to 4 February in left frame climatology (1981–2010) and right frame for this
  period in 2019. From NOAA seasonal composites.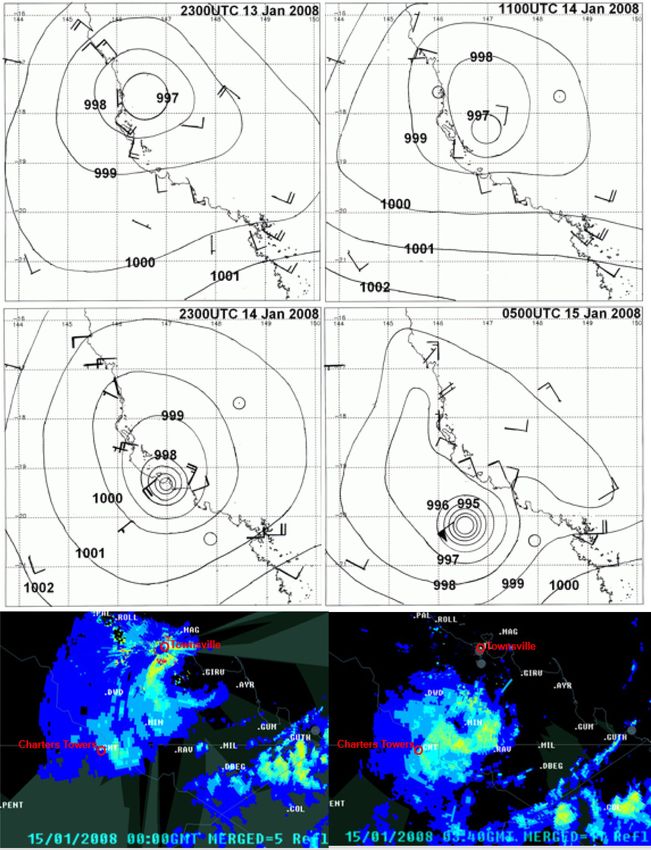
North Queensland floods                                                                        Journal of Southern Hemisphere Earth Systems Science         129

examples are listed in which all cases exhibited WAA structures                      all high-resolution numerical model forecasts for TC Debbie
in the heavy rainfall regions. From Callaghan (2017a), in                            (March 2017) underestimated the heaviest rainfall around
southeast Queensland and northern New South Wales Australia,                         Brisbane, southeast Queensland, and northern New South Wales
                                                                                     while the area was affected by strong winds turning antic-
                       Rainfall (mm) week ending             Rainfall (mm)           yclonically with height (i.e. WAA). Forecasters in Brisbane
                       2300UTC 4/02/2019                                             increased the amount of forecast rainfall that the models
                                                                                     suggested for southeast Queensland based on evidence of the
                                                                    400 mm           anticyclonic turning of the winds (T Wedd and P Otto personal
                                                                                     communication). This had the effect of closing many schools
                                                                    300 mm
                                                                                     across southeast Queensland where major flooding occurred.
                                                                                     This wind structure was also evident for the neighbouring
                                                                    200 mm
                                                                                     Tweed River area of northern New South Wales where a record
                                                                                     flood occurred from TC Debbie claiming eight lives and the
                                                                    150 mm
                                                                                     warnings were only for moderate flooding (Roads and Storm-
                                                                                     water 2017). Forecasters responsible for this area of New South
                                                                    100 mm
                                                                                     Wales adhered to the model’s forecasts and there was much
                                                                                     criticism regarding the severity of the flooding in northern New
                                                                    50 mm
                                                                                     South Wales. The BOM has described the floods that hit the
                                                                    25 mm
                                                                                     Tweed as a ‘one in a thousand year event’ but the BOM national
                                                                                     manager of flood forecasting said the BOM could not have done
                                                                    15 mm
                                                                                     more. ‘This was an extraordinary event. It was a record flood at
                                                                                     Murwillumbah’, he said. Despite forecasting much less rain than
                                                                    10 mm            had fallen (based on model predictions), the BOM had put out
                                                                                     warnings two days prior.
                                                                    5 mm                 Earlier in January 2013, high-resolution models under-
                                                                                     estimated the rainfall totals for TC Oswald, with only the
Fig. 5. Seven-day rainfall ending 2300UTC 04 February 2019 over                      Australian ACCESSR model performing well and coming
tropical Queensland.                                                                 closest to the actual totals. This does not mean that ACCESSR

                                  010                                                            275           310                  020        315
                                         310           345          315                  035
                 500hPa

                                               010                                                     015      340                360               025
                                035                          015          015              040

                 700hPa

                                               010            050          020                           040           055               015          055
                                                                                         015
                 850hPa           080

                             252300     282300         292300       301100          302300         311100       312300         012300          021100

                                            310                                                   315           325          305                 005
                                310                  280             340           315
                500hPa

                                                           355        355                          010           340                030          025
                                325             015                                  355

                700hPa

                                  020                                                    355                           040
                                                                             070                         060                             070
                850hPa
                                                 085          080                                                                                    085

                             022300      031100       302300    041100     042300     051100      052300    061100      062300
                          Townsville Airport upper winds 2300UTC 25 January 2019 (252300) to 2300UTC 6 February 2019 (062300)

               Fig. 6. Time series of Townsville upper winds. Normal plotting convention where half barb represents 2.5 m/s (5 knots),
               full barb 5 m/s (10 knots) and flag 25 m/s (50 knots) for 2300UTC 25 January 2019 (marked as 252300) to 2300UTC 6
               February (062300). Red plots indicate observations where the anticyclonic turning is interrupted.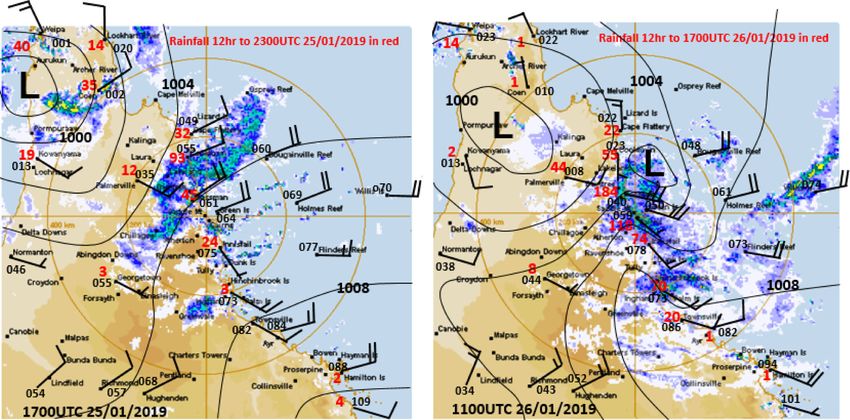
130     Journal of Southern Hemisphere Earth Systems Science                                                               J. Callaghan

is always more successful in forecasting extreme rainfall.            There were several sites in elevated areas around Townsville
Woo et al. (2014), demonstrated this and their fig. 24 shows           including Paluma, Woolshed and Upper Bluewater that
how the anticyclonically turning winds with height aligned             reported 12-day accumulations of more than 2000 mm.
with the extreme rainfall in this event. In February 2015,            Townsville was significantly impacted, exceeding its previous
models generally forecast a weak tropical low to make                  flood of record by a large margin, and directly impacting
landfall on the central Queensland coast, which turned out to          thousands of properties. The Haughton River at Giru remained
be Severe TC Marcia Category 5 (Callaghan 2017b). This                 above the major flood level for over a week, impacting
occurred in an environment where the winds were turning                numerous main roads including the Bruce Highway.
anticyclonically with height. Cao and Zhang (2016) show that          Properties in Townsville were flooded following the heavy
despite considerable progress in mesoscale numerical weather           rains after officials were forced to open the floodgates of the
prediction, the ability to predict summer severe rainfall in           Ross River Dam which reached a record-breaking 213% of its
terms of amount, location and timing remains limited because           capacity on 4 February 2019.
of its association with convective or mesoscale phenomena.            In the Gulf country and northwest Queensland, record-
This was the case for direct model forecasts leading up to the         breaking rainfall also occurred in previously drought affected
disastrous 2011 Brisbane River and Lockyer Valley floods,              regions, including at Julia Creek and Richmond.
which were a third of the amount received (van den Honert and
                                                                       These significant episodes of the flood event are described in
McAneney 2011). A similar situation occurred in the disas-
                                                                     some detail below.
trous 2005 Mumbai Floods (Sahany et al. 2010), and in 2006
associated with one of the worst floods to affect China since
                                                                     5.2 Daintree region north of Cairns
1983 (Gao et al. 2009).
   At the very least it is important to understand the structure     The Daintree River rises in the Great Dividing Range, approxi-
of systems which produce extreme rainfall for climate studies        mately 20 km southwest of Daintree, the largest town within the
in projecting changes in the intensity and frequency of              catchment. It initially flows in a northerly direction, before
extreme rainfall and major flooding over coming decades.             turning southeast passing Daintree and finally entering the Coral
The identification of this diagnostic then focuses the attention     Sea. Floods may develop quickly and with little warning from
of those responsible for flood warnings on radars in the area        high rainfalls on the 1000-m-high mountain ranges around the
threatened by extreme rainfall. This can lead to early detec-        catchment.
tion of the commencement of heavy rainfall which in turn                 A low-pressure system deepened on the western tip of Cape
leads to early warnings, so critically in the case of flash          York Peninsula from 0000UTC 23 January 2019 from 1007 to
flooding in saving lives. The extreme rainfall is usually            999 hPa by 1200UTC 25 January 2019. In Fig. 7 (left frame) the
located in a convective thunderstorm complex embedded in             low can be seen on the coast between Weipa and Kowanyama at
the general heavy rain area.                                         1700UTC 25 January 2019 with a band of heavy rain on the east
   The influence from global warming was considered by Zhao          coast between Cooktown (12-h rainfall 93 mm) and Mossman.
et al. (2020) in a modelling study that examined runoff and          From Fig. 7 (right frame) the low (with a secondary centre in the
precipitation in the Xijiang River Basin under the background of     Coral Sea) had moved slightly inland by 1100UTC 26 January
1.58C and 28C warming. They found that precipitation increases       2019 and the band of rain had strengthened (12-h rainfall of 84 mm
overall and more so under the high-emission and greater-             at Low Island and 118 mm at Cairns Airport). The ACCESS charts
warming scenarios. Disaster managers are extremely interested        show the anticyclonic turning winds across Cape York and the
in how floods will affect north Queensland in the future as the      Daintree Region between Cairns and Cooktown (Fig. 8). The
planet warms. It is also important to know what occurred in the      HYSPLIT trajectory analyses for China Camp shows that ascent
past as there will be similar events which will surely be repeated   of air parcels occurred during the heavy rain period (Fig. 9).
in the future. One thing is certain, as sea levels rise and              The Daintree River heights at Daintree Village reached
population increases, coastal areas will suffer more in the future   12.60 m at 1355UTC 26 January 2019 (major level 9.0 m)
without adaptation.                                                  exceeding the 1901 record of 12.4 m. Some of the short-term
                                                                     intensities were less than a 1% Annual Exceedance Probability
5 The 2019 north Queensland floods                                   (AEP) or in other words exceeded the 100-year Average
                                                                     Recurrence Interval, or ARI (Bureau of Meteorology 2019).
5.1 Overview
                                                                     The historical daily and weekly Daintree catchment rainfalls for
 The rainfall caused major record flooding on the Daintree and      January 2019 were insignificant compared with earlier floods;
  Bloomfield Rivers on 26 January 2019. The flooding then            however, it was the intense 6-hourly rainfall that caused the
  extended to catchments further south and west including the        record flood. At China Camp, 149.0 mm was recorded in the 2 h
  Herbert, Ross, Bohle, Black, Haughton and Burdekin Rivers,         up to 0826UTC 26 January 2019 and 241.0 mm in the 4 h to
  and Bluewater Creek. Widespread major flooding was also            1100UTC 26 January 2019.
  recorded across the Gulf country including the Flinders,
  Cloncurry and Leichhardt Rivers.                                   5.3 Intense rainfall and flooding Townsville area 30 January
 The BOM’s site at Townsville Airport recorded 1259.8 mm in         and 3 February 2019
  the 10 days to 8 February. Prior to this event, the Townsville     Two of the heaviest rainfall episodes at Townsville are
  record for a 7-day period was 886.2 mm (January 1998).             described here. The first intense rainfall event is illustrated in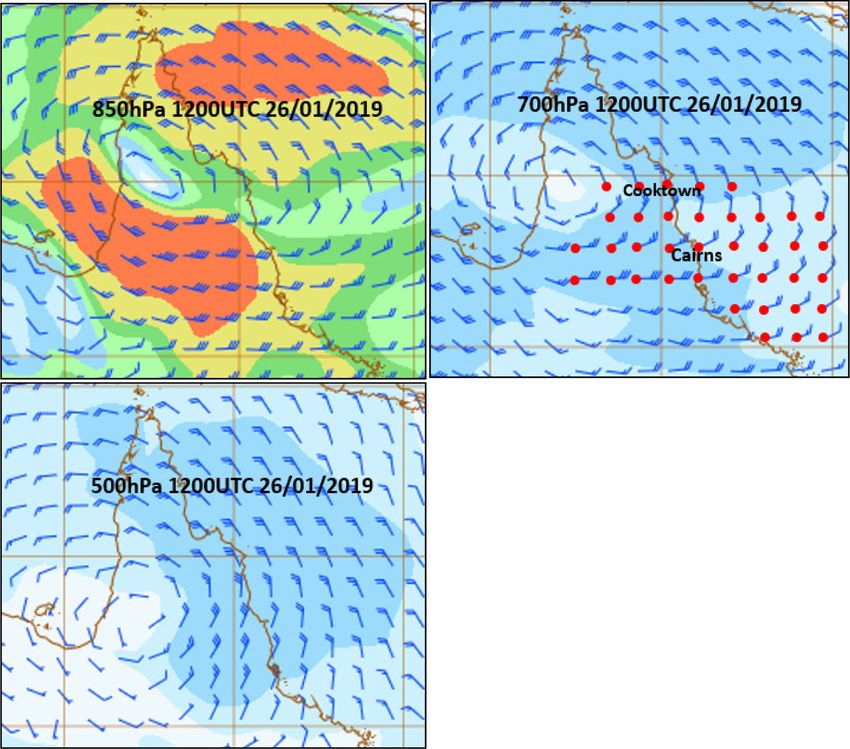
North Queensland floods                                                              Journal of Southern Hemisphere Earth Systems Science   131

          Fig. 7. Mean wind plots and mean sea level pressure analysis overlaid on Cairns radar reflectivity for 1700UTC 25 January 2019.

                   Fig. 8. 1200UTC 26 January 2019 ACCESS wind analyses for 850 hPa (top left), 700 hPa (top right) and 500 hPa
                   (lower left). The 700 hPa wind plots are highlighted in red where the direction turns anticyclonic from 850 through
                   700 to 500 hPa.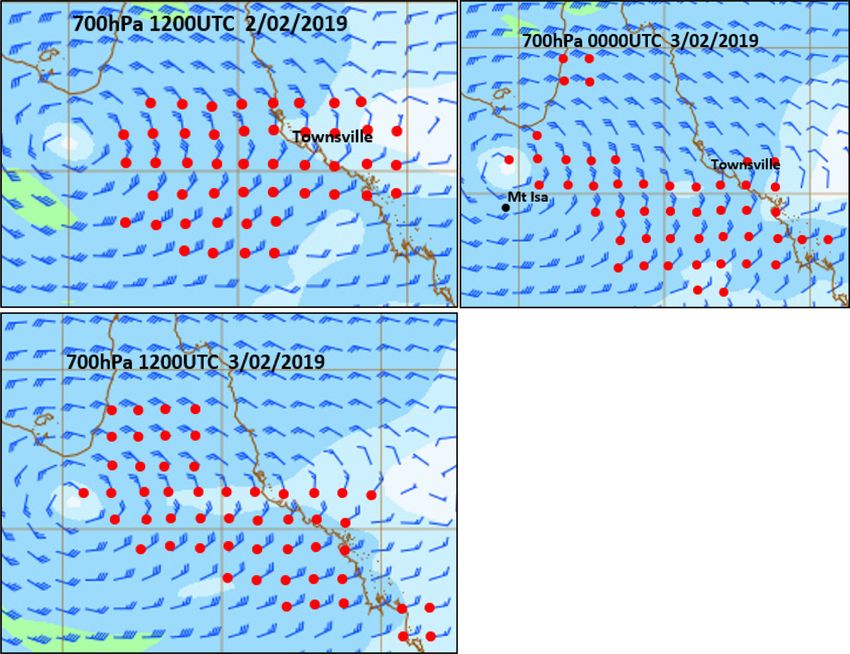
132 Journal of Southern Hemisphere Earth Systems Science J. Callaghan
NOAA HYSPLIT MODEL NOAA HYSPLIT MODEL
Forward trajectory starting at 0600 UTC 26 Jan 19 Forward trajectory starting at 1200 UTC 26 Jan 19
GFSG Meteorological Data GFSG Meteorological Data
at 15.98 S 145.28 E
at 15.98 S 145.28 E
Source
Source
Meters AGL
Meters AGL
6500 6500
5500 5500
4500 4500
3500 3500
2500 2500
1500 1500
12 18 0 06 18 0 06 12
01/27 01/27
Job ID: 140954 Job Start: Fri Aug 7 20:04:36 UTC 2020 Job ID: 142370 Job Start: Fri Aug 7 20 27:15 UTC 2020
Source 1 lat.: –15.985000 lon.: 145.280000 hgts: 1500, 3000, 6000 m AGL Source 1 lat.: –15.985000 lon.: 145.280000 hgts: 1500, 3000, 6000 m AGL
Trajectory Direction : Forword Duration : 24 hrs Trajectory Direction : Forword Duration : 24 hrs
Vertical Motion Calculation Method: Model Vertical Velocity Vertical Motion Calculation Method: Model Vertical Velocity
Meteorology: 0000Z 26 Jan 2019 - GDAS0p5 Meteorology: 0000Z 26 Jan 2019 - GDAS0p5
Fig. 9. Air parcel trajectories from China Camp (15.985S 145.2878E) starting at 0600UTC 26 January 2019 (left) and 1200UTC 26 January 2019
(right).
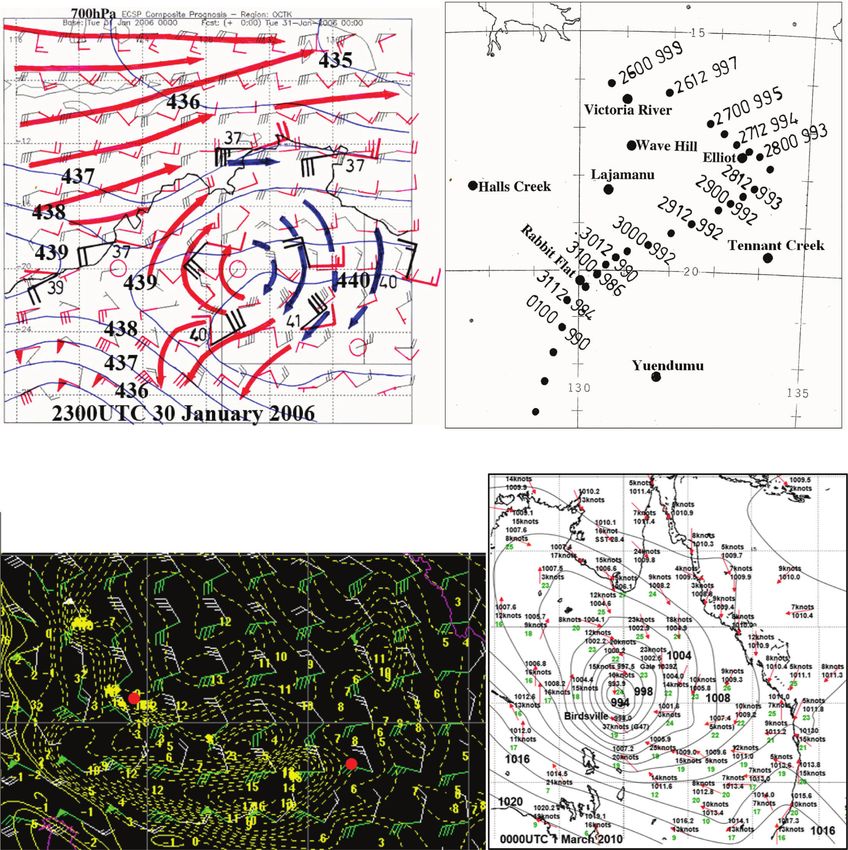
Fig. 10 when the low (1002 hPa) had moved to a position near Annandale 180.0 mm, Rooney’s Bridge 177.0 mm, South
Normanton in the southeast Gulf of Carpentaria. The onshore Townsville 160.0 mm, Mysterton 159.0 mm, Gordon Creek
flow into the rain area was around 20 knots (10.3 m/s) with 157.0 mm, Vincent 155.0 mm and Aitkenvale 154.0 mm.
dewpoints around 258C on the coast. The upper winds immedi- The Ross River Dam spillway gates above Townsville were
ately before the onset suggested isentropic ascent across the fully opened around 0900UTC 03 February 2019 and Aplin
region (anticyclonic turning with height) and the short-term Weir Alert (downstream of the Ross River Dam) peaked with a
intense rainfall reports in Fig. 10 (lower right) reflect this record major flood. Officials were forced to open the flood-
strongly ascending humid tropical air steam. Bluewater Creek gates of the Ross River Dam when it reached a record-breaking
rose 5 m over the period of this intense rain, causing much 213% of its capacity on 4 February 2019. This can be seen in
damage due to high floods and strong river currents. Rainfall figs. 36 and 37 in Bureau of Meteorology (2019b). The
observations around Bluewater Creek were as follows: Upper ACCESS 700 hPa chart from 1200UTC 02 February to
Bluewater 289 mm in 6 h to 0200UTC 30 January 2019, 1200UTC 03 February 2019 illustrates the WAA over Towns-
Bluewater 148 mm in 3 h to 0200UTC 30 January 2019 and ville during this period of extreme rainfall (Fig. 12). The
Toolakea 187 mm in 3 h to 0200UTC 30 January 2019. The air HYSPLIT trajectory analyses in Appendix 2 confirms this
parcel trajectory analysis in Appendix 2 verified the ascent with ascent over Townsville.
this heavy rainfall. Daily rainfall totals averaged across the whole Ross–Bohle
The monsoon low at 1200UTC 2 February 2019 was by then catchment for this flood event were not overly significant
a deep system with convection indicated from radar surrounding compared with other historical flood events (outlined in table
the centre where a pressure of 990 hPa was indicated (Fig. 11). 46 of Bureau of Meteorology 2019). However, the weekly
Radar also showed a band of rain over Townsville. Between rainfall averaged over the catchment illustrates the significance
2300UTC 02 February and 1100UTC 03 February 2019 during of the multiday rainfall for the Ross–Bohle catchment recorded
which anticyclonic turning of the winds with height was present during this event (outlined in table 47 of Bureau of Meteorology
(Fig. 6) there was extreme rainfall in the Townsville area in the 2019) where the 2019 event occupied the first six places in the
6 h from 0500UTC to 1100UTC 03 February 2019 as follows: weekly rainfall record totals.North Queensland floods Journal of Southern Hemisphere Earth Systems Science 133
Fig. 10. Radar reflectivity mean wind plots, temperature, dewpoint and last three digits of mean sea level pressure to one decimal point for
0000UTC 30 January 2019 (top left), 0100UTC 30 January 2019 (top right) and 0200UTC 30 January 2019 (lower left). Lower right frame shows
extreme short-term rainfall over the same period in the Townsville area with upper winds at Townville at 2300UTC 29 January 2019, which was
just before the extreme rainfall.
with a total of 402 mm to 2300UTC 03 February 2019. The AEP
analyses for this station indicates values of ,1% for every
interval from 30 min to 7 days (Bureau of Meteorology 2019).
5.4 Flinders River Catchment
There was WAA evident in the Julia Creek region (Flinders
River catchment) by 0000UTC 05 February 2019 during a very
heavy rainfall episode near that station (Fig. 13). The monsoon
low with a central pressure reaching below 990 hPa hovered
around the Gilliat River and Julia Creek region from 1100UTC
to 1700UTC 4 February 2020 (Fig. 14), with Julia Creek
reporting 119 mm in 12-h. The 24-h rainfall totals to
2300UTC 04 February were as follows: Gilliat River
331.0 mm, Julia Creek Ap 233.0 mm and Brinard Station
231.0 mm, all three being in the Flinders River Catchment.
Fig. 11. Mean wind plots and mean sea level pressure analysis overlaid on Several inland stations were subjected to record floods from the
Cairns and Mt Isa radar echoes for 1100UTC 02 February 2019. Flinders River. The highest event total of 700.5 mm was
recorded at Hulberts Bridge.
The highest 24-h total recorded within these Ross–Bohle– The Gilliat River intense rainfall analyses registered an AEP
Blue Rivers and Blackwater Creek catchments was at Wood- of ,1% for the following durations: 12 h, 24 h, and 2, 3, 4, 5, 6
lands Alert (located immediately upstream of Ross River Dam) and 7 day periods. The AEP analyses were obtained from the134 Journal of Southern Hemisphere Earth Systems Science J. Callaghan
Fig. 12. ACCESS wind analyses for 850 hPa (top left), 700 hPa (top right) and 500 hPa (lower left). The 700 hPa
wind plots are highlighted in red where the direction turns anticyclonic from 850 through 700 to 500 hPa for
1200UTC 02 February 2019 (top left), 0000UTC 03 February 2019 (top right) and 1200UTC (lower left).
Fig. 13. ACCESS 700 hPa wind plots with red dots highlighting where direction turns anticyclonic from 850 through 700
to 500 hPa for 0000UTC 04 February 2019 (left), and for 0000UTC 05 February 2019 (right).
report (Bureau of Meteorology 2019). The HYSPLIT air parcel Queensland compared with Western Australia. Below we study
trajectory showed marked ascent about Gilliat River as the past tropical Queensland extreme events, where in one case this
parcel circulated around the low (see Appendix 2). penetration of extreme rainfall inland from a TC was disastrous.
Other past events have produced generally unexpected rainfall
6 Record historical north Queensland floods rates and that a repeat of similar events in the future would cause
Dare et al. (2012), using data from 1969/70 to 2009/10, showed headaches for disaster managers let alone from increased effects
that over north Queensland non-TC events produced more due to global warming. Below are examined historical record-
rainfall than TCs. Also, in a climatological sense, their results breaking events in inland Queensland which are exceptions to
indicate less inland penetration of TC rainfall over north the findings of Dare et al. (2012).North Queensland floods Journal of Southern Hemisphere Earth Systems Science 135
Fig. 14. Radar reflectivity mean wind plots, temperature, dewpoint, 6-h rainfall and last three digits of mean sea level pressure to
one decimal point overlaid on Mount Isa radar (range rings every 100 km) for 1100UTC 04 February 2019 (left) and 1700UTC 04
February 2019 (right).
Rainfall (mm)
400 mm
300 mm
200 mm
24hour rainfall to 9am
28 December 1916 150 mm
100 mm
50 mm
25 mm
15 mm
10 mm
5 mm
1 mm
Fig. 15. (a) 24-h rainfall (mm) distribution to 2300UTC 27 December 1916 and the dashed red area marks the large Fitzroy River catchment. (b) 24-
h rainfall totals (mm) in the 24 h to 2300UTC 27 December 1916 with the band of maximum rainfall (green dotted area) parallel to the cyclone track
(black dashed line).
6.1 Inland penetration by TC – the 1916 Clermont floods with selected rainfall registrations over the 24-h period up to
As an example of extreme inland penetration one of Australia’s 2300UTC 27 December 1916. Most of this rain fell over the 15-h
worst flooding disasters occurred when a TC brought extreme period from 0800UTC to 2300UTC (Harman and Whittingham
rainfall into the generally dry interior of tropical Queensland. At 1970). The heaviest rainfall was in a zone 30–60 km east of the
2300UTC 25 December 1916 a severe TC passed over the Dent track of the cyclone with totals to 597 mm. This rainfall bias to
Island Lighthouse just north of Mackay where a central pressure the east suggests a WAA wind pattern on the eastern side (or
of 958 hPa was recorded. By 1100UTC 27 December 1916, the perhaps southeast side of the TC) consistent with a vortex tilted
night of commencement of the flood, it was located approxi- in this direction (e.g. Tory 2014). These rainfall totals are
mately 90 km north of Clermont. Disastrous flooding occurred staggering for an inland location when you consider the record
and the final death toll in Clermont was somewhere between 61 daily rainfall for Tully, one of the wettest locations in Australia,
and 70. The lower part of the town was never rebuilt, and is 606 mm – somewhat less than the rainfall rate of 597 mm in
settlement shifted to higher ground. around 15 h. Obviously, the TC kept its inner core structure
In Fig. 15a the rainfall in the 24 h to 2300UTC 27 December intact as it made its way towards Clermont and is a sobering
1916 shows extreme rainfall around Clermont. The track of the message for the potential inundation that is possible so far from
cyclone and the maximum rainfall zone is shown in Fig. 15b the coast. It appears that some intensification of the system136 Journal of Southern Hemisphere Earth Systems Science J. Callaghan
occurred as it moved inland after initially weakening following 1625UTC 18 January 2008 (ARI . 2000 years). Peakvale and
landfall. Anakie had similar rare rainfall intensities, and all three stations
The following event analysis gives an insight in the causes of are in the Nogoa River Catchment where record floods were
the 1916 rainfall at Clermont. From this it seems likely that the reported. Moist tropical air reached this area with the Clermont
1916 Clermont rainfall was also associated with strong WAA. synoptic station having a dewpoint of 248C over the period.
For the Bogantungan, Anakie and Peakvale analyses see
6.2 Inland penetration by TC-like systems – the Charters BOM 2008 report: http://www.bom.gov.au/qld/flood/fld_re-
Towers cyclone 2008 ports/Central_and_Western_QLD_Floods_January_2008.pdf.
Early work on the development of TC-like systems in the desert The HYSPLIT trajectory analyses for ascent in the Bogantungan
areas of northern Australia include Foster and Lyons (1984), region is shown in Appendix 2 and shows strong ascent over
McBride (1987), Davidson and Holland (1987) and more Bogantungan at 0600UTC 16 January 2008, 0500UTC 17
recently Varble et al. (2014) and Tang et al. (2016). Two of January 2008 and 0400UTC 18 January 2008.
these systems addressed in these papers are shown in Appendix
3, indicating how WAA was associated with their development 6.3 Inland penetration by the 1958 Bowen Cyclone –
and the occurrence of heavy rain. More of these desert storm Burdekin Floods
events are illustrated in Appendix 3: one a cyclone that
Widespread dislocation of traffic and communications was
developed as it moved from the Darwin area down to Birdsville
reported on the central coast because of flooding in the wake of
in southwest Queensland, producing gales there along with a
a severe TC which struck Bowen on 1 April 1958 and the extreme
long-term Australian record for heavy rain; and a series of desert
rainfall then penetrated well inland (Fig. 18). Record peaks
cyclones which occurred in the Northern Territory during
occurred in the Bowen River on 2 April and in the Bogie River
February 2001 are also inspected, which all had WAA wind
on 3 April. Some homesteads were carried away and their
structures during their intensification periods.
occupants isolated, roads and bridges extensively damaged, and
Emanuel et al. (2008) showed how TC-like systems with a
thousands of cattle lost. From Fig. 18 the heavy rainfall moved
compact radar eye could form over the sandy deserts of Central
overland into the Burdekin River catchment and subsequent
Australia. We observed this to occur in grazing country further
flooding of the lower Burdekin River also broke all records. Goods
east. Fig. 16 shows how a TC-like system, which may have been
were damaged when Home Hill and Ayr were inundated, the water
the remnants of TC Helen, developed between Townsville and
being 2 m deep in the main street of Home Hill at one time. Many
Charters Towers in January 2008. The radar shows the heaviest
cane farms were seriously damaged, three spans of the old railway
rain east of Charters Towers which recorded 146.8 mm in the
bridge at Home Hill were washed away and approaches to the new
24 h to 2300UTC 15 January 2008. Thousands of trees were
high-level bridge cut. Restoration of riverbanks on the Burdekin
reported as being downed between Townsville and Charters
was costly. Record peaks were recorded on the Bowen and
Towers. Charters Towers observation at 0500UTC 15 January
Burdekin Rivers at several locations on 3 April: Birralee, Dalbeg,
2008 was temperature 238C, dewpoint 238C, average wind
Strathalbyn and Home Hill (Inkerman Bridge).
southwest 96 km/h (52 knots), mslp 993.0 hPa and 109.0 mm
Torrential rain caused record floods in other southern
of rain in the past 6 h.
tributaries of the Burdekin on 6 April. Heights on the Suttor
The HYSPLIT air parcel trajectory from Townsville to
River reached 3–4.5 m above the levels thought by local
Charters Towers in Appendix 2 shows parcels undergoing ascent
inhabitants to be the flood extreme. Unofficial rain gauges
over this track. Fig. 17 provides an alternate way to depict the
recorded as much as 500 mm in 10 h and the river was 35 km
WAA wind pattern. The unfilled barbs represent the 850 to
wide in places. Homesteads which had never been affected by
500 hPa wind shear and can be thought of as a thermal wind
floodwaters were almost submerged and some were carried
vector (warmer air to the left of the barb and cooler air to the right).
away. Bridges were destroyed and roads damaged by scouring
The full barb is the 700 hPa wind, which represents the mean flow
up to 5 m deep. The Pioneer River was also in high flood on 2 and
relative to the thermal gradient. The plots use European Centre
3 April, causing the evacuation of 60 homes at Mackay.
Weather Forecasting diagnostics. The resultant WAA was strong
with 25–30 knot (12.5–15 m/s) northeasterlies winds crossing the
25–30 knot (12.5–15 m/s) shears at right angles. The WAA 6.4 Coastal heavy rain occurring from a TC – record Fitzroy
dominated the circulation with weaker CAA on the western side, River flood
which is often observed during TC intensification. Over the In this case, like that reported by Dare et al. (2012), the heaviest
ocean it has been found that intense TCs intensify when WAA rain remained near the coast as the cyclone moved well inland
dominates the circulation (Callaghan and Tory 2014; Callaghan and therefore contrasts with the 1916 Clermont flood. This 1918
2017a, 2018, 2019a, 2019b). The veracity of all the European cyclone made landfall at Mackay (Bath 1957) where a pressure
Centre for Medium-Range Weather Forecasts Analyses in Fig. 17 of 932.6 hPa was read. The cyclone made landfall at Mackay at
is shown by the plotted actual radiosonde wind and shear data. 2100UTC 20 January 1918 and moved in a general westerly
This strong and widespread WAA followed the cyclone south into direction until 2300UTC 25 January 1918 when it was located in
the central highlands (right frame and lower left frame) where the Northern Territory. The record flood of 10.11 m occurred at
Bogantungan (see Fig. 1) reported 329 mm in 24 h to 0051UTC 17 Rockhampton 0100UTC 24 January 1918. The rainfall on the
January 2008 (ARI rainfall 500 year) 453 mm in 48 h to 1105UTC Fitzroy River catchment leading up to the flood was dominated
17 January 2008 (ARI 500–1000 year) and 604 mm in 72 h to by catchment rainfall closer to the coast (see Fig. 19). At least 30North Queensland floods Journal of Southern Hemisphere Earth Systems Science 137
Fig. 16. (Top four frames) Mean sea level pressure distribution and mean wind plots as a cyclone intensified and
moved from near Cairns to Townsville and then to Charters Towers from 2300UTC 13 January 2008 to 0500UTC
15 January 2008. Lower frames show radar eye of the cyclone develop from 0000UTC 15 January 2009 with the
heaviest rainfall (yellow area) east of Charters Towers at 0340UTC 15 January 2008.
people died in Mackay and Rockhampton when the flood in and TC cases and a strong relationship was found at that station
Rockhampton reached a record level which still stands today, between the WAA-type profile (winds turning anticyclonic
damaging 1400 homes and drowning six people. from 850 up to 500 hPa) and heavy rainfall. This was the case
during March 1967 around Cairns when a strong monsoon
6.5 Coastal heavy rain occurring from a TC and a develop- trough lay across the station as TC Elaine was developing into
ing TC – Cairns 1965 and 1977 a cyclone just to the east of Cairns, and torrential rain fell in the
Table 1 shows a relationship between wind data and rainfall north coast Herbert and Barron Divisions. The major feature of
using more than 50 years of wind data at Cairns (latitude 16.98). the months flooding was the record flooding in the Herbert. Falls
The levels were chosen after studying hundreds of heavy rain of up to 1321 mm in 4 days in the Barron and Herbert districts138 Journal of Southern Hemisphere Earth Systems Science J. Callaghan
Fig. 17. Left frame, European Centre (EC) 700 hPa wind plots and 850 to 500 hPa shears (unfilled plots) with 850 to 500 hPa thickness contours
for 0000UTC 15 January 2008. Red numerals are hourly rainfall intensities at locations on the map within 1 h of the analysis. Maximum 24-h
rainfall to 2300UTC 14 January 2008 was 245 mm at Crystal Brook. Small bold circles with wind plots denote warm-air advection. Large plots
are actual radiosonde observations. Top right similar except for 0000UTC 16 January 2008. Lower left frame similar except for 1200UTC 16
January 2008, red numerals are 24-h rainfall totals to 2300UTC 16 January 2008. Lower right, for 0000UTC 17 January 2008.
Rainfall (mm) Rainfall (mm)
24hour rainfall 400 mm 24hour rainfall 400 mm
To 9am 2 April 1958 To 9am 3 April 1958
300 mm 300 mm
200 mm 200 mm
150 mm 150 mm
100 mm 100 mm
50 mm 50 mm
25 mm 25 mm
15 mm 15 mm
10 mm 10 mm
5 mm 5 mm
1 mm 1 mm
0 mm 0 mm
Fig. 18. The 24-h rainfall distribution from 2300UTC 01 April 1958 to 2300UTC 02 April 1958, red dashed area marks Burdekin River catchment.North Queensland floods Journal of Southern Hemisphere Earth Systems Science 139
Rainfall (mm) Rainfall (mm)
400 mm 400 mm
300 mm 300 mm
200 mm 200 mm
24hour rainfall to 9am 24hour rainfall to 9am
150 mm 21 January 1918 150 mm 22 January 1918
100 mm 100 mm
50 mm 50 mm
25 mm 25 mm
15 mm 15 mm
10 mm 10 mm
5 mm 5 mm
1 mm 1 mm
Rainfall (mm) Rainfall (mm)
400 mm 400 mm
300 mm 300 mm
200 mm 200 mm
24hour rainfall to 9am 24hour rainfall to 9am
23 January 1918 150 mm 24 January 1918
150 mm
100 mm 100 mm
50 mm 50 mm
25 mm 25 mm
15 mm 15 mm
10 mm 10 mm
5 mm 5 mm
1 mm 1 mm
Fig. 19. The 24-h rainfall distribution from 2300UTC 20 January 1918 to 2300UTC 23 January 1918, red dashed area marks Fitzroy River catchment.
produced the highest flood on record in the Herbert River. Near A record major flood occurred (Bureau of Meteorology
record flooding was also reported in the Barron, Johnstone and 1998) when ex TC Sid struck the Townsville area in January
Tully Rivers. Similarly, during March 1977, TC Otto brought 1998. The rainfall intensity at Townsville was greater than that
record floods in the Barron River in Cairns. of the 2019 event. The rainfall intensity for all durations from 1
to 24 h significantly exceeded the 100-year ARI (significantly
6.6 Extreme rainfall from extratropical transition – ex TC less than the 1% AEP). The 24-h total at Townsville at 2300UTC
Oswald 2013 and ex TC Sid 1998 10 January 1998 was 548.8 mm, which stands as Townsville’s
Both events occurred when the remnants of TCs interacted with record. There were WAA winds recorded at Townsville leading
deep layered trough systems in a similar way to extratropical to the heaviest rainfall (Bureau of Meteorology 1998). There
transition events (Jones et al. 2003) and the rainfall in both were larger 24-h totals to 2300UTC 10 January 1998 around
cases was characterised by winds which turned anticyclonic Townsville including 742.0 mm at Railway Estate and
from 850 up to 500 hPa. From Leroux et al. (2020) a record 735.0 mm at Vincent. The effect of this intense rainfall in
daily rainfall of 348.0 mm was recorded at Rockhampton on 25 1998 was destructive flash flooding.
January 2013 when ex TC Oswald moved down through
eastern Queensland. A total of 6500 properties across 90 towns 6.7 Extreme rainfall from a tropical low – Mackay 1958
were either damaged or uninhabitable across Queensland, During February 1958, Mackay experienced a record flood of
costing an estimated A$2.4 billion. In tropical regions, major 9.14 m. This event produced remarkably heavy rain over short
floods occurred in the Herbert, Haughton and Fitzroy Rivers periods. For example, Mt Pelion (on the coastal plains) near
while record floods occurred just south of the tropics at Baffle Mackay reported 292 mm in 2.5 h and 589 mm in 6 h overnight
Creek and Bundaberg. on the 17/18 February 1958. Other rain gauges in the Mt Pelion140 Journal of Southern Hemisphere Earth Systems Science J. Callaghan
area overflowed at 30 inches (762 mm) that night. In the same Record-breaking rainfall and flooding occurred over tropi-
region at Elaroo, 533 mm was recorded in 5 h before the gauge cal north Queensland in late January early February 2019
overflowed. A nearby farm recorded 914 mm in just over 8 h. without favourable influences from some of the major climate
The observers noted that the heaviest rain was associated with drivers or from SSTs over adjacent seas. The main influences
thunderstorms (Brunt 1958). for the heavy precipitation were a stronger monsoon surface
Three people died in floods in the Mackay area, while 20 circulation than normal over northern Australia and a stronger
houses were washed away and there was severe damage to mean sea level subtropical ridge over New Zealand, which both
infrastructure including two bridges. After being inundated for combined to produce above average general easterly flow
12 h, Foulden (population 250) was destroyed and property south of the monsoon trough. Combined with this was a vertical
owners lost all their possessions. All houses were totally atmospheric structure that caused the winds to turn in an
wrecked, three being washed out to sea. Most of the population anticyclonic sense from around 1.5 km elevation and, where
sought refuge on the roofs of their homes, only to find them there was a large tropical moisture content, up to around 5.8 km
being washed away and many narrow escapes from drowning elevation. This wind structure is associated with isentropic
were reported. The flood left great depths of silt which ascent and is often referred to as WAA (Tory 2014). The
completely covered the town by up to 3 m. In places only the rainfall fell for lengthy periods in this WAA region due to the
tops of telephone poles were showing. All communications were slow movement of a low-pressure system, which after a time
cut, and cane crops were destroyed. The synoptic situation was became quite intense. The slow movement was associated with
like that at Townsville in 1998, with a monsoon low near a symmetric structure around the low having strong deep
Mackay and an upper low to the west of Mackay. The heaviest monsoon westerlies to its north and strong deep easterlies to
rain fell in the onshore flow south of the monsoon trough. its south. The resultant flooding caused loss of human lives and
Mackay had no upper air observations at that time although an unprecedented loss of livestock. The event was compared
examination of the upper winds at Gladstone gave some insight with earlier historical events in north Queensland and some of
into the three-dimensional WAA structure in the winds south of these showed rainfall rates far greater than those in 2019. A
the monsoon trough. The winds at Gladstone at 2300 UTC 16 flood in Clermont during 1916 caused by extraordinary rainfall
February 1958 were 850 hPa east-northeast winds turning (seldom experienced even in tropical coastal areas) resulted in
anticyclonic with height to 500 hPa northerlies. the loss of up to 70 lives. The same general region experienced
another event during January 2008 and rainfall rates were
6.8 Prolonged extreme rainfall – Gulf of Carpentaria 1974 analysed as greater than a one in 2000-year event. The data
associated with the 2008 event suggested that such extreme
The 1974 Gulf flood was a record in the lower reaches of the
rainfall rates, and the development of a TC-like weather system
Norman and Leichardt Rivers and the second highest in the lower
in the usually dry tropical interior was from strong and
reaches of the Gilbert and Flinders Rivers. About 560 Normanton
widespread WAA overlying humid tropical air masses. The
residents, almost the entire population, were evacuated on January
dynamics of this system along with several other events
24 with 460 to Cairns and the rest to Mount Isa. On 14 February
mentioned in Appendix 3 allow us to speculate on what caused
1974, Normanton residents began returning to their homes after
the extraordinary rainfall at Clermont in 1916. The other past
the biggest floods the Gulf country had known that century. Prior
events were all associated with record north Queensland floods
to 1974, the most severe floods since settlement of the region
and only two, the 1974 Gulf flood and the 1958 Mackay flood
occurred in the summer of 1869–70 (Simpson and Dautch 1977).
had no TC interaction.
It rained at Normanton consistently throughout November
and December 1973; during 3–17 January 1974 the town Conflicts of interest
recorded 388.0 mm, and in the 48 h to 9 am 19 January
244.1 mm was recorded. The heaviest rain fell at Normanton The author declares no conflicts of interest.
during 17–23 January 1974 when a monsoon trough extended
across the continent from 208S to 238S with strong north- Declaration of funding
westerly monsoon winds flowing in from the north. The main No funding was received for this study.
low-pressure centre in the trough over this period moved from
near Alice Springs to the central interior of Western Australia. Acknowledgements
The three anonymous reviewers provided excellent guidance to progress this
7 Conclusion paper into a publishable form. Samantha Taylor produced the statistical data
in Table 1 from the Bureau of Meteorology national archives.
This is the first paper to address the anticyclonic turning of the
winds with height (WAA phenomena) in causing monsoon and TC References
floods in the northeast Australian tropics and in TC-like systems
Adekunle, A. I., Adeqboye, O. A., and Rahman, K. M. (2019). Flooding in
that develop over the interior of northern Australia and are capable Townsville, North Queensland, Australia, in February 2019 and Its
of producing extreme rainfall, which help explain Australia’s Effects on Mosquito-Borne Diseases. Int. J. Environ Res Public Health
worst tropical flooding disaster. We have earlier addressed floods (2019 Apr). 16(8), 1393. doi:10.3390/IJERPH16081393
from WAA in southeast Australia and around the globe, and Anjaria, J. S. (2006). Urban Calamities: A View from Mumbai. Space and
extreme rainfall in US hurricanes and Australian TCs. Culture 9(1), 80–82. doi:10.1177/1206331205283830You can also read