Water - Macquarie University
←
→
Page content transcription
If your browser does not render page correctly, please read the page content below
Water 2011, 3, 1149-1173; doi:10.3390/w3041149
                                                                                         OPEN ACCESS

                                                                                       water
                                                                                    ISSN 2073-4441
                                                                          www.mdpi.com/journal/water
Article

The 2011 Brisbane Floods: Causes, Impacts and Implications
Robin C. van den Honert * and John McAneney

Risk Frontiers, Macquarie University, NSW 2109, Australia; E-Mail: john.mcaneney@mq.edu.au

* Author to whom correspondence should be addressed; E-Mail: rob.vandenhonert@mq.edu.au;
  Tel.: +61-2-9850-4421; Fax: +61-2-9850-9394.

Received: 1 November 2011; in revised form: 29 November 2011 / Accepted: 2 December 2011 /
Published: 9 December 2011

      Abstract: On 13th January 2011 major flooding occurred throughout most of the Brisbane
      River catchment, most severely in Toowoomba and the Lockyer Creek catchment (where
      23 people drowned), the Bremer River catchment and in Brisbane, the state capital of
      Queensland. Some 56,200 claims have been received by insurers with payouts totalling
      $2.55 billion. This paper backgrounds weather and climatic factors implicated in the
      flooding and the historical flood experience of Brisbane. We examine the time history of
      water releases from the Wivenhoe dam, which have been accused of aggravating damage
      downstream. The dam was built in response to even worse flooding in 1974 and now
      serves as Brisbane’s main water supply. In our analysis, the dam operators made
      sub-optimal decisions by neglecting forecasts of further rainfall and assuming a ‘no
      rainfall’ scenario. Questions have also been raised about the availability of insurance cover
      for riverine flood, and the Queensland government’s decision not to insure its
      infrastructure. These and other questions have led to Federal and State government
      inquiries. We argue that insurance is a form of risk transfer for the residual risk following
      risk management efforts and cannot in itself be a solution for poor land-use planning. With
      this in mind, we discuss the need for risk-related insurance premiums to encourage flood
      risk mitigating behaviours by all actors, and for transparency in the availability of flood
      maps. Examples of good flood risk management to arise from this flood are described.

      Keywords: flood; Brisbane River; January 2011; water release strategy; flood risk
      management; insurance; land use planning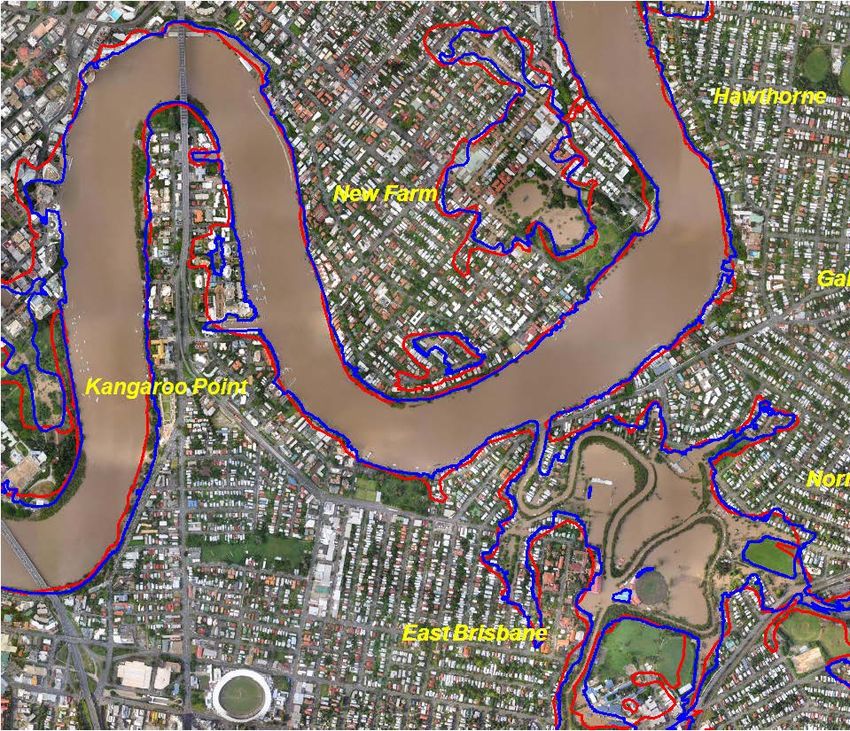
Water 2011, 3                                                                                    1150

1. Introduction

   On Thursday 13th January 2011 Brisbane, the state capital of Queensland, Australia (27°30' S,
153°1' E) (Figure 1), experienced its second highest flood since the beginning of the 20th Century.
Major flooding occurred throughout most of the Brisbane River catchment, most severely in the
catchments of the Lockyer Creek and Bremer River (major tributaries of the Brisbane River) where
numerous record flood heights were experienced. The flooding caused the loss of 23 lives in the
Lockyer Valley and one in Brisbane, and an estimated 18,000 properties were inundated in
metropolitan Brisbane, Ipswich and elsewhere in the Brisbane River Valley. This paper collates
information on the flood from a number of public sources, notably the Bureau of Meteorology (BoM)
and submissions to the Queensland Floods Commission of Inquiry [1], and offers some commentary
on the operational management of the Wivenhoe Dam, and insurance and land use planning issues.

                                   Figure 1. Location of Brisbane.

   The paper is organised as follows. Section 2 provides a description of the Brisbane River system
and catchment, while Section 3 reports on the history of flooding in Brisbane. Section 4 details the
rainfall recorded in eastern Australia over the period December 2010 to January 2011. Section 5
describes and comments on operational strategies for water releases from Brisbane’s flood mitigation
and storage dams, while Section 6 examines the impacts of the flooding on the urban environment, and
includes an aerial photographic comparison of the extent of flooding with the largest previous flood in
Brisbane in January 1974. Subsequent sections report on the Interim Report of the Queensland Floods
Commission of Inquiry, and consider insurance and land-use planning issues and their implications for
reducing future flooding risks, concerns that, at the time of writing, have yet to be fully examined by
the Commission.
Water 2011, 3                                                                                    1151

2. The Brisbane River Catchment

2.1. The Brisbane River

   The Brisbane River is the longest river (309 km) in south east Queensland. Its source is located in
the Brisbane Range some 120 km north west of the city of Brisbane. From there it makes its way south
before meeting the Stanley River, just downstream of Somerset Dam, to run into Lake Wivenhoe, the
main water supply for Brisbane. Lake Wivenhoe was created by the Wivenhoe Dam completed in
1984 in response to severe flooding in 1974 and with the principal aim of protecting Brisbane from
future floods. Since its construction many considered that this dam would eliminate the flood risk to
Brisbane, notwithstanding warnings against this way of thinking [2]. Downstream from the Wivenhoe
dam the river flows eastwards, meeting the Bremer River near Ipswich before making its way through
Brisbane’s western suburbs towards the Pacific Ocean.

2.2. The Brisbane River Catchment

   The Brisbane River’s catchment is some 13,570 km2 in area, bounded to the west by the Great
Dividing Range and to the southeast and north by a number of smaller coastal ranges. Most of the
catchment is rural—forestry and grazing land—but also includes the major metropolitan areas of
Brisbane and Ipswich, as well as a number of smaller townships (Figure 2).

                  Figure 2. A topographical map of the Brisbane River catchment.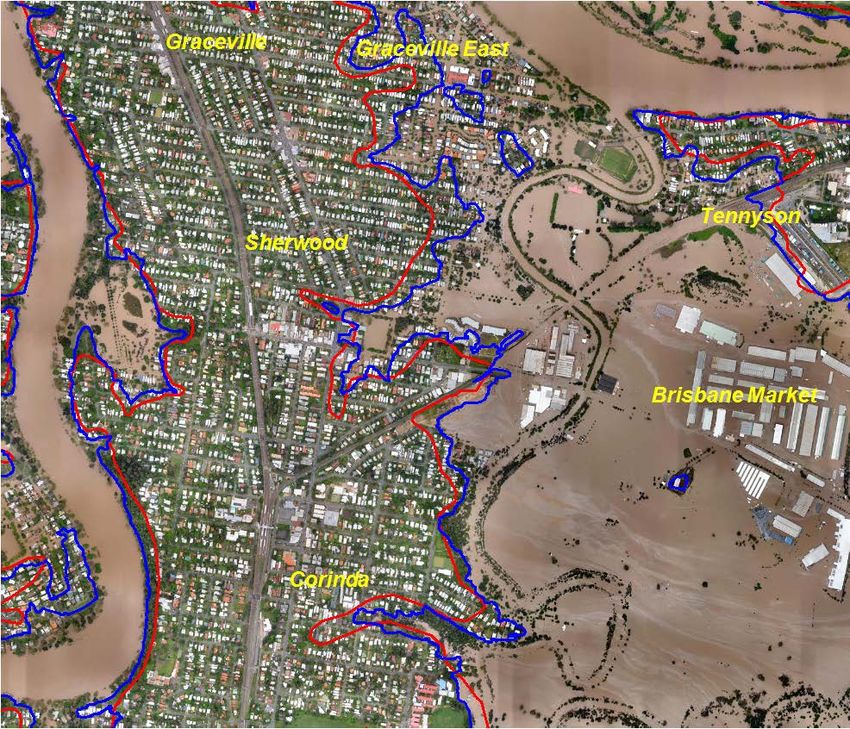
Water 2011, 3                                                                                                      1152

   The physical characteristics of the catchment have changed over the last 100 years due to
progressive settlement and development along the banks of the river [3]. This development
has included the construction of the Wivenhoe and Somerset Dams. At full supply level (FSL)
Wivenhoe and Somerset Dams have water supply capacities of 1.15 million mL and 0.37 million mL
respectively. Total available storage capacities for flood mitigation are 1.45 million mL and
0.52 million mL respectively [3].
   Just where and how much rain falls within the catchment will critically determine the dams’
effectiveness as flood mitigation measures. Situated upstream from where the Lockyer Creek and the
Bremer River join the Brisbane River, the dams can only have a limited influence on the Bremer River
by reducing the downstream level of the Bremer River as it enters the Brisbane River. In extreme
scenariosin small reservoirs, incoming waters will have to be released at at least the same rate in order
to avoid destruction of the dam itself; larger reservoirs (like Wivenhoe and Somerset Dams) can
provide significant flood attenuation until the flood compartments are filled. In such scenarios, the dam
will have no moderating influence on downstream flooding. We will return to the role of the dam in
moderating or aggravating the recent flooding in later discussion.

3. Historical Flood Events on the Brisbane River

   The city of Brisbane is built on a flood plain [4]. Flood records extend back as far as the 1840’s,
only a few years after European settlement of the area in 1824 (Figure 3).

                          Figure 3. Maximum recorded gauge height on the Brisbane River at the Brisbane City
                          gauge for significant flood events (Adapted from [2]) (Brisbane River at Brisbane City
                          Gauge Highest Annual Flood Peaks).

                          9

                          8

                          7

                          6
   Gauge Height (m AHD)

                          5

                          4

                          3

                          2

                          1

                          0
                              1840   1860   1880      1900      1920          1940   1960   1980     2000     2020
                                                                       Year

   The largest recorded gauge heights were in 1841 and 1893 (over 8.35 m AHD (Australian Height
Datum)), which represents a depth of approximately 6.5 m above the highest tide level. The largest
flood of the 20th Century was in January 1974, when a gauge height of 5.45 m was recorded at the
Brisbane City gauge. As the Brisbane River flooded, it backed up the Bremer River, resulting in 4 to
5 days of record water heights in Ipswich [2].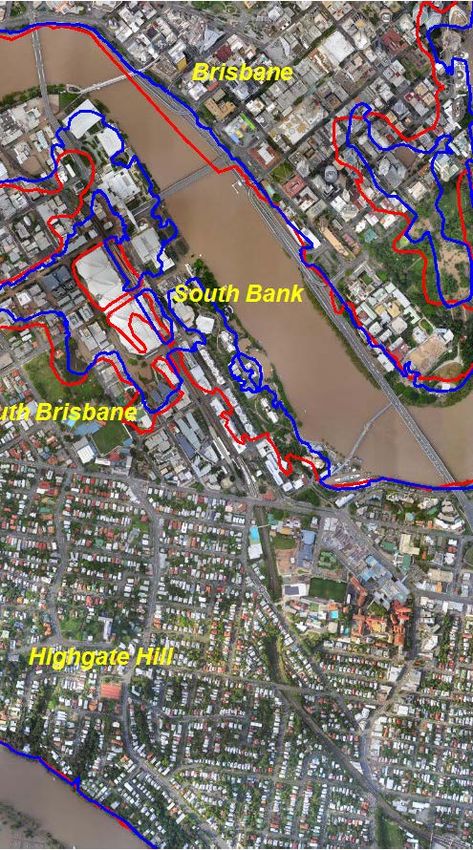
Water 2011, 3                                                                                     1153

   The floods of 1893 (actually a series of three flood peaks over a period of three weeks) and 1974
were both caused by rainfall from decaying tropical cyclones.
   In January 1974 Tropical Cyclone Wanda crossed the coast about 150 km north of Brisbane, and
then followed a southwesterly track. In addition to providing rain that saturated the catchment, it
forced a monsoonal trough southwards to Brisbane, which persisted for four days and resulted in
several periods of very intense rainfall. January 1974, with a monthly total of 872 mm, was the wettest
January on record and the second wettest month ever, surpassed only by February 1893 in which
1,026 mm was recorded. Brisbane’s mean January rainfall is 166 mm [5].
   Although smaller in magnitude than the 1893 floods, the impact of the 1974 flood remains the most
severe example of urban flooding in Australia. Damage in the 1974 flood was greater than in 1893
because Brisbane’s population had grown from around 175,000 in 1893 to around 1 million and the
greater exposure afforded by new buildings and infrastructure. Table 1 shows some comparative
damage statistics from the 1893 and 1974 floods. Insured losses from the 1974 event ran to almost
$2.29 billion (normalised to 2006 exposure, societal conditions, inflation and wealth) [6]. Given 2011
exposure, the normalized insured losses are of the order of $3.3 billion [7].

     Table 1. Comparative damage statistics—February 1893 and January 1974 Brisbane River
     floods (Source: [8]).
            Station                                February 1893          January 1974
            Deaths                                      35                     16
            Injuries                                    300                   300
            Persons left homeless                      5,000                 9,000
            Persons evacuated                                                9,000
            Buildings damaged                           5,000                7,000
            Cars damaged or destroyed                                        1,000

4. Causes (1): Rainfall in Eastern Australia: December 2010 to January 2011

4.1. Rainfall During December 2010 and January 2011

   The second half of 2010 and early 2011 was characterized by one of the four strongest La Niña
events since 1900 (Figure 4). Strong La Niña events are often associated with extreme rainfall and
widespread flooding in eastern Australia [9].
   An extremely wet spring (September to November) meant that catchments were already saturated
before the December 2010 and January 2011 rains. Figure 5 shows total rainfall across Australia for
November 2010 to January 2011. During this period, rainfall in the 600 to 1,200 mm range was
widespread along most of the Queensland coast. Some stations north and west of Brisbane exceeded
1,200 mm during this same period.
Water 2011, 3                                                                                    1154

     Figure 4. Average summer (October to March) Southern Oscillation Index (SOI), 1900/01
     to 2010/11. (Source of data: [10]).

         Figure 5. Total rainfall for the period November 2010–January 2011 (Source: [11]).

   The Bureau of Meteorology warned the public and government about the likely strength of the La
Niña event [12]. This did not, however, invoke any action on the part of the dam operators to draw
down water levels from Full Water Supply to accommodate likely increased rainfall. We will address
the question of dam operation during the flooding event in a later section.

4.2. Flooding in Eastern Australia

  The excessive rainfall over December and the first half of January resulted in almost every river in
Queensland south of the Tropic of Capricorn and east of Charleville and Longreach recording major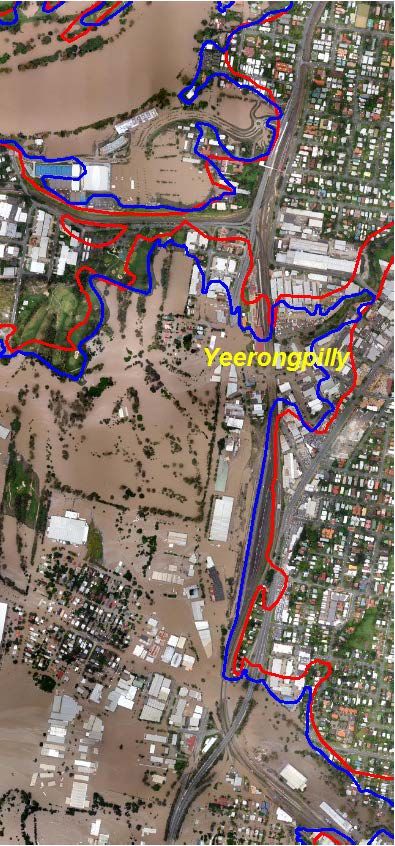
Water 2011, 3                                                                                    1155

flood levels at some stage during this period [9]. Severe flooding also affected other parts of
Queensland, northern and western Victoria, inland New South Wales and northern Tasmania (Figure 6).

     Figure 6. Flood peaks in eastern Australia over the period 26th November 2010–20th
     January 2011 (Source: [9]).

4.3. Rainfall Meteorology in South East Queensland During 8th to 12th January 2011

   The flooding in southeast Queensland during the second week of January was caused by the
interaction of a low-pressure system situated off the mid and south Queensland coasts, and upper level
and monsoonal troughs [13]. Between Friday 7th January and Sunday 9th January the low-pressure
system moved in a southerly direction from east of Mackay (800 km north west of Brisbane) to an area
north east of Fraser Island, before moving closer to the coast on Monday 10th January. Early on
Sunday 9th January the low-pressure system combined with an upper level trough to deliver heavy
rains to southeast Queensland. This rainfall continued for much of the day.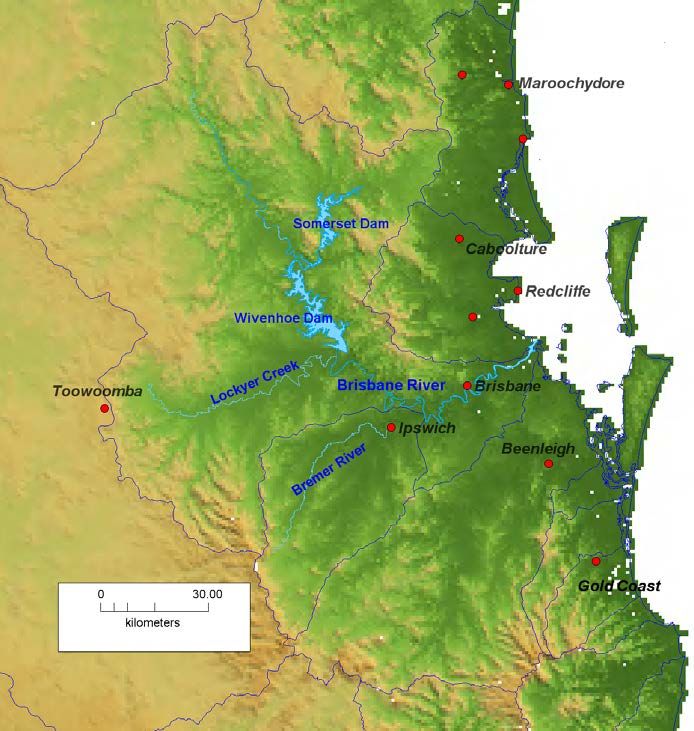
Water 2011, 3                                                                                     1156

   The upper level trough dissipated early on Monday 10th January, but the low-pressure system
intensified and moved north to combine with a southward moving monsoonal trough. Warm moist air
delivered into this trough system by a high pressure system located off New Zealand led to very heavy
rainfalls across the southeast corner of Queensland from the evening of Monday 10th until the late
afternoon of Tuesday 11th January, with rainfall tailing off on Wednesday 12th [13]. Direct rainfall
for the period 9th–13th January into Wivenhoe and Somerset Dams was very heavy, with totals of
480 mm and 370 mm respectively.
   The 10th–11th January rainfall led to very high water levels in the two dams. Levels in Somerset
Dam peaked at 104.96 m AHD around 05:30 on Wednesday 12th January 2011. Water levels in
Wivenhoe Dam peaked at 74.97 m AHD around 19:00 on Tuesday 11th January and remained above
74.9 m AHD for six hours from 18:00 on Tuesday 11th January [13].
   Downstream of the dams, areas in the lower Brisbane River catchment also experienced significant
rainfall, decreasing towards the south and east. In the Lockyer Creek catchment total rainfalls of
around 450 mm were recorded close to its downstream end, with intensities having an Average Return
Interval (ARI) greater than 100-years for durations greater than 3 hours. In the Bremer River catchment,
420 mm was recorded near the northwestern limit. The lowest rainfalls across the lower reaches of the
catchment were recorded in the southern and eastern suburbs of Brisbane (110–160 mm) [13].

4.4. Comparing the Three-Day Rainfall Totals from the January 2011 Flood Event with Those of the
January 1974

   Figure 7 displays three-day rainfall totals from the period 10th–12th January 2011 and for the
25th–27th January 1974. Key points to emerge are:
   (1) Peak rainfalls in 1974 were substantially heavier than those in 2011. A number of rainfall
       stations in southeast Queensland had three-day rainfall totals in excess of 1,000 mm in 1974
       compared with a maximum of 648 mm recorded during the 2011 event. Over the Brisbane
       River catchment as a whole, the average three-day rainfall in 1974 was 349 mm, compared
       with 286 mm in 2011, and all four major sub-catchments were also wetter in 1974 than in
       2011, although by small margins in the cases of the Bremer (442 mm vs. 417 mm) and
       Lockyer (331 mm vs. 292 mm) sub-catchments [9].
   (2) The above observation also extends to metropolitan Brisbane where three-day and one-day
       totals of 600 mm and 314 mm in 1974 were significantly greater than the 166 mm and
       111 mm recorded in 2011 [9].
   (3) In 1974 the heaviest rains in south east Queensland occurred close to the coast, whereas in
       2011 the heaviest rainfalls spread further inland, particularly on the western fringe of the
       Brisbane River catchment and on the Great Dividing Range.
   Insufficient data exists for a full assessment of the 1893 event. However, available station data
indicate that peak rainfalls in the region during the 1893 event were heavier than those during either
the 1974 or 2011 events [9].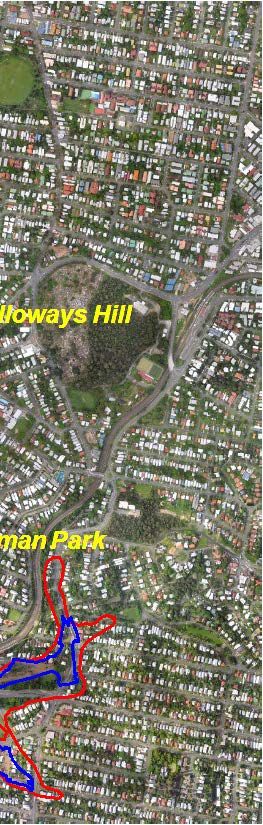
Water 2011, 3                                                                                      1157

     Figure 7. Three-day rainfalls for the periods from 25th–27th January 1974 (left) and
     10th–12th January 2011 (right) (Source: [9], ©Commonwealth of Australia, 2011).

5. Causes (2): Water Releases from Wivenhoe Dam

   Hydrologists appointed by the Insurance Council of Australia to investigate events leading to flood
damage claims in Brisbane, Ipswich, Toowoomba and the Lockyer Valley consider the Brisbane flood
event to be a “dam release flood.” In other words, in their view release of water from the Wivenhoe
Dam was a key contributor to the flooding downstream over the period 11th–12th January 2011 [13].
This does not imply fault, but merely acknowledges that the water that caused much of the damage
came from dam releases. In what follows we briefly discuss this issue.
   Seqwater operates the Wivenhoe and Somerset Dams in accordance with procedures contained in
its operations manual [14]. The manual provides objectives and strategies to guide operational
decision-making during a flood event, and lists its operational objectives, in descending order of
importance, as:
   (1) ensuring the structural safety of the dams;
   (2) providing optimum protection of urbanised areas from inundation;
   (3) minimising disruption to rural life in the valleys of the Brisbane and Stanley Rivers;
   (4) retaining the storage at Full Supply Level (for water supply purposes) at the conclusion of the
       Flood Event;
   (5) minimising impacts to riparian flora and fauna during the drain down phase of the flood.
    Apart from the obvious most important objective of ensuring the structural integrity of the dam
itself, it can be seen that the dam is expected to serve two contradictory functions. On the one hand it
serves as a buffer against drought, meaning that it is desirable to keep the dam as full as possible in
case future rainfall is low (objective 4); on the other hand, the dam was specifically built to provide a
buffer against floods, meaning it is desirable to keep it as empty as possible to maximize retention of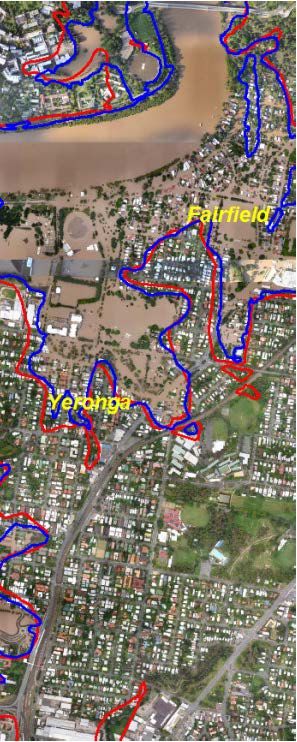
Water 2011, 3                                                                                     1158

flood waters (objectives 2, 3 and 5). Since keeping the dam full and empty are not simultaneously
possible, Seqwater’s engineers have to balance these conflicting objectives.
   In January 2011, Wivenhoe Dam was called upon to accommodate massive inflows made up of
surface runoff from the upstream catchment area, releases from Somerset Dam and direct rainfall into
the lake. The greater the volumes and rate of inflow, the less effective are dams in mitigating flood
flows, and the more constrained are management options for dam operators. According to a Seqwater
report into the January 2011 flood event ([15,16]) operational decisions were made in accordance with
the manual. Dam outflows were delayed until it was clear that no other option was available without
risking the safety of the dams. Seqwater reported that:
   Two distinct flood peaks entered Wivenhoe Dam during the flood event. The first flood into
   Wivenhoe Dam was similar in nature and magnitude to the comparable flood flows of the
   January 1974 event. The combined mitigation effect of Somerset and Wivenhoe Dams ensured
   that this first flood did not result in urban damage below Moggill (some 20 km upstream from
   Brisbane CBD), however achieving this result did cause significant filling of the dams’ flood
   storage compartments. The second flood was also similar in nature and magnitude to the
   comparable flood flows of the January 1974 event. The flood compartments of the dams were
   filled to a high level by the first flood and there was not sufficient time to release this water
   prior to the second flood arriving. Accordingly, the second flood could not be completely
   contained without risking the safety of the dams. The resulting inflow of water into the
   Brisbane River, combined with floodwaters from Lockyer Creek, the Bremer River and the
   Lower Brisbane River resulted in significant urban damage. However, the extent of this
   damage was greatly reduced by the operation of the dams. [15]
   The inflow of water into the Wivenhoe Dam, the outflows and the headwater elevation of the dam
around the time of the 2011 flood are shown in Figure 8. The peak of the outflow from the dam
(around 23:30 on 11th January) was approximately 40% lower than the peak of the inflows (at about
13:00 on the same day). Indeed, model estimates provided to Seqwater by Brisbane City Council
indicate that without the mitigating effects of Wivenhoe the peak flood height measured at the City
gauge near the Brisbane CBD would have been approximately 2.0 m higher than was actually
experienced, and a further 14,000 properties impacted [15].
   Figure 8 shows that water releases commenced only at 15:00 Friday 7th January when Wivenhoe
Dam was at 109.6% and Somerset at 110.9% of FSL, with a total of 153,000 mL already in flood
storage. In the week from 06:30 Tuesday 4th January, when Wivenhoe Dam was at 102.1% and
Somerset at 102.9% of FSL and Seqwater were required under the manual to declare a Flood Event,
there were only 14 hours during which the release rates from Wivenhoe Dam exceeded inflows.
   The balancing act between retaining as much water as possible and releasing water to make space
for further significant inflows has been automated to some extent with the operations manual directing
that the water release strategy chosen at any point in time will depend on the actual water level in the
dam, as well as modeling predictions about future water levels. The latter are to be made using the best
available forecast rainfall and stream flow information [14]. In the aftermath of the January 2011
flood, a senior Wivenhoe engineer has stated before the Commission of Inquiry [17] that uncertainty in
BoM rainfall forecasts and the paucity of rain gauges in the catchment immediately above the
Water 2011, 3                                                                                     1159

Wivenhoe Dam led them to conclude that the precipitation forecasts were not sufficiently reliable to
form the basis for operational decision making [18]. Seqwater claim there were gaps in the information
on which operational decisions needed to be made, despite them having available the best rain gauge
of all-the dam itself!

     Figure 8. Inflow and release of water for the January 2011 flood event—Wivenhoe Dam
     (Source: [15]).

   With this in mind, and rather than employing data from forecasting models, Seqwater’s modeling
considered “no further rainfall” as the most appropriate scenario for predicting the future dam level.
Thus less-than-perfect information contained in the BoM’s forecast rainfall was given zero weight in
decision-making. In other words, the dam operators chose a scenario guaranteed to be wrong over a
forecast that was likely uncertain. From this outcome it is difficult not to conclude that the fact that
Queensland had been in drought for most of the previous decade [19] anchored their decision making
towards conserving FSL.
   Many tools exist to facilitate decision making under uncertainty, e.g., [20]. None of these guarantee
favourable outcomes, but we must learn to differentiate between bad outcomes and bad decisions. One
example of a tool that may have proved useful to decision makers at Wivenhoe is the geostatistical
technique of kriging [21,22]. This method is widely used to interpolate the value of a random variable,
in this case rainfall, at an unobserved location from observations at nearby locations, a process that
would seem very appropriate in the Wivenhoe rainfall problem.
   Other tools such as decision trees [23] could have proved useful. Here uncertainties in random
variables are expressed through probability density functions that describe the range of possible values
and the relative likelihood of values in between. Rather than choosing a single scenario, the dam
operators could have considered a spectrum of possible futures with various downstream flooding
Water 2011, 3 1160
outcomes weighted by their likelihood of occurrence and contingent upon various rainfall scenarios. A
decision tree would have allowed the operators to incorporate what was known or expected about
future rainfall explicitly into the decision process. In the event, the dam operators chose not to do
this and thus rather than making a decision under uncertainty, they chose to make a decision
under ignorance.
How bad were the rainfall forecasts? Figure 9 compares the 24-hour Quantitative Precipitation
Forecasts (QPFs) for the Wivenhoe Dam catchment, and the actual rainfall intensities observed for the
first half of January 2011.
Figure 9. Forecast and actual rainfall intensities in the Wivenhoe catchment, January 2011
(Source of data: [15]).
160
140
Forecast
Actual
120
24-hour rainfall (mm)
100
80
60
40
20
0
1 2 3 4 5 6 7 8 9 10 11 12
January 2011
Rainfall forecasts correspond reasonably well with actual average rainfall recorded up until
8th January 2011. Over the next two days the 24-hour forecasts significantly underestimated the
average rainfall subsequently recorded. On 11th January the situation was reversed: the forecast was
almost double that actually recorded. Thus extremely heavy rainfall was correctly predicted around the
time of the flood, but the intensity of the main peak was underestimated, and its timing off by around
48 hours. Using this forecast as an input would allow the decision to be based on a probabilistic
approach, which could be tested and implemented using Monte Carlo simulation or stochastic
modeling. It would also be advisable to take account of the variability in spatial and temporal (as in
Figure 9) patterns of rainfall forecasts. The accuracy of forecasts could be incrementally improved
(that is, the variability of the forecast reduced) as more information became available. This is known as
iterative “Bayesian updating”.
The operators use a computer-based modeling tool, the so-called “real time flood model”, to predict
the reservoir water level. Two predictions are generated: a with forecast prediction that incorporates
the BoM’s rainfall forecasts and a without forecast that assumes zero rainfall. The former is tracked inWater 2011, 3 1161
blue in Figure 10 while the latter is shown in red. The with forecast prediction suggests that the level
of the lake would exceed 74.0 m, the tipping point for the purposes of moving to a water release
strategy where the primary consideration is the structural safety of the dam. This strategy, according to
the manual, has no upper limit on the maximum release rate of water from the dam. The red line,
however, the without forecast prediction, remains well below the 74.0 m threshold. In short, by failing
to use all the information available to them (however incomplete), the dam operators made a
sub-optimal decision, even if the dam was operated according to the operations manual.
Figure 10. Modeled Wivenhoe dam lake levels—8:00 pm on 9 January 2011 (Source: [12]).
6. Impacts and Flooding
During the January 2011 event there were two major floods. The first of these was a severe flash
flood that occurred on the afternoon of Monday 10th January in the inland city of Toowoomba and
downstream in the Lockyer Valley (Figure 2). The Toowoomba/Lockyer Valley flash flooding was
exacerbated by way a series of intense storms, with falls of 40–50 mm in 30 min, which moved over
the already saturated catchment. Runoff was concentrated to maximum effect down gullies and streets
in Toowoomba. Unable to cope with the volume of water, the creeks burst their banks, pushing a wall
of water up to 11 m high through the city centre [24].
The speed of the flash flooding gave little time for warning. Flash flooding occurred at about
2:30 pm on 10th January; at 1:00 pm the Bureau of Meteorology issued a warning of localized flash
flooding in the area and also alerted the State Disaster Coordination Centre. Informal warnings were
blogged by the community at 1:40 pm, reporting that a wall of water was threatening Lockyer Creek.
The flood had reached up to 7 m by the time it struck with destructive velocity the town of
Grantham, further downstream. Buildings adjacent to waterways were swept away in Murphy’s Creek,
Postmans Ridge and other locations. Conditions were especially hazardous at Grantham because of the
number of dwellings constructed on the floodplain close to the river. Water depths of 2.0–2.5 m over
the floodplain were realized in 10–15 min with velocities estimated to have been between 2 andWater 2011, 3 1162
3 m/s. Nearly every house on the floodplain area of Grantham suffered major damage; a number
were washed off their foundations and some totally destroyed. In total 23 people drowned in the
Toowoomba and the Lockyer Valley flash floods, with nine others still missing, presumed dead.
The second major flood event occurred on 13th January when dam releases from Wivenhoe Dam
flooded the city of Brisbane and surrounding areas. Figure 11 shows a hydrograph of the Brisbane
River at the Brisbane City gauge between 8th January and 16th January.
Figure 11. Height of the Brisbane River at the City Gauge between Saturday 8th January
and Sunday 16th January (Source: [25], based on data from [26]).
Evident in Figure 11 are two peaks—a minor peak at 5:00 pm on Wednesday 12th January (4.30 m)
and then later at 3:00 am on Thursday 13th January, when the river reached 4.46 m. Given a “major
flood” at the Brisbane City gauge is defined as a gauge height of 3.50 m or greater, Brisbane City
experienced a major flood from 10:00 am on Wednesday 12th January until 6:00 pm on Thursday
13th January, a period of 32 hours.
This 32-hour period at the City gauge spanned three high tides [25]:
• 14:15 Wednesday 12th January
• 02:34 Thursday 13th January
• 14:54 Thursday 13th January
The major peak of 4.46 mAHD at the City gauge corresponded almost exactly with the high tide at
2:34 am on 13th January. The minor peak of 4.30 mAHD at 17:03 Wednesday 12th January (Figure 11)
probably represents the highest river flows. Brisbane felt the full force of these. More than 15,000
properties were inundated in metropolitan Brisbane [8] and some 3,600 homes evacuated.
Across Queensland approximately 12,000 people were accommodated in 34 evacuation centers
managed by the Red Cross, with a number of other official and informal evacuation centers alsoWater 2011, 3 1163
operating. Altogether over 200,000 people were affected. Approximately 3,570 business premises
were inundated, and commercial losses of approximately $4 billion were reported across the mining,
agriculture and tourism sectors. Over 19,000 kilometres of roads were damaged, around 28 percent of
the Queensland rail network damaged and three major ports significantly impacted. An estimated
28,000 homes would need to be rebuilt, while vast numbers of dwellings require extensive repairs [8].
According to the Insurance Council of Australia, almost 56,200 claims were received by insurers, with
an insured cost of $2.55 billion [27].
The community response to assist with the aftermath of the floods was tremendous: over
55,000 volunteers registered to help clean up Brisbane’s streets and homes, with thousands more
unregistered volunteers. This overwhelming community involvement was a feature of the disaster
response. Community Recovery Centres were set up in several locations, Red Cross and Lifeline
provided a full range of services on the ground and eight specialised counselling teams from the
Department of Communities were deployed across the Lockyer Valley and Toowoomba [28].
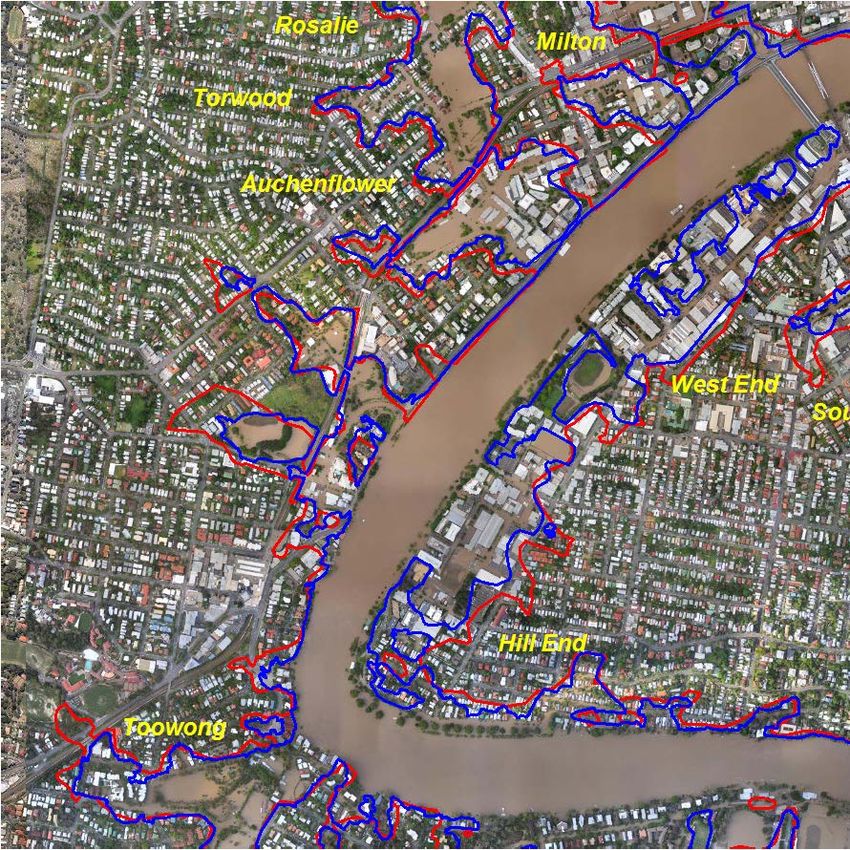
Inspection of the 2011 event shows that the extent of flooding in most areas of Brisbane City was
very similar to that observed during the 1974 flood. The aerial photographs in Figures 12 and 13
display the extent of flooding during the 2011 (blue line) event while the red line represents the flood
extent in 1974. The four images depict different parts of Brisbane City. The point here is that while there
may have been uncertainty in the Annual Return Interval of this flooding, where it flooded was
largely predictable.
Figure 12. Flood extent comparison between (a) the 2011 flooding (blue polygon) and
(b) the 1974 Brisbane flood inundation extent (red polygon). (Source: [29]).
(a)Water 2011, 3 1164
Figure 12. Cont.
(b)
Figure 13. Flood extent comparison between (a) the 2011 flooding (blue polygon) and
(b) the 1974 Brisbane flood inundation extent (red polygon). (Source: [29]).
(a)Water 2011, 3 1165
Figure 13. Cont.
(b)
7. Implications
7.1. Queensland Floods Commission of Inquiry
On Monday 17th January 2011 the Premier of Queensland, Anna Bligh, announced an independent
Commission of Inquiry to examine the flood disaster. The terms of reference provide for an
independent and thorough examination of the chain of events leading to the floods, and all aspects of
the response and the subsequent aftermath. The Commission was tasked to deliver an Interim Report in
August 2011, covering matters associated with flood preparedness to enable early recommendations to
be implemented before the next summer’s wet season. The Final Report is to be handed down by
January 2012. The Interim Report [12] summarised submissions and testimony on the:
• preparation and planning for the flooding by governments at all levels, emergency services and
the community;
• supply of essential services during the floods;
• adequacy of forecasts and early warning systems, with particular reference to Toowoomba and
the Lockyer Valley;
• compliance with, and the suitability of, dam operational procedures for safety and
flood mitigation.
A total of 175 recommendations were proposed, which were subsequently fully supported by the
Queensland Government [30].Water 2011, 3 1166
Most relevant to our study here is the Commission of Inquiry’s view that Wivenhoe Dam had been
operated according to the operations manual. Nonetheless, the Commission has recommended that the
manual be reviewed including a re-evaluation of the design hydrology using a probabilistic approach,
consideration of temporal and spatial variability in rainfall, and of the relative timings of inflows from
the dams and downstream tributaries. It was also recommended that the reliability of rainfall forecasts
and the use of weather radar be assessed and considered for decision-making. Furthermore the
recommendations called for modeling of the consequences (in terms of risk to life and safety, and
economic, social and environmental damage) of the water release strategies for a spectrum of historical,
design and synthetic flood events. This is very much in line with the authors’ view expressed earlier
about the utility of decision trees and probabilistic methods in general to improve decision making in
relation to dam releases of water during flooding situations.
The Commission also recommended that every local government with a flood risk should ensure
that, before the onset of the next wet season (i.e., before November 2011), it updates its local disaster
management plan in accordance with Queensland’s State-wide Natural Hazard Risk Assessment [31]
and the Disaster Management Act 2003. Each local disaster management plan should address local
circumstances and risks, be simple to use, and be published on the relevant local government’s
website. Training for disaster management personnel and volunteers should be provided, and
community education programs regarding inter alia flood preparations, warnings, evacuation and
emergency assistance instigated.
Matters relating to land use planning and insurance will be dealt with in the Commission of
Inquiry’s Final Report, and hearings will not be held until late in 2011. However information
contained in public submissions provides the opportunity for some a priori discussion about issues and
implications of these topics as they relate to flood risk management. We discuss these next.
7.2. Insurance Issues and Implications for Land-Use Planning
Following a natural disaster, the insurance industry plays a vital role in funding the rebuilding,
repair or replacement of damaged homes, infrastructure and assets. In recent years, the Australian
insurance industry has responded effectively to a range of natural disasters such as the Hunter Valley
storms (2007), the ‘Black Saturday’ bushfires in Victoria (2009), the Perth and Melbourne hailstorms
(2010), and Cyclone Yasi (2011) [32]. Some 88% of Australian homeowners have home and contents
policies [32] that cover damage arising from most natural perils with the exception of riverine flood.
Flash flooding, as a direct consequence of rainstorm runoff, following high intensity rainfall [33]
is covered.
For the purposes of insurance in Australia, riverine flooding is defined as the overflow from rivers
and creeks following long duration rainfall over large catchment areas, or water rising up from
flooding rivers, in contrast to water coming down from rain and storm [33]. While some insurers offer
cover for riverine flood, many currently do not, something that many policy holders discovered only
after the January 2011 floods [34,35]. Thus whilst claims by insured victims of flash flooding in
Toowoomba and the Lockyer Valley were generally settled by insurers, many residents along the
Brisbane River had claims denied. Whilst the Insurance Council of Australia has put the proportion of
denied claims at 15% [33,36], the perceived lack of performance of private insurers in assisting theWater 2011, 3 1167 recovery from the flood has led to a community backlash. Many people were unaware that they were at risk of flood (something that can and should not be blamed on insurers); others rejected flood insurance where offered because it was viewed as being prohibitively expensive [35]. To address the issue of availability and affordability of insurance for flood offered by the private insurance market to homeowners, the Natural Disaster Insurance Review (NDIR) was announced by the Assistant Treasurer in the Australian Commonwealth Government on 4th March 2011. Key discussion points include the issue of a single unified and consistent definition of “flood” for insurance purposes, and, in the context of availability and affordability of flood insurance, non-insurance and under-insurance, consumer understanding and dispute resolution, flood risk measurement and mitigation, and some aspects of government funding of natural disaster relief and recovery. Measuring flood risk by way of flood maps has been raised with the Review Panel by: • insurers, as a necessary input to enable them to assess and price flood risk; • homeowners seeking to assess their personal flood risk; and • councils as part of their planning and risk management. The Review Panel has produced an Issues Paper [33] for public discussion in which it identified two alternative models of flood insurance for the future, assuming that the status quo is no longer acceptable. Under the first model, cover for riverine flood would be automatically provided as part of home insurance policies. This would eliminate disputes about what constitutes a flood, but would significantly increase premiums for homes at risk of flooding. The second model allows a homeowner to ‘opt out’ of the flood portion of a home insurance policy. Both of these demand that high flood risk homes be identified, and the Review Panel has proposed that a discount be provided to owners of these high flood risk homes. How funding premiums for these homeowners would be achieved is an ongoing issue for discussion. In the authors view, the fundamental question that needs addressing is not the insurability of flood risk, but how best to deal with the legacy of poor land-use planning decisions that has left some home owners in locations now designated as high risk. Development in the low-lying areas along the lower Brisbane River, for example, has occurred despite the city’s history of severe flooding and has resulted in large concentrations of properties exposed (Figure 3). How to reduce this exposure to flooding should be the key policy objective. Flood risk management should aim to reduce a community’s flood risk to acceptable levels, either by reducing exposure to flooding by prudent land-use planning, or by reducing the vulnerability of people and property to flooding [3]. The legacy issues are an issue that governments and the insurance sector are now grappling with. The authors believe that nothing will change until local councils are held accountable for bad land-use planning decisions [37]. Resolving the problem is not simple, but risk-adjusted insurance premiums must form part of the solution [38]. These provide a market signal and will act to incentivise risk-reducing behaviour by all parties. One very positive initiative of the local council in Grantham, involves a land swap for flooded residents. We return to this example in later discussion. Insurance is not an alternative to risk management; it is a means of transferring the residual risk once risk management measures have been put in place. To actively contribute to flood risk management, insurance must act to reduce the number of homes at risk. The only mechanism available is to ensure that premiums reflect the real risk and thereby encourage homeowners, local councils and governments
Water 2011, 3                                                                                      1168

to undertake appropriate mitigation efforts and enact risk-informed land-use planning practices.
Government may offer premium discounts to homeowners who have already been permitted to build in
flood prone locations, but further development has to either be prevented or allowed only in a
flood-resilient manner by choice of building materials and with raised floor heights. Any such
construction must be undertaken with full disclosure of the flood risk. In discounting market
premiums, it is critical that the government not interfere with actual pricing and so distort the price
signal that can act to incentivise all parties to act to minimize risk.
   Development in high-risk areas is certainly not unique to Brisbane [39] or just with respect to flood.
Moreover, the practice of post-event handouts by government often encourages victims to rebuild in
the same way and in the same location. This was the case immediately after the February 2009 “Black
Saturday” bushfires in Victoria when the State Premier announced payments of up to $50,000 to
homeowners whose principal residence was destroyed in the conflagration [40]. This was despite the
knowledge that in the most severely affected communities of Marysville and Kinglake some 10% of
destroyed structures were physically located within bushland, and some 60% within 10 m of the
bushland boundary [41], and it having been well demonstrated that the likelihood of home survival in
such extreme fires increases with increasing separation from the bush [42]. This is an example of
government generosity not encouraging risk-reducing behaviour.
   The situation is not all negative. A very positive example of sensible land-use planning to arise out
of the 2011 flooding has occurred in the township of Grantham, devastated by flash flooding as
discussed earlier. In March 2011, Grantham township was formally declared a “reconstruction area”,
which enabled the Lockyer Valley Regional Council to fast-track a master planning process, which
was completed within four months. Part of the master plan includes relocation of residential homes
from the floodplain to higher ground outside the flood-zone for flood-impacted residents from the
townships of Grantham, Murphys Creek, Postmans Ridge, Withcott and Helidon. It is expected that 70
to 80 percent of residents formerly living on the floodplain will move into new homes from December
2011. Nowhere else in Australia are we aware of a Local Government authority assisting a
disaster-struck community in this way [43].
   Another positive signal to come out of the 2011 flooding has been a decision by the Brisbane City
Council to raise the Defined Flood Level (DFL) for rebuilding purposes using the January 2011 peak
flood level in most areas. Prior to this the flood control levels were based on the notional (modeled)
1-in-100 year flood. The new minimum habitable floor level for residential development was changed
to 500 mm above the DFL except where the existing level was higher. These specifications are now
imposed upon all new residential, industrial and commercial developments [44], and will serve to
reduce the city’s vulnerability to future flooding. Needless to say the larger floods are still possible
(Figure 3).
   It seems axiomatic that if risk-reducing behaviours are to be encouraged, then homeowners must
understand their flood risk. Similarly, it is difficult to see why insurers should offer flood cover if
information that would allow them to assess and price risk is denied them. Unfortunately, such
information is often not publically available even when flood studies by hydrologists and hydraulic
engineers have been carried out and funded by public money. A recent study of publically available
flood risk information on local government websites [45] identified that less than 50% of local
Water 2011, 3                                                                                     1169

councils provide flood risk information. Of those with a recognised flood risk, only 67% provided
flood maps online.
   Ideally insurers (and land-use planners) need modeled flood surfaces that can be interpreted to see
how flood depths vary as a function of the Annual Return Interval (ARI) at given locations. When
available, flood maps vary greatly in terms of information content with many only recording the extent
of inundation in a modeled 1-in-100 year flood. This is not a measure of risk and says nothing about
how flood damage may vary in larger floods. In the case of the Hawkesbury-Nepean River catchment,
for example, many tens of thousands of homes have been built with planning approval just beyond the
1-in-100 year flood, and the difference in the height of inundation between the 1-in-100 year flood and
the maximum possible flood is 9 m! [46]. This is a very different circumstance to some inland catchments
where the difference may only be a meter or so. Again having a uniform ARI threshold for building
approvals ignores the reality of risk, which is a function of the hazard, exposure and vulnerability.
   The primary source of flood information currently available to the insurance industry in Australia is
the National Flood Information Database (NFID), which is developed from publically-available flood
information and digital terrain maps, and which currently covers around 5.6 million individual
addresses across the country [47]. The total number of addresses in Australia is around 12 million but
many of these are not flood prone. Even so, NFID does not include every property at risk in Australia
because not all catchments have been studied, and even where this has been done not all councils will
make this information available, a situation that is most common in Queensland. In a submission to
NDIR the Insurance Council of Australia (ICA) claim that this lack of completeness is one of the key
factors limiting some insurers’ ability to provide flood insurance in certain geographic areas [36].
   The January 2011 floods have exposed the non-insurance or under-insurance of not just individual
homeowners, they have also focused attention on the Queensland government’s lack of insurance
cover for its own infrastructure. State governments in Australia have a longstanding arrangement with
the Commonwealth Government under the Natural Disaster Relief and Recovery Arrangements
(NDRRA), whereby the Federal Government fund 75% of all infrastructure reconstruction costs in the
event of a natural disaster. There is no compulsion at present for State Governments to take out
insurance cover although Queensland is the only one to opt not to purchase reinsurance for its
infrastructure assets, claiming that it was “not a value-for-money proposition” [48]. Thus
‘self-insurance’ by the State applies only to 25% of the reconstruction costs, with the Commonwealth
covering the other 75%. To offset the NDRRA costs of the January 2011 flood event, the Federal
Government will raise $1.8 billion by imposing a one-off flood levy on all Australian taxpayers with a
taxable income greater than $50,000 and who were not in receipt of a government Disaster Recovery
Payment for a flood event [49]. The impact of the flood will thus be felt by all Australians, not only
those living in southeast Queensland.

8. Conclusions

   This paper has examined the causes, impacts and some implications of the January 2011 Brisbane
flood. The period December 2010 to January 2011 coincided with a strong La Niña event, often
associated with extreme rainfall and widespread flooding in eastern Australia.
Water 2011, 3                                                                                       1170

   The flood has been termed a “dam release flood” by hydrologists appointed by the Insurance
Council of Australia. This suggests that a release of water from the Wivenhoe Dam was a principal
cause of flooding along the mainstream and tributaries of the Brisbane River downstream of the dam
over the period 11th–12th January 2011. Whilst the dam operators were acting in accordance with the
operations manual for the dam, their modeling did not take account of forecast rainfall in determining
the predicted dam water level, and this resulted in a sub-optimal water release strategy. Employing
tools for decision making under uncertainty would have resulted in a different water release strategy.
   Many insurers do not provide riverine flood insurance due to a lack of information on which to
determine and price the risk. An official Review of natural disaster insurance has proposed models to
ensure more homeowners are covered by flood insurance. We argue that the real issue is how to deal
with the legacy of past poor land use planning, which has left some home owners in locations now
designated as high risk. Insurance premiums should reflect the real flood risk of a property, and insurers
should have access to the best flood studies available on which to determine the cost of this risk.
   Nevertheless, a positive example of sensible land-use planning to arise out of the 2011 flooding
occurred in the township of Grantham. The plan drawn up after the floods includes relocation of
residential homes from the floodplain to higher ground outside the flood-zone.

References

1.   2011a Submissions; Floods Commission of Inquiry: Brisbane, QLD, Australia, 2011. Available
     online: http://www.floodcommission.qld.gov.au/submissions (accessed on 6 September 2011).
2.   Flood Warning System for the Brisbane River below Wivenhoe Dam to Brisbane City; Bureau of
     Meteorology: Melbourne, Australia, 2011. Available online: http://www.bom.gov.au/hydro/
     flood/qld/brochures/brisbane_lower/brisbane_lower.shtml#PreviousFlooding        (accessed  on
     31 March 2011).
3.   Joint Flood Taskforce. Joint Flood Taskforce Report March 2011; Report prepared for the
     Brisbane City Council, Brisbane, QLD, Australia, 2011.
4.   Known Floods in the Brisbane & Bremer River Basin, Including the Cities of Brisbane and
     Ipswich. Bureau of Meteorology: Melbourne, Australia, 2011. Available online: http://www.bom.
     gov.au/hydro/flood/qld/fld_history/brisbane_history.shtml (accessed on 1 April 2011).
5.   Brisbane Floods—January 1974. Bureau of Meteorology: Melbourne, Australia, 1974. Available
     online: http://www.bom.gov.au/hydro/flood/qld/fld_reports/brisbane_jan1974.pdf (accessed on
     31 March 2011).
6.   Crompton, R.P.; McAneney, K.J. Normalised Australian insured losses from meteorological
     hazards: 1967–2006. Environ. Sci. Policy 2008, 11, 371-378.
7.   Crompton, R.P. Risk Frontiers, Macquarie University, NSW, Australia. Personal
     communication, 2011.
8.   EMA Disasters Database; Australian Emergency Management Australia: Canberra, Australia,
     2011. Available online: http://www.disasters.ema.gov.au/Browse/Search.aspx (accessed on
     1 April 2011).
Water 2011, 3 1171
9. Frequent Heavy Rain Events in Late 2010/Early 2011 Lead to Widespread Flooding Across
Eastern Australia; Special Climate Statement 24; National Climate Centre, Bureau of
Meteorology: Melbourne, Australia, 2011.
10. SOI (Southern Oscillation Index) Archives—1876 to present. Bureau of Meteorology: Melbourne,
Australia, 2011. Available online: http://www.bom.gov.au/climate/current/soihtm1.shtml
(accessed on 31 March 2011).
11. Archive—Daily rainfall totals for Australia. Bureau of Meteorology: Melbourne, Australia, 2011.
Available online: http://www.bom.gov.au/jsp/awap/rain/archive.jsp (accessed on 31 March 2011).
12. Interim Report, 1 August 2011; Queensland Floods Commission of Inquiry: Brisbane, Australia,
2011. Available online: http://www.floodcommission.qld.gov.au/publications/interim-report
(accessed on 23 August 2011).
13. Insurance Council of Australia. Flooding in the Brisbane River Catchment, January 2011; ICA
Hydrology Panel: Sydney, Australia, 20 February 2011.
14. Manual of Operational Procedures for Flood Mitigation at Wivenhoe Dam and Somerset Dam;
Revision 7, November 2009; Seqwater: Brisbane, QLD, Australia, 2009. Available
online: http://resources.news.com.au/files/2011/01/20/1225992/005512-110121-dam-manual.pdf
(accessed on 3 May 2011).
15. Seqwater. January 2011 Flood Event: Report on the Operation of Somerset Dam and Wivenhoe
Dam; Seqwater: Brisbane, QLD, Australia, 2 March 2011.
16. The January 2011 Flood Event; Seqwater: Brisbane, QLD, Australia, 2011. Available
online: http://www.seqwater.com.au/public/sites/default/files/userfiles/Factsheet-January_2011_
FloodEvent.pdf (accessed on 3 May 2011).
17. Transcript of Proceedings; Queensland Floods Commission of Inquiry: Brisbane, QLD, Australia,
11 April 2011; pp. 77-96. Available online: http://www.floodcommission.qld.gov.au/__
data/assets/pdf_file/0018/3762/2011-04-11-QFCI-Day-2-Brisbane.pdf (accessed on 3 May 2011).
18. Ayre, R. Feasibility of Making Pre-releases from SEQWC Reservoirs; Seqwater: Brisbane, QLD,
Australia, 2001.
19. Drought situation reports (Department of Employment, Economic Development and Innovation);
Queensland Government: Brisbane, Australia, 2011. Available online: http://www.longpaddock.
qld.gov.au/queenslanddroughtmonitor/queenslanddroughtreport/index.php (accessed on 6
September 2011).
20. Raiffa, H. Decision Analysis: Introductory Readings on Choices under Uncertainty; McGraw
Hill: New York, NY, USA, 1997.
21. Krige, D.G. A Statistical Approach to Some Mine Valuations and Allied Problems at the
Witwatersrand. Master Thesis, University of Witwatersrand, Johannesburg, South Africa, 1951.
22. Matheron, G. Principles of geostatistics. Econ. Geol. 1963, 58, 1246-1266.
23. Clemen, R.T. Making Hard Decisions: An Introduction to Decision Analysis; PWS-KENT:
Boston, MA, USA, 1997.
24. Coates, L.; Haynes, K.; Gissing, A.; Radford, D. The Australian experience and the Queensland
Floods of 2010–2011. In The Handbook of Drowning: Prevention, Rescue, Treatment, 2nd ed.;
Bierens, J.J.L.M., Ed.; Springer-Verlag Publishing: Berlin, Germany, 2012; Chapter 10–17,
in press.Water 2011, 3 1172
25. O’Brien, M.J. Brisbane Flooding January 2011—An Avoidable Disaster; Queensland Floods
Commission of Inquiry: Brisbane, Australia, 20 March 2011.
26. Latest River Heights for Brisbane River at City Gauge; Station No 540198; Bureau of
Meteorology: Melbourne, Australia, 2011. Available online: http://reg.bom.gov.au/fwo/
IDQ65389/IDQ65389.540198.tbl.shtml (accessed on 1 November 2011).
27. Historical and Current Disaster Statistics; Insurance Council of Australia: Sydney, Australia,
2011. Available online: http://www.insurancecouncil.com.au/Default.aspx?tabid=1572 (accessed
on 23 August 2011).
28. Flood Assistance; Lockyer Valley Regional Council: Gatton, Australia, 2011. Available online:
http://www.lockyervalley.qld.gov.au/news-events/news/1270-lockyer-valley-road-closures-271210
(accessed on 9 September 2011).
29. Chen, K. Risk Frontiers; NearMap Pty Ltd.: West Perth, Australia, 2011. Available online:
http://www.nearmap.com (accessed on 1 November 2011).
30. Queensland Government Response to the Floods Commission of Inquiry Interim Report;
Queensland Government: Brisbane, Australia, 2011. Available online at http://www.premiers.
qld.gov.au/publications/categories/reports/assets/response-to-flood-inquiry.pdf (accessed on 23
August 2011).
31. Risk Frontiers. State-Wide Natural Hazard Risk Assessment; Report prepared for Queensland
Department of Community Safety: Brisbane, QLD, Australia, 2011.
32. Insurance in Australia; Australian Trade Commission: Canberra, Australia, 2009.
33. Natural Disaster Insurance Review. Inquiry into Flood Insurance and Related Matters;
Commonwealth of Australia: Canberra, Australia, 2011. Available online: http://www.ndir.gov.
au/content/issuespapers/NDIRIssuesPaper.pdf (accessed on 23 August 2011).
34. Johnston, E.; Needham, K.; Tovey, J. Insurers Say no to Brisbane; Brisbane Times: Brisbane,
Australia, 21 January 2011. Available online: http://www.brisbanetimes.com.au/environment/
weather/insurers-say-no-to-brisbane-20110120-19y3m.html (accessed on 23 August 2011).
35. Williams, R. Victims Discover Insurance doesn’t always Cover Flooding; Sydney Morning Herald:
Sydney, Australia, 16 January 2011. Available online: http://www.smh.com.au/small-
business/managing/victims-discover-insurance-doesnt-always-cover-flooding-20110117-19t31.html
(accessed on 20 September 2011).
36. Insurance Council of Australia Response to the Natural Disaster Insurance Review; Insurance
Council of Australia: Sydney, Australia, July 2011. Available online: http://www.ndir.gov.au/
content/submissions/issues_paper_submissions/Insurance_Council_of_Australia.pdf (accessed on
12 October 2011).
37. Burby, R.J. Hurricane Katrina and the paradoxes of government disaster policy: Bringing about
wise government decisions for hazardous areas. Ann. Am. Acad. Polit. Soc. Sci. 2006, 604, 171-191.
38. Roche, K.M.; McAneney, K.J.; van den Honert, R.C. Policy options for managing flood
insurance. Environ. Hazards 2010, 9, 369-378.
39. Crompton, R.P.; McAneney, K.J. Normalised Australian insured losses from meteorological
hazards: 1967–2006. Environ. Sci. Policy 2008, 11, 371-378.You can also read