Taupo District Flood Hazard Study - TONGARIRO RIVER - Advocates for the ...
←
→
Page content transcription
If your browser does not render page correctly, please read the page content below
Taupo District Flood Hazard Study

TONGARIRO RIVER
Taupo District Flood Hazard Study

                      TONGARIRO RIVER

                      For:    Environment Waikato and Taupo District Council

                              July 2011

Prepared by                                           Opus International Consultants Limited
               Franciscus Maas & Dr Jack McConchie    Environmental
                                                      Level 9, Majestic Centre, 100 Willis Street
                                                      PO Box 12 003, Wellington 6144,
                                                      New Zealand

Reviewed by                                           Telephone:      +64 4 471 7000
               Dr Jack McConchie                      Facsimile:      +64 4 499 3699

                                                      Date:           July 2011
                                                      Reference:      39C125.N4
                                                      Status:         Final A

© Opus International Consultants Limited 2011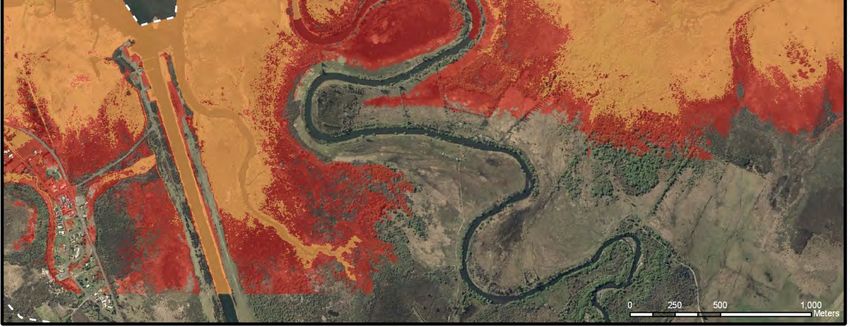
Taupo District Flood Hazard Study - Tongariro River

                                                                Contents

1       Overview............................................................................................................................... 1
        1.1 Purpose ........................................................................................................................ 1

2       Tongariro catchment ........................................................................................................... 1
        2.1 Description of the Tongariro catchment ........................................................................ 1
        2.2 Study area .................................................................................................................. 11

3       Flow regime of the Tongariro River .................................................................................. 12
        3.1 Tongariro River @ Turangi ......................................................................................... 12
        3.2 Stationarity.................................................................................................................. 12
        3.3 Flow characteristics .................................................................................................... 13
        3.4 29 February 2004 flood ............................................................................................... 16
        3.5 Flood protection .......................................................................................................... 18
        3.6 Flood modelling .......................................................................................................... 19
        3.7 Channel stability ......................................................................................................... 20
        3.8 Flood frequency analysis ............................................................................................ 21
        3.9 Flood extent ................................................................................................................ 22
        3.10 Potential effects of land use change ........................................................................... 23
        3.11 Potential effects of climate change.............................................................................. 25

4       Other factors that affect flooding ..................................................................................... 28
        4.1 Sediment transport ..................................................................................................... 28
        4.2 Lake level ................................................................................................................... 29
        4.3 Tectonic deformation .................................................................................................. 29
        4.4 Waves ........................................................................................................................ 32
        4.5 Summary of lake effects ............................................................................................. 34

5       Flood risk ........................................................................................................................... 35

6       MIKE21 flood model........................................................................................................... 36
        6.1 Previous flood modelling ............................................................................................. 36
        6.2 Methodology ............................................................................................................... 37
        6.3 Model calibration – February 2004 flood event............................................................ 37

7       Flood prediction ................................................................................................................. 39
        7.1 Description of scenarios modelled .............................................................................. 39
        7.2 Flood inundation maps................................................................................................ 39
        7.3 Maximum velocity maps.............................................................................................. 42

8       Impact of flood hydrograph .............................................................................................. 43
        8.1 Background ................................................................................................................ 43
        8.2 Nature of Tongariro River under flood conditions ........................................................ 43
        8.3 Effect of varying the upstream boundary ..................................................................... 44

39C125.N4

July 2011                                                              i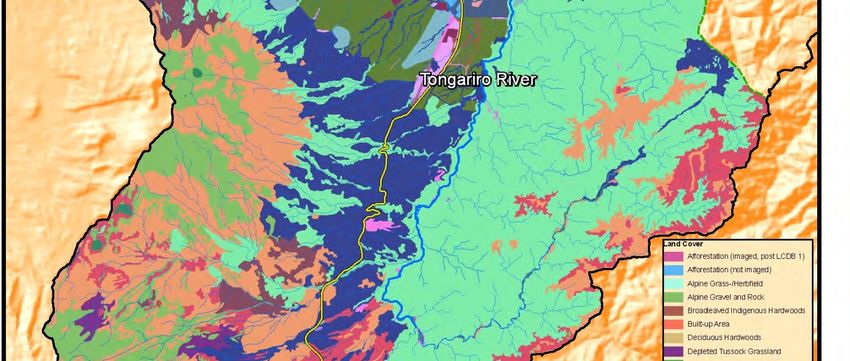
Taupo District Flood Hazard Study - Tongariro River

        8.4     Conclusion .................................................................................................................. 46

9       Effect of lake level.............................................................................................................. 47
        9.1 Context ....................................................................................................................... 47
        9.2 Example...................................................................................................................... 48

10      River flood hazard classification ...................................................................................... 49
        10.1 Introduction ................................................................................................................. 49
        10.2 Significance to people and property ............................................................................ 49
        10.3 Flood hazard assessment ........................................................................................... 51
        10.4 Summary .................................................................................................................... 55

11      Conclusion ......................................................................................................................... 55
        11.1 The river flood hazard ................................................................................................. 56
        11.2 The combined flood hazard......................................................................................... 56
        11.3 Area affected .............................................................................................................. 56
        11.4 Uncertainty ................................................................................................................. 57

12      References ......................................................................................................................... 58

13      Glossary ............................................................................................................................. 59

39C125.N4

July 2011                                                              ii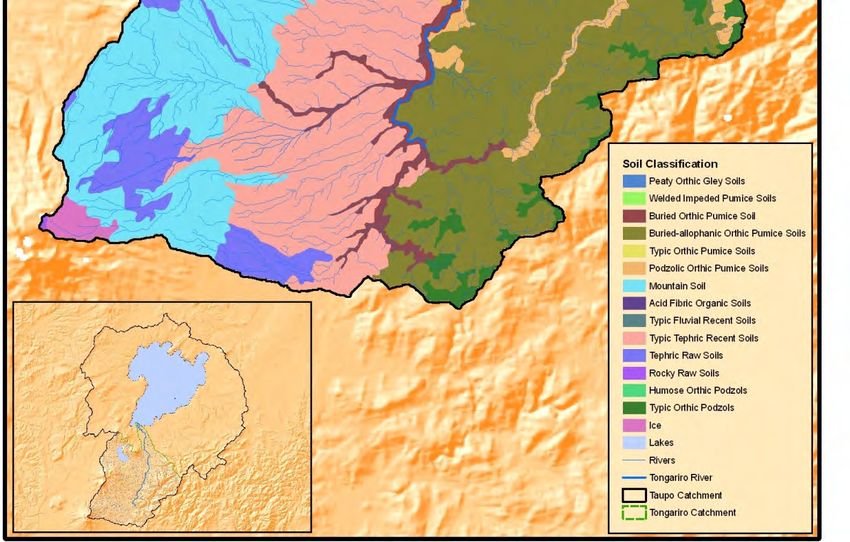
Taupo District Flood Hazard Study - Tongariro River
1 Overview
1.1 Purpose
Under the Resource Management Act (1991) Regional Councils and other territorial
authorities are required to develop provisions that avoid or mitigate the effects of natural
hazards. Areas near Lake Taupo are vulnerable to flooding, particularly over the longer
term, as a result of large inflows, high lake levels, big waves, and the topography and
geology of the surrounding area. Major tributaries to the lake also pose a flood risk which
can be exacerbated when high lake levels impede flood drainage. Environment Waikato and
the Taupo District Council are therefore investigating the flood risk so that they can monitor
and manage this hazard (Environment Waikato, 2005).
This study has been prompted by:
Environment Waikato and the Taupo District Council being required, under sections 30
and 31 of the Resource Management Act (1991), to avoid and mitigate the effects of
natural hazards;
Section 35 of the Resource Management Act (1991) that requires Councils to monitor
the environment, and maintain records of natural hazards;
The need to provide definition, justification, description, and interpretation of the flood
hazard area rules in the District Plan;
Central Government’s review of flood management in New Zealand; and
Environment Waikato’s Project Watershed which aims to address flood protection, soil
conservation, and river management in the Waikato River catchment.
The primary objective of this phase of the Taupo District Flood Hazard Study was to assess
the flood risk posed by the Tongariro River. Of particular concern is the flood risk
downstream of Poutu Pool, past Turangi, and across the Tongariro delta. The flood risk
assessment is based on a comprehensive hydrometric analysis of catchment runoff
processes and the results from a two-dimensional computational hydraulic model.
2 Tongariro catchment
2.1 Description of the Tongariro catchment
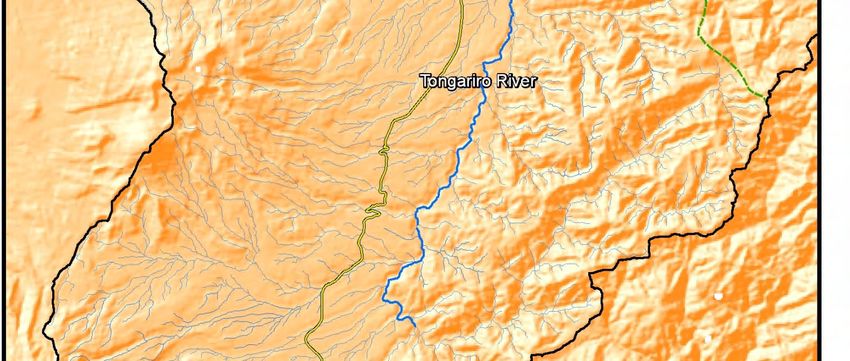
The Tongariro catchment drains the eastern slopes of Mts Tongariro, Ngauruhoe, and
Ruapehu. The catchment also extends into the Kaimanawa Ranges and across the volcanic
ring plain that exhibits mixed geology. The catchment contains a number of major tributaries
including Waihohonu Stream, the Waipakihi River, and Poutu Stream (Figure 2.1).
39C125.N4
July 2011 1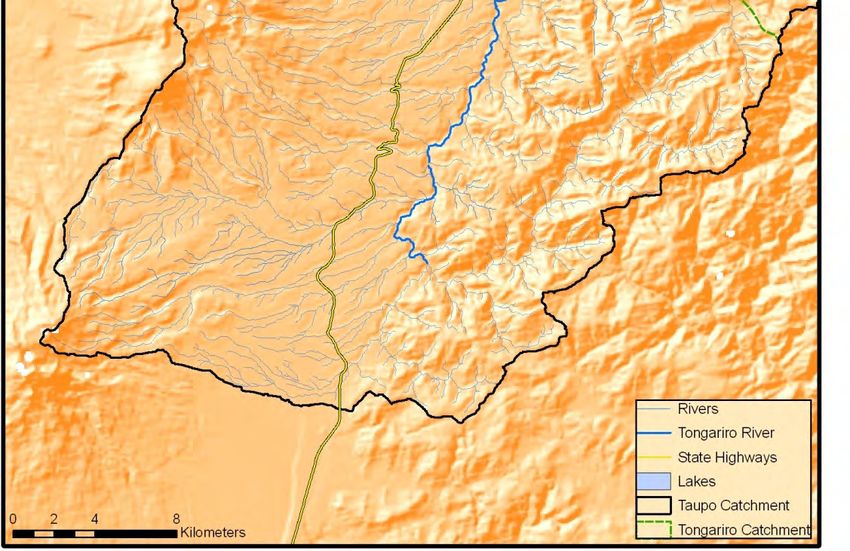
Taupo District Flood Hazard Study - Tongariro River

        Hydro-power development has altered the natural flow regime of the Tongariro River. Flows
        are augmented with water from the Moawhango River, via the Moawhango tunnel. Flows
        have also been diverted from the Tongariro River: to Lake Rotoaira via the Poutu tunnel and
        canal since 1973; and at Rangipo Dam to the Rangipo power station since 1983. Flows are
        returned from Lake Rotoaira to Lake Taupo through the Tokaanu Power Station (Figure 2.2).

        Figure 2.1:   Location of the Tongariro River.

39C125.N4

July 2011                                          2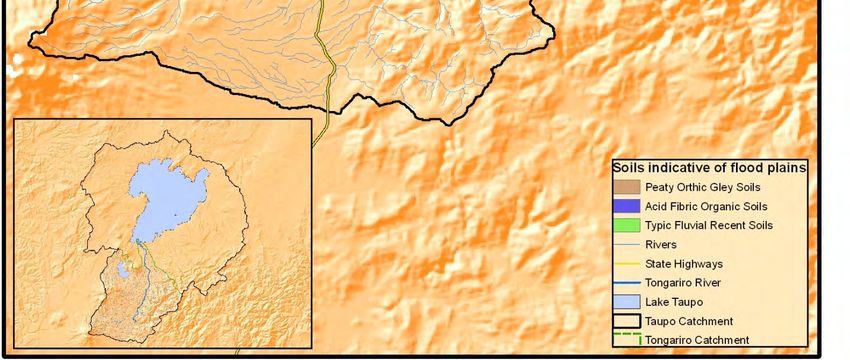
Taupo District Flood Hazard Study - Tongariro River
Poutu Pool
(upper limit of this
study)
Figure 2.2: Tongariro River catchment and power scheme (Davenport et al. 1988).
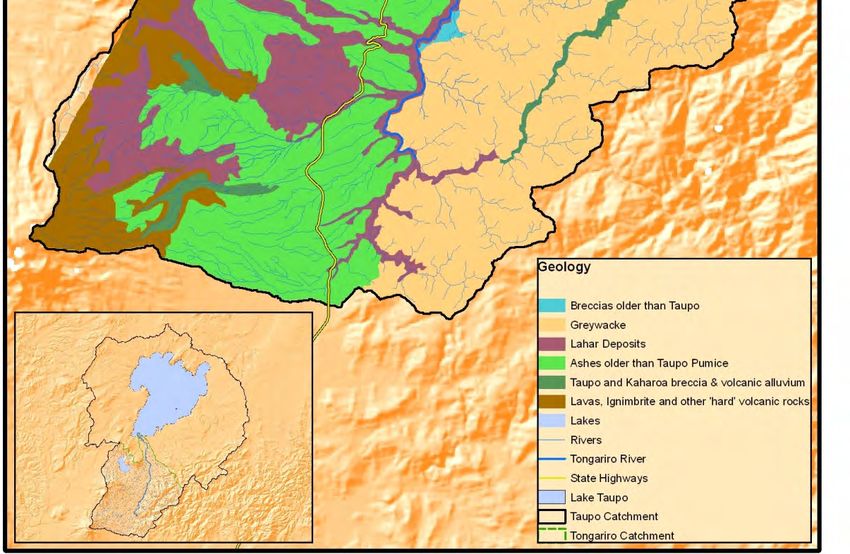
The western side of the Tongariro catchment is comprised of young volcanic rock (andesite,
dacite, and rhyolite) and soft and unconsolidated volcanic deposits of pumice and breccia
erupted from the Ruapehu, Tongariro, Taupo, and Okataina volcanic centres (Hancox, 2002)
(Figure 2.3). These porous volcanic soils and underlying lithology absorb the majority of any
storm rainfall with only about 10% appearing as storm runoff. Most of the rainfall (~90%)
recharges the soil moisture and groundwater. This tends to reduce any potential flood peak
while increasing the more general baseflow (Hancox, 2002). Flood events, however, can still
be significant because of the high rainfall totals and intensities and steep slopes.
The geology of the Kaimanawa Ranges in the east is basement rock, mainly indurated
greywacke and argillite (Hancox, 2002). Greywacke, that underlies 28% of the catchment, is
39C125.N4
July 2011 3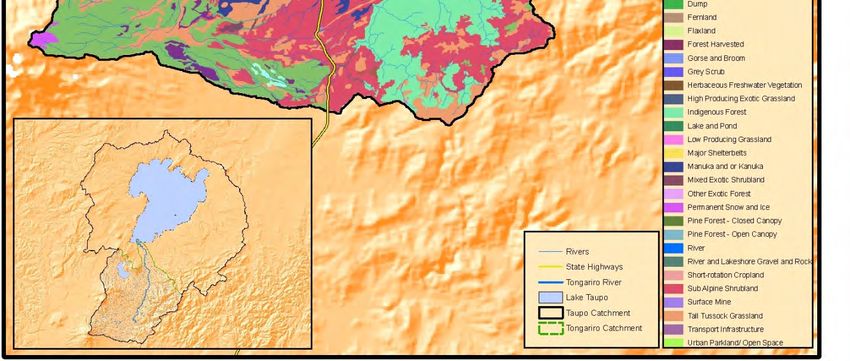
Taupo District Flood Hazard Study - Tongariro River

        non-porous and relatively impermeable. Catchments within this material tend to respond
        rapidly to rainfall events creating storm hydrographs with distinct, relatively short and sharp
        flood peaks. Baseflows tend to be low because of the limited potential for groundwater
        storage.

        Figure 2.3:   Catchment geology of the Tongariro River.

        The soils on the slopes in the west of the catchment are very young and poorly developed.
        They also tend to be very shallow. Therefore although the soils are generally quite porous,
        their shallow depth reduces their moisture holding capacity. During prolonged or heavy

39C125.N4

July 2011                                           4
Taupo District Flood Hazard Study - Tongariro River
rainfall events these soils quickly become saturated with water then running off rapidly into
the Tongariro River.
Within the Kaimanawa Ranges the soils are better developed because of the extensive
vegetation cover. However, they are still relatively thin because of the steep slopes. These
soils also become saturated quickly, providing rapid runoff to the rivers and streams draining
to the Tongariro River (Figure 2.4).
Figure 2.4: Soils of the Tongariro catchment.
39C125.N4
July 2011 5Taupo District Flood Hazard Study - Tongariro River
Erosion is common in the upper Tongariro catchment because of the soft unconsolidated
nature of the volcanic deposits, steep slopes, and high rainfall. This provides a large volume
of material that is available to be transported downslope and into the river system. The steep
terrain of the upper catchment allows the river to transport most of this sediment
downstream. The Tongariro River consequently carries a high sediment load. On average,
approximately 11,700 tons of gravel and larger sized sediment is carried past Turangi each
year. Ten times this amount of finer-sized material, including sand, is transported
downstream (Smart, 2005). In the lower catchment the channel slope decreases, reducing
the flow velocity. As a result, the energy of the river decreases reducing its ability to
transport sediment. Consequently, a considerable volume of material is deposited in the
channel and on the floodplain adjacent to the lower reaches of the Tongariro River.
As sediment is deposited in the lower reaches of the river (Turangi area) the riverbed builds
up (aggrades). This reduces the capacity of the channel to contain flood flows. During large
flood events the river can break out of its channel with flood waters then taking the lowest
path to the lake. The wide floodplain, and extensive Tongariro delta where the river
discharges into Lake Taupo, have formed from the river periodically changing its course in
this manner. Sedimentation can be greater when the lake level is high as the river slope,
and hence the energy to transport sediment, decreases. Likewise, sedimentation within the
channel may be reduced when the lake level is lower because of increased energy through
the lower reaches of the river.
Changes to the river channel, and aggradation of the delta, can be caused by both natural
and anthropogenic processes. Floods, eruptions and tectonic uplift can increase the
sediment supply to the river. Gravel extraction, as occurred from the 1960’s to early 1980’s,
reduced aggradation and stabilised the river channel between Turangi and the delta mouth
(Smart, 2005). Tectonic subsidence and the compaction of sediments in this location are
also reducing the ground level and therefore the slope of the river. These processes are
likely to be increasing aggradation.
Impeded drainage of the Tongariro River caused by subsidence of the delta, combined with
mid to high lake levels, can also cause a backwater effect. This reduces the flow gradients
even further, and may potentially affect the flood risk to the surrounding area. Significant
flood protection and river management works have taken place in recent years to reduce the
flood risk along the lower reaches of the river.
The alluvial deposits throughout the lower valley of the Tongariro River and across the delta
indicate a significant and extensive flood history. They also provide evidence as to the
potential extent of the flood hazard (Figure 2.4).
Much of the Tongariro catchment is under some kind of forest cover. This includes:
indigenous native forest (~44%) within the Tongariro National Park and Kaimanawa Forest
Park, managed by the Department of Conservation; and exotic plantation forestry (~10%).
Urban land uses and the development of infrastructure increase in density on the lower
39C125.N4
July 2011 6Taupo District Flood Hazard Study - Tongariro River
floodplain. This development and capital investment is at risk from significant flood events
(Figure 2.5). Land use within the catchment is summarised in Table 2.1 and Figure 2.6.
Figure 2.4: Flood deposits of the lower Tongariro River.
39C125.N4
July 2011 7Taupo District Flood Hazard Study - Tongariro River
Figure 2.5: Land use and vegetation cover within the Tongariro catchment.
39C125.N4
July 2011 8Taupo District Flood Hazard Study - Tongariro River
Table 2.1: Tongariro River catchment – land use.
Land use Percentage
Lakes and ponds 2.3%
High producing exotic grassland 3.1%
Indigenous forest 34.5%
Broadleaved indigenous hardwoods 1.0%
Forest harvested 2.1%
Pine forest - Open canopy 1.3%
Pine forest - Closed canopy 6.2%
Manuka and/or kanuka 11.6%
Mixed exotic shrubland 2.5%
Sub alpine shrubland 7.4%
Tall tussock grassland 13.6%
Alpine gravel and rock 8.6%
Total 94.3%
Note: Only those land use classes occupying more than 1% of the catchment are included in the above table.
40
30
20
10
0
ds
d
k
d
st
y
nd
py
nd
ka
nd
d
oc
te
an
op
oo
re
an
no
nu
la
Po
la
es
R
bl
Fo
an
dw
bl
ss
ss
Ca
Ka
ru
rv
nd
ru
d
C
a
ar
ra
us
Ha
an
Sh
r
la
Sh
or
n
G
d
G
H
no
pe
se
ve
ke
t
e
k
d
us
c
es
ic
ge
n
oc
lo
an
-O
i
La
ra
ot
ot
pi
no
r
-C
di
Fo
ss
G
Ex
Ex
Al
a
ge
st
In
uk
Tu
ne
st
b
re
g
d
di
Su
an
in
re
ixe
pi
Fo
ll
In
Ta
uc
Fo
Al
M
M
d
ne
od
ve
ne
Pi
Pr
ea
Pi
h
dl
g
oa
Hi
Br
Figure 2.6: Distribution of major land uses (%) within the Tongariro catchment.
39C125.N4
July 2011 9Taupo District Flood Hazard Study - Tongariro River
The Tongariro catchment has a very steep rainfall gradient. The mean annual rainfall in the
headwaters, the area likely to produce the greatest runoff, reaches 4300mm on Mt Ruapehu
(2800masl) and about 2800mm in the Kaimanawa Ranges (1600masl). Rainfall then
decreases rapidly with altitude to be only approximately 1300mm at Lake Taupo. Those
areas which experience the highest annual rainfall are also likely to experience the greatest
rainfall intensities. Runoff from these areas therefore has a critical affect on the flood
magnitude and risk in the lower catchment.
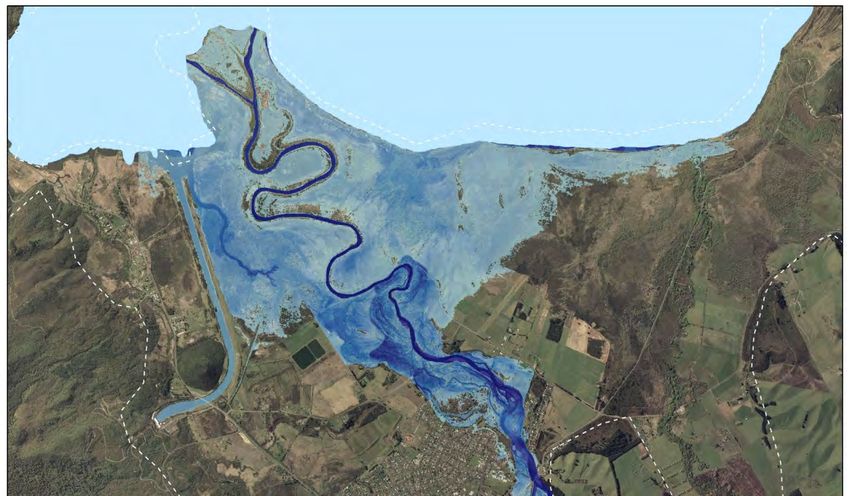
The flood risk to the lower Tongariro valley is exacerbated by the difference in slope angle
between the upper and lower portions of the catchment. Those areas of the catchment that
experience the greatest rainfall are also those with the steepest slopes (Figure 2.7). The thin
permeable soil in these areas means that any water runs off rapidly, and is quickly
concentrated in the Tongariro River. The steep gradient of the river channels in these areas
also means that the water flows much more quickly than it can across the lower floodplain.
As a result, flood waters spread out across the floodplain in the lower valley. This problem is
compounded in the Tongariro River because the catchment behalves rather like a funnel.
Runoff from the extensive upper catchment is channelled onto, and across, the relatively
narrow and flat floodplain to Lake Taupo (Figure 2.7).
Figure 2.7: Slope within the Tongariro catchment.
39C125.N4
July 2011 10Taupo District Flood Hazard Study - Tongariro River
Consequently, there are a number of physical characteristics of the Tongariro catchment that
predispose the lower valley to having a high inherent flood risk. There are also a number of
constraints affecting the lower valley which make it difficult to mitigate this flood risk.
2.2 Study area
The greatest flood hazard within the Tongariro catchment exists on the floodplain and delta
of the lower valley. The river flows between relatively low banks composed of easily erodible
material. This is also the area with the greatest capital investment, and density of people
and infrastructure. The focus of this flood study is therefore the area downstream of Poutu
Pool (Figure 2.8).
Tongariro @ Turangi
Poutu Pool
Figure 2.8: Tongariro River study area (1:50,000 map series, sheet T19, 1994).
39C125.N4
July 2011 11Taupo District Flood Hazard Study - Tongariro River
3 Flow regime of the Tongariro River
3.1 Tongariro River @ Turangi
Flows of the Tongariro River have been continuously recorded since January 1957 by a
gauge located at Turangi (Figure 3.1). There are a number of other recorder sites within the
catchment, but the one at Turangi has the longest record and is the furthest downstream.
There are no significant tributaries downstream of this recorder site. This site, which records
the flow from a catchment of approximately 772km2, therefore provides accurate estimates of
flows that could potentially affect the lower valley and floodplain. The flow record from this
site at Turangi therefore provides a robust measure of the flood magnitude and frequency
history of the lower catchment.
1600
1400
1200
1000
Discharge (m³/s)
800
600
400
200
0
1958 1968 1978 1988 1998 2008
Tongariro River at Turangi 1-Jan-1957 06:00:00 to 20-Apr-2010 08:00:00
Figure 3.1: Flow record for the Tongariro River @ Turangi.
3.2 Stationarity
Stationarity is a key assumption in all frequency analyses, including those used in this study.
Stationarity implies (and it is therefore assumed) that the annual maxima or minima used in
the analysis exhibit no trends or cycles; and that these extremes are drawn randomly and
independently from a single statistical distribution. Implicit in this assumption is that the same
processes and relationships that existed in the past will continue to apply in the future. For
example, the relationship between rainfall and runoff during particular events will be the
same. However, should anything change this relationship e.g., climate or land use change,
then stationarity may no longer apply. When this occurs, the reliability of the frequency
analysis, and any derived design storm events, may be questioned.
39C125.N4
July 2011 12Taupo District Flood Hazard Study - Tongariro River
Longer records have a greater likelihood of containing information relating to extreme events.
Such records also tend to smooth any errors and other ‘noise’ in a data set. However, they
also increase the chance of violating the basic rule of stationarity. Longer records have the
potential to be more affected by land use, climate, or other changes.
The flow record shown in Figure 3.1 shows no evidence of either cyclic behaviour (other than
annual) or trends over time. Stationarity of the rainfall-runoff relationship and the resulting
flow record has therefore been assumed.
3.3 Flow characteristics
Overall the flow record for the Tongariro River at Turangi appears to be of high quality,
containing a complete record of all the major flood events since 1957.
Although there appears to have been a period of reduced flood activity between 1966 and
1996, the flow record shows a relatively consistent annual pattern of flow variation. This flow
record (Figure 3.1) therefore provides a reliable and robust set of data for analysis.
The summary of flow statistics (Table 3.1 and Figure 3.2) show that the Tongariro River is
characterised by long periods of relatively low flow, interspersed with short duration but high
magnitude flood events. The significance of these flood events on the summary statistics is
that the mean flow is approximately 30% higher than the median.
Table 3.1: Summary of flow statistics for the Tongariro River @ Turangi (m3/s) January
1957-April 2010.
Standard Coefficient of
Site Minimum Mean Median Maximum
deviation variation
Tongariro
13.97 38.67 29.52 1470 28.06 0.725
@ Turangi
Table 3.2 lists the largest flood event in each year of record. It should be noted that in some
years e.g., 2005, 1992, and 1981 the biggest recorded flood was a relatively small event. In
these years the biggest flood recorded was less than 10% of the largest flood on record i.e.,
1958 with a flood of 1470m3/s.
This variability of annual flood events highlights a major difficulty when attempting to predict
the magnitude of floods which can be expected over a particular period of time. Since the
distribution of floods is essentially random in time, the use of different lengths of flow record
can lead to significantly different estimates of the frequency and magnitude of particular flood
events. The addition of period of record which contain few large floods will reduce the
expected magnitude of extreme events; and any large events in the record will be predicted
to occur less often i.e., what was a 50-year event might appear to become a 100-year event.
Likewise, the addition of periods of record which contain a number of large flood events will
increase the apparent magnitude of extreme events; and any large flood events in the record
39C125.N4
July 2011 13Taupo District Flood Hazard Study - Tongariro River
will be predicted to occur more often i.e., a 100-year event might appear to become the 50-
year event.
Figure 3.2: Flow duration curve for the Tongariro River @ Turangi (1957-2010).
Table 3.2: Annual maximum flows recorded at Tongariro River @ Turangi (1957-2010).
Flow Flow Flow
Rank Year Rank Year Rank Year
(m3/s) (m3/s) (m3/s)
1 1958 1470 19 1978 441 37 1963 306
2 2004 1442 20 1994 439 38 1960 294
3 1964 1038 21 1993 436 39 1961 287
4 1998 913 22 1972 427 40 1988 282
5 1986 810 23 1991 417 41 1987 272
6 1967 774 24 1982 406 42 1957 270
7 2003 725 25 2009 398 43 1959 257
8 1995 718 26 2006 397 44 1975 255
9 2000 670 27 1971 391 45 1985 254
10 1999 667 28 1977 387 46 1980 249
11 1990 653 29 1962 352 47 1973 229
12 1965 563 30 1974 332 48 1983 211
13 2008 546 31 2002 329 49 2007 202
14 2001 504 32 1996 322 50 1984 166
15 1989 494 33 1979 321 51 1981 148
16 1976 466 34 1968 316 52 1992 132
17 1970 462 35 1969 311 53 2005 128
18 1966 442 36 1997 309 54 2010* 37
Note: 2010 only includes data up until April.
39C125.N4
July 2011 14Taupo District Flood Hazard Study - Tongariro River
The flow record used in the current study extends from January 1957 until April 2010. Flood
frequency and magntude estimates derived using this record may be different to those
obtained using different periods of record.
Figure 3.3 shows the flood hydrograph for the second largest flow on record i.e., 29 February
2004. This flood was chosen for analysis because there is also a good record of rainfall for
the event. This is not the case for the 1958 flood when no rainfall data were recorded. This
hydrograph highlights a number of features of flood events in the Tongariro catchment. In
general, it takes rainfall events of approximately 36 hours duration to generate a significant
flood in this catchment. While this storm event produced a very high peak discharge, the
flood peak lasted for only a relatively short time.
It is also apparent that during the flood peak the hydrograph was very irregular. This is likely
caused by erosion of the bed and mobilisation of sediment within the channel, which
changed the river cross section (on which the estimates of flow are based), rather than rapid
changes in the actual amount of water in the river.
High intensity rainfall events in general produce sharp, short duration flood peaks which
usually pose the greatest risk of causing flooding. Longer duration rainfall events tend to
produce more sustained flows, but usually with a lower peak discharge. Also, once the
catchment has been ‘wetted up’ i.e., all the storage is full, the river responds rapidly and
sharply to any additional rainfall. The flood peak may actually be higher for less rainfall in
this situation.
Figure 3.3: Flood hydrograph of the second largest flow on record (Rainfall is in mm/hour).
39C125.N4
July 2011 15Taupo District Flood Hazard Study - Tongariro River
Despite the variability of specific storms, there is a high degree of similarity in flood response
in the Tongariro River. Figure 3.4 compares the 2004 flood hydrograph with that from the
1958 storm. It should be noted that the peak discharges were very similar, but the 1958
flood contained three peaks and sustained higher flows for a much longer period of time.
The flood risk of a particular event is a function of both the magnitude of the peak, and the
duration of high flows. As a result, the 1958 event posed a significantly greater risk than the
2004 flood. Given the lower population and capital investment on the floodplain at the time,
however, the cost of the 1958 flood is likely to have been significantly less than caused by
the 2004 event even though the flood was bigger.
1600
1400
1200
Feb-58 Feb-04
1000
Discharge (m³/s)
800
600
400
200
0
0 500 1000 1500 2000 2500 3000 3500 4000
Minutes
Figure 3.4: Comparison of the two largest floods on record i.e., 1958 (largest) and 2004.
Analysis of a series of flood hydrographs for the Tongariro River indicate a relatively
consistent pattern of response. Rainstorm durations leading to significant flood events are
usually over 36 hours in duration. The resulting floods typically have one major peak, and
the body of the flood lasts for about 24 hours. These findings are consistent with those
presented in Tonkin & Taylor (2004).
3.4 29 February 2004 flood
The 29 February 2004 flood was the second largest flood recorded on the Tongariro River,
only slightly smaller than that of February 1958. This event resulted in the flooding of
houses, significant property damage, and some dramatic changes in river morphology and
channel position.
February 2004 was a very wet month, particularly in the Tongariro catchment and the Taupo
basin. Some rainfall stations received up to 480% of their usual monthly rainfall. The 36-
hour rainfall totals resulting in this flood event were particularly high on the western side of
the catchment. Rainfall totals in this area were up to 289mm (Mangatoetoe); approximately
39C125.N4
July 2011 16Taupo District Flood Hazard Study - Tongariro River
twice the total monthly rainfall in just 36 hours. Peak rainfall intensities were not particularly
high (23.5mm/hr) but the rainfall was persistent with intensities of 7mm/hr or greater for 20
hours (Bowler, 2004).
The peak flow estimated at Turangi was approximately 1420m3/s. This is only slightly less
than the peak flow in 1958 (i.e. 1470m3/s). From a planning and management perspective,
the 2004 flood peak was 36% higher than the next largest flood in the instrumental record
(1038m3/s in 1964).
Prior to the 2004 flood, the return period for an event of this magnitude was estimated at
approximately 1 in a 100 years. Given that there were then two events of this magnitude in
the previous 50 years, the return periods were revised after the 2004 event. The 2004 flood
was subsequently thought to be a 1 in 55-year event, and the 1958 flood a 1 in 60-year
event. These flood estimates have been revised again in 2010 using an additional six years
of flow data. The relative lack of flood activity over this 6-year period has led to a reduction
in the magnitude of specific design floods. For example, the 100-year event estimated in
2010 is 1451m³/s; the 1958 flood becoming a 107-year event and the 2004 flood becoming a
97-year event.
The 2004 flood took approximately 2 hours to travel the 35km from the Waipakihi confluence
to Turangi. Therefore, the flood wave was travelling at almost 5m/s which is high enough to
keep boulders up to 400 mm in motion (Bowler, 2004).
The main residential areas affected by flooding were houses down Herekiekie St, Hirangi Rd,
Awamate Rd, the river end of Koura and Poto Sts, Bridge Lodge, Tongariro Lodge, and farm
land on both sides of the delta (Figure 3.5). On Herekiekie St, up to 90 persons were
evacuated and at least one house was subsequently condemned (Bowler, 2004).
A flood of this magnitude has the ability to erode and transport large amounts of material. As
a result, significant changes to the form and position of the river are to be expected. The
most dramatic change was in an area known as the Breakaway Pool. Here the river created
a new channel through what was previously a heavily vegetated island. While this new
channel had been developing slowly during previous flood events, the river permanently
changed its course during the 2004 flood. This change did not just affect the position of the
river. The new channel is approximately 30% shorter than the old, and therefore the gradient
of the river has steepened. This has increased the velocity of flow which has also increased
the river’s ability to erode and transport material.
Bed degradation was common during the 2004 flood. The high flows during the event moved
much of the lose material down stream. This material is likely to have been deposited on
the Tongariro delta where river gradients and velocities decrease. Environment Waikato
estimate that as much as 150,000m3 of material may have been deposited downstream of
the State Highway Bridge. This is consistent with the amount of bed degradation observed
up stream where bed levels dropped by 300-500mm (Bowler, 2004).
39C125.N4
July 2011 17Taupo District Flood Hazard Study - Tongariro River
Figure 3.5: Area affected by the February 2004 flood event in the lower river (Bowler, 2004).
The instability of the lower reaches of the channel are indicative of potential future changes.
It appears that the overflow channels down towards the river mouth (across Grace Rd to
Stump Bay and across Awamate Rd towards Deep Stream) have become more established
following the 2004 flood. Recent observations at Awamate Rd show that even during quite
low flows (around 40m3/s) water is flowing from the main Tongariro River channel towards
Deep Stream. It is possible that during the next large flood the Tongariro River may move
from its present course and cut a new channel to Lake Taupo (Bowler, 2004).
3.5 Flood protection
To mitigate the flood risk on the lower floodplain an extensive programme of works has been
undertaken. This has included the construction of stopbanks, the provision of bank
protection, the removal of riparian willow, and channel modifications. This protection is
designed to protect those areas at greatest risk, often with high capital investment, from the
100-year flood event.
Considerable annual maintenance is required to ensure that the flood protection scheme
operates to the levels for which it was designed.
39C125.N4
July 2011 18Taupo District Flood Hazard Study - Tongariro River
3.6 Flood modelling
Tonkin and Taylor (2004) have undertaken a number of hydraulic modelling studies of the
Tongariro River as part of river management investigations. Modelling of the 100-year flood
levels in the lower Tongariro was undertaken in 1997, 2001, and 2004 using a one-
dimensional MIKE 11 hydraulic model.
Prior to the current study, the latest modelling of the lower Tongariro was carried out using
design flows of 1500 and 1700m3/s. Upstream of the SH1 bridge the 2001 model produces
higher water levels than the 2004 model. Downstream of the bridge, the 2004 model results
are generally higher. These results reflect the changes in river bed levels, and consequently
the channel cross sections, caused by movement of bed material during the 2004 flood. As
discussed above, this event tended to erode the channel upstream of the bridge (i.e., this
increased the channel capacity) and deposited material downstream (i.e., this decreased the
channel capacity). The use of a design flow of 1700m3/s produced very similar results to a
flow of 1500m3/s, with a maximum increase in water level of only 0.35m. Overall, the
increase in flow creates the greater rise in water level in the upper part of the model (i.e.,
upstream of the SH1 bridge). As would be expected, given the less confined nature of the
river channel below the SH1 bridge, the increase in water level over that experienced during
a 1500m3/s flow event gradually decreases down the river.
The results of this modelling has indicated those areas in which stop-bank crests need to be
raised, and those where the current design is appropriate to manage the estimated 100-year
event. Figure 3.6 shows the approximate limit of the area likely to be affected by the 100-
year event in the vicinity of Turangi based on the Tonkin and Taylor modelling.
Figure 3.6: Area likely to be affected by the 100-year flood event (Tonkin & Taylor, 2004).
39C125.N4
July 2011 19Taupo District Flood Hazard Study - Tongariro River
Some modelling has also been undertaken assuming a 500-year event flow of 2400m3/s
(Tonkin & Taylor, 2005). Such an event is likely to overtop the existing and proposed stop-
banks throughout Turangi, with overtopping greatest immediately upstream of the SH1
bridge.
The design flood events used in the above analyses are slightly higher than those obtained
using the latest flow information. This would suggest that the discussion above is
conservative, and that the protection works may actually contain larger return periods events
than suggested above (Table 3.3).
Table 3.3: Design flood events from different sources.
Return Period Tonkin & Taylor reports Tongariro River 1957-2010 *
(m3/s) (m3/s)
100 1500 and 1700 1451
500 2400 1892
* This study – derivation discussed below.
3.7 Channel stability
The Tongariro River carries thousands of tonnes of sediment each year. While some of this
is boulders and gravel (on average about 11,700 tonnes per year) ten times this amount is
sand-sized or finer. Some of this material comes from the Kaimanawa Range with large
amounts of volcanic ash, pumice, and lava fragments coming from the volcanoes in the west
of the catchment. Although the Tongariro is a gravel-bed river until just downstream of
Turangi, the volcanic material is mainly sand-sized or finer and this tends to be washed onto
the delta. The 1995-96 eruptions of Mt Ruapehu deposited nearly 7 million tonnes of
material into the Tongariro catchment. Two-thirds of this was sand-sized or smaller. Much
of this fine material has aready washed down to the Tongariro delta, but subsequent floods
release new ‘waves’ of sediment into the river. Between eruptions, when sediment supply
from upstream is reduced, floods can erode previous deposits along the bed and banks
(Smart, 2005).
The Tongariro is therefore a highly dynamic river that undergoes significant changes in
response to floods, and the input of sediment from erosion and eruptions in the headwaters.
The river transports large amounts of sediment through the upper reaches and deposits this
material on the river’s delta down stream of Turangi. Over the last 1850 years the Tongariro
delta has grown at an average rate of 2.6 million tonnes per year. This is around twenty
times the present rate. The relatively slow rate of growth under current conditions has
important implications to the flood risk. The fact that the township of Turangi is located at the
head of the delta, perhaps the most dynamic location in the entire catchment, adds
significantly to the flood risk and the difficulties of managing this risk.
Prior to forming its present delta mouths, the Tongariro River flowed between Turangi and
the oxidation ponds, significantly west of its current position. It then entered Lake Taupo
39C125.N4
July 2011 20Taupo District Flood Hazard Study - Tongariro River
along the line of the present Tokaanu Stream. Earlier river mouths can be seen in the
bathymetry of Stump Bay. The river mouth and delta area are therefore highly dynamic.
They have been subject to significant changes and shifts in the past, and are likely to change
again at some stage in the future.
The lower delta currently shows that the river is close to breaking out of its present channel
and forming a new path to Lake Taupo. This is a natural process that has occurred many
times in the past. A significant volume of water is currently being lost from the present
channel, even during relatively low flows as discussed above. Floodwaters spill from the
river upstream of De Latours Pool. This water then flows east to Stump Bay, and west
towards the Tokaanu tail race via Deep Stream. The most likely future breakout route for the
river is from Downs Pool to Tokaanu Bay via Deep Stream (Smart, 2005).
Besides the impact of variable rates of sediment supply, the Tongariro delta is also affected
by subsidence. This lowering of the delta is partly a function of the compaction of the
sediments, but it is also caused by tectonic deformation. The net affect of these processes is
that the delta is subsiding relative to the northern end of Lake Taupo by approximately 3mm
a year. This has made, and is making, the southern shores of the lake and the Tongariro
delta more flood prone.
The dominant controls on the growth and dynamics of the lower delta have been the
frequency and magnitude of floods and eruptions, the level of Lake Taupo during flood
events, and willow tree growth. The effects of these controls can be considered either
beneficial or detrimental depending on whether one is considering wildlife habitat or human
infrastructure on the delta (Smart, 2005).
3.8 Flood frequency analysis
A flood frequency analysis using the annual maxima of the flow series (Table 3.2) was
undertaken to provide estimates of the flood magnitudes for events with various return
periods. A PE3 statistical distribution provides the best fit to the annual maxima series
(Figure 3.7). The results of this analysis are contained in Table 3.4.
Table 3.4: Flood estimates for the Tongariro River (assuming a PE3 distribution).
Tongariro River 1957-2005 Tongariro River 1957-2010
Return Period
(m3/s) (m3/s)
2.33 (annual) 408 406
5 632 622
10 839 816
20 1047 1008
50 1324 1260
100 1534 1451
200 1746 1641
500 2022 1892
39C125.N4
July 2011 21Taupo District Flood Hazard Study - Tongariro River
The results of this latest analysis are consistent with those of previous studies (e.g., Tonkin &
Taylor, 2002; Environment Waikato, 2005b). The significance of the length of record and the
actual occurrence of floods on the estimates of specific design flood magnitudes is clearly
evident in Table 3.4. The addition of five more years of flood maxima reduced the estimates
of the 100 and 500-year floods by approximately 1.5%. This is because these five years
were relative benign with respect to flood events e.g., 2005 had the lowest annual flood in 53
years of record. While 2008 had the 13th largest flood on record, all other years since 2004
had annual floods less than the median.
Discharge (m³/s)
Figure 3.7: Flood frequency analysis of the Tongariro River.
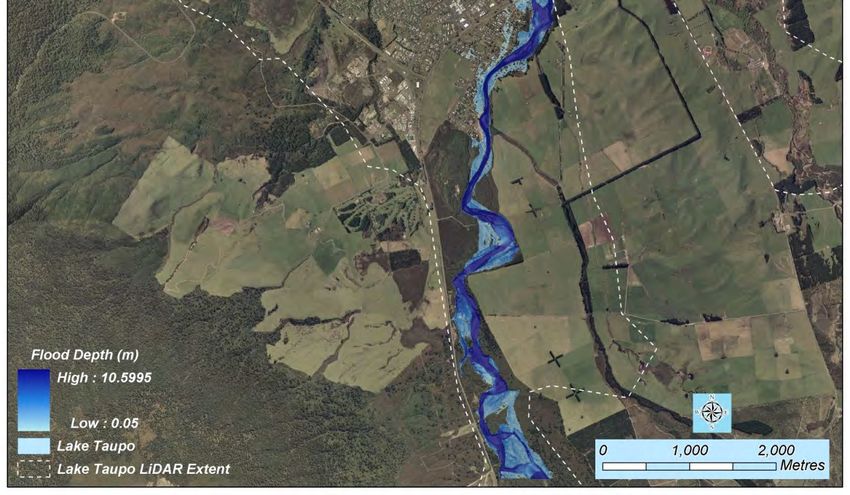
3.9 Flood extent
Using the MIKE21 2-dimensional coupled hydraulic model discussed later, the area
potentially at risk from the 100-year flood estimated from the current instrumental record can
be determined (Figure 3.8). The flood waters are generally contained within the present
channel and stop banks until Turangi township. Some minor overbank flow could be
expected upstream of the State Highway bridge. From approximately 1km below the bridge,
the flood waters start to spread out across the floodplain and delta. From approximately
Smallmans Reach, the entire floodplain from the Tokaanu Tailrace to Stump Bay would
appear to be subject to potential inundation. The flood extent predicted by the latest
modelling is almost identical to that actually experienced during the February 2004 event.
This provides some confidence in the hydraulic flood modelling undertaken for this study.
39C125.N4
July 2011 22Taupo District Flood Hazard Study - Tongariro River
Figure 3.8: Area at risk from the 100-year flood event in the lower Tongariro River.
3.10 Potential effects of land use change
Recent work has investigated the link between land use and runoff in pumice catchments
(Hamilton, 2001; Environment Waikato, 2006). This work was summarised in McConchie et
al., (2008) and used to predict the effects of land use change on both flood peak discharges
and runoff volumes in the Lake Taupo catchment. The major conclusions of this work are
presented in Table 3.5.
39C125.N4
July 2011 23Taupo District Flood Hazard Study - Tongariro River
Table 3.5: Estimated increases in flood peak discharge and volumes with a change in land
use from forest to pasture (Environment Waikato, 2006).
Change in flood runoff
Increase in flood peak discharge (m3/s)
volume (m3)
Average
Regional Average Average
recurrence Unit SCS
frequency increase per increase per
interval hydrograph method
analysis km2 of forest km2 of forest
method (m3/s) (m3X106)
method (m3/s) converted converted
2 23.9 55.4 0.18 4.2 0.019
10 77.7 102.4 0.40 7.5 0.033
20 109.8 131.4 0.54 9.4 0.042
50 165.9 184.1 0.78 12.8 0.057
100 222.5 239.3 1.03 16.2 0.072
Given the current land use distribution and land management within the Tongariro
catchment, the most dramatic land use change ‘likely’ would be the conversion of all the
forestry lands to pasture. It must be recognised that such a land use change is actually
extremely unlikely given the various constraints on land use within the catchment. There are
at present 78km2 under some kind of exotic forestry management within the Tongariro
catchment (LCDB2 – 2004).
Using the information presented in Table 3.5, converting this 78km2 from forestry to pasture
could have the potential effects summarised in Table 3.6. It should be noted that most of the
exotic forestry is on the lower porous and permeable soils. Conversion of this land would
therefore have less dramatic consequences than would be likely should the conversion take
place elsewhere within the catchment.
Table 3.6: Potential effect on the hydrologic regime if all 78km2 of exotic forest lands
within the Tongariro catchment were converted to pasture.
Average increase Increase in peak Average Increase in flood
in peak discharge if all increase in runoff volume if all
discharge per forestry areas flood runoff forestry areas
km2 converted converted to volume per km2 converted to pasture
(m3/s) pasture (m3/s) converted (m3) (m3 X 106)
2 0.18 14.0 0.019 1.5
10 0.40 31.2 0.033 2.6
20 0.54 42.1 0.042 3.3
50 0.78 60.8 0.057 4.4
100 1.03 80.3 0.072 5.6
200 1.45 113.1 0.091 7.1
500 2.18 170.0 0.125 9.8
Note: The estimates for 200 and 500-year RP events were not provided in the original report (Environment
Waikato, 2006) and so have been estimated through curve fitting.
From the perspective of the flood hazard it is the increase in peak discharge that is most
critical. The changes in the estimated flood peak as a result of converting all the area under
exotic forestry to pasture would be 4.8% for the 50-year event and 5.5% for the 100-year
event.
39C125.N4
July 2011 24Taupo District Flood Hazard Study - Tongariro River
The changes in peak flood discharge as a result of land use change, assuming the complete
conversion of all exotic forestry to pasture, are so small that they do not need to be
considered in design flood estimates. This is because any effect of land use change is likely
to be within the error limits of any flood estimate.
3.11 Potential effects of climate change
If predicted global warming eventuates it will cause more than just a rise in the world’s
temperature. Warmer temperatures mean that more water vapour will enter the atmosphere.
Higher temperatures will also increase the ability of the air to hold moisture. Therefore, apart
from higher temperatures, the greatest effect of climate change is likely to be on water
resources. Furthermore, sensitivity analysis has indicated that changes in rainfall are always
amplified in runoff, and this effect is greater in drier catchments. A detailed discussion of the
potential effects of climate change within the Lake Taupo catchment is provided in
McConchie et al., (2008).
A methodology has been developed for determining the projected increase in rainfall as a
result of climate change in New Zealand (Ministry for the Environment, 2008). The mean
annual temperature for the Lake Taupo catchment is predicted to increase by between 0.2
and 2.4°C by the 2040s and 0.6 and 5.6°C by the 2090s (Figure 3.9). These data are
summarised in Table 3.7.
Table 3.7: Projected increases in mean annual temperature by 2040 and 2090 for the Lake
Taupo catchment. (Ministry for the Environment, 2008).
Scenario 2040 (°C) 2090(°C)
Lower limit 0.2 0.6
Average 0.9 2.1
Upper limit 2.4 5.6
Note: These data are from Tables 2.2 and 2.3 in Ministry for the Environment (2008). The original tables cover
the period from 1990 (1980-1999) to 2040 (2030-2049) and 2090 (2080-2099) based on downscaled
temperature changes for 12 global climate models, re-scaled to match the IPCC global warming range for
six illustrative emission scenarios.
The MfE methodology recommends percentage adjustments per degree of warming that
should be applied to the high intensity rainfall totals to account for the effect of global
warming. For example, a 24-hour duration 100-year return period rainfall will increase by 8
percent per degree of projected warming (highlighted in Table 3.8).
Earlier flood analysis in this report has shown that rain-storm durations of 36 hours and
longer pose the greatest flood risk in the Tongariro catchment. Since the percentage
increase in rainfall (per degree warming) decreases with increasing storm duration, and to
take a conservative approach to flood risk, a critical storm duration of 24 hours was used in
this analysis.
39C125.N4
July 2011 25Taupo District Flood Hazard Study - Tongariro River
Figure 3.9: Projections for increases in mean annual temperature and rainfall by 2040 and
2090 relative to 1990; average of 12 climate models for A1B emission scenario
(Figure 2.3, Ministry for the Environment, 2008).
Assuming temperature increases of between 0.2°C and 2.4°C (2040s) and 0.6°C and 5.6°C
(2090s) for the respective scenarios, the 100-year return period rainfall will increase by a
maximum of 19.2% by 2040 and 44.8% by the 2090s (Table 3.9). This is based on the upper
limits of the various global warming scenarios. The percentage increase will vary depending
on the actual temperature increase, storm magnitude, and storm duration.
39C125.N4
July 2011 26Taupo District Flood Hazard Study - Tongariro River
Table 3.8: Percentage increase in rainfall per degree of temperature for different rainfall
durations.
ARI (years)
Duration 2 5 10 20 30 50 100
< 10 mins 8.0 8.0 8.0 8.0 8.0 8.0 8.0
10 mins 8.0 8.0 8.0 8.0 8.0 8.0 8.0
30 mins 7.2 7.4 7.6 7.8 8.0 8.0 8.0
1 hr 6.7 7.1 7.4 7.7 8.0 8.0 8.0
2 hr 6.2 6.7 7.2 7.6 8.0 8.0 8.0
3 hr 5.9 6.5 7.0 7.5 8.0 8.0 8.0
6 hr 5.3 6.1 6.8 7.4 8.0 8.0 8.0
12 hr 4.8 5.8 6.5 7.3 8.0 8.0 8.0
24 hr 4.3 5.4 6.3 7.2 8.0 8.0 8.0
48 hr 3.8 5.0 6.1 7.1 7.8 8.0 8.0
72 hr 3.5 4.8 5.9 7.0 7.7 8.0 8.0
Source: Table 5.2, Ministry for the Environment, 2008.
Table 3.9 Estimated percentage increase in 24-hour rainfall totals for the Tongariro River
as a result of global warming.
2040 2090
Return
period Lower limit Average Upper limit Lower limit Average Upper limit
(0.2°) (0.9°) (2.4°) (0.6°) (2.1°) (5.6°)
2.3 0.9 3.9 10.3 2.6 9.0 24.1
5 1.1 4.9 13.0 3.2 11.3 30.2
10 1.3 5.7 15.1 3.8 13.2 35.3
20 1.4 6.5 17.3 4.3 15.1 40.3
50 1.6 7.2 19.2 4.8 16.8 44.8
100 1.6 7.2 19.2 4.8 16.8 44.8
Note: Guidelines for the effect of climate change on rainfall do not extend beyond 100 years.
At the present time the direct effect of global warming on stream runoff has not been
quantified. Therefore, since this study is particularly concerned with extreme events, when
catchment storage is approaching saturation, it has been assumed that an increase in rainfall
will produce an equal and corresponding increase in runoff. This is likely to over-estimate
the actual increase in runoff, creating a conservative approach when assessing flood risk.
Therefore, the percentage increases in rainfall listed in Table 3.9 have been translated
directly to percentage increases in flow.
Table 3.10 lists the increases in peak discharge as a result of predictions of global warming.
The maximum predicted increases in temperature were used to estimate the increases in
flood peak discharges by 2040. The average temperature increases were used for 2090
(Table 3.9). It should be noted, however, that the predicted flood peaks by 2040 using the
highest temperature forecasts are similar to those by 2090 using the ‘average’ values. This
is therefore considered to be a conservative approach. It allows predicted increases in flood
peaks to be managed efficiently now, given the current level of uncertainty. There is
39C125.N4
July 2011 27Taupo District Flood Hazard Study - Tongariro River
sufficient lead time by 2090 that, should the maximum predicted increase appear likely,
further mitigation of the flood risk will be possible.
Table 3.10: Increased flood discharge for the Tongariro River as a result of predicted global
warming.
Flood peak Flood peak discharge Flood peak discharge
discharge estimated
from the current 2040 – highest 2090 – average
Return Period
instrumental record temperature prediction temperature prediction
(1957-2010) (m3/s) (m3/s)
2.33 (annual) 406 448 443
5 622 703 692
10 816 939 924
20 1008 1182 1160
50 1260 1502 1472
100 1451 1730 1695
Note: Estimates are based on the highest temperature scenario for 2040 but the average temperature increase
for 2090. Guidelines for the effect of climate change on rainfall do not extend beyond 100 years.
4 Other factors that affect flooding
4.1 Sediment transport
Under normal flow conditions the sediment load of the Tongariro River consists of sands and
silts in suspension. Because this material is in suspension it is generally transported through
the lower reaches of the river to at least the delta. The finest material is deposited in Lake
Taupo. This sediment therefore has little effect on the flow capacity and the potential for
flooding. However, as already mentioned, flood events mobilise significant quantities of bed
load which is eroded from the upper catchment during these high energy events. While this
material can be transported through the upper reaches, it is often deposited on the lower
floodplain. The 2004 flood for example eroded material upstream of the SH 1 bridge,
deepening the channel and increasing the freeboard before the stop-banks are overtopped.
Downstream of the bridge the channel aggraded. This reduced the freeboard and as a result
it has increased the flood risk. This risk is compounded by the relatively limited capacity of
the main channel, and the erodible nature of the material forming the bed and banks.
The deposition or erosion of material within the channel, and changes in channel geometry,
can both affect the capacity of the channel to contain flood flows, and therefore the potential
for overbank (flood) flows. While these affects can either exacerbate or limit the flood extent,
duration, and inundation depth they are difficult to build into any flood hazard model. This is
because they are essentially random occurrences in both time and place. Assuming that the
river channel capacity is maintained in accordance with the Environment Waikato’s Tongariro
Flood Management Plan, any adverse effects of sedimentation within the channel should be
minimised.
39C125.N4
July 2011 28Taupo District Flood Hazard Study - Tongariro River
4.2 Lake level
The extent and depth of inundation caused by flooding of the Tongariro River is partly
controlled by the water level in Lake Taupo. Higher lake levels can exacerbate flooding.
Lower lake levels can also potentially reduce the extent, depth and duration of flooding. A
full discussion of all the factors that affect the level of Lake Taupo is contained in McConchie
et al., (2008). In summary, however, the static water level (which acts as the downstream
boundary condition) for any specific return period is equal to the sum of the estimates of the
lake level together with the appropriate seiche, and climate change components (Table 4.1).
To this must be added the site-specific effect of tectonic deformation over the particular
return period chosen as discussed below.
Table 4.1: Expected static water level for different return period events excluding
deformation.
Climate Change Seiche Effect STATIC WATER
Return Period Lake Level (m)
2080s (m) (m) LEVEL
2.33 357.17 0.07 0.08 357.32
5 357.29 0.10 0.09 357.48
10 357.35 0.12 0.10 357.57
20 357.41 0.14 0.11 357.66
50 357.47 0.16 0.11 357.74
100 357.50 0.18 0.11 357.79
200 357.53 0.19 0.11 357.83
500 357.57 0.21 0.11 357.89
4.3 Tectonic deformation
The risk of flooding and inundation on the Tongariro floodplain is not a simple function of the
peak flood discharge and the level of Lake Taupo. This is because the Taupo basin is not
stable. Some areas are rising, while others are subsiding. The movement of the land means
that for a fixed volume of water, areas that are subsiding are exposed to greater risk in the
longer term (Figure 4.1). This relative movement of the land has the potential to have a
significant effect on the flood risk and potential depth of inundation.
A full review of tectonic deformation around Lake Taupo is provided in McConchie et al.,
(2008). That discussion showed near-continuous deformation around Lake Taupo. This
deformation is likely to be a combination of tectonic stresses, subsidence caused by the
extraction of geothermal steam to the north-east of the lake, and sediment compaction in the
vicinity of the Tongariro River delta. The northern and southern shorelines tend to be
subsiding relative to the central Horomatangi Reef which is rising. This deformation is likely
to continue, but the rates and direction are variable and site specific. In addition to this
‘continual’ deformation, earthquakes may cause instantaneous vertical movement of the
land.
39C125.N4
July 2011 29You can also read