2018 Gas Statement of Opportunities - For eastern and south-eastern Australia June 2018 - AEMO
←
→
Page content transcription
If your browser does not render page correctly, please read the page content below
2018 Gas
Statement of
Opportunities
June 2018

For eastern and south-eastern Australia
Important notice

PURPOSE
AEMO publishes the Gas Statement of Opportunities under the National Gas Law and Part 15D of the National Gas
Rules.
This publication has been prepared by AEMO using information available at 6 April 2018. Information made
available after this date may have been included in this publication where practical.

DISCLAIMER
This document or the information in it may be subsequently updated or amended. This document does not constitute
legal or business advice, and should not be relied on as a substitute for obtaining detailed advice about the National
Electricity Law, the National Electricity Rules, or any other applicable laws, procedures or policies. AEMO has made
every effort to ensure the quality of the information in this document but cannot guarantee its accuracy or
completeness.
Accordingly, to the maximum extent permitted by law, AEMO and its officers, employees and consultants involved in
the preparation of this document:
  •    make no representation or warranty, express or implied, as to the currency, accuracy, reliability or
       completeness of the information in this document; and
  •    are not liable (whether by reason of negligence or otherwise) for any statements or representations in this
       document, or any omissions from it, or for any use or reliance on the information in it.

VERSION CONTROL

Version         Release date               Changes

1.0             22/06/2018

© 2018 Australian Energy Market Operator Limited. The material in this publication may be used in accordance with
the copyright permissions on AEMO’s website.
The 2018 Gas Statement of Opportunities (GSOO) contains AEMO’s projections for demand, and information from
gas producers about reserves and forecast production, to assess the projected supply-demand balance and potential
supply gaps under a range of plausible scenarios for the outlook period to 2038, for the eastern and south-eastern
Australian gas markets.
This 2018 GSOO, however, comes after an eventful year in the gas industry and in the context of policy and market
changes affecting demand and supply in Australia and globally. This GSOO assessment reflects these changes.
The eastern and south-eastern Australian gas markets have been irrevocably changed by liquefied natural gas (LNG)
exports and the subsequent coupling of the Australian gas market to international markets. The scale of gas used for
export has led to a tightening of domestic supply. One of the major changes for the Australian gas industry in 2017
was the Federal Government’s introduction of the Australian Domestic Gas Security Mechanism (ADGSM), under which
the Federal Minister for Resources can determine whether export restrictions should be imposed to avoid any potential
shortfall in meeting domestic demand for gas. This GSOO includes projections of supply adequacy for 2019, which
may, along with a range of other information and contributions from other parties, inform the Minister in relation to the
ADGSM.
Domestic supply in eastern and south-eastern Australia will also be enhanced by connection to the Northern Territory
gas fields through the Northern Gas Pipeline (NGP) to be completed by the end of the year.
The 2018 GSOO highlights that:
• No supply gaps are forecast before 2030 under expected market conditions. The risk of shortfalls previously
projected for 2019 has been reduced due to changes in the energy markets, including:
Minor reductions (Forecast demand
Figure 1 shows gas consumption forecasts by demand sector for the 2018 GSOO 1. In previous years, gas demand
forecasts used in the GSOO were published separately in an annual National Gas Forecasting Report (NGFR)2.
Figure 1 Gas consumption actual and forecast, 2010-38, all sectors, Neutral scenario (PJ)
The gas consumption forecast, compared with previous AEMO forecasts, features:
• Lower gas demand in early years. Projected consumption in 2019 is 55 PJ lower compared to the September 2017
GSOO Update3, and 61 PJ lower in 2022 compared to the 2016 NGFR, due primarily to:
Record levels of new renewable generation in the NEM reducing demand for gas from GPG. Over
4,000 megawatts (MW) of new solar and wind generation has committed to being operational in the next two
years, impacting on the market share of both gas- and coal-fired generators. With these new developments,
electricity market modelling indicates GPG demand could be less than half of observed 2017 levels by 2020.
Projected reductions in the reliance on GPG to provide the minimal level of thermal generation the system
needs to manage system security in South Australia. This contributes to lower forecast demand for gas from
GPG than projected in September 2017.
Changes in international LNG market dynamics, coupled with tight domestic gas supply conditions and the
Heads of Agreement, resulting in a slight reduction in LNG export projections.
• Higher gas demand in the longer term. From 2025 to the end of the outlook period, the total forecast demand is
between 90 PJ and 150 PJ per annum higher than in the 2016 NGFR, predominantly due to higher projected
demand for LNG:
LNG exports are expected to increase to maximum production capacity, motivated by increasing international
demand for LNG after 2023, as emerging economies increase activities to curb greenhouse gases. Should
international demand for LNG accelerate before 2023, Australian LNG exports may increase sooner than
forecast.
While GPG demand is projected to increase from 2025 to the end of the outlook period, the levels remain
below the 2016 NGFR forecast. GPG gas demand is not forecast to recover to recently observed historical
levels within the outlook period.
Forecasting uncertainties for gas demand
To address forecast uncertainty relating to factors affecting consumption, including economic conditions and emissions
reduction policies (and their impact on GPG demand in the NEM), AEMO has modelled a range of plausible futures.
1 Demand forecasts are available on the Forecasting Data Portal http://forecasting.aemo.com.au/. Select ‘GSOO 2018’ from the publication drop-down.
2 NGFRs from 2014 to 2016 are available at http://www.aemo.com.au/Gas/National-planning-and-forecasting/National-Gas-Forecasting-Report.
3 The September 2017 GSOO Update is available at http://www.aemo.com.au/Gas/National-planning-and-forecasting/Gas-Statement-of-Opportunities.
© AEMO 2018 | 2018 Gas Statement of Opportunities 4Figure 2 shows AEMO’s 20-year forecasts under three alternative future scenarios, and compares them to equivalent
forecasts from the 2016 NGFR and the 2017 GSOO Update.
Figure 2 Gas consumption forecast in all scenarios, compared to forecasts in 2016 NGFR and 2017 GSOO Update (PJ)
Compared to the Neutral scenario, differences in assumptions in the Strong scenario lead to projected increases in
GPG demand to meet stronger emission abatement targets, and a seventh LNG train from 2027 motivated by
favourable international economic conditions. Conversely, in the Weak scenario, exploration and development of gas
fields for LNG export is assumed to cease, causing LNG exports to reduce correspondingly, and some large industrial
loads are forecast to close, reducing demand for gas.
Further to these three scenarios, annual gas consumption naturally varies depending on underlying weather conditions
and the availability or strategic operation of competing electricity generation technologies and fuels – coal, hydro,
wind, and solar.
Forecast supply
AEMO has been provided with updated production forecasts and gas reserve and resource4 information from gas
producers to inform the 2018 GSOO. This new information reflects the industry’s current best view of gas resources
and production expectations as at April 2018.
Production forecasts from southern fields (that is, fields south of Queensland) are 16 PJ higher in 2019, compared to
production forecasts for the September 2017 GSOO Update. Although a 9 PJ reduction is forecast in production
from both CSG and conventional fields in the north, there is still a resulting net increase in production of 7 PJ to the
gas system.
In addition, the NGP5 is expected to have capacity to supply up to 90 TJ/day from Northern Territory gas fields,
once connected to the eastern market at Mount Isa by late 2018. In the September 2017 GSOO Update, the NGP
was not included in the supply assessment due to gas delivery and timing uncertainties. Supply volume certainty from
Northern Territory gas fields has increased following the Northern Territory Government’s recent decision to lift a
moratorium on hydraulic fracturing, and recent progress6 in the development of the Mereenie field.
Total production forecasts provided by gas producers show an overall projected increase in annual field output of
144 PJ between 2019 and 2022. These quantities of gas include undeveloped reserves and resources.
4 Gas reserves and resources are categorised according to the level of technical and commercial uncertainty associated with developing them. Reserves are quantities
of gas which are anticipated to be commercially recovered from known accumulations. 2P (proved and probable) is considered the best estimate of commercially
recoverable reserves. Contingent resources are considered less commercially viable than reserves, and 2C is considered the best estimate of those sub-commercial
resources.
5 The NGP development did not feature in 2017 GSOO modelling, although it was noted as an option to ease forecast shortfalls.
6 For more on recent progress on Mereenie gas field, see http://www.abc.net.au/news/rural/2018-02-26/gas-exploration-to-increase-in-central-australia/9483022.
© AEMO 2018 | 2018 Gas Statement of Opportunities 5Table 1 shows the production forecast between 2019 and 2022 provided to AEMO by gas producers as their current
best estimate. Gas production in these projections is forecast to increase between 2019 and 2022 in both the south
(Victoria/ New South Wales/South Australia) and the north (Queensland/Northern Territory), with the largest
increases forecast in northern gas fields to meet forecast growth in LNG exports. This increased forecast of CSG
production from the north is highly reliant on large numbers of wells being drilled and constructed annually.
Table 1 Production forecasts to 2022 (PJ) as provided by gas producers
2019 2020 2021 2022
VIC/NSW/SAA 452 483 463 479
QLD/NT A 1,486 1,561 1,636 1,603
Total production 1,938 2,044 2,099 2,082
A. The Queensland component of the Cooper Eromanga basin appears in the SA category.
Supply and infrastructure adequacy assessment
There are no gas supply gaps forecast in 2019, or in the short term, under expected conditions, although some field
expansions are needed. Producers have indicated to AEMO that up to 42 PJ of undeveloped reserves are expected
to come online by 2019 to meet demand, and first gas from contingent resources by 2021.
Provided these as yet undeveloped reserves do come online, comparison of supply adequacy assessments for the
Neutral and Strong scenarios indicates a level of resilience to unexpected variations in demand. In 2019, up to 37 PJ
more gas supply is projected to be available, if needed, to accommodate weather- or event-driven variations in
Neutral scenario consumption forecasts. However, to meet the full 112 PJ of additional LNG demand forecast in the
Strong demand scenario, increased Queensland CSG production would be required.
The reserve mix required to meet domestic demand is shown in Figure 3 below, with rapid decline in production from
2P developed and undeveloped reserves clearly visible, mostly from fields located within the southern states.
Figure 3 Status of reserves and resources to meet domestic demand, 2019-38
As existing fields decline, exploration and development will be needed to deliver these contingent and prospective
resources to market. These new gas supplies will help improve adequacy of supply but, as flagged in the 2017
GSOO, supply from these fields is likely to be more costly than existing production.
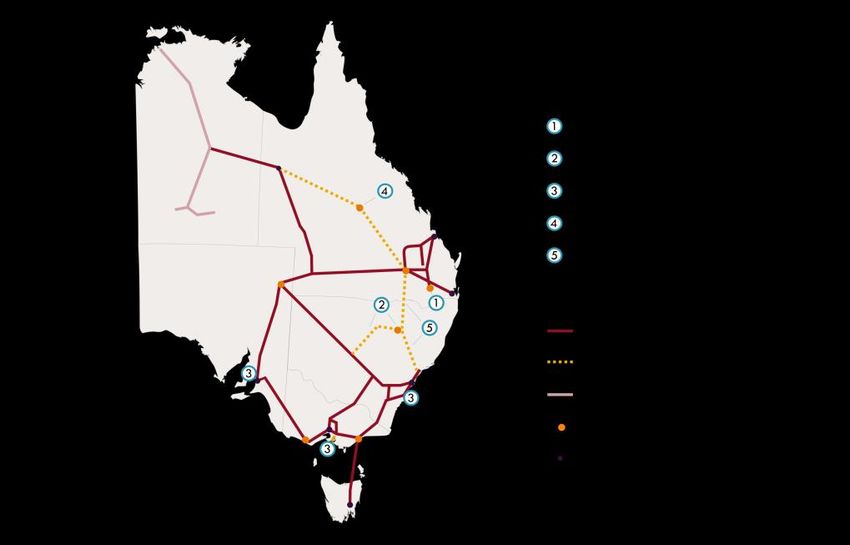
© AEMO 2018 | 2018 Gas Statement of Opportunities 6Without exploration and development of new southern resources, additional investment in gas supply infrastructure will be required by 2030 to deliver the gas to where it is needed. Figure 4 below demonstrates southern field decline of developed and undeveloped reserves, and the need for contingent and prospective resource development to meet southern demand (New South Wales, Victoria, South Australia, and Tasmania). The location of this exploration and development will influence the needs for pipeline infrastructure. Figure 4 Status of southern reserves and resources required to meet southern demand, 2019-38 © AEMO 2018 | 2018 Gas Statement of Opportunities 7
Executive summary                                                                                      3
1.         Introduction                                                                               10
1.1        National gas demand forecasts                                                              10
1.2        The Australian Domestic Gas Security Mechanism                                             10
1.3        2018 Victorian Gas Planning Report (VGPR) Update                                           11
1.4        Scenarios                                                                                  11
2.         Gas demand forecast                                                                        13
2.1        Eastern and south-eastern demand forecast trends                                           13
2.2        Consumption forecasts by sector                                                            15
2.3        Maximum daily demand forecasts                                                             22
3.         Short-term supply adequacy                                                                 23
3.1        Supply outlook                                                                             23
3.2        Risks and variability                                                                      25
4.         Long-term supply adequacy                                                                  28
4.1        Supply outlook                                                                             28
4.2        Potential new supply options                                                               31
A1.        Forecast accuracy                                                                          34

Glossary                                                                                              37

Table 1      Production forecasts to 2022 (PJ) as provided by gas producers                            6
Table 2      Scenario drivers                                                                         12
Table 3      Comparison of 2018 GSOO and September 2017 GSOO Update gas consumption
             forecasts for 2019 (PJ)                                                                  15
Table 4      Percentage splits of gas consumption by sector, 2017                                     15
Table 5      Total 1-in-20 forecast maximum demand, all sectors, including UAFG, excluding GPG (TJ/
             day)                                                                                     22
Table 6      Production forecasts to 2022 (PJ), as provided by gas producers                          23
Table 7      Impacts of considered risks and uncertainties on GPG demand between 2019 and 2020        26
Table 8      Summary of sensitivities examining new supply options                                    32

© AEMO 2018 | 2018 Gas Statement of Opportunities                                                      8
Figure 1 Gas consumption actual and forecast, 2010-38, all sectors, Neutral scenario (PJ) 4
Figure 2 Gas consumption forecast in all scenarios, compared to forecasts in 2016 NGFR and 2017
GSOO Update (PJ) 5
Figure 3 Status of reserves and resources to meet domestic demand, 2019-38 6
Figure 4 Status of southern reserves and resources required to meet southern demand, 2019-38 7
Figure 5 Recent changes in Gippsland production forecasts, provided by industry 11
Figure 6 Gas consumption actual and forecast, 2010-38, all sectors, Neutral scenario (PJ) 13
Figure 7 Gas consumption forecast in all scenarios, compared to forecasts in 2016 NGFR and 2017
GSOO Update (PJ) 14
Figure 8 Gas consumption actual and forecast, 2010-38, all sectors, Neutral scenario, by north and
south regions 15
Figure 9 Residential/commercial annual consumption actual and forecast, 2010-38, all scenarios,
and compared to 2016 NGFR 17
Figure 10 Industrial annual consumption, actual and forecast, 2018-38, all scenarios, and compared
to 2016 NGFR 17
Figure 11 Annual consumption forecast for Manufacturing sector, 2018-38, by scenario 18
Figure 12 Annual consumption forecast of Other business sector, 2018-38, by scenario 19
Figure 13 GPG annual consumption actual and forecast, 2010-38, all scenarios, and compared to
2016 NGFR 20
Figure 14 LNG annual consumption actual and forecast, 2010-38, all scenarios, and compared to
2016 NGFR 21
Figure 15 Demand and production forecasts compared to the September 2017 GSOO Update 24
Figure 16 Oil and gas exploration expenditure estimate, and Brent Oil Price, 2011-18 25
Figure 17 Status of reserves and resources to meet domestic demand, 2019-38 29
Figure 18 Status of southern reserves and resources required to meet southern demand, 2019-38 29
Figure 19 Production split between north and south, Neutral – Low southern resource case, 2019-38 30
Figure 20 Projected monthly supply and demand balance for the south in 2030 30
Figure 21 Projected flow duration curve for SWQP flows for 2024, 2034, and 2038, Neutral – Low
southern resource case 31
Figure 22 Potential new supply options 32
Figure 23 Gas annual consumption forecast comparison, total for eastern and south-eastern Australia 34
Figure 24 Gas annual consumption forecast comparison, LNG 35
Figure 25 Gas annual consumption forecast comparison, residential/commercial 35
Figure 26 Gas annual consumption forecast comparison, industrial 36
Figure 27 Gas annual consumption forecast comparison, GPG 36
© AEMO 2018 | 2018 Gas Statement of Opportunities 9The 2018 Gas Statement of Opportunities (GSOO) assesses the adequacy of eastern and south-eastern Australian
gas markets to supply forecast maximum demand and annual consumption over a 20-year outlook period. The GSOO
analyses transmission, production, and reserves adequacy, to highlight locations where new gas processing or
transmission infrastructure, or field developments, may be required. The GSOO analyses a range of potential futures
that may impact the gas market in the next twenty years. It is focused on providing an adequacy assessment in the
short to medium term, and identifying longer term development needs.
This report is based on information available to AEMO at 6 April 2018, although AEMO has endeavoured to
incorporate more recent information where practical. It incorporates:
• National gas demand forecasts, previously published separately in the National Gas Forecasting Report (NGFR).
• A brief overview of the Australian Domestic Gas Security Mechanism (ADGSM) 7.
• An update on the gas supply outlook for eastern and south-eastern Australian gas markets, building on information
provided in the Victorian Gas Planning Report (VGPR)8.
1.1 National gas demand forecasts
A key input to the GSOO is 20-year forecasts of annual gas consumption and maximum daily demand.
Since 2014, AEMO has published these forecasts separately to the GSOO, as the NGFR 9. The 2017 GSOO, for
example, used forecasts from the 2016 NGFR. This year, gas demand and supply outlooks have been integrated into
this one publication in recognition of their co-dependencies.
Chapter 2 summarises the forecasts and key demand drivers in the 20 years to 2038, and detailed data is available
on AEMO’s forecasting portal10. AEMO’s forecasting performance since 2014 is summarised in Appendix A1.
1.2 The Australian Domestic Gas Security Mechanism
The 2018 GSOO comes after an eventful year in the gas industry, and in the context of policy and market changes
affecting demand and supply in Australia and globally. One of the major changes for the Australian gas industry in
2017 was the Federal Government’s introduction of the ADGSM, under which the Federal Minister for Resources and
Northern Australia can determine whether export restrictions should be imposed to avoid any potential shortfall in
meeting domestic demand for gas in a calendar year.
The ADGSM was introduced by way of regulations11 which empower the Federal Minister to impose liquefied natural
gas (LNG) export restrictions in a ‘domestic shortfall year’. This is a calendar year where the Minister has reasonable
grounds to believe that the export of LNG would contribute to a lack of supply of natural gas for consumers and that
there will not be a sufficient supply unless exports are controlled. Guidelines12 made under those Regulations provide
that, unless the Minister determines that it is not necessary to consider whether a year is a domestic shortfall year, the
Minister commences the process between July and October by issuing a notification of his intention to consider whether
the following calendar year will be a domestic shortfall year, and consulting with a range of stakeholders to seek
their views.
7 Information available at https://industry.gov.au/resource/UpstreamPetroleum/AustralianLiquefiedNaturalGas/Pages/Australian-Domestic-Gas-Security-
Mechanism.aspx.
8 Available at http://www.aemo.com.au/Gas/National-planning-and-forecasting/Victorian-Gas-Planning-Report.
9 NGFRs and supporting material are available at http://aemo.com.au/Gas/National-planning-and-forecasting/National-Gas-Forecasting-Report.
10 Demand forecasts are available on the Forecasting Data Portal http://forecasting.aemo.com.au/. Select ‘GSOO 2018’ from the publication drop-down.
11 Introduced in 2017 by way of the insertion of a new Division 6 in Part 3 of the Customs (Prohibited Exports) Regulations 1958.
12 Customs (Prohibited Exports) (Operation of the Australian Domestic Gas Security Mechanism) Guidelines 2017.
© AEMO 2018 | 2018 Gas Statement of Opportunities 10The objective of the ADGSM is to ensure there is sufficient supply of natural gas to meet the forecast needs of
Australian consumers by requiring, if necessary, LNG projects which are drawing gas from the domestic market to limit
exports or find offsetting sources of new gas.
In 2017, the Federal Government decided not to apply export controls for the 2018 year following its considerations
under the ADGSM. However, it reached a Heads of Agreement13 with the east coast LNG consortia under which they
made commitments in relation to the domestic supply of gas in 2018 and 2019.
1.3 2018 Victorian Gas Planning Report (VGPR) Update
The 2018 GSOO builds on the forecasts AEMO presented in the March 2018 VGPR Update, although its purpose is
different. The VGPR specifically examines only those gas production developments that exist or are currently
committed in Victoria, while the GSOO uses industry information regarding expected expansions of gas production
facilities across eastern and south-eastern Australia.
Both reports support the need for reserves and resources not yet developed to be brought to market in the short term
to meet forecast demand, and, in the longer term, for supply to continue to expand beyond producers’ current best
estimates of long-term industry investments.
The March 2018 VGPR Update considered only developed gas reserves and committed and approved new gas
supply projects, and projected that, without additional gas supply, there would be a potential shortfall in meeting
annual Victorian gas consumption from 2022.
For the GSOO, gas producers have included additional gas supply from as yet undeveloped reserves and resources
as part of their best estimates of production. This new information highlights that Victorian offshore gas producers are
expecting to replace declining field production with new reserves and resources in the next few years to 2022,
helping to alleviate the risk of gas shortfalls. As an example, production estimates differences for Gippsland
producers between the March 2018 VGPR Update and the June 2018 GSOO are highlighted in Figure 5 below.
Figure 5 Recent changes in Gippsland production forecasts, provided by industry
1.4 Scenarios
The demand and supply inputs for the 2018 GSOO are based on a range of scenarios, constructed to be
economically consistent. The Neutral scenario considers demand drivers of an economy that takes the most likely
pathway. The Strong and Weak demand scenarios provide alternative projections of consumption and peak demand
13 See https://industry.gov.au/resource/UpstreamPetroleum/AustralianLiquefiedNaturalGas/Documents/Heads-of-Agreement-The-Australian-East-Coast-Domestic-Gas-
Supply.pdf.
© AEMO 2018 | 2018 Gas Statement of Opportunities 11with reasonable bounds on the core demand drivers, although less likely in aggregate than the Neutral forecasts.
Some of the key indicators under the three scenario conditions are described in Table 214.
Table 2 Scenario drivers
Driver Neutral scenario Strong scenario Weak scenario
Population growth ABS Series B (Medium) ABS Series A (High) ABS Series C (Low)
Economy Neutral global and domestic Strong global and domestic Weak global and domestic
demand demand demand
Energy efficiency Moderate energy efficiency Aggressive energy efficiency Weak energy efficiency
measures adopted measures adopted measures adopted
Fuel switching Average economic case for fuel Strong economic case for fuel Weak economic case for fuel
switching switching switching
Gas price Medium gas prices High gas prices Low gas prices
Minimum emission abatement Compared to 2005 levels, Compared to 2005 levels, Compared to 2005 levels,
achieved by the electricity 28% reduction by 2030, 52% reduction by 2030, 28% reduction by 2030,
market 70% reduction by 2050 90% reduction by 2050 70% reduction by 2050
Information on the demand and supply forecasting methodologies, and more detailed explanation of scenarios, is
available on the 2018 GSOO webpage15.
14 These Neutral, Strong, and Weak scenarios are consistent with the Neutral, Fast change, and Slow change scenarios studied for AEMO’s Integrated System Plan (ISP),
available at http://aemo.com.au/Electricity/National-Electricity-Market-NEM/Planning-and-forecasting/Integrated-System-Plan.
15 AEMO’s 2018 GSOO supporting documents are available at https://www.aemo.com.au/Gas/National-planning-and-forecasting/Gas-Statement-of-Opportunities.
© AEMO 2018 | 2018 Gas Statement of Opportunities 12The pace of change affecting Australia’s energy markets has been rapidly increasing over the last few years. While
energy policy has provided a catalyst for this, a more engaged consumer base is also a key contributing factor. This is
being evidenced by the volatility in actual consumption in recent years, compared to the steadily increasing trends of
the past, suggesting customers are responding to market changes. This is consistent across both the residential and
business sectors. More environmentally-conscious, innovative, and responsive consumers are emerging. The demand
forecasts for this year’s GSOO continue to show diverging trends across consumer sectors and demonstrates the
increasing uncertainty in forecasting an evolving consumer and customer base.
2.1 Eastern and south-eastern demand forecast trends
Figure 6 shows the 20-year total demand forecast for eastern and south-eastern gas markets under the Neutral
scenario, and the breakdown of the forecasts by the consumer types.
Figure 6 Gas consumption actual and forecast, 2010-38, all sectors, Neutral scenario (PJ)
Some of the key insights to the demand forecasts16, expanded in subsequent sections of this report, are:
• Declining forecast consumption in the early years (2018-23), due to:
Decline in projected residential/commercial consumption, due to energy efficiency gains and gas to electric
fuel switching.
Forecast decline in gas consumption from gas-powered generation (GPG) of electricity, due to penetration of
renewable generation sources increasing at a rapid rate in the National Electricity Market (NEM) 17.
• Consumption stabilising over the medium term of forecasts (2024-28), due to:
16 Demand forecasts are available on the Forecasting Data Portal http://forecasting.aemo.com.au/. Select ‘GSOO 2018’ from the publication drop-down.
17 AEMO reports information on the capacity of existing, withdrawn, committed, and proposed generation projects in the NEM through the Generation Information page,
at https://www.aemo.com.au/Electricity/National-Electricity-Market-NEM/Planning-and-forecasting/Generation-information.
© AEMO 2018 | 2018 Gas Statement of Opportunities 13 Projected ramp-up in LNG exports to full LNG train utilisation to meet growing Asian demand, offsetting a
forecast continued decline in residential/commercial consumption from energy efficiency gains and gas to
electricity fuel switching.
Forecast GPG gas consumption remaining low while renewable generation continues to play an increased role
in the NEM.
Industrial consumption forecasts remaining flat over the period.
• Forecast growing consumption of residential/commercial sectors and GPG in the long term (2029-38), due to:
The projected impact of energy efficiency and gas to electric fuel switching plateauing in the long term,
leaving growth in connections as the dominant driver to increase residential/commercial consumption.
Forecast GPG demand for gas growing as it is expected to assist in integrating renewable generation reliably
and securely, particularly as aging coal generators are forecast to retire. Despite this forecast growth,
demand for gas from GPG is not projected to return to recently observed historical levels within the 20-year
outlook period.
Comparison of 2018 GSOO gas demand forecasts to previous forecasts
The difference in demand forecasts across the 2016 NGFR, the 2017 GSOO Update, and the 2018 GSOO are
shown in Figure 7. Key differences in trends are:
• All 2018 GSOO scenarios show lower demand than the previous forecasts in the short term. This is primarily due to
forecast declines in GPG gas consumption driven by more rapid renewable generator development than was
earlier expected, even in the 2017 GSOO Update. Projected ramp-up to full LNG production is also slower than
previously projected, due to increased international LNG supply competition in the short term.
• At the end of the forecast period, the 2018 GSOO forecasts are higher than the 2016 NGFR forecasts in the
Neutral and Strong scenarios. This is explained by the upward revised forecasts of consumption for both LNG and
the industrial sector. Forecast LNG export growth is driven by revised assumptions on efficiency rates of liquefaction
and increased debottlenecking18 to lift total export capacity. Industrial growth is driven by projections of more
stable large industrial loads and stronger growth outlook in the Gross Value Added (GVA) of the Services sector 19.
• In the Weak scenario, faster rates of decline of production from CSG wells were assumed than in earlier forecasts,
as more data on actual production profiles has become available.
Figure 7 Gas consumption forecast in all scenarios, compared to forecasts in 2016 NGFR and 2017 GSOO Update (PJ)
18 Debottlenecking is a term specific to the gas industry, in which bottlenecks to the flow of gas through the plant equipment is reduced to allow more efficient processing
of gas. For more details, please see https://www.auduboncompanies.com/debottlenecking-what-it-is-and-how-it-can-help-optimize-downstream-processes/.
19 GVA is defined as an aggregated measure ($’Millions, 2018 real terms) of economic activity in all sectors except agriculture, construction, mining, manufacturing, and
utilities. Sector definitions used in the GSOO follow the Australia New Zealand Industry Sector Category, published by the Australian Bureau of Statistics. See
http://www.abs.gov.au/ausstats/abs@.nsf/Latestproducts/0C2B177A0259E8FFCA257B9500133E10?opendocument.
© AEMO 2018 | 2018 Gas Statement of Opportunities 14The differences in the most recent forecasts for 2019 are shown in Table 3 below.
Table 3 Comparison of 2018 GSOO and September 2017 GSOO Update gas consumption forecasts for 2019 (PJ)
Sector 2018 GSOO September 2017 GSOO Update Difference
Residential, commercial. and industrial 464 463 -1
GPG 88 135 -47
LNG 1,328 1,336 -8
Total 1,880 1,934 -54
2.2 Consumption forecasts by sector
Gas is used in different ways across Australia. For example, in Victoria, gas consumption is dominated by the
residential/commercial sector, whereas in Queensland, the residential/commercial sector has a very small proportion
of regional gas consumption. Table 4 shows the breakdown of gas consumption for each region by sector.
Table 4 Percentage splits of gas consumption by sector, 2017
Regional Residential/commercial Industrial GPG LNG Regional gas
consumption
Queensland < 1% 8% 3% 89% 1,377 PJ
New South Wales 37% 42% 21% 0% 130 PJ
South Australia 11% 23% 66% 0% 101 PJ
Tasmania 5% 33% 62% 0% 15 PJ
Victoria 55% 30% 15% 0% 228 PJ
Total consumption by sector 10% 14% 10% 66% 1,851 PJ
Figure 8 below shows the gas consumption forecast across northern (Queensland/Northern Territory) and southern
(Victoria/ New South Wales/South Australia) regions. The figure demonstrates the geographic diversity of each
customer sector.
Figure 8 Gas consumption actual and forecast, 2010-38, all sectors, Neutral scenario, by north and south regions
North South
© AEMO 2018 | 2018 Gas Statement of Opportunities 152.2.1 Residential and commercial consumption
AEMO developed residential and commercial forecasts using forward estimates of consumption on a per connection
basis. The forecast number of new connections therefore drives the growth trajectory, subject to other influences (such
as changing consumer behaviours in response to pricing stimuli, appliance fuel switching and broader energy
efficiency impacts). The forecast highlights that:
• Until the late 2020s, new connection growth is projected to be offset by the impacts of energy efficiency
improvements and appliance fuel switching, in response to projected increasing retail gas prices20. Throughout the
2020s, the combined effect of these impacts is forecast to be larger than the increases in demand from new
connections.
Energy efficiency improvements occur when older appliances are replaced by newer, more efficient devices,
such as instantaneous gas hot water systems that use gas more efficiently than gas-heated systems that store
hot water in a tank. Efficiency improvements also come from upgrades to building insulation that reduce the
amount of space heating required to maintain a comfortable temperature.
Appliance fuel switching is expected to reduce gas consumption for both water heating (where gas-boosted
solar hot water systems are gaining in popularity) and space heating (where modern reverse-cycle
air-conditioners are becoming a cheaper alternative to gas heating).
Retail prices rise in the first three years because of a combination of tight supply and demand balance and
retailers transitioning from legacy contracts to higher-priced new Gas Supply Agreements (GSAs) for
wholesale gas. Prices stabilise over the long term at higher levels than history, reflective of increased cost of
production and the influence of the LNG netback price, which has impacted domestic gas prices since the
introduction of the east coast LNG industry.
• After the late 2020s, these connection-offsetting drivers are projected to have a reduced impact, allowing new
connections growth to drive the forecast trend. This forecast reduction is partly driven by an average 10-year to
15-year replacement lifetime of gas appliances, as well as the efficiency upgrades of older homes approaching
that of newer housing stock.
• Climate change is projected21 to increase average temperatures by about 0.5°C by the end of the forecast period,
thereby reducing gas demand for heating in winter. On average, across eastern and south-eastern Australia,
AEMO’s modelling projects a reduction of approximately 25 PJ for every 1°C increase in average temperature.
In the Neutral scenario, the above factors produce a residential and commercial gas consumption forecast that
declines until the late 2020s, before recovering to close to its 2018 value 22.
Figure 9 shows the overall trend in forecast residential and commercial gas consumption for the three scenarios, and
compared to the 2016 NGFR forecast. The 2017 GSOO Update forecasts are not shown because they were
aggregated to include residential, commercial, and industrial consumption.
While the overall forecast closely resembles the 2016 NGFR projection, some variation exists at the regional level. A
key driver of this variation is the dwellings forecast used to project new gas connections, which has been updated for
the 2018 GSOO. These projections now show a higher rate of connections growth in Victoria compared to the
2016 NGFR, whereas growth in other regions is slightly lower. These changes result in a higher gas demand forecast
in Victoria and slightly lower forecasts in other regions, however the net impact on the total residential/commercial
forecast is negligible at the end of the forecast period.
20 Retail gas prices are derived by AEMO based on wholesale gas price forecasts produced by Core Energy. These wholesale prices reflect the underlying market
conditions assumed in each of the forecast scenarios. AEMO has adjusted these external forecasts in the near term to reflect recent observations of wholesale prices.
AEMO’s index of retail gas price forecasts are available at: http://forecasting.aemo.com.au/.
21 Further detail on the methodology capturing the influence of a warming climate is in the GSOO Methodology documentation, available at
http://www.aemo.com.au/Gas/National-planning-and-forecasting/Gas-Statement-of-Opportunities.
22 Climate change projections are based on information available on the Climate Change in Australia website, at
https://www.climatechangeinaustralia.gov.au/en/climate-projections/.
© AEMO 2018 | 2018 Gas Statement of Opportunities 16Figure 9 Residential/commercial annual consumption actual and forecast, 2010-38, all scenarios, and compared to 2016
NGFR
2.2.2 Industrial consumption
AEMO forecast industrial sector consumption separately for:
1. The Manufacturing sector, which is typically more energy-intensive, and
2. ‘Other business’ consumers.
Currently, 89% of industrial consumption is from the Manufacturing sector. The underlying drivers affecting the
Manufacturing and Other business sectors are discussed separately below. Key trends show a flat neutral projection
for the Manufacturing sector, while the Other business sector is forecast to continue to grow, in line with services
sector growth.
Figure 10 shows the overall trend in forecast industrial gas consumption for the three scenarios, and compared to the
2016 NGFR forecast.
Figure 10 Industrial annual consumption, actual and forecast, 2018-38, all scenarios, and compared to 2016 NGFR
© AEMO 2018 | 2018 Gas Statement of Opportunities 17Comparison between scenarios shows more downside risk associated with the potential closure of large industrial
loads and stronger price response in the Weak scenario, compared with the Neutral. Scenario variance and risk is
asymmetric. While there is some potential in the Strong scenario for new industrial loads to increase consumption,
growth is primarily due to increases associated with existing production processes. Industry feedback suggests that
there is little incentive currently for such new major investment. Therefore, the upside consumption uncertainty is a lot
less than the downside uncertainty where industrial loads may close due to poor economic conditions. These trends are
consistent across all regions.
Manufacturing sector trends
The Manufacturing sector forecast (see Figure 11) is largely driven by consumption from large industrial loads23, which
are projected to remain stable in the Neutral scenario over the forecast period.
Figure 11 Annual consumption forecast for Manufacturing sector, 2018-38, by scenario
In contrast to the 2016 NGFR forecasts, AEMO no longer projects a material demand response to rising gas prices:
• Analysis of actual consumption over the last 12 months indicates industrial users have been resilient to recent gas
price rises. The Australian Competition and Consumer Commission (ACCC) interim gas market enquiry reports24 have
identified an increase in average contract price of 25% from the last quarter of 2016 to the first quarter of 2017
alone. Despite this, AEMO’s consumption data suggests only a 2% decrease in total industrial consumption from
2016 to 2017.
• In addition, detailed interviews with large industrial users, ranging from questions on the broader gas market to
industry specific dynamics, reveal that large industrial consumers have increased confidence in gas availability, due,
in part, to the ACCC review into the gas markets, and the introduction of the ADGSM and the LNG Heads of
Agreement with the potential for diversion of LNG gas from exports to the domestic market.
• Some large industrial users are taking a more active role in their gas procurement by becoming direct market
participants in wholesale markets or investigating options for joint ventures with gas producers25.
• Improved commodity prices and foreign exchange rates have strengthened export conditions for large industrial
consumers, further increasing their resilience to recent increases in gas prices.
The ACCC has reported trends on historic prices. The September 2017 interim report26 highlights that the period of
2015 to 2017 exhibited much higher gas prices than those historically seen. This was a period when the gas industry
23 Large industrial loads are consumers that use more than 500 TJ of gas annually.
24 Since September 2017, the ACCC has released a series of interim gas market enquiry reports (https://www.accc.gov.au/publications/serial-publications/gas-inquiry-
2017-2020) that review the state of demand and supply in the Australian domestic gas market and also report on contract pricing trends, with a key objective to
improve transparency and provide benchmarks for gas consumers.
25 Small Caps, “Central Petroleum and Incitec Pivot join forces in Queensland”, 1 March 2018, available at https://smallcaps.com.au/central-petroleum-incitec-pivot-
queensland/.
26 ACCC, Gas Inquiry 2017-2020 Interim Report, September 2017, available at https://www.accc.gov.au/system/files/Gas%20Inquiry%20-
%20Interim%20Report%20-%20September%202017.pdf.
© AEMO 2018 | 2018 Gas Statement of Opportunities 18was transitioning from legacy contracts to new gas supply agreements (GSAs). New GSAs are typically higher in
price, reflecting increases in the cost of gas production and the influence of the LNG netback price, which has
impacted domestic gas prices since the commencement of the east coast LNG industry.
Looking forward, price rises of similar magnitude are not evident in future wholesale gas price projections. The rate of
increase is expected to slow over the next three years then stabilise.
The forecast changes in market conditions, coupled with this projected softening in gas price rise and greater gas
availability expectations, suggest that the largest subset of industrial users have a more stable consumption outlook
than previously forecast. This aligns with the survey responses received from these large industrial users, with little
change in survey-based consumption projected relative to last year.
Accordingly, AEMO has refined the industrial sector methodology to reflect these changes, with forecasts of large
industrial loads being based on survey forecasts and not included in the econometric modelling 27.
The remaining industrial consumption that is driven by econometric modelling also has a lower forecast gas price
response, due to updated gas prices that shows earlier wholesale gas price stabilisation than 2016 NGFR.
There are also some large industrial step changes projected, both positive and negative, arising from a combination
of industrial closures, fluctuation in industrial user production levels, and adoption of more electricity and heat
cogeneration to manage electricity market price exposure.
Other business sector trends
Outside of the Manufacturing sector, gas consumption is projected to grow at approximately 1% each year over the
20 years, as shown in Figure 12. This increasing trend continues to tell the same story as the 2016 NGFR, with some
updates to the forecasts of the input drivers resulting in slightly higher projections.
The key drivers for the Other business sector are:
1. Retail gas price – price increases are driven by projected wholesale price rises in the long term. The reduction in
consumption in response to price increase is revised down in this year’s forecasts, due to an updated wholesale
price forecast which has prices stabilising earlier than the projections from last year.
2. Services sector GVA – this is the economic activity of the services sector, which makes up most of the Other sector
consumption. Services sector GVA has been revised up because of updated economic modelling done by an
economic consultant for AEMO28.
The trend for Other business sector consumption forecast is dominated by increasing economic activity in the services
sector. This is forecast to be moderated in the very short term (first three years of the forecast period) by response to
retail price rises. However, as gas price rises are projected to taper off in subsequent years, growth in services GVA
drives the long-term trends.
Figure 12 Annual consumption forecast of Other business sector, 2018-38, by scenario
27 For gas demand forecasting methodology please see http://www.aemo.com.au/Gas/National-planning-and-forecasting/Gas-Statement-of-Opportunities.
28 Services sector GVA forecasts are produced for AEMO by economic consultants, in accordance with AEMO scenario definitions. Input forecast data is available at
http://forecasting.aemo.com.au/.
© AEMO 2018 | 2018 Gas Statement of Opportunities 192.2.3 GPG
Over the outlook period, AEMO expects the role of GPG to move toward meeting demand when renewable
generation is low, and during more extreme weather events. Overall utilisation of existing GPG is projected to decline
in the next decade, as renewable generation sources supply more energy during the day and most existing coal-fired
generation remains in service. In the period from 2030 to 2040, the capacity factor of the remaining gas-fired
generation is forecast to recover as coal-fired generators reach end of technical life and retire.
Forecast gas demand for GPG (in Figure 13) is lower than previously forecast in the Neutral scenario, driven by an
increased outlook for renewable generation development. In the short term, the rate at which new renewable
generation is being commissioned is faster than previously expected, and greater projected reductions in build costs
are accelerating long-term forecast renewable generation penetration. Expanded renewable generation targets set
by the governments of Victoria and Queensland further increase expectations for a greater uptake of renewable
generation in the next decade than was forecast in 2017.
The forecast higher demand for GPG in the Strong scenario is driven by a combination of elements, including:
• Higher electricity demand due to stronger economic growth, stronger electric vehicle uptake, and weaker demand
side participation, compared to the Neutral scenario.
• Higher emissions abatement assumed by the electricity sector in the Strong scenario, driving reduced operation of
coal-fired generation.
Forecast demand for GPG in the Weak scenario is driven primarily by lower electricity demand leading to a reduced
reliance on GPG for electricity generation. With GPG a relatively costly form of electricity generation, particularly
compared to renewable energy sources, it is relied upon much less than other generation types under low demand
conditions. Relatively high-cost GPG may therefore be called on for generation less frequently, particularly with
increasing competition from renewable generation.
While the Weak scenario reflects the lowest forecast general consumption trend for GPG, this scenario is also
expected to lead to the least development of renewable energy generation. As such, as coal generators retire, the
presence of less renewable energy may lead to greater consumption of GPG. This is evident in the mild crossover
between the Neutral and Weak scenarios beyond 2035, and demonstrates increasing uncertainty in the long term.
Figure 13 GPG annual consumption actual and forecast, 2010-38, all scenarios, and compared to 2016 NGFR
2.2.4 LNG
The LNG forecasts used in this 2018 GSOO, shown in Figure 14, have been developed considering stakeholder
guidance and long-term forecasts from Lewis Grey Advisory (LGA) 29.
29 Further detail is available in the Lewis Grey Advisory (LGA) report on AEMO’s website at http://www.aemo.com.au/Gas/National-planning-and-forecasting/Gas-
Statement-of-Opportunities.
© AEMO 2018 | 2018 Gas Statement of Opportunities 20The key trends of the LNG forecasts are:
• In the short term (2019-23), a slow demand increase from current usage to meet global demand is forecast. These
projections come from LNG consortia forecasts in aggregate, and are slightly lower than the 2016 NGFR due to
changing international LNG market dynamics and the east coast LNG producers increasing their domestic gas
commitments.
• Beyond 2023, exports are forecast to ramp to maximum LNG production capacity, largely motivated by stronger
demand for LNG in Asia after 2023. This is due to:
The continued curbing of greenhouse gases by power generation fuel switching in emerging economies (such as
China, South Korea, and India).
The further development of international carbon markets.
The mandatory reduction of sulphur emissions for marine vessels 30 under the International Maritime
Organisation’s “International Convention for the Prevention of Pollution from Ships” (MARPOL Convention),
which can be met by an increased usage in ships of low sulphur-emitting fuels such as LNG.
China’s plan to correct the continued mismatch of gas storage and gas demand within China31.
Forecast export LNG train capacity has also been revised up from last year, due to a combination of:
Servicing the strengthening global demand for LNG.
Updated assumptions on efficiency rates of liquefaction (revised down) and nameplate capacity levels (revised
up), based on updated consumption data.
Collectively, these changes result in higher forecast demand in the medium to long term compared with last year.
• The Strong scenario has earlier forecast increases in gas usage compared to Neutral, because it assumed the LNG
companies would be more aggressive in debottlenecking the LNG facilities. In the longer term, the Strong scenario
considered the possibility of an additional LNG export facility from 2025, ramping up to full capacity export by
2027 and sustained for the remaining forecast period. This is a continued assumption from the 2016 NGFR and,
while it is less likely than some drivers, AEMO has included it to provide a book-end to the gas demand scenarios.
• The Weak scenario assumed little incentive for further drilling beyond existing well production. It follows the
production profile of existing wells, declining to minimum production levels by 2029, earlier than was assumed in the
2016 NGFR forecast. This revision resulted from more production data being available to assess rates of decline.
Figure 14 LNG annual consumption actual and forecast, 2010-38, all scenarios, and compared to 2016 NGFR
30 Under the regulations, marine vessels must reduce their sulphur oxides (Sox) emissions from 3.5% to 0.5% by 2020 for non-emission control areas. See
http://www.imo.org/en/about/conventions/listofconventions/pages/international-convention-for-the-prevention-of-pollution-from-ships-(marpol).aspx.
31 See https://oilprice.com/Energy/Natural-Gas/Chinas-Gas-Storage-Capacity-Cant-Keep-Up-With-Demand-Growth.html.
© AEMO 2018 | 2018 Gas Statement of Opportunities 212.3 Maximum daily demand forecasts
Maximum daily demand forecasts have similar dynamics to those of the annual consumption forecasts, noting that:
• For most regions, maximum daily demand is determined by weather driving gas consumption for heating in winter
for consumption by households and commercial businesses and, to a smaller degree, industrial use.
• Trends show a forecast decline in maximum daily demand, exclusive of GPG, caused mostly by projected industrial
load reductions, gas to electric appliance switching, and (to a lesser extent) a warming climate.
Table 5 shows the 1-in-20-year forecast32 for all sectors combined. These forecast totals include unaccounted for gas
(UAFG) that is lost while being transported through the network33.
Table 5 Total 1-in-20 forecast maximum demand, all sectors, including UAFG, excluding GPG (TJ/ day)
Calendar NSW QLD (incl. LNG) QLD (LNG only) SA TAS VIC
year
Summer Winter Summer Winter Summer Winter Summer Winter Summer Winter Summer Winter
2019 329 509 4,224 4,231 3,882 3,882 115 163 22 24 632 1,261
2023 328 508 4,767 4,775 4,438 4,438 116 163 23 25 631 1,242
2028 322 492 4,836 4,844 4,509 4,509 114 158 24 26 616 1,206
2038 332 505 4,848 4,855 4,509 4,509 116 160 25 27 640 1,257
32 Maximum daily demand is forecast with a probability of exceedance (POE), referring to the likelihood the forecast will be met or exceeded. A 1-in-20-year (or 5%
POE) forecast is expected to be exceeded, on average, only once in 20 years, while a 1-in-2-year (50% POE) forecast is expected, on average, to be exceeded
every second year.
33 UAFG is metered entering the network, but does not reach consumers.
© AEMO 2018 | 2018 Gas Statement of Opportunities 22This chapter presents the outlook for producers to source sufficient supply to meet the demand projections presented in
Chapter 2, given the capabilities of the gas network to deliver gas to the point of consumption. The chapter focuses on
the short term, being the next four years from 2019 to 2022 (calendar years), and examines broader risks that may
influence the balance of supply and demand for gas.
3.1 Supply outlook
For the 2018 GSOO, AEMO has used producers’ forecast production to assess the adequacy of gas supply over the
next four years, from 2019 to 2022. Compared to the production forecast for 2019 received for the September
2017 GSOO Update, the outlook has improved, due to:
• A net increase of 7 PJ in projected eastern and south-eastern production. Forecast production from southern fields in
2019 is 16 PJ higher compared to the forecasts for the September GSOO Update, while forecast production from
both CSG and conventional gas fields in Queensland is 9 PJ lower.
• The development of the NGP, expected to connect new supplies from the Northern Territory to Mt Isa in Queensland
by December 2018. Capacity of this pipeline will provide access to up to 31 PJ of gas per year from Northern
Territory gas sources, including the Blacktip and Mereenie gas fields.
Table 6 shows the production forecast between 2019 and 2022 provided to AEMO by gas producers as their current
best estimate. Gas production in these projections is forecast to increase annual field output by 144 PJ between 2019
and 2022 across both the south and the north. The largest increases are forecast in northern gas fields, to meet
forecast growth in LNG exports. This increased forecast of CSG production from the north is highly reliant on large
numbers of wells continuing to be drilled and constructed annually.
These production forecasts contain volumes of undeveloped reserves and contingent resources, as advised by
gas producers. Investment in exploration and development will be required to bring these reserves and resources
to market.
In 2019, total forecast production in the Neutral scenario is now about 58 PJ above forecast demand, although
utilisation will depend on whether supply can be delivered where it is needed. AEMO estimates around 37 PJ of
this supply buffer could be available to cover variability in Neutral scenario demand before pipeline constraints
become limiting.
Table 6 Production forecasts to 2022 (PJ), as provided by gas producers
2019 2020 2021 2022
VIC/NSW/SAA 452 483 463 479
QLD/NTA 1,486 1,561 1,636 1,603
Total production 1,938 2,044 2,099 2,082
A. The Queensland component of the Cooper Eromanga basin appears in the SA category.
These minor changes in total forecast production and demand have resulted in an improved outlook for gas supply
adequacy compared to the September 2017 GSOO Update. There is now projected to be sufficient gas supply to
meet forecast demand in the next four years in the Neutral scenario, as shown in Figure 15. This figure shows the
updated 2019 demand forecast compared to the September 2017 GSOO Update, with the current forecast
increasing slightly to 2022. The slight excess supply in the short term may be used to fill storage facilities or be
available for consumption should expected developments of reserves or contingent resources not progress as planned.
© AEMO 2018 | 2018 Gas Statement of Opportunities 23Figure 15 Demand and production forecasts compared to the September 2017 GSOO Update
In the Neutral demand scenario:
• Production from gas fields located in the southern states is mostly sufficient to meet southern domestic demand,
although some net imports from the north is required.
• Northern imports are predominantly observed in winter, with minimal southerly flows at other times.
In the Strong scenario:
• There is sufficient projected supply to meet forecast demand until 2021, so long as Queensland CSG production can
ramp up to support the increased LNG demand in the Strong scenario. Otherwise, LNG supply gaps of up to 123 PJ
are projected by 2022, indicating that the forecast stronger LNG demand is unlikely to be realised.
• In the short term, forecast strong peak gas demand in the southern states is projected to be met from a combination
of southern production, withdrawals from storage, and imports via the South West Queensland Pipeline (SWQP). If
volumes from storage were not available to help meet winter peak demand, then even greater imports from the
north would be required.
• From 2021, given the forecast increased reliance on northern flows to meet winter demand in the south, modelling
indicates that constraints around production and processing capacities in Queensland could start to limit the amount
of support the north can provide to the south.
In the Weak scenario:
• A lower demand forecast across all sectors leads to no supply gaps being projected across the full 20-year outlook.
• This lower demand forecast also delays the projected need for undeveloped reserves and contingent resources
to come online relative to other scenarios, and would require smaller quantities. Prospective resources are not
projected to be required in this scenario.
Reserves and resources
The 2017 GSOO highlighted that the rate of exploration and development of oil and gas wells drilled in Australia
has declined rapidly over the last few years.
The Australian Bureau of Statistics (ABS) provides estimates of investment in oil and gas exploration34 which show a
marked decline since peaking in June 2015, as can be seen in Figure 16. Although there has been some small
improvement from mid-2016, levels of exploration are still below those seen since 2012.
Eastern and south-eastern Australian natural gas 2P developed reserves have increased relative to the 2017 GSOO
estimates, but, consistent with the ABS exploration estimates, 2P reserves (developed and undeveloped) overall have
reduced by approximately 5,000 PJ, and 2C contingent resources have reduced by 10,000 PJ.
34 Exploration expenditure data is available at http://www.abs.gov.au/ausstats/abs@.nsf/mf/8412.0, and oil price history is available at
https://tradingeconomics.com/commodity/crude-oil.
© AEMO 2018 | 2018 Gas Statement of Opportunities 24You can also read