Bombardier Business Aircraft | Market Forecast 2011-2030 - Digitaal Publiceren.com

Page created by Johnnie Rodriguez
 
CONTINUE READING
Bombardier Business Aircraft | Market Forecast 2011-2030 - Digitaal Publiceren.com
Bombardier Business Aircraft | Market Forecast 2011-2030
Bombardier Business Aircraft | Market Forecast 2011-2030 - Digitaal Publiceren.com
table of contents                    Bombardier Business Aircraft   | Market Forecast 2011-2030   02

              executive summary                                                         03

    historical market performance                                                       07

            current market drivers                                                      10

                     the forecast                                                       22

                       conclusion                                                       47
Bombardier Business Aircraft | Market Forecast 2011-2030 - Digitaal Publiceren.com
Bombardier Business Aircraft   | Market Forecast 2011-2030   03

executive summary
Bombardier Business Aircraft | Market Forecast 2011-2030 - Digitaal Publiceren.com
executive summary                                                                                                                          Bombardier Business Aircraft   | Market Forecast 2011-2030   04

                                                Industry Order and Delivery Units
                                                Calendar years, 2001-2010

                                                                           2,000
                                                                           1,800
                                                                           1,600
                                                                           1,400
                                                                           1,200

                                                Order and Delivery Units
                                                                           1,000
                                                                             800
                                                                             600
                                                                             400
                                                                             200
                                                                               0
                                                                            -200
                                                                            -400
                                                                            -600
                                                                            -800
                                                                           -1,000

Bombardier Aerospace is pleased to present                                               2001      2002      2003       2004      2005           2006   2007    2008        2009    2010
the 2011 edition of its Business Aircraft
                                                                                    Total Orders     Total Deliveries
Market Forecast. The forecast for Business
Aircraft presents a 20-year outlook of the      Sources: Actual deliveries from GAMA. Orders estimated from competitive intelligence, OEM guidance.
                                                Excludes Very Light Jet and Large Corporate Airline categories.
business jet industry. The 20-year time span,
from 2011 to 2030, reflects Bombardier’s
long-term vision of the business jet market.
The time span of the forecast considers         Bombardier remains confident of
the typical life-cycle of aircraft programs.
The 2011 forecast also includes an in-depth
look at the market drivers in the major
                                                the strong long-term potential for
regions of the world.                           the business aircraft industry.
Bombardier Business Aircraft | Market Forecast 2011-2030 - Digitaal Publiceren.com
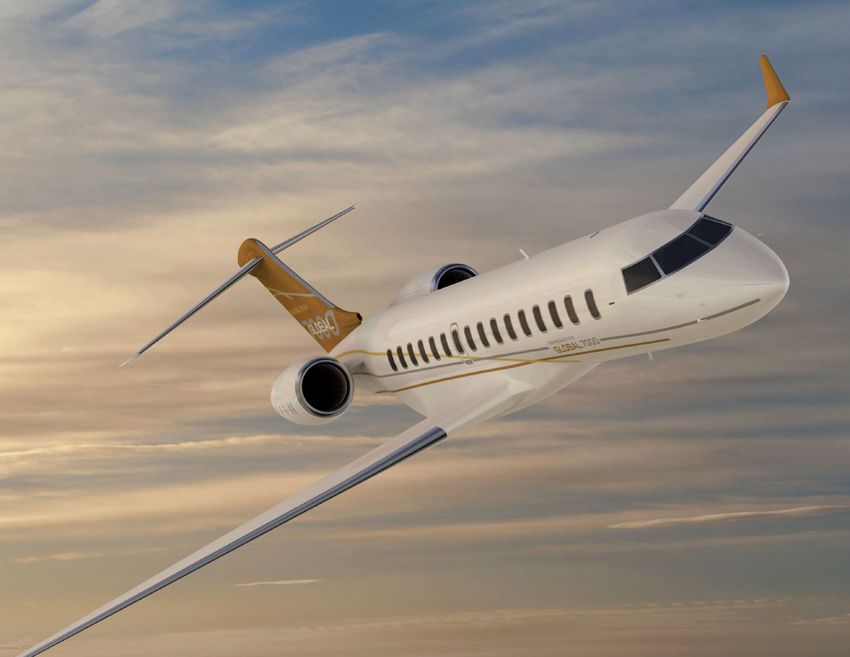
executive summary                                                                                                              Bombardier Business Aircraft   | Market Forecast 2011-2030   05

Industry Net Orders
Units, 2010, Q1-2011

                  180

                  73
                                                                   111

                                                                   34

                  107                    59%
                                                                   77    69%

                 2010                                          Q1-11

                         Bombardier                      Other OEMs
                                                                               development roadmap, Bombardier plans               market has turned the corner and is gaining
Source: Manufacturer disclosures and Bombardier estimates.
Excludes Very Light Jet and Large Corporate Airlines categories.               to benefit from the expected long-term              momentum. The world economy rebounded
                                                                               market growth and continue leading the              nicely in 2010, led by high growth economies
Bombardier is emerging as a clear industry                                     way in business aviation.                           (China, India and Brazil) and sustained by
leader as the market recovers from the 2009                                                                                        a recovering United States. On the other
downturn. In 2010, Bombardier recorded                                         This forecast focuses on the three business         hand, lagging growth in Europe, was and
more orders than all its competitors, with                                     jet categories in which Bombardier competes:        remains, a concern. Most key business jet
107. Again, in Q1-2011, Bombardier                                             Light, Medium and Large. The Very Light and         indicators are showing signs of improvement.
recorded 77 net orders, equivalent to a                                        Large Corporate Airliner categories are excluded.   Sales of used aircraft are rising to pre-downturn
market share of approximately 69%.                                                                                                 levels and, as a result, pre-owned inventories
                                                                               Turning the Corner                                  are declining.
Bombardier remains confident of the strong
                                                                               The business jet industry was clearly reminded
long-term potential for the business aircraft                                                                                      Business jet utilization, as measured by
                                                                               of its cyclical nature when, in 2009, the pre-
industry and maintains its focus on strength-                                                                                      movements, is up. Industry deliveries are
                                                                               cipitous and rapid decline of the demand
ening its market leadership position by                                                                                            not expected to improve significantly in 2011;
                                                                               resulted in cancellations exceeding gross
continuing to invest in its development                                                                                            however, signs of a market recovery are plenty,
                                                                               orders, which caused a significant reduction
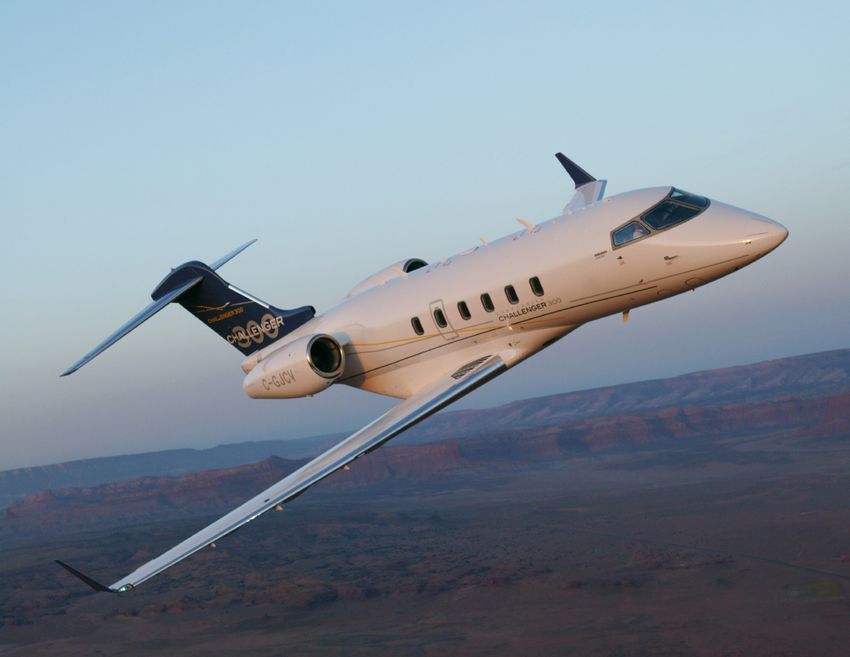
programs: the Global 7000 and Global 8000                                                                                          and it is expected that business aircraft
                                                                               in firm order backlogs and aircraft deliveries.
jets, Learjet 85 aircraft and Global Vision                                                                                        market deliveries will return to growth in
flight deck. With its comprehensive product                                                                                        2012. The forecast will detail the expected
                                                                               Today, the business aircraft industry’s improving
portfolio, dedication to provide superior                                                                                          timeline and magnitude of the business jet
                                                                               book-to-bill ratio is a positive signal that the
customer support and solid product                                                                                                 industry comeback.
Bombardier Business Aircraft | Market Forecast 2011-2030 - Digitaal Publiceren.com
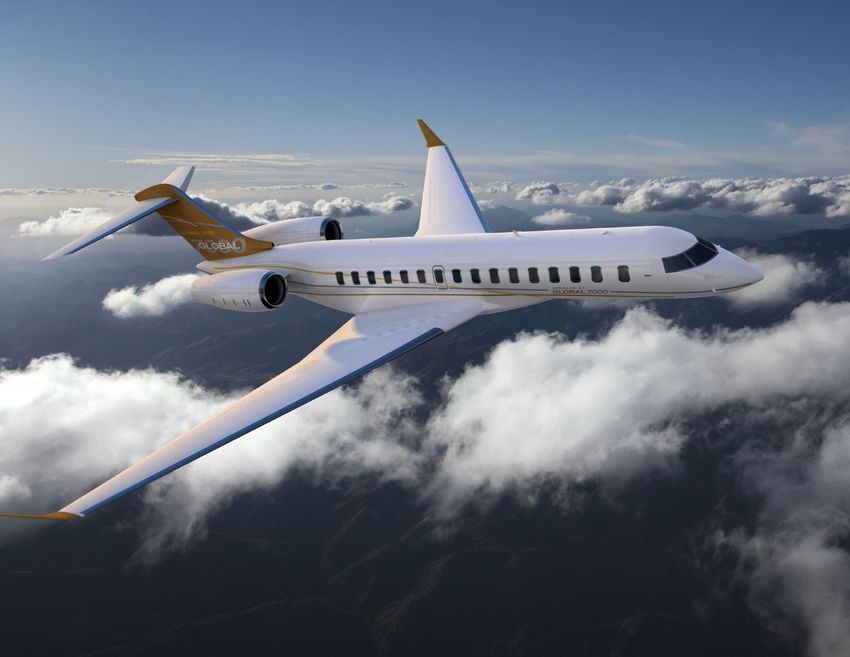
executive summary                                                                                                               Bombardier Business Aircraft       | Market Forecast 2011-2030             06

Business Jet Value Proposition                                      A Long-term Vision for the                                          $260 billion are anticipated in the period
Business jets provide fast, flexible, safe,                         Industry                                                            from 2011 to 2020, and 14,000 deliveries
secure and cost-effective access to destina-                                                                                            worth $366 billion are anticipated in the
                                                                    We believe that the long-term market drivers                        period from 2021 to 2030.
tions around the world. In addition to the
                                                                    of growth for the business jet industry remain
increased productivity and time saving
                                                                    solid. These market drivers include: wealth                         The worldwide business jet fleet is expected
gained when using a business jet, there exist
                                                                    creation, increasing penetration in high                            to grow, at a Compound Annual Growth Rate
other less quantifiable, but equally important,
                                                                    growth economies, globalization of trade,                           (CAGR) of 3.8% over the forecast period,
benefits. These include: on-demand flight
                                                                    replacement demand, and market accessibility.                       from 14,700 aircraft in 2010 to approximately
schedules, the ability to conduct business
meetings in private during flights, easier access                                                                                       30,900 aircraft by 2030, net of retirements.
                                                                    Our optimism is reflected in our 20-year
to company’s sites (which may not be served
                                                                    industry delivery forecast, which predicts
by a scheduled airlines), and reduced fatigue
                                                                    24,000 business jet deliveries worth $626
on company’s frequent travelers.
                                                                    billion of revenue. 10,000 deliveries worth
In an increasingly competitive and global
marketplace, business aviation is truly a tool
that directly contributes to growth.                                                               Business Jet Fleet Forecast
                                                                                                   Units, calendar years 2010-2030

                                                                                                                                                                                  4,700

                                                                                                                                                                    14,000

Business Jet Market History and Forecast
                                                                                                                                           3,100

                                                                                                                        10,000

                              Historical                     Forecast                                                                                                                          30,900

                              2001-2010       2011-2020      2021-2030       2011-2030                                                                 21,600

                                                                                                      14,700
   Delivery Units                    6,400      10,000         14,000          24,000

      Revenues                 $133 billion   $260 billion   $366 billion    $626 billion
                                                                                                   Fleet 2010          Deliveries       Retirements   Fleet 2020   Deliveries   Retirements   Fleet 2030

Source: Bombardier Forecast Model.                                                                 Source: Bombardier Forecast Model.
Bombardier Business Aircraft | Market Forecast 2011-2030 - Digitaal Publiceren.com
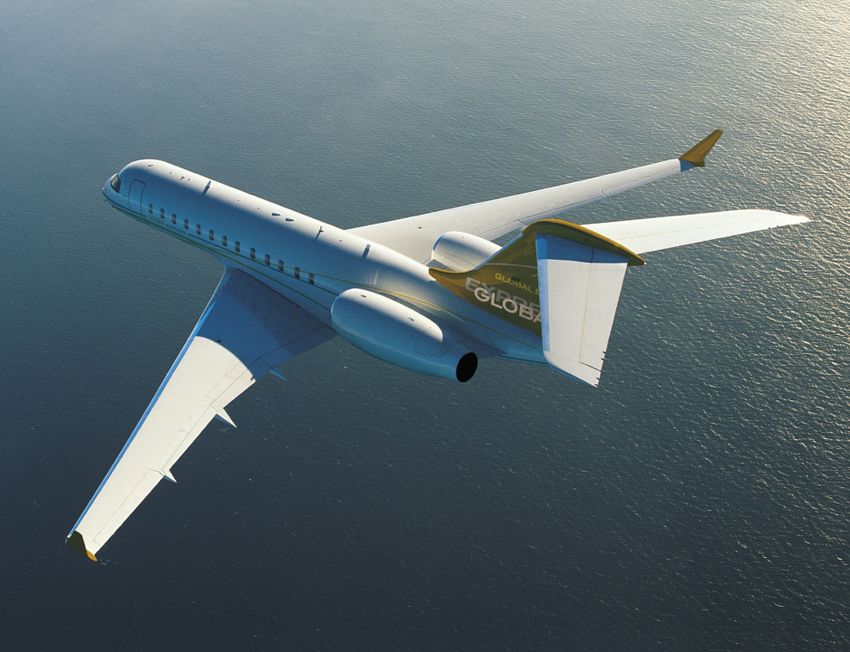
Bombardier Business Aircraft   | Market Forecast 2011-2030   07

historical market performance
Bombardier Business Aircraft | Market Forecast 2011-2030 - Digitaal Publiceren.com
historical market performance                                                                                                              Bombardier Business Aircraft                   | Market Forecast 2011-2030                  08

                                                 Historical Business Jet Market Deliveries
                                                 Units, calendar years 1965-2010
                                                                                                                                                                                                                                2010
                                                  1,000

                                                     900                                                                                                                                  CAGR = 9%

                                                     800

                                                     700

                                                     600

                                                     500

                                                     400
Over the past 40 years, the industry has been                                  CAGR = 4%
defined by multiple market cycles. From 1965         300
to 1995, the business jet deliveries CAGR
                                                     200
was at 4%, with most of the growth coming
from the main market, the United States.
                                                     100
After 1995, the business jet industry began
rapidly expanding to other regions of the               0
world, generating much higher growth, 9%
                                                               1965

                                                                      1967

                                                                             1969

                                                                                        1971

                                                                                               1973

                                                                                                      1975

                                                                                                             1977

                                                                                                                    1979

                                                                                                                           1981

                                                                                                                                  1983

                                                                                                                                         1985

                                                                                                                                                1987

                                                                                                                                                       1989

                                                                                                                                                              1991

                                                                                                                                                                     1993

                                                                                                                                                                            1995

                                                                                                                                                                                   1997

                                                                                                                                                                                           1999

                                                                                                                                                                                                  2001

                                                                                                                                                                                                         2003

                                                                                                                                                                                                                2005

                                                                                                                                                                                                                       2007

                                                                                                                                                                                                                              2009
per year on average.

                                                                                                                                     Business Jet Deliveries
2004 to 2008
                                                 Source: Actual deliveries from GAMA.
Following the 2001-2003 downturn, the
U.S. economy regained its momentum and
the demand for business jets significantly
rose between 2004 and 2007. New business
aircraft markets such as Europe, Asia and the
                                                 Demand for business jets rose
Middle East began to generate substantial
demand. Moreover, the launch of new,             significantly in between 2004-2007.
innovative aircraft pushed orders even higher.
The 841-unit delivery record set in 2007 was
Bombardier Business Aircraft | Market Forecast 2011-2030 - Digitaal Publiceren.com
historical market performance                                                                                                   Bombardier Business Aircraft   | Market Forecast 2011-2030   09

                                                   Historical Business Jet Market Revenues
                                                   US$B, calendar years 2001-2010

                                                   Revenues ($US Billion)
                                                                                                                                                         19.8
                                                                                                                                               17.2
shattered in 2008, with deliveries totalling                                                                                        14.8                             15.0      15.2
927 units for the year. Record sales, as well                                                                            12.2
                                                                            11.0
as a shift in buyer interest toward larger                                              9.1                       9.7
                                                                                                    7.6
aircraft, explain the peak of $19.8 billion
in industry revenue reached in 2008.

2008                                                                        2001       2002        2003           2004   2005       2006      2007       2008        2009     2010

The near-collapse of financial markets at the                                All segments in which Bombardier competes
end of 2008 precipitated a sharp downturn in
                                                    Sources: Revenues estimated from GAMA and B&CA list prices.
business aviation. Order activity stalled begin-
ning in the last quarter of 2008 and onwards.
The inventory of pre-owned aircraft for sale
increased dramatically and residual values
                                                   Since H2-2009                                                                    flight activity in the U.S. and Europe respec-
took a significant hit. Moreover, OEMs juggled
                                                                                                                                    tively. Business jet utilization is at its highest
with cancellations and deferrals. We estimate      Since the second half of 2009, business jet
                                                                                                                                    levels since 2007 in both regions.
that more than 800 order cancellations             usage has increased and pre-owned inventory
were recorded in 2009 in the Light to Large        has been declining. Credit availability has also
                                                                                                                                    Recently, we have experienced the resurgence
categories. These unfavourable market              recovered. Market fundamentals improved
                                                                                                                                    of multiple aircraft deals. Most aircraft OEMs
conditions forced most OEMs to decrease            significantly in the past 2 years; approximately
                                                                                                                                    are now recording positive net order intake,
their production that same year. The trough,       500 fewer aircraft for sale on the pre-owned
                                                                                                                                    signaling that the market has moved to its
in terms of market conditions, was reached         market (a drop of 3.4 percentage points,
                                                                                                                                    second phase of recovery.
in the first half of 2009.                         to 14.4% in Q1-2011); 22% and 12% more
Bombardier Business Aircraft | Market Forecast 2011-2030 - Digitaal Publiceren.com
Bombardier Business Aircraft   | Market Forecast 2011-2030   10

current market drivers
current market drivers                                                                                           Bombardier Business Aircraft   | Market Forecast 2011-2030   11

The Bombardier Aerospace Business Aircraft
Market Forecast uses an econometric model
                                                  Demand for business jets is increasing with
based on several market drivers to forecast
business jet demand. The most significant
                                                  the resumption of global economic growth.
drivers are detailed below.                       Prospect for World GDP Growth
                                                  World GDP growth forecast (percent change), 2007-2013

Economic Market Drivers                            5%

Global Economy                                     4%
                                                                  4.0%                                    3.9%
The state of the world economy, and that                                                                               3.5%         3.5%           3.7%
                                                   3%
of individual countries, is a key factor in the
demand for air travel. For most of 2008 and
                                                   2%
2009, the worldwide economy experienced a
sharp downturn. The last recession was the                                              1.6%
                                                   1%
result of a major financial crisis that had an
impact in all regions of the globe, when world
                                                   0%
real GDP shrank at an annual rate of 2.1%
in 2009. Concerted efforts by all state
                                                  -1%
governments helped the economy to find
the path toward growth in the second half of      -2%
                                                                                                -2.1%

2009. As a result, the world GDP rebounded
by 3.9% in 2010, led by strong growth in          -3%
emerging economies and an improved U.S.                           2007                 2008     2009      2010         2011         2012           2013

economy. For 2011, the world economy is           Sources: IHS Global Insight, February 2011.

expected to continue growing at an annual
rate of 3.5%, and to stabilize at approximate-
ly 3.4% per year in the longer term.
                                                  recovery seems, however, to be in the                              International Monetary Fund talks about a
In its June 2011 Economic Outlook, the            process of becoming self-sustained, with                           two-speed recovery. They expect the world
OECD stated: “This is a delicate moment for       trade and investment gradually replacing                           economy to grow at about 4.5% a year in
the global economy, and the crisis is not         fiscal and monetary stimulus as the                                both 2011 and 2012, but with advanced
over until our economies are creating enough      principal drivers of economic growth.                              economies growing at only 2.5% percent,
jobs again.” More than 50 million people are                                                                         and emerging and developing economies
currently jobless in the OECD area. The           In its latest World Economic Outlook, the                          grow at a much higher 6.5% percent.
current market drivers                                                                                                                             Bombardier Business Aircraft   | Market Forecast 2011-2030   12

Basically, in most advanced economies,                                       fundamentals of the business jet industry                                 MSCI World Index literally doubled, mainly
output is still far below potential, while in                                are expected to remain unchanged.                                         driven by growing prices for oil, natural
emerging market economies the crisis                                                                                                                   resources, and commodities. Most of these
left no lasting wounds.                                                      Wealth Creation                                                           gains were lost in a single year, as, between
                                                                                                                                                       2007 and 2008, the MSCI World Index fell
                                                                             Worldwide demand for business jets is
The significant economic downturn of 2008-                                                                                                             42%. Business aircraft orders stalled at the
                                                                             highly correlated with wealth creation. The
2009 resulted in a major short-term reduction                                                                                                          same time the MSCI World Index plummeted.
                                                                             Morgan Stanley Capital International (MSCI)
in demand for business jets. As expected,
                                                                             Index is an aggregate stock market index,
this demand, as measured by orders, is
                                                                             based on representative securities listed in
increasing with the resumption of global
                                                                             major financial exchanges around the world.
economic growth. This trend is expected
                                                                             The MSCI World Index is a good estimate of
to translate into a sustained recovery in
                                                                             wealth creation. From 2002 to 2007, the
demand for business jets. The sound

MSCI Index Evolution By Region                                               MSCI World Index
2002 = 100, Calendar years, 2002-2011                                        Calendar years, 2001-2010

                                        2002       2007      April   April
                                       (base)    (at peak)   2009    2011    2,000

   North America                         100       176       105     144

   Europe                                100       245       122     157

   Latin America                         100       668       384     628     1,500

   Russia                                100       567       188     311

   India                                 100       699       287     523

   Middle East                           100       367       185     232     1,000

   China                                 100       605       327     452

   Asia Pacific                          100       250       144     199

   Africa                                100       593       223     272       500

   World                                 100       201       113     151

Sources: MSCI World Index from Morgan Stanley.
                                                                                  0
                                                                                             2001           2002              2003   2004   2005      2006      2007      2008       2009     2010

                                                                             Sources: MSCI World Index from Morgan Stanley.
current market drivers                                                                                                      Bombardier Business Aircraft    | Market Forecast 2011-2030    13

Stock markets have rebounded nicely since          Number of Billionaires
March 2009. The MSCI World Index grew              Unit & % Change 2010-2011

by 60% from March 2009 to June 2010.
                                                                     500
Growth has been consistent during that                                                                                    World 2010: 1,011                                       2010
15-month period, with the exception of spring                                    427 428
2010, which was characterized by high                                400
                                                                                                                          World 2011: 1,210                                       2011

market uncertainty due to sovereign debt
problems in Europe. The MSCI World Index
ended 2010 at levels last seen during the                            300
                                                   Number of
third quarter of 2008. Although the MSCI           Billionaires
World Index has increased for more than
                                                                     200                            182 192
two years, full recovery of business jet                                                                            178

order intake has been lagging.                                                                                                  116
                                                                                                              107
                                                                     100                                                   72              95          86
                                                                                                                                      72          62
A March 2011 report from Forbes estimated                                                                                                                     49
                                                                                                                                                                   56
                                                                                                                                                                        36
                                                                                                                                                                             53
the number of world billionaires at 1,210,
                                                                                                                                                                                  4   6
surpassing the prior peak of 1,123 reached                               0

in 2008. The March 2011 count of billionaires
represents a 20% increase versus one year                                         North             Europe    China        Russia       Asia      Middle       India     Latin    Africa
                                                                                 America                                   & CIS      ex. China    East                 America
ago and 53% versus 2009. The most
significant growth in the number of billionaires    % Change
                                                                                   0%                5%       66%          61%         32%        39%         14%       47%       50%
                                                   2011 vs 2010
occurred in China with a very impressive
increase of 66% year-over-year followed by         Sources: Forbes.com March 2010 and March 2011.

Russia & CIS (61%) and Latin America (47%).

                                                   The number of billionaires increased 20% versus last year.
current market drivers                                                                                                                     Bombardier Business Aircraft          | Market Forecast 2011-2030            14

                                                                              Business Jet Market Drivers
                                                                              Business Jet Utilization
                                                                              Historically, business jet utilization is an                       Both in the U.S. and in Europe, although
                                                                              indication of the overall health of the industry.                  utilization levels are not yet back to pre-
                                                                              The Federal Aviation Administration (FAA) and                      recession levels, business jet movements
                                                                              Eurocontrol record the number of take-offs                         continued to improve during 2011, relative
                                                                              and landings at American and European                              to the same period in 2010. In Q1-2011,
                                                                              airports respectively.                                             business jet utilization was up 5% year-
                                                                                                                                                 over-year in the U.S. and 3% in Europe.

US Business Jet Utilization                                                                                 European Business Jet Utilization
All business jets, Thousand departures and landings, 2009-2011                                              All business jets, Thousand departures and landings, 2009-2011

                                                       16%         15%
                                                                              10%        8%
                                                                                                       5%
                                            0%                                                                                                                       9%                    7%
                                                                                                                                                                                6%                   5%            3%
                                                                                                                                                       0%
                            -12%
                                                                                                                                         -13%
                -24%
  -30%                                                                       1,018     1,019      1,006       -22%           -20%
                                                                  1,001
                              927          945          960
                 874
    826                                                                                                                                                                                   133
                                                                                                                                          124                                   120
                                                                                                                                   113                                                               108
                                                                                                                                                       103           97                                        100
                                                                                                                  89

  Q1 09         Q2 09        Q3 09        Q4 09        Q1 10       Q2 10     Q3 10      Q4 10     Q1 11       Q1 09           Q2 09      Q3 09        Q4 09        Q1 10       Q2 10     Q3 10      Q4 10     Q1 11

               Departures and Landings ('000)                 Departures and Landings Growth YoY (%)                        Departures and Landings ('000)                Departures and Landings Growth YoY (%)

Source: FAA.                                                                                                Source: Eurocontrol.
current market drivers                                                                                                                     Bombardier Business Aircraft        | Market Forecast 2011-2030               15

Backlog                                             Industry Backlog                                                                                         Industry Backlog
                                                    Estimated units, calendar years 2001-2010                                                                Estimated Value ($B), Q1-11
Backlog refers to the total number of orders
not yet delivered. In the business aircraft         3,000                                                                                                                                $48.3B
industry, order backlog indicates potential
for deliveries in the upcoming years. OEMs
                                                    2,500
adjust their production rates based on their                                                                                                                                                           Light:
current backlog levels and their expectations                                                                                                                                                        $7.3 B
regarding the number of orders they can             2,000

obtain in the future. Production rate changes
are a costly and complex matter, due to the                                                                                                                                                                    Medium:
                                                    1,500
expenses associated with hiring or laying-off                                                                                                                                                                   $8.0 B
                                                                                                                                                                        Large:
employees, as well as adjustments to the
                                                    1,000
                                                                                                                                                                      $33.0 B
supply chain and scheduling. Therefore,
manufacturers aim to smooth out their pro-
duction rates to maximize deliveries while            500

minimizing the risk of frequent changes.
                                                         0                                                                                                   Sources: Orders estimated from competitive intelligence,
                                                                                                                                                             OEM guidance, 2011 List price from B&CA.
In terms of business jet industry orders,
                                                                 2001     2002      2003      2004     2005      2006        2007   2008   2009   2010
2007 was a record year, with close to 1,800
                                                    Sources: Orders estimated from competitive intelligence, OEM guidance.
estimated orders for the Light, Medium and
Large aircraft categories. The first half of 2008
continued to be strong, as manufacturers            The Medium category, although enduring                                                     Moving forward, reduced near-term deliveries
recorded more than 1,300 orders. The overall        decreasing production rates, was affected to                                               combined with the progressive return to
industry backlog peaked during 2008 at more         a lesser extent, and the Large aircraft category                                           positive industry net orders should result
than 3,000 units. However, toward the end of        was only slightly affected.                                                                in industry backlogs stabilizing and growing,
2008, the economic downturn led to an                                                                                                          with the Large aircraft category leading the
abrupt drop in orders and a significant             We estimated the industry backlog at about                                                 next up-cycle.
number of cancellations.                            1,400 aircraft at the end of Q1-2011. This
                                                    corresponds to an estimated value of $48
The Light aircraft category was affected            billion, $30 billion less than a few days prior
the most by order cancellations and, as a           to the Lehman Brothers collapse (Q3-2008).
result, experienced the greatest changes            Deliveries decreased by 43% between
in production rates.                                2008 and 2010.
current market drivers                                                                                                                                                            Bombardier Business Aircraft                        | Market Forecast 2011-2030         16

The Pre-Owned Aircraft Market                                                                          likely to purchase a replacement. The accumu-                                     Through the first half of 2008, residual values
                                                                                                       lation of aircraft on the pre-owned market was                                    were still high due to manufacturers’ long
Over 60% of new business jet orders represent
                                                                                                       a leading indicator of the new business aircraft                                  backlogs. Since then, residual values have
replacement aircraft for current owners.
                                                                                                       market downturn that started in Q4-2008. At                                       dropped across all aircraft categories. During
The demand for new aircraft is stimulated by
                                                                                                       the end of 2007, the pre-owned inventory was                                      2009, average business jet residual values fell
the conditions prevailing on the pre-owned
                                                                                                       sitting at a low of 10.5%. The level started to                                   by 17 percentage points. In the first quarter
market. This market is considered healthy
                                                                                                       climb in the beginning of 2008 and peaked at                                      of 2011, residual values appeared to be
when residual values are high and when the
                                                                                                       17.8% in Q2-2009. During the second half of                                       bottoming.
inventory of used aircraft for sale is low.
                                                                                                       2009, as pre-owned sales activity strength-
                                                                                                       ened, inventory started to decline steadily.
In the beginning of 2008, the percentage of
                                                                                                       By Q1-2011, pre-owned inventories had
the overall business jet fleet for sale on the
                                                                                                       fallen to 14.4%, continuing a gradually
pre-owned market started to increase rapidly.
                                                                                                       improving trend. We expect pre-owned
Many owners experienced difficulties selling
                                                                                                       inventory levels to stabilize forward in a range
their aircraft, which, in turn, made them less
                                                                                                       of 11% to 13%.

Pre-Owned Aircraft Inventory as a % of the Fleet                                                                             5-Year Residual Value as a % of the Original B&CA List Price
%, calendar years 2005-2011                                                                                                  All business jets, %, calendar years 2005-2011

                                                                                                                                                                                                       92% 91%
                                                                                                                                                                                                 89%
                                                                                         17.8%                                                                            86% 86% 86% 86%
                                                                                                                                                    83% 83% 84% 83%                                               82% 81%
                                                                                                                                     80% 81%
                                                                                                                             78% 79%

                                                                                                                     14.4%
                                                                                                                                                                                                                                 67% 66% 65% 67%
                                                                                                                                                                                                                                                 65%
                                                                                                                                                                                                                                                          63%
                                                                                                                                                                                                                                                                61% 61%

                                                         10.5%

 Q1 Q2 Q3 Q4 Q1 Q2 Q3 Q4 Q1 Q2 Q3 Q4                             Q1 Q2 Q3 Q4 Q1 Q2 Q3 Q4 Q1 Q2 Q3 Q4 Q1                       Q1   Q2    Q3    Q4   Q1    Q2    Q3   Q4    Q1    Q2   Q3    Q4    Q1    Q2   Q3    Q4       Q1   Q2   Q3   Q4   Q1   Q2   Q3    Q4   Q1
 05 05 05 05 06 06 06 06 07 07 07 07                             08 08 08 08 09 09 09 09 10 10 10 10 11                       05   05    05    05   06    06    06   06    07    07   07    07    08    08   08    08       09   09   09   09   10   10   10    10   11

Sources: Aircraft inventory and fleet from JETNET. Excludes Very Light Jet and Large Corporate Airline categories.           Sources: Residual values from Aircraft Bluebook Price Digest, original list price from B&CA.
current market drivers                                                                                                                        Bombardier Business Aircraft        | Market Forecast 2011-2030   17

New Aircraft Programs                                    Entry Into Service of New Programs
                                                         Entry into service by model, calendar years 2011-2017
Continued progress, notably in engine
specific fuel consumption, avionics and
aerodynamics allows aircraft models from                      2011                 2012                 2013                  2014                2015             2016           2017
the latest generation to offer for a comparable
price, more range, performance and features                   G250                 G650              Citation Ten                                                  Global       Global
                                                                                                                                                                    7000         8000
than those of the previous generation. The                                   Global Vision            Learjet 85
launch of new airplane programs reflects                                      Hawker 200             Legacy 450

OEMs’ ability to apply the latest technology                                  Legacy 500            Falcon 2000S

breakthroughs to their product lines, the                Sources: Dates of entry from competitors’ press releases and trade media coverage.

market need for more performing aircraft,
and the OEMs’ confidence in the
marketplace going forward.
                                                          Air Travel Options
Three aircraft were launched in 2010,
including Bombardier’s Global 7000                                      Commercial-aviation                                                               Business jet market
                                                                            offering
and Global 8000 jets.
                                                                                                                                    On-demand service                       Business jet ownership

Fractional and Branded
Charter Demand
                                                   +                                                                                                                                       Full
Fractional ownership (where several users                                                                                                                                                ownership
                                                  Per
acquire a portion of the same aircraft)
has existed since the mid-1990’s and has          Year                                                                                                                      Fractional
                                                                                                                                                                            ownership
accounted for 10% to 15% of industry               -
                                                                                                                                                              Jet-card
yearly deliveries on average. In the period                                                                                                                   programs

from 1995 to 2010, fractional operators                                                                                                        Branded
                                                                                                                                               Charters
took delivery of over 1,150 corporate jets.                                                                                Air Taxis
Subsequent variations of this business                                                               First-class
                                                                                 Commercial          commercial
model include “fractional card” or “jet card”                  Low cost            airlines            airlines
                                                                airlines
programs whereby customers obtain
on-demand access to a business jet by                                                                                      Personalized service

committing to a predetermined number                      Source: Bombardier’s internal research department.
current market drivers                                                                                                                      Bombardier Business Aircraft   | Market Forecast 2011-2030   18

of flight hours per year, without the obligation   Business Jet Fractional Order and Delivery Units
to purchase shares in any aircraft.                Units, Calendar years 2001-2010

                                                                               500
There are four large operators in the fractional
ownership industry, among them NetJets
and Flexjet by Bombardier. The fractional
ownership industry went through a period of                                    300
fleet rationalisation during 2009, resulting in

                                                    Order and Delivery Units
a substantial reduction of its order backlog.
Since then, backlogs have resumed growing;
                                                                               100
in particular, NetJets placed significant
volume orders for new business jets in
2010 and early 2011.
                                                                               -100
The growth in the number of branded charter
operators is a more recent trend. These
operators offer on-demand flight with
competitive trip-specific pricing. Branded                                     -300

charter operators are characterized by
sophisticated operations infrastructure,
and greater use of airline-style scheduling
                                                                               -500
practices in order to minimize deadhead costs.
                                                                                      2001   2002             2003                 2004   2005     2006      2007        2008     2009     2010

In 2008, branded charter operator orders                                                                     Fractional Orders                   Fractional Deliveries
represented approximately 20% to 30% of
total business jet orders. In 2009, the after-     Fractional operators includes: Flexjet, Netjets, CitationAir, Flight Options.
                                                   Sources: Deliveries from Ascend; Orders from competitive intelligence.
                                                   Excludes Very Light Jet and Large Corporate Airline categories.
math of the economic downturn caused
branded charter operators to resort to order
deferrals and cancellations. Larger operators,
such as VistaJet and Comlux, have returned
to growth and have placed orders for addi-         are returning to growth and are expected to
tional business jets in 2010 and early 2011.       account for approximately 10% of business
Fractional and branded charter operators           jet deliveries over the next 20 years.
current market drivers                                                                                                                      Bombardier Business Aircraft   | Market Forecast 2011-2030       19

Business Jet Penetration                                Penetration Rates by Region
                                                        Fleet per Capita vs. GDP per Capita, 1960-2010
in Growth Markets
Business jet penetration is a measure of                                                         10,000
the number of business jets in each of the
forecast regions relative to the size of that
                                                                                                                                                                        NORTH AMERICA
region’s economy, as measured by Gross                                                                                        1st driving
Domestic Product (GDP). The penetration                                                                                       force: GDP
                                                                                                                                                                                             Average

                                                  Fleet per 100 Million Population (Log Scale)
rate of business jets by region is highly                                                         1,000
                                                                                                                              growth
                                                                                                                                                                                           growth path
variable. The most established market for
business jets, North America, has the world’s
largest fleet which continues to grow, but at                                                                                   LATIN AMERICA
                                                                                                                                                                                        EUROPE &
a low rate. On the other hand, China has a                                                                                                                                              RUSSIA
very low number of business jets relative to                                                       100

the size of its economy and is now entering
a high growth rate phase for its business
jet fleet. In order to normalize for differing
population sizes in each region, penetration
                                                                                                    10
                                                                                                                MIDDLE-EAST                                                          2nd driving
rates and GDP are best compared on a                                                                            & AFRICA                              ASIA                             force:
per capita basis.                                                                                                                                                                    removal of
                                                                                                                                                                                      barriers
Growth of business jet fleets over the longer-
term in each region is best estimated by an
                                                                                                      1
expected market maturity curve. This curve,
                                                                                                          100                 1,000                            10,000                              100,000
an adaptation of the Bass diffusion curve first
published in 1969, resembles an “S” shape                                                                                        GDP per Capita (USD, Log Scale)
with the highest growth occurring in the early
                                                         Source: Fleet from Ascend, GDP and Population from IMF.
phases of market adoption and slowing
growth as the market matures.
                                                      The penetration rate of business jets by region is
                                                      highly variable; each region is at a different stage.
current market drivers                            Bombardier Business Aircraft   | Market Forecast 2011-2030   20

Projected GDP Growth can be used to
forecast the likely trajectory of the business
jet penetration for each region. Realization
of fleet growth implicitly assumes expected
adoption and acceptance of business jets and
the progressive removal of barriers to growth,
notably lack of adequate infrastructure and
regulatory limitations. As the economy
develops, the expected growth of the
business jet fleet in each region can be
reasonably predicted over the longer term.
Once fleets are netted of aircraft retirements,
business jet deliveries to each region can
be derived.

Goldman Sachs Asset Management has
recently introduced the term "Growth Market"
to define any country outside the developed
world that is responsible for at least 1% of
global GDP. These economies are most likely
to "experience rising productivity coupled
with favorable demographics and, therefore,
a faster growth rate than the world average
going forward". These include the BRIC
countries (Brazil, Russia, India and China)
and also Mexico, South Korea, Turkey and
Indonesia. We expect a significant share of
business jet deliveries to originate from
these Growth Markets.
current market drivers                                                                                                                                      Bombardier Business Aircraft                   | Market Forecast 2011-2030                21

Aircraft Retirements                                                                  Emissions Trading Scheme (ETS) in Europe                                    The amount of aircraft that retire within the
                                                                                      taking effect in 2012. The ETS will penalize                                forecast period will vary considerably by
As of early 2011, the average age of the
                                                                                      aircraft types with older technology engines                                region. Naturally, the regions having well-
worldwide business jet fleet was 15.7 years,
                                                                                      that burn more fuel and therefore emit more                                 established business jet fleets and older
with approximately 60% of the fleet being
                                                                                      greenhouse gas (CO2). Similarly, planned                                    average fleet ages will experience the
less than 15 years old. However, around 400
                                                                                      airspace modernization in the United States                                 greatest numbers of retirements. Regions
aircraft are in excess of 40 years.
                                                                                      (FAA NextGen), in Europe (Single European                                   that currently have relatively small business
                                                                                      Sky) and elsewhere will require advanced                                    jets fleets, such as China, will experience
To date, the total number of permanent
                                                                                      flight deck avionics technologies. It may not                               relatively fewer business jet retirements
retirements of business jets has been low.
                                                                                      be economically feasible to retrofit older                                  during the forecast period.
However, as a result of emerging environmental
                                                                                      aircraft cockpits with the required avionics
concerns, new regulations and airspace
                                                                                      technology, rendering these types obsolete.
modernization, the retirement of the oldest
business jets is expected to accelerate.
                                                                                      These dynamics will result in a reduction
Environmental regulations include potential
                                                                                      of the business jet fleet half-life (age at which
airport restrictions on Stage 2 business jet
                                                                                      50% of aircraft have retired) from 40 years
operations and the introduction of the
                                                                                      in 2010 to 30 years in 2030.

Cumulative Retirement By Age                                                                                      Overall Fleet By Age
%, 2010-2030                                                                                                      Units as of December 31, 2010

                        100                                                                                                       3,500
                         90                                                                                                                                         Fleet Overall Average Age: 15.7 years
                         80
                                                                                                                                          2,700
                         70                                                                                                                            2,400
 Aircraft Retired (%)

                         60
                                                                                                                  # of Aircraft

                                                     30 years                    40 years
                         50
                                                                                                                                                                                                1,600
                         40
                                                                                                                                                                    1,300
                                                                                                                                                                                  1,200                      1,200
                         30
                         20                                                                           2010
                                                                                                      2020
                         10                                                                           2030                                                                                                                  380       340
                          0                                                                                                                                                                                                                    55
                              0   5   10   15   20     25       30   35     40      45      50   55          60
                                                                                                                                   1-5    6-10         11-15        16-20         21-25         26-30        31-35         36-40      41-45   46-50
                                                     Aircraft Age (Years)
Source: BBA Market Forecast Model.
                                                                                                                                                                                    Age Bracket

                                                                                                                    Sources: Ascend Online as of December 31, 2011. Excludes Very Light Jet and Large Corporate Airline categories.
Bombardier Business Aircraft   | Market Forecast 2011-2030   22

        the forecast
the forecast                                                                                                   Bombardier Business Aircraft   | Market Forecast 2011-2030           23

Orders, Deliveries and                           Business Jet Industry 20-Year Deliveries Outlook
                                                 Units, calendar years, 1991-2030
Revenues
With the continued recovery of the worldwide                            1991-2000                2001-2010                   2011-2020                     2021-2030
economy in 2010 and 2011, leading indicators                           3,600 units               6,400 units                10,000 units                  14,000 units
for business aviation are improving, resulting
                                                 1600
in increased orders for new business jets
and much fewer cancellations. This trend         1400
is expected to continue, primarily driven by
growth in emerging markets and replacement       1200

demand in more established markets.
                                                 1000

However, industry deliveries tend to lag order    800

intake as manufacturers strive to maintain
                                                  600
acceptable backlog levels. As a result,
industry deliveries for 2011 are expected         400
to be relatively flat when compared to 2010
                                                  200
(approximately 530 aircraft). Improved orders
and backlog should result in increasing               0
industry deliveries beginning in 2012. The                91 92 93 94 95 96 97 98 99 00 01 02 03 04 05 06 07 08 09 10 11 12 13 14 15 16 17 18 19 20 21 22 23 24 25 26 27 28 29 30
recovery in deliveries is then expected to
be strong and we forecast that the industry      Sources: Bombardier Forecasting Model.

will surpass the prior delivery peak year
(2008) by as early as 2014.
                                                 Increased orders and backlog
                                                 should result in increasing industry
                                                 deliveries beginning in 2012.
the forecast                                                                                                   Bombardier Business Aircraft   | Market Forecast 2011-2030           24

                                                  Business Jet Market Revenues Forecast
                                                  Constant 2010 US$B, calendar years, 1991-2030

                                                                       1991-2000                  2001-2010                   2011-2020                     2021-2030
                                                                         $49 B                    $133 B                       $260 B                        $366 B
                                                    50

                                                    45

                                                    40

                                                    35

                                                    30

                                                    25

                                                    20

                                                    15
The delivery forecast shows demand for
10,000 aircraft that will generate $260 billion     10

in total revenue in the Light to Large busi-
                                                      5
ness jet categories over the 2011-2020
period, compared to 6,400 aircraft and                0
                                                          91 92 93 94 95 96 97 98 99 00 01 02 03 04 05 06 07 08 09 10 11 12 13 14 15 16 17 18 19 20 21 22 23 24 25 26 27 28 29 30
$133 billion in total revenue between 2001
and 2010. During the 2021-2030 period,            Sources: Bombardier Forecasting Model.

deliveries for these categories are expected
to total 14,000 aircraft for total revenues of
$366 billion. In 2030, OEMs should deliver
approximately 1,500 business jets.                The industry will generate
In summary, total deliveries over the 20-year     $260 billion over 2011-2020
forecast period (2011-2030) will be 24,000
aircraft worth $626 billion.                      and $366 billion over 2021-2030.
the forecast                                                                                                            Bombardier Business Aircraft   | Market Forecast 2011-2030   25

Regional Details
The Forecast is broken down into nine geographic regions: North America, Europe, China, India, Latin America, Russia and Commonwealth
of Independent States (CIS), Middle East, Africa, and Asia Pacific. Deliveries for each region are presented below in the form of two proportional
bubbles according to delivery quantities, where the inner bubble represents regional deliveries in the period 2011-2020, and the outer (larger)
bubble represents deliveries in the period 2021-2030.

Regional 10 and 20-Year Delivery Outlook
Units, calendar years, 2011-2020 and 2021-2030

                                                                                        Russia & CIS
                                                                                          2011-2020: 525
                                                                                        2021-2030: 1,010

                                                              Europe
                                                           2011-2020: 1,900
                                                           2021-2030: 2,200

    North America
     2011-2020: 4,200
     2021-2030: 5,400

                                                                                                                                                        China
                                                                                                                                                2011-2020: 960
                                                                                                                                              2021-2030: 1,400

                                                                                                             Middle
                                                                                                                East
                                                                                                       2011-2020: 410
                                                                              Africa                                        India
                                                                                                       2021-2030: 765
                                                                                                                        2011-2020: 385
                                                                       2011-2020: 325
                                                                                                                        2021-2030: 945
                                                                       2021-2030: 475                                                                            Asia Pacific
                                        Latin America                                                                                                            2011-2020: 370
                                          2011-2020: 925                                                                                                         2021-2030: 605
                                        2021-2030: 1,200

Source: Bombardier Forecasting Model.
the forecast                                                                                                                                          Bombardier Business Aircraft   | Market Forecast 2011-2030   26

North America (United States and Canada)
                                                        Business Jet Penetration Forecast - North America
                                                        Fleet per capita vs. GDP per capita, 1960-2030

                                                                                                 10,000

                                                                                                                                                                         2010                2030

                                                  Fleet per 100 Million Population (Log Scale)
                                                                                                 1,000

                                                                                                   100

                                                                                                    10

The U.S. economy has been on a recovery
path since mid-2009. Although there is still                                                                                                                                     Actual
                                                                                                                                                                                 Forecast
plenty of slack in the American economy,
                                                                                                             1960
growth is expected to unfold evenly through-                                                         1
                                                                                                     1,000                              10,000                                           100,000
out 2011. Many key areas are now displaying
                                                                                                                     GDP per Capita (USD, Log Scale)
visible growth: employment, consumer
                                                  Sources: Ascend, IMF, IHS Global Insight, UN Population Project, Bombardier forecast. Includes very light jets.
spending, and exports, with the latter being
fuelled by rapid growth in emerging markets.      The Canadian economy accelerated at                                                                        growth in 2011, up from 2.8% in 2010.
Last, but not least, corporate profits grew       a good rate in 2010. The consumer,                                                                         Economic growth should remain steady
8.5% between Q1-2010 and Q1-2011.                 government, investment and trade sectors                                                                   for the region over the 2011-2030 period,
                                                  all performed well. As with the U.S.,                                                                      with a yearly average of 2.7%.
On the other hand, inflation has become           Canada’s economy is expected to be
more of a concern, with higher gasoline and       stronger moving into 2011.                                                                                 As the most prevalent economic region
food prices. It is expected to grow to 3.0%                                                                                                                  around the world, North America should
this year, up from 1.6% last year. In the short   According to IHS Global Insight, real GDP                                                                  continue creating wealth and sustaining the
term, the higher U.S. dollar is representing      growth for North America should improve                                                                    development of its business aircraft industry.
a slight drag on real GDP.                        this year over last year, with a forecast 3.2%
the forecast                                                                                                                                 Bombardier Business Aircraft       | Market Forecast 2011-2030   27

North America (United States and Canada)                                  (continued)

Business aviation began in North America in        Fleet Evolution Forecast - North America
the 1960s by leveraging the pre-existing and       Fleet, Deliveries, Retirements; 2010-2030

well-implanted general aviation infrastructure.
As a consequence, the business aviation
                                                                                                                                                           3,300
industrial network, regrouping OEMs, suppliers,                                                                                      5,400
Fixed Base Operators (FBOs), as well as
                                                                                              2,200
dedicated airports, experienced a fast-paced                              4,200
development. This idiosyncratic development
path explains the unique shape of the
historical business jet penetration curve
                                                                                                                                                                    13,800
for North America, significantly higher than
                                                                                                                 11,700
other regions.                                        9,700

Business aviation in North America caters to
a continued demand for new and replacement
aircraft. Historically, North America has been
                                                   Fleet 2010           Deliveries        Retirements         Fleet 2020           Deliveries        Retirements   Fleet 2030
the most prominent region in terms of
business aircraft sales. At the end of 2010,       Sources: Ascend, Bombardier forecast. Excludes Very Light Jet and Large Corporate Airline categories.
there were 9,700 business jets based in
North America, approximately 66% of the
worldwide business jet installed base. The
North America is the most mature market.

As the forecast business jet penetration          and 5,400 aircraft between 2021 and 2030.
curve shows, fleet per 100 million population     The 2010 fleet of 9,700 business jets will
is expected to grow moderately from 3,400         grow to 13,800 aircraft in 2030 resulting
to 4,300 over the next 20 years. North            in a CAGR of approximately 2%.
America is forecast to receive the greatest
number of new business jet deliveries
between 2011 and 2030 with 9,600 aircraft;
4,200 aircraft between 2011 and 2020;
the forecast                                                                                                                                         Bombardier Business Aircraft   | Market Forecast 2011-2030   28

Europe
                                                        Business Jet Penetration Forecast - Europe
                                                        Fleet per capita vs. GDP per capita, 1960-2030

                                                                                                 10,000

                                                                                                                                                                                               2030

                                                  Fleet per 100 Million Population (Log Scale)
                                                                                                 1,000
                                                                                                                                                                      2010

                                                                                                                    WESTERN
                                                                                                                    EUROPE
                                                                                                   100                                                  2010

                                                                                                             EASTERN EUROPE
A two-speed Europe is becoming more                                                                 10

and more an economic reality. As the “core”                                                                                                                            Actual Western Europe

of the Euro area – Germany, France and UK                                                                                                                              Actual Eastern Europe
                                                                                                                                                                       Forecast
– is turning the corner, the “peripherals” –                                                      1960
Greece, Ireland, Spain and Portugal – are                                                            1
                                                                                                     1,000                              10,000                                             100,000
still suffering from the sovereign-debt crisis.
                                                                                                                     GDP per Capita (USD, Log Scale)

                                                  Sources: Ascend, IMF, IHS Global Insight, UN Population Project, Bombardier forecast. Includes very light jets.
The German economy, the most prominent
in Europe, is recovering quite well from the
2008-2009 downturn. The ramifications of
the Eurozone sovereign debt crisis have so
far had little impact on this country. The        According to the economic research firm                                                                    Britain’s economy saw most of its sectors
massive and sustained growth acceleration         Xerfi, the outlook for France is quite contrasted:                                                         off to a strong start in Q1-2011, in particular
since Q2-2010 has made Germany the star           bearing a record trade deficit in Q1-2011,                                                                 with regards to output in the services and
performer in Western Europe. Germany’s            France saw its industrial output falling back to                                                           manufacturing sectors. Britain's short to
economy is expected to remain exceptionally       levels experienced 10 years ago. Its industry                                                              midterm growth is expected to remain mild,
robust in 2011 compared to the economies          network is slowly deteriorating, while con-                                                                as the country faced important governmental
of France and the UK.                             sumption is hampered by a rising inflation.                                                                budget tightening.
the forecast                                                                                                                                     Bombardier Business Aircraft           | Market Forecast 2011-2030   29

Europe      (continued)                              Fleet Evolution Forecast - Europe
                                                     Fleet, Deliveries, Retirements; 2010-2030

Since the beginning of the recession, Greece
                                                                                                                                                                500
has been under the most intense pressure.
Continuous high levels of public debt are
                                                                                                                                            2,200
forcing Greece to further fiscal tightening over
the coming years, weighing on economic
activity. The ongoing financial crisis is expected                                                    210
to further dampen private consumption and
investment. As a consequence, the Greek                                         1,900
                                                                                                                                                                             5,190
economy is expected to further contract in
2011. This is expected to be the third year
                                                                                                                        3,490
of GDP contraction in a row.
                                                             1,800
Overall, after contracting its GDP by 4.1%
in 2009, the Eurozone rebounded with 1.7%
growth in 2010. According to IHS Global
                                                          Fleet 2010           Deliveries       Retirements         Fleet 2020           Deliveries          Retirements   Fleet 2030
Insight, the Eurozone GDP is forecast to grow
1.5% in 2011. In the period from 2011 to             Sources: Ascend, Bombardier forecast. Excludes Very Light Jet and Large Corporate Airline categories.

2030, growth is predicted to average 1.7%.
The recession may be over, but the econo-
mists are preaching caution as economic
growth carries on at a slowing rate.

For the last few years before the Great              The growing business jet installed base in                                                         from 2011 to 2030; 1,900 aircraft between
Recession, Europe has taken an increasingly          Europe will create a significant replacement                                                       2011 and 2020; and 2,200 aircraft between
prominent position in the business aviation          market, ensuring that this region will continue                                                    2021 and 2030. The 2010 fleet of 1,800
market. The region saw its share of world-           to be a major source of demand for business                                                        business jets will grow to 5,190 aircraft by
wide business jet deliveries jump from 12%           jets. As the forecast business jet penetration                                                     2030 with a fleet growth CAGR of approxi-
in 2003 to 31% in 2008. The main drivers             curve shows, fleet per 100 million population                                                      mately 5%.
were the strong Euro relative to the U.S.            is expected to grow from 470 to 1,300 over
dollar, significant economic growth generated        the next 20 years. Europe will receive the
by the expanding European Union, and the             second largest number of business jet
emergence of branded charter business jet            deliveries with 4,100 aircraft in the period
operators.
the forecast                                                                                                                                        Bombardier Business Aircraft   | Market Forecast 2011-2030   30

China
                                                      Business Jet Penetration Forecast - China
                                                      Fleet per capita vs. GDP per capita, 1960-2030

                                                                                               1,000

                                                                                                                                                                           2030

                                                Fleet per 100 Million Population (Log Scale)
                                                                                                100

                                                                                                                                        2010
                                                                                                 10

China delivered a stellar performance during
the Great Recession with 9.1% and 10.3%                                                                                                                                            Actual
                                                                                                                                                                                   Forecast
growth in 2009 and 2010. The Chinese                                                                     1960
government has been implementing measures                                                         1
                                                                                                       100      1,000                                             10,000                 100,000
to prevent the economy from overheating.                                                                           GDP per Capita (USD, Log Scale)
Credit tightening should start cooling down     Sources: Ascend, IMF, IHS Global Insight, UN Population Project, Bombardier forecast. Includes very light jets.
domestic demand and price controls for the
property market should limit construction
activities. Given the Chinese public’s high     economic growth. Given China’s large                                                                       economy is expected to grow at 9.5% in
financial savings, consumer-demand growth       population and vast physical size, strong                                                                  2011. China is expected to account for an
should remain resilient throughout the year.    growth could continue for several years                                                                    annual average GDP growth of 7.2% for
                                                and spread from coastal areas to inland                                                                    the next 20 years.
Traditionally driven by export markets, China   provinces. In its 12th 5-year plan, China
is determined to accelerate its transition      will continue to focus on inclusive growth,                                                                Business aviation in China is at its very
toward a more domestically based economy.       by guaranteeing housing affordability and                                                                  early stages. Over the past years, significant
Taking a longer term perspective, China         by investing massively in rural regions.                                                                   barriers have prevented the Chinese business
and India are expected to lead the world’s      According to IHS Global Insight, China's                                                                   jet market to grow to its potential. Restrictive
the forecast                                                                                                                                  Bombardier Business Aircraft              | Market Forecast 2011-2030   31

China     (continued)

airspace access, high aircraft import taxes, a    Fleet Evolution Forecast - China
shortage of airport infrastructure for business   Fleet, Deliveries, Retirements; 2010-2030

aviation and high user fees are among the
factors which explain why China only hosts
                                                                                                                                                              30
an installed base of some 150 business jets
for a population of 1.3 billion. Nevertheless,
China’s number of civil airports is expected to
grow from 156 in 2009 to 244 by 2020.                                                                                                   1,400

Aside from the buoyant economic growth,
many factors suggest that China holds the                                                                                                                                   2,470
                                                                                                  10
potential for a rapid business aircraft market
development in the coming years.
                                                                              960
                                                                                                                    1,100
First, according to China.org.cn’s study of
the top 500 enterprises of China in 2010,
the revenues of the 500 largest companies                 150

have been growing at an annual average rate           Fleet 2010            Deliveries       Retirements         Fleet 2020           Deliveries          Retirements     Fleet 2030

of 21% between 2002 and 2010.                     Sources: Ascend, Bombardier forecast. Excludes Very Light Jet and Large Corporate Airline categories.

Moreover, its population of High Net Worth
Individuals1 (HNWI) has been increasing by an     and the recent improvements to flight                                                              next 20 years. The Chinese business jet
impressive 10% per year on average between        planning regulation and airspace liberalization                                                    fleet of 150 aircraft in 2010 is predicted to
2004 and 2009, according to Merrill Lynch         will allow private aviation to blossom in                                                          grow at a CAGR of 15% over the next 20
and Capgemini. China is already the second        China over the next 20 years.                                                                      years, and to account for 2,470 aircraft in
largest luxury goods market, and is forecast                                                                                                         2030. 2,360 deliveries are expected in China
to gain the first place by 2015.                  Demand for business jets should increase                                                           throughout the next 20 years; 960 aircraft
                                                  as barriers progressively come down. As the                                                        between 2010 and 2020; and 1,400
All summed up, we expect that the cultural        forecast business jet penetration curve                                                            aircraft between 2021 and 2030.
acceptance of business aviation, the rapid        shows, fleet per 100 million population is                                                         1
                                                                                                                                                          Individuals with investable assets over U.S. $1 Million.
growth of HNWIs, the plans for new airports,      expected to grow from 12 to 200 over the
the forecast                                                                                                                                          Bombardier Business Aircraft   | Market Forecast 2011-2030   32

India
                                                        Business Jet Penetration Forecast - India
                                                        Fleet per capita vs. GDP per capita, 1960-2030

                                                                                                 1,000

                                                  Fleet per 100 Million Population (Log Scale)
                                                                                                                                                                             2030
                                                                                                  100

                                                                                                                     2010
                                                                                                   10

                                                                                                                                                                                    Actual
                                                                                                                                                                                    Forecast
                                                                                                 1960
                                                                                                    1
                                                                                                        100     1,000                                               10,000                100,000
                                                                                                                     GDP per Capita (USD, Log Scale)

                                                  Sources: Ascend, IMF, IHS Global Insight, UN Population Project, Bombardier forecast. Includes very light jets.

India’s economy continued to experience           India has one of the fastest growing middle-                                                               has capitalized on its large number of
remarkable development, increasing at 8.5%        class in the world. The world’s most populous                                                              well-educated people, skilled in the English
per year during 2010, second only to China.       democracy escaped the worst of the global                                                                  language.
Economic liberalization that began in the early   financial crisis of 2008-2009 through cautious
1990s served to accelerate India’s growth,        banking policies and a relatively low depend-                                                              According to IHS Global Insight, India is
which averaged more than 7% per year              ence on exports. While the Indian economy                                                                  forecast to be the world’s fastest growing
since 1997.                                       is diverse, services, such as IT, are the major                                                            region in the period from 2011 to 2030, with
                                                  source of economic growth, accounting                                                                      GDP growth averaging 7.5% per year. In
                                                  for more than half of India’s output. India                                                                2011, India’s growth is predicted to be at 8.3%.
the forecast                                                                                                                                    Bombardier Business Aircraft          | Market Forecast 2011-2030   33

India   (continued)

According to Forbes, the number of                 Fleet Evolution Forecast - India
billionaires in India grew to 56 during 2010,      Fleet, Deliveries, Retirements; 2010-2030

from 49 a year earlier.
                                                                                                                                                              30

India’s business aviation sector has not lived
up to its full potential due to lack of aviation
infrastructure, stringent government regula-
tions, high import taxes and duties, long pro-                                                                                            945
cedures for aircraft imports. There are signs
of improvement, as the Airports Authority of
                                                                                                                                                                           1,400
India announced plans to modernize many
airports, and bring 32 existing unused air-                                                        10
ports into operation over the next 10 years.
As the current installed base of business jets
                                                                               385
in India is small and relatively young at 9.5                                                                          485

years old at the end of 2010, retirements
                                                           110
will not be a major factor in this market.
                                                       Fleet 2010            Deliveries       Retirements         Fleet 2020           Deliveries          Retirements   Fleet 2030

As the forecast business jet penetration           Sources: Ascend, Bombardier forecast. Excludes Very Light Jet and Large Corporate Airline categories.

curve shows, fleet per 100 million population
is expected to grow from 12 to 120 over
the next 20 years. Business jet sales should
progressively accelerate in the country due to
economic growth and wealth creation. India
is forecast to take delivery of 1,330 business
jets in the period from 2011 to 2030, with
385 aircraft between 2011 and 2020 and 945
aircraft between 2021 and 2030. The 2010
fleet of 110 business jets will grow to 1,400
aircraft in 2030, resulting in a CAGR of
approximately 14%.
the forecast                                                                                                                                           Bombardier Business Aircraft   | Market Forecast 2011-2030   34

Latin America
                                                         Business Jet Penetration Forecast - Latin America
                                                         Fleet per capita vs. GDP per capita, 1960-2030

                                                                                                  1,000
                                                                                                                                                                              2030
                                                                                                                                                             2010

                                                   Fleet per 100 Million Population (Log Scale)
                                                                                                   100

                                                                                                    10

                                                                                                                                                                                      Actual
                                                                                                                                                                                      Forecast
                                                                                                                1960
                                                                                                     1
                                                                                                          100          1,000                                         10,000                 100,000
                                                                                                                         GDP per Capita (USD, Log Scale)

                                                   Sources: Ascend, IMF, IHS Global Insight, UN Population Project, Bombardier forecast. Includes very light jets.

Latin America is a diverse region, and, for the    The largest economy of Latin America,                                                                      Pew Global Attitudes Survey, 62% of
purposes of the forecast, includes all countries   Brazil, grew by 7.7% last year. The country’s                                                              Brazilians said their nation’s economy is in
between the Rio Grande and the Cape Horn.          productivity is increasing rapidly after many                                                              good shape. Of the 21 other publics included
During 2010, most countries in the region          years of economic and political stability.                                                                 in the survey, only the Chinese are more
experienced strong to very strong growth.          Brazilians are moving forward with confidence,                                                             upbeat about their country’s overall directions
Average economic growth for the region             preparing for the 2014 World Cup and the                                                                   and economic conditions.
during 2010 was 5.8%.                              2016 Olympics. In the September 2010
the forecast                                                                                                                                   Bombardier Business Aircraft           | Market Forecast 2011-2030   35

Latin America          (continued)

The economy of the region has traditionally        Fleet Evolution Forecast - Latin America
been driven by exports of manufactured             Fleet, Deliveries, Retirements; 2010-2030

goods, agricultural products and natural
resources, such as oil and minerals. Tourism                                                                                                                  430
is also an important driver, notably for
Mexico and the Caribbean.                                                                                                                1,200

                                                                                                   360
According to Forbes, Latin America experi-
enced a jump in its number of billionaires,                                     925

going from 36 in 2009 to 53 in 2010. Mexico
ranks above Brazil and Argentina in sales of                                                                                                                               2,735

luxury brands in Latin America and is the
                                                                                                                      1,965
home of the world's wealthiest individual in
2011: Carlos Slim Helu. According to IHS                   1,400

Global Insight, in 2011, Latin America’s
growth is predicted to be at 4.6%. Over the
20-year forecast period, the Latin American
                                                        Fleet 2010           Deliveries       Retirements         Fleet 2020           Deliveries          Retirements   Fleet 2030
economy is forecast to grow, on average,
by 4.3% per year.                                  Sources: Ascend, Bombardier forecast. Excludes Very Light Jet and Large Corporate Airline categories.

Business aviation has a long and well-estab-       As the forecast business jet penetration
lished presence in Latin America, particularly     curve shows, fleet per 100 million population
in Mexico and Brazil. The success of business      is expected to grow from 315 to 500 over
aviation in the region is partly due to the poor   the next 20 years. Latin America is forecast
scheduled airline service in the area. Latin       to take delivery of 2,125 business jets in the
America shows a noticeably high proportion         period from 2011 to 2030, with 925 aircraft
of business jets in the Light category. In late    between 2011 and 2020 and 1,200 deliveries
2010, the region had one of the oldest busi-       between 2021 and 2030. The 2010 fleet of
ness jet fleets in the world, with an average      1,400 business jets will grow to 2,735
age of 18.5 years (versus 15.7 years world-        aircraft in 2030 resulting in a CAGR of
wide). As a result, the region should account      approximately 3%.
for a significant amount of replacements.
the forecast                                                                                                                                        Bombardier Business Aircraft   | Market Forecast 2011-2030   36

Russia & CIS
                                                       Business Jet Penetration Forecast - Russia & CIS
                                                       Fleet per capita vs. GDP per capita, 1960-2030

                                                                                                1,000
                                                                                                                                                                      2030

                                                 Fleet per 100 Million Population (Log Scale)
                                                                                                                        2010

                                                                                                 100

Recovering at a relatively moderate pace                                                          10

from a deep recession suffered in 2009, the
Russian economy remains overly dependent
on energy export revenues to drive domestic                                                                                                                                        Actual
growth. Energy prices have risen steadily                                                                                                                                          Forecast
                                                                                                        1960
since mid-2009. They are expected to remain                                                        1
elevated in the near-to-medium term, particu-                                                      1,000                               10,000                                            100,000
                                                                                                                    GDP per Capita (USD, Log Scale)
larly in light of popular unrest in the Middle
                                                 Sources: Ascend, IMF, IHS Global Insight, UN Population Project, Bombardier forecast. Includes very light jets.
East and North Africa. Exports have been
driving the recovery, while domestic demand
has remained slack. Consumer confidence has      that will keep growth in the moderate pace.                                                                Capital, increased government spending
bounced back and household consumption           Commercial lending rates are still relatively                                                              before parliamentary elections in the end of
has been adding some momentum to the             high and banks are leery of a new wave                                                                     the year and a presidential vote in early 2012
economic recovery.                               of loan defaults.                                                                                          may boost inflation. The number of billionaires
                                                                                                                                                            in Russia & CIS amounted to 116 in 2010,
Business confidence is improving as well,        Future growth will be influenced by WTO                                                                    up 61% from 72 in 2009, according to
as shown by the strong growth in investment      accession and the nation's newly cemented                                                                  Forbes. A total of 50 billionaires live in
activity. Nevertheless, there are offsetting     energy exporting ties to China. According to                                                               Moscow, making it the city with the second-
factors in the Russian economic environment      Moscow investment bank Renaissance                                                                         highest billionaire population after New York.
the forecast                                                                                                                                  Bombardier Business Aircraft           | Market Forecast 2011-2030   37

Russia & CIS         (continued)

IHS Global Insight estimated Russia’s growth      Fleet Evolution Forecast - Russia & CIS
to be 4.6% for 2011, slightly up from 4.5% in     Fleet, Deliveries, Retirements; 2010-2030

2010. Economic growth should remain
steady for the region over the 2011-2030                                                                                                                     90

period, with a yearly average growth of 3.4%.

The development of the Russian economy                                                                                                   1,010
has had a positive effect on the demand for
business jets in the region. Fleets of Russian-
owned aircraft grew significantly from 100
                                                                                                   60                                                                     1,765
aircraft in 2004 to an estimated 380 jets in
2010. Due to taxation issues, most Russian
                                                                               525
business jet owners register their business
jets outside of Russia.                                                                                               845

Russia is the largest country in the world.                380

Russian customers have to fly longer
distances, and have a strong cultural accept-          Fleet 2010           Deliveries       Retirements         Fleet 2020           Deliveries          Retirements   Fleet 2030

ance of business jets. Currently, the major       Sources: Ascend, Bombardier forecast. Excludes Very Light Jet and Large Corporate Airline categories.

features of the Russian business aviation
market are the dominance of foreign opera-
tors, the intense concentration in the Moscow
region and the lack of clear legislation in the
field. Infrastructure, an issue for many years,   this move is expected to boost the country's                                                       business jet deliveries, 525 aircraft between
is now improving, and air traffic control is      fledgling business aviation sector and to                                                          2011 and 2020, and 1,010 aircraft between
becoming more accustomed to working with          encourage more people to own private jets.                                                         2021 and 2030. The 2010 fleet of 380 busi-
business aviation. In November 2010, Russia                                                                                                          ness jets will grow to 1,765 aircraft by 2030
adopted new airspace classifications which        As the forecast business jet penetration                                                           representing a CAGR of approximately 8%.
should allow general aviation to be exempt        curve shows, fleet per 100 million population
from many of the bureaucratic procedures          is expected to grow from 146 to 700 over
that pilots had to contend with. According to     the next 20 years. Between 2011 and 2030,
Rosaviatsia, the Federal Air Transport Agency,    Russia & CIS is forecast to receive 1,535
the forecast                                                                                                                                        Bombardier Business Aircraft   | Market Forecast 2011-2030   38

Middle East
                                                      Business Jet Penetration Forecast - Middle East
                                                      Fleet per capita vs. GDP per capita, 1960-2030

                                                                                               1,000

                                                                                                                                                                           2030

                                                Fleet per 100 Million Population (Log Scale)
                                                                                                                                                          2010

                                                                                                100

                                                                                                 10

                                                                                                                                                                                   Actual
                                                                                                                                                                                   Forecast
                                                                                                             1960
                                                                                                  1
                                                                                                       100          1,000                                         10,000                 100,000
Middle East recorded significant economic                                                                             GDP per Capita (USD, Log Scale)
growth between 2004 and 2008, an annual
                                                Sources: Ascend, IMF, IHS Global Insight, UN Population Project, Bombardier forecast. Includes very light jets.
6.7% on average, largely due to high oil
prices. In 2009, tight international credit,
plummeting oil prices and the global economic
slowdown inhibited Middle East's real GDP       The beginning of 2011 witnessed the emer-                                                                  In the Gulf states, oil production is expected
growth to 0.6%. 2010 saw the whole region       gence of political unrest in North Africa and                                                              to increase in the short term to compensate
recover gradually with a 4.1% GDP growth.       the Middle East. The "Arab Spring" resulted                                                                for losses in Libyan crude oil. Saudi Arabia
Recovery was largely driven by increasing oil   in change in regimes in Tunisia and Egypt,                                                                 will strongly benefit from this situation, and
revenues, improving exports, and state          civil war in Libya, and civil troubles in Syria,                                                           thus will see its economy accelerate in 2011.
spending, the latter made possible by finan-    Yemen, and Bahrain. The resulting uncertainty                                                              As well, government spending and exports
cial reserves accumulated by the Gulf states    may somewhat damp confidence in this                                                                       will continue to bolster overall activity in the
during the 2004-2008 prosperous period.         year's economic outlook for the region.                                                                    Kingdom.
You can also read