COMMODITY INSIGHTS INFOCUS - ANZ AGRI
←
→
Page content transcription
If your browser does not render page correctly, please read the page content below
ANZ AGRI
  INFOCUS
    JULY
    2020

COMMODITY
 INSIGHTS
FOREWORD

  As economies around the world emerge from the ‘induced coma’
    of COVID-19 lockdowns, and the full impact of the pandemic
   on global economic growth becomes clear, the Australian and
     global agriculture industries are moving into a new phase.

Low global growth and trade tensions, rather than                   While strong domestic prices and production should
interrupted supply chains and lockdown provisions,                  signal a good financial season for producers, risks on the
will likely guide consumer demand and future prices.                global horizon raise a series of difficult questions for many
                                                                    producers. How much and for how long should beef and
The latest outlook from the World Bank suggests a
                                                                    sheep producers invest in restocking while global prices are
contraction of over 5 per cent in the global economy.
                                                                    looking subdued? What should wool producers consider the
While the outlook for many industries is gloomy, agriculture
                                                                    new ‘norm’ for the Eastern Market Indicator? Will government
is a brighter light on the horizon with global agricultural
                                                                    efforts to support dairy prices in the US and EU lead to
commodity prices remaining relatively stable in the face of
                                                                    longer-term downward pressure on prices? And what of
the pandemic. In Australia, the outlook is relatively upbeat
                                                                    the AUD? At low levels it has provided valuable insulation,
with a strong season and low livestock numbers among
                                                                    but at closer to 70c than 60c, we are more exposed to
many reasons for producers to feel optimistic. However,
                                                                    global characteristics.
this is tempered by global risks on the horizon including
simmering trade tensions with China. While the Australian           Across all these questions, and more, many producers
agriculture industry is understandably nervous that the             are cautiously optimistic as COVID-19 washes through
Chinese Government will extend trade restrictions from              the global economy.
the Australian barley and beef industries to other major
Australian exports, to date, the Chinese export market
has held up strongly.
A strong start to the cropping season has most producers
looking forward to good returns, however, wheat prices
are facing some downward pressure from strong global
                                                                    Mark Bennett
production and stocks, although this is tempered by concerns
                                                                    Head of Agribusiness & Specialised Commercial,
over the United States (US) and the European Union (EU)
                                                                    Commercial Bank
seasonal conditions. For beef and sheep producers, livestock
prices are being supported by low herd and flock numbers                  @bennett2_mark
and the drive to rebuild national stock numbers after the
drought. While Australian cattle and sheep prices remain
strong, internationally cattle and sheep prices have fallen in
response to COVID-19. Similarly, the Australian dairy industry,
while experiencing lower opening prices than last year, is
being insulated from global trends as processors compete for
limited supply. Wool and cotton producers are facing into the
headwinds of falling global economic growth, as demand for
both wool and cotton clothing is strongly correlated with
economic growth levels and consumer confidence.

                                                               PAG E 01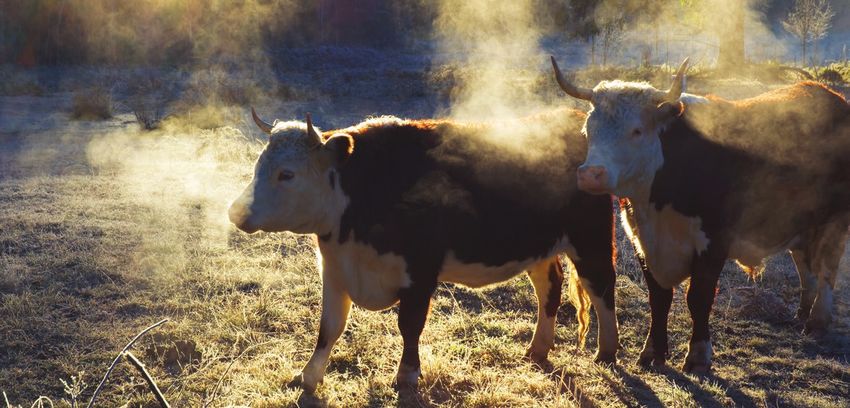
WHEAT & GRAIN INSIGHTS

OVERVIEW

+ Australian grain has continued to attract strong                 – Undoubtedly, the imposition of tariffs by China
  global demand, based on reliability of supply                      on Australian barley is being watched cautiously
  and a favourable AUD                                               by exporters of other grains and oilseeds
+ Recent rains typically herald a good season and could            – The Black Sea Region remains an improving competitor
  well signify a big increase in domestic grain production           and, despite some trade restrictions, will continue
+ As oil prices lift, more corn will go back into ethanol,           to pursue Australia’s major markets aggressively
  increasing the demand for Australian grains for                  – While there is some current nervousness over US and
  feed exports                                                       EU weather, strong crop production globally could
                                                                     lead to higher stocks and downward price pressure

It’s certainly not often that Australian grains would dominate     Firstly, the flattening or fall in the COVID-19 trend in many
the headlines in this country, particularly barley. However,       countries, combined with the easing of lockdown restrictions,
recent trade events have reiterated how important grains           is building confidence in many countries where demand
are as a major export, as well as a strategic geopolitical         conditions are likely to improve. This would be felt across
commodity. Yet while governmental interaction over exports         foodstuffs, oils and demand for feed. In addition, the forecast
such as barley, canola and wheat have continued to play out,       recovery in oil prices would again see reasonable volumes
in the background, overall prices have started to look more        of corn diverted to ethanol, leading to price strengthening
positive than they have for some months.                           across corn and alternative grains.
When the impacts of COVID-19 first started to be felt in           The second factor boosting the outlook for global grain is the
global soft commodity markets, some market observers were          poor weather outlook in some parts of the US, where cold
intrigued that most grain and oilseed prices actually fell, at a   weather not only delayed plantings, but has led to forecasts
time when a global crisis would normally have been expected        for reduced yields. Similarly in Europe, while the poor weather
to see them rise. Early on, it seemed that the market had learnt   outlook has improved, wheat production for 2020/21 is still
from the past and was now experienced enough to realise            forecast to be down almost 10 per cent on the previous
that stocks of most major grains and oilseeds were relatively      year, to 140 million tonnes.
high, and that the production outlook for most major
                                                                   For Australian producers, upward pressure on wheat prices
exporting countries was good, meaning little potential
                                                                   would be especially welcomed in light of forecasts for strong
for tight supply. Even more promising was the relative lack
                                                                   domestic wheat production growth in 2020/21. According
of reaction from markets when Russia announced grain
                                                                   to the latest US Department of Agriculture (USDA) forecasts,
export restrictions, indicating again that the market players
                                                                   wheat production is currently forecast to hit 23 million tonnes,
understood that this was largely a token gesture.
                                                                   up a full 50 per cent on last year’s drought-impacted crop.
As COVID-19 began increasingly to impact the countries             Similarly, USDA predicts Australian wheat exports for 2020/21
of Europe, global grain prices largely headed upwards; as          will climb by almost 80 per cent to 14.5 million tonnes.
the market decided that this may be the region with potential
                                                                   In terms of wheat demand, it is interesting to look at
for panic buying, global wheat prices gradually trended
                                                                   the long-term trends for wheat usage, to discuss where
downwards from late March. As of early June, however,
                                                                   the Australian sector should focus in terms of markets
momentum shifted, and upward price pressure began
                                                                   and products.
to be driven by two main factors.

                                                             PAG E 02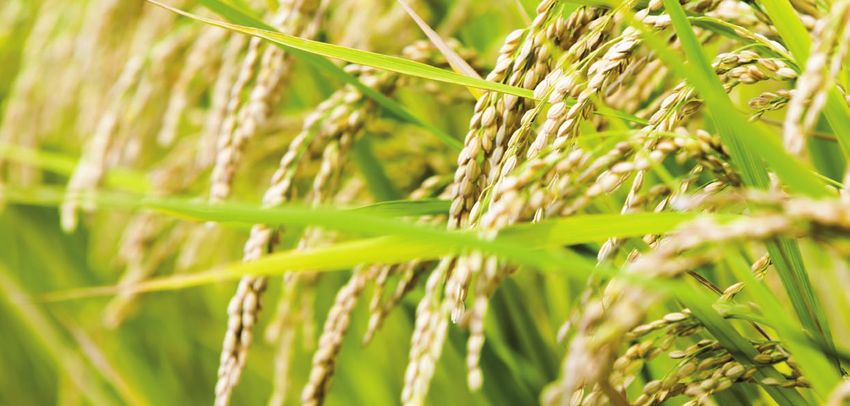
AUSTRALIAN WHEAT DOMESTIC CONSUMPTION & EXPORTS
40 160
Tonnes (Millions)
30 120
20 80
%
10 40
0 0
1991 1996 2001 2006 2011 2016 2021
Exports Feed Dom. Consumption FSI Consumption Feed Consumption as % Ending Stocks (RH axis)
Note: Year 2021 refers to marketing year 2020/21 (Oct–Sep) 2. FSI (Food, Seed and Industrial)
Source: USDA PSD
Over the decade since 2009/10, world wheat consumption Among Australia’s key grain export markets, the Philippines
has been largely driven by an increase in food, seed and continues to see a greater increase in feed use of wheat,
industrial (FSI) usage of around 74 million tonnes, which compared to Indonesia and Vietnam, where FSI consumption
is more than three times faster than feed usage, which increased.
has grown by 20 million tonnes. The slow increase in feed
Finally, the implications of the recent imposition of new
use can be largely explained by wheat’s relatively low cost
tariffs by China on Australian barley will continue to unfold.
efficiency as a feed grain, compared to either corn or to
Arguably, the reaction from many barley growers was
soybean meal. In terms of the FSI growth, the bulk of this
measured, factoring in the likelihood of a reduction in forecast
continues to be attributable to growing middle class incomes
prices, but in the knowledge that global import demand by
in Asia, seeing a move to wheat-based food products,
the time of harvest was likely to give time for new markets to
away from the traditional rice.
be found, should the situation remain unchanged, and price
Unsurprisingly, the strongest growth in wheat food usage falls likely to be measured. The longer-term impact will be
has been driven by China and India. Interestingly, Australia more felt next year, when planting intentions will take account
has seen some of the world’s strongest growth in feed usage, of the situation that time, and may possibly see a strong
driven by drought conditions diverting cattle to feedlots, reduction in next season’s domestic barley output.
as well as by the growth in beef export markets.
WHEAT CONSUMPTION AUSTRALIA–CHINA BILATERAL
2019/20 VS 2009/10 TRADE RELIANCE
20 70
China’s Reliance on Australia (%)
60
15
50
Tonnes (Millions)
10 40
5 30
20
0
10
(5) 0
(10) -
10 20 30 40 50 60 70 80 90 100
Australia’s Reliance on China (%)
China
India
Indonesia
Philippines
Australia
Canada
Egypt
Vietnam
Thailand
Iran
USA
Japan
South Korea
Kazakhstan
EU
Ukraine
Wheat Cotton Seafood
Canola Fruit & Nuts Wood Products
Sheepmeat Wine Wool
Feed Food, Seed and Industrial (FSI) Beef Barley Grain Sorghum
Source: USDA PSD Note: Bubble size represents average bilateral trade value for 2017–19
Source: UNComtrade, Trademap, ANZ
PAG E 03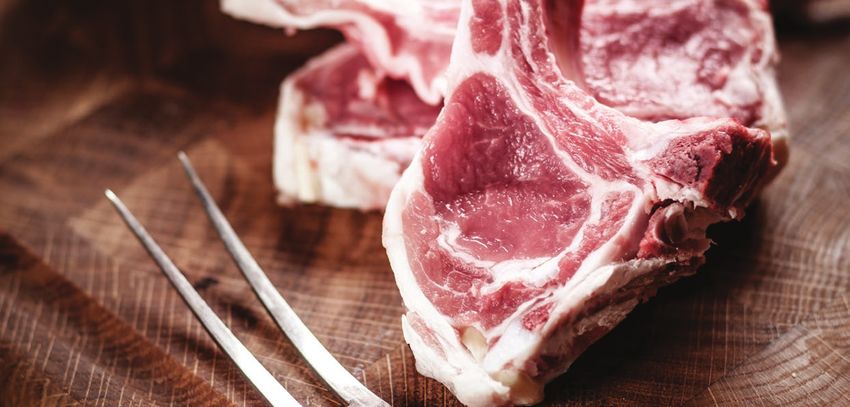
BEEF INSIGHTS

OVERVIEW

+ Improved seasonal conditions continue to underpin                    – Uncertainty remains over US and South American
  strong steer prices and support a long awaited restocking              production and processing returning to full capacity.
  opportunity for breeding enterprises                                   A strong return would impact global supplies and be
+ Beef exports have rebounded after initial demand shock,                influential for Australian beef prices
  and reduced production capacity in the US has aided                  – Feedlotters are facing tightened margins as restockers
  Australian exports into key exports markets                            compete for supply, and encounter reduced demand from
+ The move to online sale platforms has allowed buyers                   high-value grainfed markets inhibited by social restrictions
  to continue to access markets, reducing any negative                 – High domestic steer prices may put pressure on producers
  impact on prices                                                       future profit margins

The Australian beef industry has shown its adaptability over           Live exports to Indonesia for the calendar year to April were
recent months, ensuring buyers are still able to access markets        back 22 per cent compared to 2019 as COVID-19 slowed
and allowing the supply chain to operate largely uninterrupted         abattoir activity. On the contrary, live exports to Vietnam were
by the COVID-19 pandemic.                                              up 55 per cent for the same period, driven by African Swine
                                                                       Fever (ASF) diminishing local meat supplies.
Due to social distancing, throughout the lockdown periods
of the pandemic, Meat and Livestock Australia (MLA) have               Breeding stocks are following similar upward price trends
established an interim market indicator, the ‘CV19 indicator’          to young cattle, as seasonal conditions present an opportunity
– a weighted seven-day rolling average of prices to replace            to restock for the first time in over two years, or longer for
EYCI and WCI. These CV19 indicators dropped an average                 some producers.
40c/kg lwt through April after reaching record levels in
mid-March. However, strong domestic buyer competition
has resulted in another upward trend since late April.                 CATTLE SLAUGHTER BY YEAR
The return of reporting on the EYCI in June, saw it climb
to over 760c/kg in mid-June – some 60 per cent higher
than the same time in 2019.                                                         750

Prices for liveweight vealer steers recovered quickly with                          700
demand from restockers and backgrounders backed by
favourable seasonal conditions. At 420c/kg lwt at end of
                                                                      Head (’000)

                                                                                    650
May, some 100c higher than in mid-April, equating to $1,150
for a 280kg steer, producers may question when it becomes                           600
uneconomical to carry the risk of restocking with these
lighter cattle.
                                                                                    550
Feeder steer prices experienced a flatter recovery as demand
contracted from foodservice outlets and other traditional high                      500
value grainfed markets. Heavy steers, however, may have been                              Jan Feb Mar Apr May Jun Jul Aug Sep Oct Nov Dec
hotly contested by processors to meet domestic and also
export demand, partially to fill the gap left by countries                                    2017       2018       2019       2020
impacted from plant closures and supply interruptions.                 Source: ABS

                                                                PAG E 0 4
Evidently, cattle slaughter figures are down 8 per cent                Plant closures and a prioritising of domestic customers caused
 April year-to-date in comparison to same period in 2019                US wholesale prices to double, making it more profitable to
 as favourable seasonal conditions have encouraged producers            place higher value cuts in the local grinding meat market than
 to hold back the limited stock on hand.                                export markets. US beef production for the month of April was
                                                                        down 21 per cent on April 2019 figures, and shipments to Asian
 An interesting dynamic that arose from the COVID-19 pandemic
                                                                        markets declined significantly, with a forecast decline of around
 was a movement to online beef sales as lockdown measures
                                                                        15 per cent for the second quarter of 2020.
 restricted the foodservice trade. The hoarding behaviours of
 March 2020 resulted in higher sales of lower-value beef cuts,          Looking forward, a market to watch is South Korea, currently
 underpinning butchers’ sales growth of 39 per cent over                Australia’s fourth-largest red-meat market, where increased
 a three-month period.                                                  demand for higher value beef cuts has been evident
                                                                        throughout the pandemic period. Chilled beef exports
 The growth in domestic demand for certain beef cuts,
                                                                        destined for retail and online sales increased 15 per cent
 particularly lower value beef, has challenged processors’
                                                                        year on year ending April.
 ability to maintain pre-pandemic margins. If this continues
 the premium previously gained from high value beef cuts                Another dynamic to throw into the mix is South American beef
 may impact processor purchasing activity, particularly in              production, also impacted by plant closures and economic
 the high value grainfed sector.                                        downturn. Brazil has experienced a 21 per cent drop in the local
                                                                        currency resulting in very competitive beef prices in the global
 In the grainfed sector, the number of cattle on feed fell by
                                                                        market. Exports from Argentina to China dropped 15 per cent
 12 per cent for the March quarter. Feedlotters are facing
                                                                        in March 2020 from last year’s record levels as strict lockdowns
 tightened margins with increasing price pressure from
                                                                        have slowed beef production, impacting the availability of beef
 restockers and reduced demand for high-value cuts.
                                                                        for export and also skewing retail demand which may result in
 Over the hook cattle prices tracked upwards in April/May               high volumes of frozen beef being available later in the year.
 with QLD/NSW leading the lift. However the highest prices
 have been seen in VIC, where overall prices were 50c/kg cwt
 higher than the same time last year.                                   CATTLE ON FEED
 Globally, despite strict lockdown restrictions, there remains
 strong demand for quality protein and international markets                         1,300
 are seeking Australian beef to fill gaps left particularly                          1,200
 constrained by diminished US supply.
                                                                                     1,100
                                                                       Head (’000)

 The value of Australian beef exports increased 22 per cent
 year-on-year for the first quarter of 2020, triggered by                            1,000
 favourable exchange rates and rising domestic beef prices                            900
 as the quantity of beef exported experienced a slight                                800
 decrease on year ago levels.
                                                                                      700
 For the US, which remains both an export destination and                                      2016              2017       2018        2019    2020
 export competitor for Australian beef, a reduction in supply
 and unforeseen deviations to prices has played out over                                        Cattle on feed
 recent months.                                                         Source: ALFA/MLA feedlot survey

 AUSTRALIAN BEEF EXPORTS

                    140                                                                                                                   1,200
                    120                                                                                                                   1,000
Tonnes swt (’000)

                    100
                                                                                                                                                  AUD (Millions)

                                                                                                                                          800
                     80
                                                                                                                                          600
                     60
                                                                                                                                          400
                     40
                     20                                                                                                                   200

                      0                                                                                                                   0
                                        2018                                                 2019                                2020

                          US      South Korea   Canada      Taiwan                     Philippines      Other
                          Japan   China         Indonesia   Saudi Arabia               Malaysia         Export Value (RH axis)
 Source: MLA

                                                                 PAG E 0 5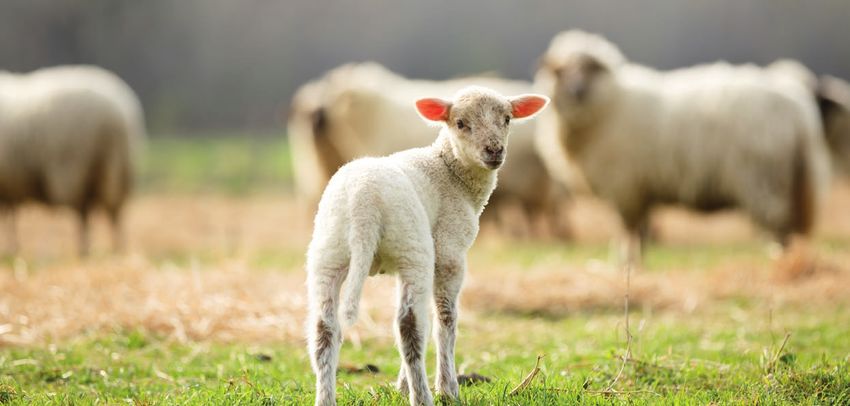
SHEEP INSIGHTS

OVERVIEW

+ Sheep and lamb prices are holding firm on the                     – Yardings and slaughter rates have dropped significantly,
  back of strong restocker demand and low supply                      resulting in a drop in national sheepmeat supply
+ Exports to China continue to grow strongly despite                – Australian lamb prices are now higher than our export
  trade tensions                                                      competition after New Zealand, UK and US prices all
+ Restocker demand is likely to dominate prices in the short          fell as a result of COVID-19
  to medium term, despite concerns over recession and               – Exports to the Middle East and United States have declined
  global economic growth                                              on the back of low oil prices, poor economic growth and
                                                                      the COVID-19 pandemic

The Australian sheepmeat industry continues to hold firm            The most recent MLA sheep projections underline the fact
in the midst of the COVID-19, as demand from restockers             that low sheep supply will be a key aspect of the Australian
continues to support prices, combined with low supply as            industry for years to come as producers seek to rebuild the
producers seek to either retain flocks on-farm or further fatten    national flock. As a result, and with the national flock at its
following strong rain fall. While concerns exist over the impact    lowest level in over a century, sheep slaughter is forecast
of trade tensions between China and Australia, to date, this        to decline by 30 per cent to 6.5 million head in 2020 while
has not been reflected in lamb or mutton exports to China.          lamb slaughter is anticipated to decline to 20.6 million head,
However record low oil prices have led to reduced demand            back 5 per cent on 2019 levels.
from the Middle East while competition from New Zealand
                                                                    This large drop in yardings and available stock has led to strong
lamb has seen some erosion of market share.
                                                                    support for prices. Whilst MLA suspended reporting of the
Lamb and sheep yardings have plummeted in May across                National Trade Lamb Indicator and their saleyard series during
the nation, with lamb yardings for the month sitting almost         the COVID-19 pandemic (which resumed in early June), their
52 per cent below the previous three-year average. Similarly,       alternative series has seen restocker, processor and mutton
sheep yardings in May were 58 per cent below the three-year         values hold up strongly in the period since March – despite
average. While all states have suffered a drop in yardings          some added volatility in the market due to relatively low
year-on-year in May, the reduction in sheep yardings was most       supply. All three categories of sheep suffered from a sharp drop
pronounced in Victoria and New South Wales. Lamb yardings,          in prices in mid-March but now all three categories sit higher
however, have only fallen 5 per cent in Tasmania and                than the same time last year. The strongest interest has been
33 per cent in Victoria.                                            in restocker lambs which currently sit over 20 per cent higher
                                                                    across the nation than this time last year. While processor
Similarly, slaughter numbers have dropped significantly,
                                                                    lambs have not quite recovered to levels seen in February,
with April 2020 data showing a 0.2 per cent decrease in sheep
                                                                    they are currently showing strong gains on the back of
slaughter on March 2020, but a 32.1 per cent decrease in
                                                                    increasing quality and tight supply.
sheep slaughter on April 2019. Lamb slaughter figures show
a 5.7 per cent decrease from March 2019 and a 5.8 per cent          In a similar story to the Australian beef industry, a disconnect
decrease since April 2019. This reflects a broader industry         has emerged between global and local sheep prices as
trend towards retaining older ewes while maintaining lamb           a result of restocker demand in Australian supporting prices
turnoff to take advantage of strong lamb prices. Whilst in          in comparison to our major export competitors, which
the short term, this should support production, it does             have suffered a drop in prices.
raise longer-term impacts from an ageing flock.

                                                              PAG E 0 6
Strong supply, high processing costs and uncertainty around                          LAMB YARDINGS
 COVID-19 have led to a drop in prices in New Zealand which
 hasn’t been mirrored in Australia. While the Australian sheep
 flock is the largest in the world outside of China, and                                            1,400
 dominates much of the global trade in sheepmeat, it does                                           1,200
 not mean that Australian sheepmeat doesn’t face strong
 competition – particularly from New Zealand where the                                              1,000
 national flock is focused on meat. Despite this disconnect

                                                                                     Head (’000)
 with global prices, low flock numbers are likely to be the                                          800
 biggest driving factor for the Australian industry.
                                                                                                     600
 Trade tensions with China have led to concerns that the
 Australian sheepmeat industry will suffer similar pushback                                          400
 from the Chinese government. However, to date, Chinese
                                                                                                     200
 imports of Australian lamb have increased 6 per cent
 year-on-year in April. COVID-19 is impacting lamb exports                                              0
 overall, which have fallen 18 per cent year-on-year in April,                                              Jan Feb Mar Apr May Jun Jul Aug Sep Oct Nov Dec
 due to reduced consumer demand . Exports to the Middle
 East are also suffering from a reduction in the oil price                                                      2017             2018      2019          2020
 which has impacted local consumer demand, as well                                    Source: MLA
 as tightening lockdown rules.

 LAMB EXPORTS BY DESTINATION

                      35
                      30
Tonnes swt (’000)

                      25

                      20

                      15

                      10

                       5

                       0
                                         2017                                 2018                                                  2019                   2020

                           US            UAE                  Jordan      Malaysia                       United Kingdom            Other
                           China         Papua New Guinea     Qatar       Japan                          Bahrain
 Source: MLA

 SLAUGHTER

                    2500                                                                                                                                  1,200

                    2000                                                                                                                                  1,000

                                                                                                                                                          800
Head (’000)

                                                                                                                                                                  Head ('000)

                    1500
                                                                                                                                                          600
                    1000
                                                                                                                                                          400
                     500                                                                                                                                  200

                       0                                                                                                                                  0
                                     2017                              2018                                                2019                   2020

                           Lambs - NSW          Lambs - QLD      Lambs - WA                        Sheep - Australia (RH axis)
                           Lambs - Vic          Lambs - SA       Lambs - Tas
 Source: ABS

                                                                          PAG E 07
WOOL INSIGHTS

OVERVIEW

+ After the drought, the forecast good season should mean           – The longer the economic slowdown lasts, the more
  better growing conditions for producers                             concerning consumer demand for wool will be
+ The fall in wool prices from last year may persuade some          – With many producers having held wool back from sale,
  manufacturers to come back into the market                          no strong rise in prices will become a worry
+ With many sheep producers turning more toward meat                – Exporters will be nervously watching current trade
  options, tighter wool supplies may lift prices                      dynamics, hoping that wool remains unaffected

At first glance, the Australian wool industry could be seen as      In terms of demand, the mid-term outlook for wool is
being in a somewhat concerning predicament. Wool prices             justifiably concerning. The recessionary outlook in many
are well down on last year, and the ongoing strength of the         countries is likely to see consumers turning away from
sheepmeat industry is seeing sheep producers increasingly           discretionary products, which could include woollen
switching away from wool production. At a trade and                 clothing, in favour of cheaper fibres.
economic level, the impact of COVID-19 on the demand
                                                                    The brighter outlook, however, comes from current and
for wool both domestically and globally continues to be
                                                                    forecast supply, which is often noted by industry observers
of concern. Despite all this, many in the industry are seeing
                                                                    to be a greater driver of price than demand. The start of
positive signs gradually emerging over the rest of 2020.
                                                                    June saw the lowest national offering, 15,735 bales, since
After sliding for a number of months, domestic wool prices          the Australian Wool Exchange (AWEX) records began in
have recently begun to see a mild recovery. As of the start of      1995, although admittedly this low figure was partly due
June, the Eastern Market Indicator (EMI) had risen marginally       wool sales only taking place in Sydney and Melbourne.
to 1,183 Ac/kg, seeing prices rise for two weeks in a row for
                                                                    More broadly, it seems apparent that the low EMI is
the first time in a while. This was coming off a low base, with
                                                                    convincing many producers to hold their wool from sale,
the EMI having fallen to 1,155 Ac/kg during May, the lowest
                                                                    either in storage or on farm. For some producers, the
level since 2015.
                                                                    incentive could also be due to waiting for the next tax year.
In a further sign of some strengthening in the wool market,         If this trend continues, supply may remain constrained for
the price rise in US Dollar (USD) terms was actually stronger       some time, and while new season wool later in the year
than the local increase, due to a recent strengthening of the       would reduce this tightness, the ongoing shift to a greater
Australian dollar (AUD).                                            proportion of meat sheep may see this fall lower than
                                                                    previous years.
From a longer-term perspective, the recent rise was still well
down from the 1,887 Ac/kg reached at the same time last             In addition, a further incentive for upward price pressure
year, as well as around 9 per cent below the 10-year EMI            may come about as an indirect result of this year’s weather.
average of 1,298 Ac/kg.                                             As a result of last year’s drought, supplies of superfine wool
                                                                    increased. In contrast, the relatively good season in many
                                                                    regions may see larger volumes of lower micron wool, further
                                                                    pushing up prices of the higher microns, and raising the EMI.

                                                              PAG E 0 8
AUSTRALIAN WOOL SPOT PRICES EASTERN REGION (AWOLRIE INDEX)
18
16
14
12
$
10
8
6
01/2020 02/2020 03/2020 04/2020 05/2020 06/2020
AUD per Kg USD per Kg
Note: Latest data available up to June 3, 2020
Source: Bloomberg
DESPITE FALLS IN THE EASTERN MARKET INDICATOR LEADING
SOME PRODUCERS TO HOLD BACK WOOL FROM AUCTION, LOWER
PRICES ARE PROVIDING INCENTIVE FOR SOME PROCESSORS
TO RE-ENTER THE MARKET
AUSTRALIA MONTHLY EXPORTS
500
400
Value AUD (Millions)
300
200
100
0
09/2018 11/2018 01/2019 03/2019 05/2019 07/2019 09/2019 11/2019 01/2020 03/2020
China India Czech Republic Italy South Korea Other
Note 1: Latest data available up to March 2020
Note 2: HS Codes - 510111/19/21/29/30, 510310/20/30, 510400, 510510/21/29, 510610/20, 510710/20, 510910/90
Source: Trademap, Capital IQ
PAG E 0 9COTTON INSIGHTS
OVERVIEW
+ Australian cotton harvested area for 2020/21 is tipped to – Global supplies of cotton are ample, with record stocks
more than double from last season, as rainfall replenishes outside of China forecast this season
soil moisture profiles and on farm storages – Powerhouse producers and exporters, the US and Brazil,
+ Forecast recovery in world economies post COVID-19 will enter the 2020/21 season with both high stocks and
should equate to increased demand for cotton apparel a solid production outlook
and textiles – Uncertainty and volatility likely to continue in the market
+ Australian cotton proven to be significantly more efficient where the influence of stockpile movements and the
and sustainable than in years gone by US–China Trade Relationship remain leading factors
Following the poor production season of 2019/20, Australian With large crops and continued subsidised production costs,
cotton producers are looking forward to a better year ahead the US and Brazil are likely to capture most of the benefit of
after significant rainfall was received across most of the any increase in global demand for cotton. Australian exporters
country’s cotton-producing areas. While planting and will need to continue relationships built on quality and
production looks set to rebound domestically this year, the consistency of product to maintain market share with the
flow on impacts of COVID-19 leave a big question mark over relatively small quantity of Australian cotton likely to be
world demand for cotton apparel, and therefore, the price available compared to major competing nations.
for Australian cotton for the 2020/21 season and beyond.
Domestically, favourable USD exchange rates and water
ABARES current forecast remains at a harvested area of around availability may see producers looking to forward offers
150,000ha for the upcoming season, up from a record low of around $535/bale currently on offer for the 2021 crop to
of around 60,000ha last year. This represents a significant secure a level of profitability for the upcoming season. While
increase, however also remains well below the cotton harvests price forecasts remain below the solid prices of over $600
of previous years, demonstrating the relatively slow pace a bale seen in recent years, they remain at a profitable level
of recovery out of severe drought conditions. in what is an increasingly efficient production system.
As Australia commences its journey back to increased
production, across the rest of the world cotton trade for
2020/21 is forecast to grow significantly. Brazil, India and the AUSTRALIAN COTTON AREA,
US are set to combine strong domestic crop production with PRODUCTION & EXPORTS
high carryover stocks from previous years. USDA suggests
a 7 per cent increase in global exports next season, and an 1,200 600
overall 2 per cent increase in global ending stocks, with
stocks outside of China forecast to reach a record high 1,000 500
of around 65 million bales.
Tonnes (’000)
800 400
Ha (’000)
While China will still account for around one third of global
600 300
stocks, this represents a historically low proportion, with India
holding the lion’s share of growth. As Australia’s major export 400 200
market, China’s stock levels have historically held more
relevance to Australian cotton prices, due to Australian cotton’s 200 100
superior quality characteristics compared to the Indian product. 0 0
‘17/18
‘18/19s
‘21/22p
‘22/23p
‘23/24p
‘24/25p
‘19/20f
‘20/21f
In positive news, an anticipated increase in the global cotton
trade over the 2020/21 season is expected to be underpinned
by a recovery in demand for cotton apparel and textiles,
driven by economic recovery post COVID-19. The level of Lint Production (kt) Export Volume (kt)
recovery is difficult to predict, as demand for cotton apparel Area Harvested (RH axis)
and home furnishings is highly correlated to gross domestic f = forecast, p = projection
product (GDP) in each importing country. Source: ABARES
PAG E 1 1DAIRY INSIGHTS
OVERVIEW
+ The global dairy market is has been showing positive – Government interventions in the EU and US to support
signs after the initial hit from COVID-19 dairy producers may prolong the impact of COVID-19
+ Domestic opening prices remain relatively solid, despite for the global market
dropping on last year’s prices, and show further room – The impact of declining global economic growth will
for step-ups as processors balance global risks and impact both the size and type of demand for dairy goods,
need to secure domestic supply as consumers possibly move to lower value dairy products
The global dairy industry has been one of the most Most recently, the Global Dairy Trade auctions from mid June
profoundly impacted industries throughout the COVID-19 saw the average price rise 1.9 per cent on the previous auction
pandemic, as demand for manufactured dairy products in to $US2,979/MT. This comes on top of the previous auctions
the EU and US crashed during lockdown. For the Australian which saw just over a 1 per cent increase. Despite this, the GDT
industry, a lack of domestic supply is still weighing on index is trading just above the lowest level since early 2019,
processors’ minds as factory capacity remains unfulfilled; and prior to this, late 2016.
meaning competition for producers and supply remains
The implementation of lockdown measures across the world
a key factor in the market. The announcement of Australian
came at a time when the EU and US were coming into spring
opening milk prices, the first such announcement under the
and production levels were particularly strong – with the
new Dairy Code of Conduct, showed processors treading the
EU producing 4.6 per cent more in February 2020 than the
fine line between attracting producers and accounting for
previous year, and the US producing 5.4 per cent more in
the uncertainty surrounding the impact of COVID-19.
the same period. As a result of the closure of restaurants and
The first of June saw the deadline for the announcement food service outlets, the price of cheese and butter, and as
of next season’s opening prices under the new Dairy Code a flow-on effect, skim milk powder (SMP). From the GDT
of Conduct. All processors’ opening bids were around to auction results, cheddar prices fell over 20 per cent since
$6.40/kgMS mark, although Fonterra’s opening price of $6.06 mid-February. Milk powders have shown the strongest
was quickly revised to $6.40 when it was made clear they growth in the most recent GDT auction rising 3.1 per cent for
weren’t on par with their competition. Saputo and Bega SMP and 2.2 per cent for whole milk powder (WMP). Overall,
also offered $6.40 with Bega offering an additional 15c for SMP has felt a slight larger fall in price since February than
northern Victorian operators. Burra Foods offered an average WMP, although SMP is now higher than this time last year,
of $6–$6.40/kgMS while Australian Consolidated Milk offered while WMP sits almost $200/MT below last year’s levels.
a $6.60 average for conventional milk.
Price movements in the Oceania region have been less
Opening prices have dropped on last year’s prices and while impacted by those in the US and the EU where, even though
processors have clearly retained the ability to deliver step ups prices have recovered somewhat from the falls in March,
later in the season, the uncertain global environment and there are many longer-term risks facing the market.
lower global prices have all been cited as the reason for the
reduction in offered prices.
PAG E 1 2Firstly, in response to the COVID-19 lockdowns, the European AUSTRALIAN FARM GATE PRICES
Commission has provided funding support for the storage of AGAINST GLOBAL DAIRY TRADE
SMP, butter and cheese to allow for the temporary withdrawal
of products from the market for a minimum of two to three
months, and a maximum period of five to six months. While 7 5,000
this move will help reduce the amount of produce available 4,500
6
AUD/Tonnes
in the short term, it also adds an element of uncertainty for 4,000
$/Kg
between two and six months’ time when such produce returns 5 3,500
to the market – possibly even to export markets. In the US, 3,000
4
a range of support measures have been announced including
2,500
financial assistance administered by the USDA which, while 3
needed in the short term, also has the potential to skew ‘14/15 ‘15/16 ‘16/17 ‘17/18 ‘18/19p
the supply market.
AUS $/Kg Milk Solids GDT AUD/MT (RH axis)
In Australia, the impact has been less pronounced, in part
Source: Global Dairy Trade
due to the ongoing competition between processors for milk
supply. Domestic production across the country is picking
up steam on the back of strong rainfall and good conditions,
with production in April 2020 up 6.4 per cent on April 2019. AUSTRALIAN DAIRY EXPORTS
However year-to-date, production is still down 1.2 per cent
on the previous year. Production remains strongest in 160
Tasmania, followed by Victoria, however, year-to-date is
down 13 per cent on 2019 in Queensland. 140
Across the board, Australian dairy exports have fallen in the 120
past year in tonnage – but increased by 5.8 per cent by value.
AUD (Millions)
In quantity terms, exports have fallen in all the major dairy 100
products in the year to March, including butter (-37.5 per
80
cent), SMP (-36.2 per cent), cheese (-24.6 per cent) and WMP
(-9.1 per cent). In values terms, butter, cheese and SMP have 60
all fallen, however WMP has risen in the year to March by
3.5 per cent. 40
While global prices have rebounded in recent weeks and 20
markets are showing strong signs of recovery, there are
a number of risks still on the horizon – which Australian 0
2018 2019 2020
processors have factored into their opening prices. These
range from how production will rebound in the EU and US Milk and cream and milk products (excl. butter or cheese)
after significant government interventions to the unknown Butter and other fats and oils derived from milk
of how consumers will consume and dine once lockdowns
Cheese and curd
are a thing of the past – will they return to old habits, or will
some continue to eat in and shy away from restaurants? Source: ABS
AUSTRALIAN MILK PRODUCTION
1,200
1,000
800
Million Litres
600
400
200
0
Jul Aug Sep Oct Nov Dec Jan Feb Mar Apr May Jun
2018/19 2019/20
Source: Dairy Australia
PAG E 13RICE INSIGHTS
OVERVIEW
+ Forecasts for the 2020/21 season are for a significant – 2019/20 was one of the most challenging rice seasons
recovery in domestic rice plantings and production on record, with just 4,000 hectares planted and estimated
+ Global rice prices spiked significantly through March–April production of around 40,000 tonnes
as key exporting nations imposed rice export quotas – The profitability of Australian rice production systems
+ March–April global trade disruptions and panic buying remains heavily reliant on the price and availability of
led to increased demand for Australian rice irrigation water, which has been limiting in recent seasons
– Forecast high production in China, the US and Thailand to
contribute to very strong global production for 2020/21
and record high ending stocks, which will impact prices
Australian rice production is a relatively small industry on a
tonnage basis, producing on average 520,000 tonnes of rice
annually over the past 15 years. As a heavily regulated and FOR PRICE OUTLOOKS, THE RECENT
specialist crop, rice production fluctuates significantly from VOLATILITY IN THE MARKET HAS PERHAPS
year to year as growers balance water availability and price OVERSHADOWED THE OTHERWISE NEUTRAL
along with their agronomic rotational needs and commodity
OR POSSIBLE DOWNWARD PRESSURE
prices in order to determine plantings.
AHEAD FOR PRICES OF RECORD GLOBAL
Due its reliance on irrigation, the vast majority of Australian
STOCKS, FORECAST HIGH PRODUCTION
rice is produced from the Murrumbidgee and Murray River
valleys of Victoria and NSW. On average, Australia exports AND COMPETITIVE TRADE CONDITIONS
around 300,000 tonnes of rice per annum. However, like THROUGH 2020/21.
production, exports also vary greatly from season to season
and domestic stocks are carefully managed in an effort
to maintain consistency of supply.
Exports are key to profitability through the Australian rice This represents the smallest Australian rice crop since the
supply chain, with the superior quality and value added 2007/08 drought. The low plantings came at an inopportune
characteristics of the Australian product attracting premium time, with domestic demand for rice skyrocketing through
pricing in a diverse range of markets. With such a limited March and April due to panic-buying behaviours induced by
production area, and a strong export focus, Australia relies uncertainty surrounding the COVID-19 pandemic. Globally,
on rice imports to meet domestic demand, importing around a similar phenomenon saw rice prices increase dramatically
50 per cent of apparent domestic consumption each year through April in particular, driven largely by some key export
over the past 10 years. markets announcing restrictions on trade in order to protect
their own food security, along with logistical trade disruptions
The 2019/20 growing season has been particularly
at some key ports.
challenging for rice producers, with the high costs and
low availability of irrigation water resulting in a very small
4,000-hectare planting and an estimated production of
around 40,000 tonnes.
PAG E 1 4Vietnam, the world’s third largest rice exporter, was a major Global rice consumption and trade are also forecast to rise
contributor to the global price reaction, due to strict export for the season ahead, albeit at a slower pace to production,
quotas being imposed during April. Global prices have since resulting in an anticipated 2 per cent rise in ending stocks
started to ease as trade flows re-open and the Vietnam quota and a record high global stock level of over 180 million tonnes.
was lifted in full during May. India has increased its stockpile substantially over recent years,
however China remains the majority stock holder, maintaining
For the season ahead, global rice production is forecast to
ownership of around 65 per cent of the world’s rice.
be up by around 8 million tonnes to produce a total crop
of over 500 million tonnes. The increased production is For price outlooks, the recent volatility in the market has
expected to be driven by increased plantings and improved perhaps overshadowed the otherwise neutral or possible
yields through China, Thailand and other parts of south east downward pressure ahead for prices of record global stocks,
Asia, and the US. A poor season in the Philippines is forecast forecast high production and competitive trade conditions
to see that nation’s import needs rise significantly in 2020/21, through 2020/21.
to maintain its place as the world’s largest importer of rice
in front of the EU and China.
AUSTRALIAN RICE PRODUCTION AND YIELD
1,200 16
14
1,000
12
800
10
T/ha
600 8
6
400
4
200
2
0 0
‘04/05 ‘05/06 ‘06/07 ‘07/08 ‘08/09 ‘09/10 ‘10/11 ‘11/12 ‘12/13 ‘13/14 ‘14/15 ‘15/16 ‘16/17 ‘17/18 ‘18/19
Area Planted (’000) Production (kt) Yield (RH axis)
Source: ABARES
COMPARATIVE MOVEMENTS IN GLOBAL GRAIN PRICES
200
195
Index where Jan 2020 =100
190
185
180
175
170
165
160
155
04/2019 06/2019 08/2019 10/2019 12/2019 02/2020 04/2020
Grains & Oilseed Index Wheat Index Maize Index Rice Index Soybeans Index
Source: International Grains Council
PAG E 1 5MEAT PROCESSING INSIGHTS
OVERVIEW
+ The almost uninterrupted workflow of the Australian meat – Near record high prices for cattle, due to low supply
processing sector throughout the COVID-19 crisis has and restocking, have greatly reduced margins on
highlighted the industry’s resilient structure meat processing
+ Increased domestic demand for meat products for home – The issue over meat labelling with China has created
consumption throughout the COVID-19 period, offsetting uncertainty for a number of processors
wholesale decline, has benefited meat processors – Any upsurge in meat output from US and Brazilian
+ A silver lining to some current processing slowdowns of processors, as they emerge from COVID-19-related
shutdowns may be the opportunity to undertake repairs processing slowdowns, could challenge Australian beef
or upgrades, leading to improved future efficiencies exports to domestic markets, impacting local processors
The Australian meat processing sector’s position as a world While meat exports have grown strongly, profitability in the
leader in its field has rarely been more evident than in the meat processing sector has remained an ongoing challenge
recent COVID-19-related food panic buying period. While some for many operators.
logistical challenges saw some supermarket shelves short of
Structurally, the industry has continued to follow the path
certain meat products for a brief period, the meat processing
of many other industries, seeing a reduction on overall players
sector continued to operate uninterrupted. This ensured that
accompanied by an increase in output. Over the past decade,
stakeholders, from cattle producers, right through to butchers,
the number of processing plants has fallen by around
supermarkets and beef consumers, were impacted as little as
6 per cent, though overall capacity has increased.
possible. This is in contrast to meat processors in the US and
Brazil, where interruptions to operations had major effects across
their supply chains that will continue to be felt for some time.
CONSOLIDATION OF AUSTRALIAN
While the impact of COVID-19 alone will cause lasting changes MEAT PROCESSORS
to the domestic meat processing sector, it is just one of several
major challenges facing the industry right now, and arguably
one of the smallest. Domestically, the industry is staring at the 900 900
challenges of very high cattle prices and a prolonged herd
800 800
rebuild, while the challenges of major export markets,
# of Establishments
particularly China, have been widely documented. At the 700 700
Ac/kg cwt
same time, these same challenges are also providing the
sector with some timely opportunities. 600 600
Structurally, the Australian meat processing sector forms 500 500
the backbone of Australia’s meat export market, including
beef, lamb, mutton and goat, which, in 2019/20, is worth 400 400
around $13.8b, a huge rise from the 2009/10 meat export
300 300
market of $5.6b. While the value growth of 146 per cent far ‘10/11 ‘13/14 ‘16/17 ‘19/20
outstrips the volume growth over the same period of 29 per
cent to 1.6 million tonnes, the growth in capacity utilisation # of Establishments EYCI (RH axis) ESTLI (RH axis)
at processing plants has allowed Australian exporters to Note: EYCI – Eastern Young Cattle Indicator; ESTLI – Eastern States Trade Lamb Indicator
capture this new demand. Source: IBIS, MLA
PAG E 1 6According to a 2017 Australian Competition and Consumer AUSTRALIAN MEAT EXPORTS
Commission (ACCC) report on the sector, a minimum scale VOLUME VS VALUE
of roughly 400 head of cattle per day was the benchmark
to achieving good levels of efficiency.
16,000 2,000
COVID-19 14,000 1,750
The ongoing operations of Australia’s meat processors during
the COVID-19 period were largely the result of quick, collegial 12,000 1,500
and decisive work shared across companies, industry bodies
kilo tonnes (swt)
and governments. The decision to designate the sector as an 10,000 1,250
AUD (Millions)
‘essential service’, and implementing measures early on for
worker safety ensured not only did processing continue, but 8,000 1,000
that integral adjoining logistical steps, such as cross-border
transport of cattle and meat, were also exempted and allowed 6,000 7500
the supply chain to continue operating from the farm to
the retail meat shelf. In the contrast, the US meat processing 4,000 500
sector saw major shutdowns, caused by factors such as worker
safety and industrial relations actions. 2,000 250
The consequences of this saw major build-ups of stock unable 0 0
to be processed with pig and cattle producers particularly 2010 2015 2020f
affected, and leading to a subsequent surge in meat supplies,
impacting both domestic and export markets. Similar issues Meat Export Volume (RH axis) Meat Export Value
and consequences are still being felt within the Brazilian meat Note: Meat includes Beef & Veal, Lamb, Mutton and Goat Meat
processing sector. Source: ABARES
DOMESTIC
With a major component of a meat processor’s profitability While the outlook remains unclear, many processors will be
being influenced by the price of live cattle or sheep, the hoping that the current beef trade dynamics with China are
current period is a challenging one. The national cattle herd solved relatively quickly, similar to the beef export labelling
is being impacted by a series of factors which are likely to see issues which occurred in 2017.
upward pressure on cattle prices for some time to come. After
Additionally, processors are also closely watching consumers
cattle producers across Australia offloaded a huge number of
demand in key markets, and how it may effect them. Aside
their cattle during the drought, including a record number of
from China, the impact of COVID-19 on export demand from
females as part of the slaughter, the rebuilding period of the
Japan and South Korea appears minimal at this time. However,
herd cycle will be longer than usual, leading to a period of
bigger queries remain over the US market, where the surge
relatively short supply. This is on top of the current post-
in meat availability following the reopening of a number of
drought period of restocking, as many cattle producers either
processing facilities may flow into the country’s domestic
hold their cattle back from markets or bid against processors,
market, reducing the demand for Australian exports,
to rebuild their own herds.
particularly manufacturing beef.
With domestic cattle prices back at around record levels at the
The flow on from the US meat build-up could also lead to
start of June, meat processors face the prospect of being unable
concern about competition in some of Australia’s major export
to pass on any reasonable margin to meat buyers. As a result,
markets, particularly in Asia, where heightened competition
some processors have taken the not altogether unexpected step
from not only the US but South American meat exporters
of closing plants or reducing operations until cattle prices fall.
could potentially reduce demand for Australian meat,
further impacting processors.
EXPORT
While the domestic sector will usually see reasonably UPSIDE?
predictable demand levels for meat, the greater uncertainty
Despite these challenges, the current quieter period for some
for meat processors clearly lies with the export landscape,
processors arguably presents a time of opportunity. As they
in the areas of regulation, demand and competition.
pull back from operating at full capacity, some processors will
In terms of regulation, the recent bans by China on several take the rare chance to undertake major repairs or upgrades
meat processors for apparent meat labelling irregularities of their operations. For some, this could include the adoptions
highlight a major risk for export-focused processors. Whether of new technologies into their processing lines. For these
due to labelling or other non-tariff measures (NTMs), larger processors, forgone revenue in the current short term could
processors run the risk of not only unexpectedly losing a major be a trade-off for increased efficiencies and lower costs in
source of revenue, but also for an unpredictable period of time. the longer term.
PAG E 17ANZ ECONOMIC UPDATE
RATES FOREIGN EXCHANGE
Globally, rates have fallen sharply as markets responded to Domestically, Australia’s handling of the global health crisis
both the significant impact on economies from COVID-19, has laid the foundation for improving consumer and business
as well as the associated significant amount of monetary conditions. However, an environment of increasing
policy easing implemented by central banks around the geopolitical tensions between the Australian Government
world. Locally, AUD rates have also collapsed following the and Beijing, and the possibility of a premature withdrawal
fall in global rates and substantial easing by the RBA. Though, of fiscal policy measures will introduce burgeoning risks that
the distinct approach by the RBA of introducing Yield Curve may yet have implications on Australia’s path to recovery.
Control (YCC) at the 3y tenor has resulted in some
More importantly for the currency, the RBA’s implementation
idiosyncrasies in the AUD rates market. Namely, a much
of YCC over the three-year ACGB only has resulted in Australia
steeper government bond curve compared to other nations
offering the steepest curve across the G10. While this has, and
like the US. We don’t think this steeper curve is likely to
will continue to, provide support to the AUD – we think that
disappear soon and expect it to steepen into year-end as
scope for upside from current levels is more limited.
ACGB issuance continues at an elevated rate. However,
in 2021 we think from a lack of progress on inflation and From here, as per our global view, we think the worst case
unemployment, the RBA will not only extend the Term scenario of cash flow impairments, solvency risks and
Funding Facility (TFF) but also introduce a quantity based geopolitical tensions have been taken off the table for now.
approach for ACGB and semi purchases at the 10y part of With tail risks diminished, flows back into Asian and EM growth
the curve. This will flatten the yield curve and prevent markets will benefit the AUD. The pace of the global recovery
additional underperformance of AUD rates. In addition, however will be an ongoing uncertainty. With conflicting
with unemployment likely to remain elevated and inflation forces at hand, we expect the AUD to remain range bound,
subdued, we think the cash rate is likely to remain at trading alongside risk sentiment while unlikely to see
0.25% for a few years. significant disconnect from fair value.
FX AND CENTRAL BANK POLICY RATE FORECASTS
FX Forecasts Current Sep ‘20 Dec ‘20 Mar‘21 Jun ‘21
AUD/USD 0.68 0.70 0.70 0.70 0.70
NZD/USD 0.64 0.65 0.65 0.65 0.65
AUD/NZD 1.06 1.08 1.08 1.08 1.08
USD/JPY 107.00 107.00 107.00 107.00 107.00
EUR/USD 1.12 1.16 1.14 1.14 1.11
USD/CNY 7.10 7.05 7.00 6.95 6.90
AUD/EUR 0.60 0.60 0.61 0.61 0.63
Rate Forecast Current Sep ‘20 Dec ‘20 Mar‘21 Jun ‘21
RBA cash rate 0.25 0.25 0.25 0.25 0.25
Feds fund rate 0.25 0.25 0.25 0.25 0.25
RBNZ OCR 0.25 0.25 0.25 0.25 0.25
PAG E 1 9CONTACTS
MARK BENNETT IAN HANRAHAN
Head of Agribusiness & Specialised Head of Food, Beverage & Agribusiness,
Commercial, Commercial Banking Australia – Institutional Banking
T: +61 3 8655 4097 T: +61 7 3947 5299
E: mark.bennett@anz.com E: ian.hanrahan@anz.com
AUTHORS
ALANNA BARRETT MADELEINE SWAN VIVEKA MANIKONDA
Associate Director Agribusiness Associate Director Agribusiness Senior Analyst, Institutional
Research, Commercial Banking Research, Commercial Banking Client Insights & Solutions
T: +61 417 356 573 T: +61 419 897 483 T: +91 8067 953 036
E: alanna.barrett@anz.com E: madeleine.swan@anz.com E: vivekasri.manikonda@anz.com
MICHAEL WHITEHEAD
Head of Agribusiness
Insights, Institutional
T: +61 3 8655 6687
E: michael.whitehead@anz.com
PAG E 2 0DISCLAIMER
The distribution of this document or streaming of this video broadcast officers, employees, contractors and agents of each of them (including the author)
(as applicable, “publication”) may be restricted by law in certain jurisdictions. (“Affiliates”), do not make any representation as to the accuracy, completeness or
Persons who receive this publication must inform themselves about and observe currency of the views or recommendations expressed in this publication. Neither
all relevant restrictions. ANZ nor its Affiliates accept any responsibility to inform you of any matter that
1. Disclaimer for all jurisdictions, where content is authored by ANZ Research: subsequently comes to their notice, which may affect the accuracy, completeness
or currency of the information in this publication.
Except if otherwise specified in section 2 below, this publication is issued and
distributed in your country/region by Australia and New Zealand Banking Except as required by law, and only to the extent so required: neither ANZ nor its
Group Limited (ABN 11 005 357 522) (“ANZ”), on the basis that it is only for the Affiliates warrant or guarantee the performance of any of the products or services
information of the specified recipient or permitted user of the relevant website described in this publication or any return on any associated investment; and,
(collectively, “recipient”). This publication may not be reproduced, distributed ANZ and its Affiliates expressly disclaim any responsibility and shall not be liable
or published by any recipient for any purpose. It is general information and has for any loss, damage, claim, liability, proceedings, cost or expense (“Liability”)
been prepared without taking into account the objectives, financial situation or arising directly or indirectly and whether in tort (including negligence), contract,
needs of any person. Nothing in this publication is intended to be an offer to equity or otherwise out of or in connection with this publication.
sell, or a solicitation of an offer to buy, any product, instrument or investment, If this publication has been distributed by electronic transmission, such as
to effect any transaction or to conclude any legal act of any kind. If, despite the e-mail, then such transmission cannot be guaranteed to be secure or error-free
foregoing, any services or products referred to in this publication are deemed to as information could be intercepted, corrupted, lost, destroyed, arrive late or
be offered in the jurisdiction in which this publication is received or accessed, no incomplete, or contain viruses. ANZ and its Affiliates do not accept any Liability as
such service or product is intended for nor available to persons resident in that a result of electronic transmission of this publication.
jurisdiction if it would be contradictory to local law or regulation. Such local laws, ANZ and its Affiliates may have an interest in the subject matter of this publication
regulations and other limitations always apply with non-exclusive jurisdiction as follows:
of local courts. Before making an investment decision, recipients should seek
independent financial, legal, tax and other relevant advice having regard to their • They may receive fees from customers for dealing in the products or services
particular circumstances. described in this publication, and their staff and introducers of business may
share in such fees or receive a bonus that may be influenced by total sales.
The views and recommendations expressed in this publication are the author’s.
They are based on information known by the author and on sources which the • They or their customers may have or have had interests or long or short
author believes to be reliable, but may involve material elements of subjective positions in the products or services described in this publication, and may at
judgement and analysis. Unless specifically stated otherwise: they are current any time make purchases and/or sales in them as principal or agent.
on the date of this publication and are subject to change without notice; and, • They may act or have acted as market-maker in products described in
all price information is indicative only. Any of the views and recommendations this publication.
which comprise estimates, forecasts or other projections, are subject to significant ANZ and its Affiliates may rely on information barriers and other arrangements to
uncertainties and contingencies that cannot reasonably be anticipated. On this control the flow of information contained in one or more business areas within
basis, such views and recommendations may not always be achieved or prove to ANZ or within its Affiliates into other business areas of ANZ or of its Affiliates.
be correct. Indications of past performance in this publication will not necessarily
be repeated in the future. No representation is being made that any investment Please contact your ANZ point of contact with any questions about this
will or is likely to achieve profits or losses similar to those achieved in the past, or publication including for further information on these disclosures of interest.
that significant losses will be avoided. 2. Country/region specific information:
Additionally, this publication may contain ‘forward looking statements’. Actual Australia. This publication is distributed in Australia by ANZ. ANZ holds an
events or results or actual performance may differ materially from those reflected Australian Financial Services licence no. 234527. A copy of ANZ's Financial
or contemplated in such forward looking statements. All investments entail a risk Services Guide is available at http://www.anz.com/documents/AU/aboutANZ/
and may result in both profits and losses. Foreign currency rates of exchange may FinancialServicesGuide.pdf and is available upon request from your ANZ point of
adversely affect the value, price or income of any products or services described contact. If trading strategies or recommendations are included in this publication,
in this publication. The products and services described in this publication are they are solely for the information of ‘wholesale clients’ (as defined in section
not suitable for all investors, and transacting in these products or services may 761G of the Corporations Act 2001 Cth). Persons who receive this publication
be considered risky. ANZ and its related bodies corporate and affiliates, and the must inform themselves about and observe all relevant restrictions.You can also read