COMMODITY INSIGHTS INFOCUS - DECEMBER 2020 - ANZ
←
→
Page content transcription
If your browser does not render page correctly, please read the page content below

ANZ AGRI
  INFOCUS
   DECEMBER
     2020

COMMODITY
 INSIGHTS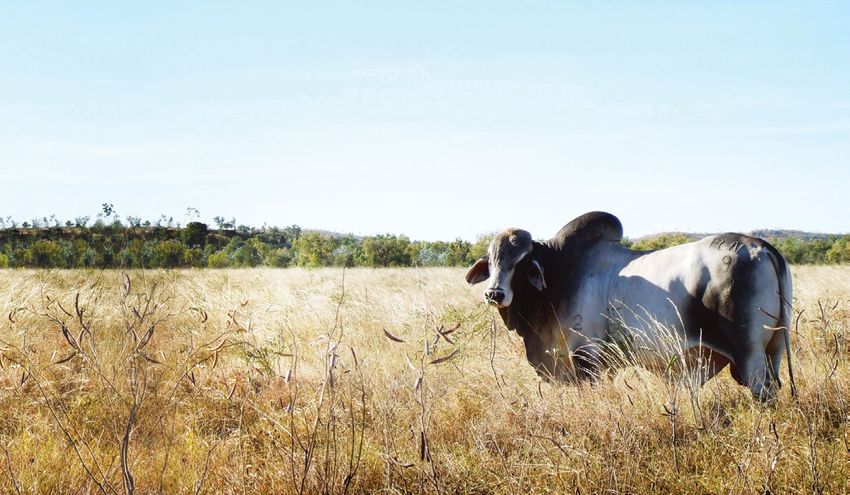
FOREWORD

              In reflecting on the 2020 year, the agriculture industry
               will be best remembered for being one of the most
                resilient industries in the face of global shutdowns.

The pandemic and its impact on supply chains, retail                        But it makes sense to pursue opportunities for expansion and to
spending, travel and working has been the defining feature                  diversify into new markets through additional trade relationships.
of one of the most tumultuous years in recent memory. For                   The China demand story will continue to be an enormous influence
Australian agriculture, 2020 has strangely been a year of positives         on global demand, and represents a net positive opportunity
for many despite the global upheaval. While the year started                for Australian agriculture, but we do need stability in order to
under the heavy shadow of drought and bushfires, considerable               maintain confidence and investment at the production level.
rain across eastern Australia would set the course for a strong
                                                                            On a commodity basis, the Australian wheat harvest is shaping
season and booming livestock prices.
                                                                            up very well, with prices holding firm despite strong domestic
In reflecting on the 2020 year, the agriculture industry will be            and global supply. Livestock prices are also strong with cattle prices
best remembered for being one of the most resilient industries              continuing their rise, despite queries of ‘how high can they go’,
in the face of global shutdowns. While isolated impacts were                and sheep prices recovering to sit above levels at the same time
felt throughout some sectors of the industry, including meat                last year, despite falls earlier in the year. Global dairy prices are up
processing in Victoria, fruit picking and air-travel-reliant exports,       on last year across most commodity sectors, except butter, and
the overwhelming story has been one of flexibility and adaptation           even the struggling wool sector is showing solid signs after finding
to new constraints. The move to online livestock auctions,                  its floor level and now appears to be steadily improving.
accommodating staff on-farm and managing shift rotations,
                                                                            As we look forward to the 2021 year, there are clearly a
and ensuring contact-free goods transfer are all examples
                                                                            number of hurdles for both the agriculture industry and the
of a robust and resilient supply chain.
                                                                            global economy as a whole to overcome. First among them are
The strong season for farmers was reflected in a recent ANZ Roy             the continuing waves of COVID-19 outbreaks and the impact of
Morgan Financial Wellbeing Indicator which found that in the                global economic growth and confidence. Second is the impact
five months to August 2020 and in the midst of the COVID-19                 of the new Biden administration on global trading systems and
pandemic lockdowns, the financial wellbeing of farmers and farm             stability. As Australia continues to navigate through the stoush
managers improved 4.3 per cent, from 60.2 to 62.8 (as a score               with China, the overarching influence of a more moderate
out of 100), compared to the national average which declined                United States administration is likely to set the scene for
6.4 per cent, from 60.7 to 56.8. The report also found that regional        ongoing negotiations.
Australians experienced a much smaller decline (0.7 per cent)
                                                                            Having said all that, Australian farmers can go into 2021 with
in their ability to meet financial commitments, compared to
                                                                            a strong sense of optimism and with a generally strong 2020
a decline of 8.6 per cent experienced by those living in
                                                                            under their belt. And this makes a monumental shift from how
capital cities.
                                                                            we saw the world at the start of the year.
On the downside, the ongoing escalation of the China–Australia
trade tensions continues to make many in the industry nervous.
The unpredictable approach of the Chinese to halting or impeding
Australian agricultural exports appears to be aimed at displaying
the Chinese Government’s displeasure at the Australian Government.
The message that is being heard at the farm-gate is far more
straightforward however, with some in the industry now questioning          Mark Bennett
the long-term value and certainly the concentration risk that has           Head of Agribusiness & Specialised Commercial,
emerged. Given our location, Australian agricultural exports will           Commercial Banking
always be closely tied to export markets across Asia, with China
                                                                                  @bennett2_mark
remaining one of the most important of those markets.

                                                                       PAG E 01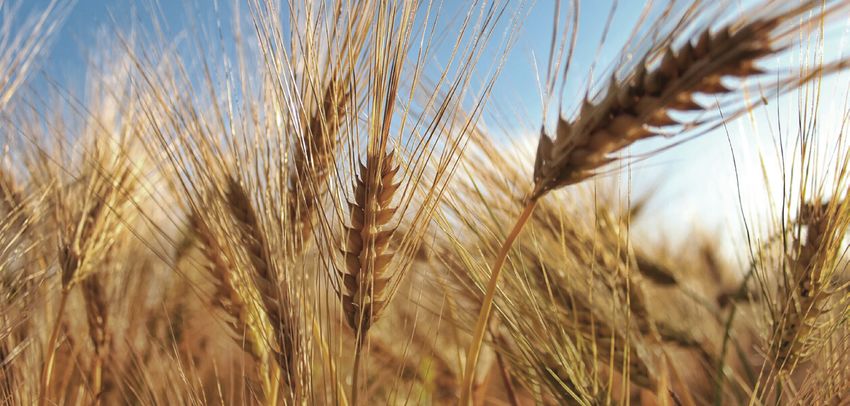
WHEAT & GRAIN INSIGHTS

OVERVIEW

+ As the Australian wheat harvest continues, we are expecting      – Domestic prices have dropped off slightly as a result of the
  to see the domestic production volumes beat expectations           strong harvest and concerns over mooted export bans to China
  and push towards 30 million tonnes                               – Concerns linger over the disconnect between record
+ The global outlook for the coming year will be impacted            global crop levels and the continuing rally in prices in the
  by China, as they chart their way out of African Swine             face of increasing COVID-19 infections and recent rains
  Fever and increase domestic pork production                        in the northern hemisphere
+ Global grains prices continue to grow strongly on the back       – With the world awash with grains, and prices being supported
  of latest USDA estimates of slightly lower global production,      in large part by China’s import demand, there is a downside
  increased consumption and a drop in ending stocks                  risk if China’s forecast demand does not come to fruition

As the harvesters move south, the Australian wheat                 Globally, the International Grains Council (IGC) grains and
harvest is looking strong. Off the back of a bumper crop in        oilseeds index (GOI) reached its highest point in six years
New South Wales, this year’s wheat crop is expected to better      as a result of strong export demand and rising consumption.
Australian Bureau of Agricultural and Resource Economics and       The GOI rose 8 per cent in October alone and caps off three
Sciences’ (ABARES) forecasts and push towards the 30 million       months of stellar price growth. Much of the growth has come
tonnes mark. Strong forecast global consumption and export         courtesy of the forecasts from the United States Department
demand, particularly for feed wheat in China, is extending         of Agriculture (USDA) of slightly lower production, higher
the global price rally such that the global indicator price is     consumption, higher exports and lower ending stocks. USDA
sitting 25 per cent higher than this time last year. However,      forecasts from early November indicate lower global production
concern over the potential for Chinese import sanctions            in Argentina and Turkey which more than offsets a forecast
on Australian wheat, as well as the strong harvest, have kept      higher Russia harvest due to some timely rains as the crop
a lid on domestic prices. Globally, there is some concern that     went into the ground. Global consumption was boosted by
China’s booming export demand may not be able to                   1.7 million tonnes to 752.7 million tonnes, based primarily on
maintain its pace.                                                 the back of higher feed and residual use in China, the European
                                                                   Union (EU) and Vietnam. Global trade was also forecast up
With grain handler GrainCorp expecting a harvest from the
                                                                   as a result of exports from Russia, EU, and Kazakhstan.
eastern states to rival the 2016–17 record year, the fluctuating
fortunes of the New South Wales crop are very much on the          Domestic prices have, understandably, trended lower on
upswing this year. Across Queensland, New South Wales and          the back of the strong harvest rolling in, but also due to the
Victoria it has been reported that both quality and quantity       unofficial warnings of trade bans on Australian wheat imports
are strong across cropping regions and that the New South          in China. While Australian wheat producers are very aware of
Wales crop alone could be over four times last year’s harvest      the risks posed by China’s warnings, it is also clear that an
– coming in at between 10 and 12 million tonnes. On that           import ban on wheat would not pose such an immediate
basis, and given a continuing strong harvest into Victoria, the    threat as it did to Australia’s barley producers, as China is
national wheat harvest could reach above official forecasts        not a major destination for Australian wheat exports.
and towards the 30 million tonne mark.

                                                              PAG E 02
Prices remain historically strong, however, sitting just                                    IGC GRAINS AND OILSEEDS INDICES
 below the prices received the same time last year when
 supplies were dramatically lower. For example Australian
                                                                                                          400
 Premium White Wheat (APW1), Port Adelaide is receiving
 just over $300 a tonne, down from $328 at the end of
 October. Export prices for APW1 are sitting on par with                                                  300
 most other exporting nations at an average across ports

                                                                                            Index
 of $US255/MT (FOB).
                                                                                                          200
 Underlying the strong global and domestic prices,
 however, there is some concern over the seeming
 disconnect between the continuing increase in prices
                                                                                                          100
 and very strong production levels. Currently, prices seem                                                           2016             2017        2018          2019        2020
 to show no reaction to reports of a record global harvest,
 leaving prices somewhat exposed to any large changes                                                     Wheat             Soyabeans            Rice       Barley          Maize
 in export demand or consumption profiles.                                                   Source: International Grains Council
 Looking forward, the global price of wheat has been
 heavily reliant on food and industrial consumption through
 2020. For the coming year, it is likely to be the returning pork                            GLOBAL CONSUMPTION AND STOCKS
 industry in China and the demand for feed to rebuild the
 industry following African Swine Fever that will provide the
                                                                                                          800
 greatest impetus for consumption growth. Given continual
 and enduring strong production across the world as a whole,
                                                                                                          600
 as well as the large stockpiles currently being held in China
                                                                                            '000,000 MT

 and India, the consumption profile will be the one which
 determines wheat prices into the future.                                                                 400

                                                                                                          200

                                                                                                            0
                                                                                                                2010/11 2012/13 2014/15 2016/17 2018/19 2020/21

                                                                                                                     Food, seed and industrial           Feed          Stocks
                                                                                             Source: USDA PSD, ANZ

 GLOBAL WHEAT PRODUCTION

                 900

                 750

                 600
MT (‘000,000)

                 450

                 300

                 150

                    0
                            2010/11   2011/12      2012/13        2013/14      2014/15      2015/16             2016/17        2017/18         2018/19    2019/20       2020/21

                Australia        Canada         China        EU        India       Others                 Pakistan           Russia          Turkey       Ukraine        US
 Source: USDA PSD, ANZ

                                                                                    PAG E 03
BEEF INSIGHTS

OVERVIEW

+ The forecast for a reasonably wet few months heading                   – The record high cattle prices will squeeze margins
  into 2021 means feed availability and cost is unlikely                   for processors and could impact production values
  to be an issue                                                         – The recovery of China’s pig herd numbers from
+ The tight herd supply and ongoing demand by restockers                   African Swine Fever
  should see cattle prices remain relatively strong                      – The relatively high Australian dollar continues to
+ While current bans on beef imports by China are                          impact Australia’s beef export competitiveness
  concerning, they have so far been limited to five
  processing plants

The Australian beef and cattle industry has experienced a year           With forecasts of a wet summer, while the plentiful grass
like no other. For an industry which was arguably hit harder             in many cattle regions will thin, there is little sign of a lack
by the drought than any other agri sector, the arrival of the rain       of feed in most regions. Similarly, the conditions which have
had an impact on prices that very few would have predicted.              led to forecasts of a major domestic grain crop, together
The disruptions from COVID-19 to the beef supply chain hit               with abundant hay, mean that low feed costs will maintain
the headlines, particularly in the US, but also in Australia – for       the incentive to increase individual herds.
processing, particularly in Victoria. Meanwhile, throughout the
                                                                         In addition, many producers will be mindful of the fact that
year, the issue of the potential impact of Chinese bans on
                                                                         the slow national herd recovery process means that while
Australian beef imports continued to loom over the sector,
                                                                         cattle supply will gradually increase, it will unavoidably take
leading to uncertainty and caution, though with no major
                                                                         time. Under ANZ modelling, given a return to optimal female
impact on price.
                                                                         slaughter rates, it could take the national herd until 2028 just
Of all the many discussion points around the beef and cattle             to reach the 2015 levels of over 28 million head.
supply chain this year, perhaps the biggest one has been the rise
                                                                         Another factor which could potentially come into play
and rise of cattle prices. This time in 2019, cattle prices had fallen
                                                                         is whether a reasonable number of producers may look
to some of the lowest levels in five years. For the first half of the
                                                                         to change their operations to increase their cattle numbers,
past decade (2010–2014) the benchmark Eastern Young Cattle
                                                                         whether through running fewer sheep, planting lower crop
Indicator (EYCI) had sat steadily between 300 and 400 c/kg. When
                                                                         acreage or reducing dairy herd numbers. Ultimately, producers
the Chinese market opened up to more Australian imports, prices
                                                                         are making their business decisions on the belief that the low
quickly rose to between 500 and 700 c/kg for the next three years,
                                                                         national herd numbers will mean that processors will have
until the drought-induced sell-off of cattle by producers saw
                                                                         no choice but to pay well, that feedlots will keep buying
prices fall over 2018 and 2019, back below 500 c/kg.
                                                                         to meet demand and take advantage of low feed prices,
The price rise in 2020 has been unparalleled, even by 2015–16            and that prices will still be high for next season’s calves.
standards, and despite ongoing predictions by many in the
                                                                         Given these drivers, there is a reasonable chance that cattle
industry that a market correction is imminent, there has still
                                                                         prices could continue climbing, particularly given the weaner
been no sign of one. And as 2021 approaches, the question
                                                                         sales which will be held in many regions in coming months,
is how long this will continue?
                                                                         or that any price fall will be minimal.
Certainly, the fundamentals for prices staying reasonably high
                                                                         For processors, the ongoing strength of prices presents
are strong, as cattle producers across Australia continue to drive
                                                                         a challenge which will need to be absorbed somewhere.
prices through restocking, to build up their depleted herds,
or ‘up-stocking’, in looking to run as many head as possible,
on the expectation of prices remaining strong.

                                                                  PAG E 0 4
CHINA’S BEEF IMPORTS AUSTRALIAN CATTLE HERD REBUILD FORECAST
1,800 30 60
Cattle Herd ('000,000)
'000 tonnes swt
1,200 28 40
%
600 26 20
0 24 0
2013 2014 2015 2016 2017 2018 2019 2020 2010 2020 (YTD) 2029
(YTD)
Australia Uruguay NZ ANZ (LHS) Female cattle slaughter (RHS)
Brazil Argentina Other MLA (Oct '20 forecast) (LHS)
Source: MLA, ABARES, ANZ Source: MLA, ABARES, ANZ
AUSTRALIAN CATTLE PRICES VS EXPORTS
900 1.4 12
Export unit price (AUD/kg)
800 1.2 10
Million tonnes (swt)
700 1.0
8
Ac/kg cwt
600 0.8
6
500 0.6
4
400 0.4
300 0.2 2
200 - -
2005 2008 2011 2014 2017 2020
52W-High (LHS) EYCI (LHS) 52W-Low (LHS) Export unit price (far RHS) Yearly exports (RHS)
Source: MLA, ABARES, ANZ
As some processors have already tried, the option does exist The outlook for exports to China will be undoubtedly be
to reduce capacity or shifts, while waiting for the market to influenced by the policies of the new US administration,
cool, although as domestic and export orders will eventually and how hard they push American beef to compete with
need to be filled, this can only be a short-term option. More the Australian product in China – or other markets. In addition,
likely is that some of this cost will be passed on to the retailer, as China’s pig herd continues to rebuild after the worst of the
and ultimately the consumer. While theories vary, it seems African Swine Fever (ASF) reduction, it will be important to watch
reasonable that a moderate increase in beef prices would have how much this eats into China’s meat import requirements.
minimal impact on domestic consumption, particularly at a time
ASF could also impact other markets, if a build-up of beef in
when many Australian consumers are coming into the Christmas
global supply chains, originally planned for China, needs to
and summer BBQ season, as well as going through a relaxed
be utilised in markets like Korea and Japan, or reduces the US
post-COVID-19 period, when household spending may
demand for Australian beef. For Japan and Korea, as with China,
be less tightly scrutinised than earlier in the year.
the actions of the new US administration, particularly around
The outlook for beef exports heading into 2021 continues to trade agreements and promotion, will impact the level of
be dominated by question marks over the outlook for trade with competition Australia faces in these markets.
China. While China initially banned imports from five Australian
For all the different challenges it has faced over the past three
processing operations, the lack of any further action since
years, the Australian beef industry, and beef producers, find
August has led to some cautious speculation that this may
themselves in a relatively strong position heading into 2021.
be the extent of the bans.
That said, given the circumstances required over the coming
Trade with China is clearly down – beef exports to October this year for current prices to prove rewarding, there will be no
year were 27 per cent down on the previous year – but this has room for complacency.
also been impacted by triggered safeguard tariffs on Australian
beef, as well as strong competition from much cheaper South
American competitors, at a time when the Australian dollar
remains surprisingly strong.
PAG E 0 5SHEEP INSIGHTS
OVERVIEW
+ After a year of ups and downs, saleyard prices are – The sheep market has been impacted more than most
performing well on the back of continuing restocker by the events of 2020 through processing plant closures
demand and returning export demand and export demand reductions
+ Providing good seasonal conditions and restocker demand – The spring flush from Victoria has yet to really hit the
continue, 2021 may see the National Trade Lamb Indicator market, meaning some softening of prices is expected
(NTLI) reach a peak, challenging the 1,000c/kg mark – Export levels have not yet fully recovered and important
+ Restocker demand and the low national flock will continue markets such as China still continue to lag export levels
to support prices into the foreseeable future from last year
The Australian sheep industry has suffered from more volatility To date, yardings in South Australia are up significantly,
than most other commodities through 2020, after feeling the although yardings in Victoria are yet to record to the numbers
impacts of meat processing closures in Victoria, a reduction seen in the spring flush – however coming weeks should see
in export demand due to COVID-19 and falls in the wool price. those numbers increase strongly.
Having said that, indicator prices are currently sitting higher
Looking forward at expectations for 2021, the continuing
than this time last year and demand is strong for both sheep
demand from restockers for lambs and ewes, as well as the
and lambs as producers continue to rebuild following the
global economic recovery driving export demand, particularly
drought. Looking forward to 2021, the outlook is strong and
for lamb, should see strong upward pressure on prices.
with the national flock rebuild continuing at pace, the peak of
Provided good seasonal conditions also continue the NTLI
NTLI may threaten the 1,000c mark. A number of factors may
could peak at close to the 1000c/kg mark.
pull the market up short of that mark however, and producers
should continue to keep a ‘weather eye’ on export demand Saleyard prices are holding firm in the face of the spring flush,
from the US, Middle East and China and the global economic however, with ongoing restocker demand smoothing over
recovery following COVID. the impact of increased yardings. The NTLI is now sitting over
760c/kg, almost 50c/kg higher than this time last year, although
Lamb slaughter rates in the east are steadily increasing as
there was some slight softness in the South Australian market
is usual at this time of year, and slaughter numbers are sitting
due to yarding numbers while Victorian prices firmed. Prices
at similar levels on previous years. However New South Wales
in Western Australia are also holding firm, however much of this
is currently undertaking the bulk of the eastern states’
stems from destocking and transporting ewes and lambs across
slaughtering as Victoria lags slaughtering at this time last year.
to eastern states. Relatively poor seasonal conditions, and low
Slaughter rates in the west for lambs are down substantially
soil moisture in the west and high ewe prices in the east are
from this time in 2019, primarily as a result of a large number
seeing Western Australian producers take advantage.
of lambs being shipped across the Nullarbor to eastern states.
The story for mutton slaughter is markedly different with sheep The real story is mutton prices which, at the time of writing,
slaughterings down almost 50 per cent on 2019 in the east, saw the National Mutton Indicator sitting at over 630c and
although on par with last year in the west. There is a supply while not yet back to the record levels seen early in 2020,
lining up in the saleyards, however, as yardings start to the price spread between trade lambs and mutton is the
increase strongly across the country. smallest on record.
PAG E 0 6EASTERN STATES SALEYARD INDICATORS
1,100
900
Ac/kg
700
500
300
2017 2018 2019 2020
Restocker lamb Merino lamb Light lamb Trade lamb Heavy lamb Mutton
Source: MLA
LAMB EXPORTS
30
25
Tonnes swt (’000)
20
15
10
5
0
-5
2018 2019 2020
US China UAE PNG Jordan Qatar Malaysia Japan UK Bahrain Other
Source: MLA
This is obviously stemming from lack of supply as sheep WEEKLY LAMB YARDINGS
slaughterings are over 40 per cent below the same time last
year. This comes as producers retain ewes for an additional
year or two to help boost their flock replacement. At the same 350
time, export demand for mutton continues to be strong from
300
China as a result of ASF reducing pork supplies, as well as lower
global economic growth pushing consumers towards cheaper
cuts of meat. 250
Lamb exports continue to grow out of the COVID-19 period
200
'000 head
and while not yet back to the same levels seen last year, we are
seeing solid growth. While calendar-year-to-date lamb exports
are down 7 per cent on 2019 and mutton exports are down 150
21 per cent, this deficit is being eroded as markets such as US,
China and the Middle East start to return to normal. Also on the 100
positive side, lamb meat exports have not yet been flagged as
a potential target of China’s trade bans, primarily because the
50
Australian industry’s key role in international trade, meaning
that China would find it difficult to source enough sheep meat
from alternative markets. And while this is no safeguard against 0
Jan Feb Mar Apr May Jun Jul Aug Sep Oct Nov Dec
future trade sanctions, Australia’s sheep meat exports are
sufficiently diversified across a range of destinations to make 2018 2019 2020
finding alternative markets for Australian exports easier to find
Source: MLA
than for some other commodities.
PAG E 07WOOL INSIGHTS
OVERVIEW
+ September’s historic lows seem to have subsided with – Erratic prices are likely to continue as we see COVID-19
Eastern Market Indicator (EMI) consistently remaining pandemic continue impact global demand
above the 1000 c/kg mark. – Buyers looking for clarity from National Wool Identification
+ Prices are still profitable and premiums are available on non-mulesed wool classification
to those with differentiated products such as super fine
non-mulesed wool
With shearing well and truly underway across Australia, WOOL PRICES BY MICRON
the industry has seen consistently higher volumes hitting
the market in recent weeks and some significant intra-week
2,500
volatility in prices.
The second wave of COVID-19, sweeping through Europe 2,000
as it enters winter, has slowed production as a result of reduced
global demand for retail and consumer spending. On the other
hand, the industry continues to see strong buying from China, 1,500
c/kg clean
with high demand from the domestic market.
This increase in Chinese buying raises concerns about wool 1,000
exports being impacted in the ongoing trade tensions, should
China pull out of local wool markets. Australia is by far the
500
largest supplier of wool to China, making the trade relationship
mutually beneficial and although they may have some stocks,
Chinese processors would still need to purchase wool to meet 0
Jun ‘19 Apr ‘19 Nov ‘20
their ongoing requirements.
Producers with premium quality product in the ultra-fine 17 19 21 MC EMI
merino range will continue to look towards markets such as Source: AWN, ANZ
Japan and Italy. While formal wear and suits may not currently
be ‘en vogue’ the finer micron wool is highly suitable for
wearing against the skin due to its low itch factor and is Recently there has been some debate in the industry as to
therefore ideal for the growing athleisure market. whether ‘Sheep Freeze Branding’ should be independently
identified; while it technically meets the current description
There is also a growing trend in buyers paying a premium provided by AWEX of non-mulesed, the question is whether it
for products where specifications under the National Wool aligns to expectations of customers. Further studies will need
Declaration (NWD) have been met. Both International and to be completed to provide buyers with the assurance that the
local apparel brands, such as Hugo Boss and Country Road, are new method meets their expectations for welfare standards.
seeking out ‘ethical’ sources of wool from non-mulesed animals
for their garments. There is also a trend toward traceability of To date, the industry has not seen significant issues with
the product back to the grower, with NZ implementing this lack of shearing mobility as a result of border closures, as was
practice as standard in 2018. earlier feared. Additionally, with processors keen to ensure
they have wool stocks to cover the three-week Christmas
AWEX data shows non-mulesed Merinos consistently receiving break in auctions, volumes are likely to continue to see
a premium in the finer micron ranges even while prices have strong prices maintained.
dropped across the board for wool. Analysis by SustainWool
from July 2019 has shown a higher clearance rate of 81 per cent
for Non-mulesed/Ceased mulesed wool versus just 74 per cent
for mulesed without pain relief or undeclared.
PAG E 0 8COTTON INSIGHTS
OVERVIEW
+ Australian cotton harvested area for 2020–21 tipped – Global supplies of cotton are ample, with record stocks
to more than triple from last season, as rainfall replenishes to use ratios of over 90 per cent for the last two years
soil moisture profiles and on-farm storages – Ongoing lockdowns in Europe and potentially the
+ La Niña predicted to significantly improve water United States likely to impact on consumer spending
flow through the Murray Darling Basin, increasing – Uncertainty and volatility likely to continue in the
water allocations market where the influence of stockpile movements and
+ Australian cotton industry continuously improving the US–China trade relationship remain leading factors
production efficiencies
Australian cotton producers are looking forward to a better AUSTRALIAN COTTON AREA,
year ahead after significant rainfall was received across much of PRODUCTION AND EXPORTS
the country’s cotton producing landscape. While many areas are
seeing a full profile and water filling dams, others will be limited
1,200 600
to small allocations as some areas have, so far, missed rains.
1,000 500
Thousand tonnes
Thousand Ha
ABARES forecasts production of up to 2 million bales compared 800 400
to a 12-year low of 590,000 in 2019/20. However, with lower 600 300
global demand and high stock to use ratios, ABARES forecasts
400 200
cotton prices to reach their lowest levels (in real terms) since
2001–02 a forecast decline of 6 per cent from 2019–20. 200 100
0 0
Across much of the eastern seaboard we are seeing increased 16–17 17–18 18–19 s 19–20 f 20–21 f
flows through river systems, leading to increased planting.
In a drought year with limited water, a grower may choose Lint production Export Volume Area harvested
not to plant and instead sell their diminished water allocation Source: AWN, ANZ
to another farmer growing perennial crops like vineyards
or orchards.
At the start of this season, China had stocks which equated
Some growers in NSW are receiving their first water allocations
to 98 per cent of a year’s domestic demand. When adding
in three years. This has allowed planting areas to increase up
domestic production to the equation, it points to reduced
to 220 per cent in NSW, however this remains well below the
import requirements.
10-year average. Meanwhile parts of Queensland are yet to see
above average rainfall expected from the forecast La Niña. While China is by far the leading spinning centre, markets
such as India, Bangladesh and Vietnam are growing. Mill-use
Europe, the United States and Japan are responsible for
is currently at a 10-year low following the global slow down
importing over 60 per cent of global apparel imports and
however, with many of these processing countries seeing a
with additional COVID-19 control measures in Europe and
recovery, this is expected to improve. Australian exporters will
potentially in the US as President Elect Joe Biden takes office,
need to focus on marketing the quality and consistency of
global economic recovery is likely to be slow. Restrictions have
product to find market share for the increased production.
reduced consumer demand for apparel and disrupted all parts
of the textile supply chain, with demand for apparel and soft Lower cotton prices will result in some competition for land
furnishings highly income-elastic. While spending on services from rice, sorghum and potentially pulses looking increasingly
was reallocated to goods early in lockdown, a slower recovery more attractive.
over the next 12 months is likely to put downward pressure
on spending as confidence and demand wanes. While longer term price forecasts remain closer to $500/bale,
the focus on improved efficiencies in production by the local
While there has been no official change to the cotton trade industry means it remains at a profitable level.
agreement between China and Australia, Chinese spinners and
mills have been discouraged from buying Australian cotton, The question is, given the volatility of climate in Australia and
with the warnings that they may have their future quotas cheaper producers overseas, can cotton remain a profitable
slashed or be forced to pay up to a 40 per cent tariff. long-term option?
PAG E 0 9DAIRY INSIGHTS
OVERVIEW
+ After decades of gradual decline, Australian dairy herd – Ongoing strong prices in other agri sectors, especially
numbers have now remained steady for the past few years beef and sheep, may see increasing competition for
+ Average milk yields in the Australian dairy herd have dairy land usage
continued to rise steadily and strongly – Gains from consolidation in dairy production operations
+ Regulatory changes to the New Zealand dairy sector may may be less than competing agri sectors, impacting
reduce the NZ level of competition in key markets competition for outside investment
+ Yields continue to rise with technology and efficiency gains – While global dairy prices are currently strong, they
remain volatile, with particular exposure to geopolitical
trade dynamics
While it passed unnoticed outside the industry, this year After a series of gradual reforms over several years, in July 2000,
marked the 20th anniversary of one of the most momentous the Federal Government abolished the last two major price
events in the history of the Australian dairy sector. In July 2000, support mechanisms. Effectively, the result set the industry onto
the Australian dairy industry was deregulated, an event which the path where it sits today, where prices are directly impacted
still creates discussion and debate. Undeniably, the 20 years by the world market and the actions of the major Australian
since that time have been a rollercoaster ride for the industry. retail players, while the major processors largely play the role
But as the Australian dairy sector looks toward 2021 and the of providing farmgate price options to most producers.
decade ahead, there are many signals that the coming period
While the impact of the events at the time were major, an
may see the rewards for the years of hard work.
analysis of the industry’s current prediction clearly provides
To grasp the impact of dairy deregulation, and the impact that a cause for optimism.
the events of 2000 may be having on the outlook for Australian
Looking ahead, Australian milk production looks set for
dairy in the 2020s, it’s important to look at what the events of
one of the strongest volume rises in 20 years. With ABARES
the time entailed.
forecasting domestic milk production to rise 3 per cent to
Like a number of other Australian agri sectors – notably wool 9 billion litres in 2020/21, this would also mean that it is roughly
and wheat – the Australian dairy industry operated for decades equivalent to 2010 levels, continuing a decade-long trend
under a regulated structure. The prices farmers received were of having roughly plateaued, albeit with some volatility.
kept high by subsidies through the state dairy boards, while
At the same time, forecasts would also indicate that the
the negotiations and sale of dairy products for export was
national milking herd has also roughly plateaued. From
centrally controlled by the Australian Dairy Produce Board,
2.2 million milkers in 2000/01, out of a total dairy herd of
which became the Australian Dairy Corporation. As the system
3.2 million, milker numbers are forecast to remain at around
evolved through the 1980s and 1990s, analysis by subsequent
the 1.4 million mark in 2020/21 for the third year in a row,
governments found that the industry in 1986 was receiving
again roughly similar to the 2010/11 herd size.
around 57 per cent assistance, compared to 11 per cent at the
time for other agricultural industries, all while consumers were A stabilisation of these overall herd numbers is arguably
paying hundreds of millions of dollars more than necessary a stronger sign of market sentiment in the dairy industry than
for milk and dairy products. for a sector such as beef cattle. For the latter, the high female
slaughter rate in the herd, caused by several years of drought,
has meant that herd numbers were forced down, and that a
slow recovery in the herd size, to allow producers to restock,
is unavoidable.
PAG E 1 0AUSTRALIAN DAIRY EXPORTS AUSTRALIAN DAIRY EXPORTS
(BY VALUE) – MAJOR MARKETS (BY VALUE)
4,000 2,500
2,000
3,000
1,500
$Am
$Am
2,000
1,000
1,000
500
0 0
1990/91 1990/91 2010/11 2020/21 1989/90 1999/00 2009/10 2019/20
Butter SMP Other China Japan US
Cheese WMP Total dairy Indonesia Korea ROTW
Source: Dairy Australia Source: Dairy Australia
For the dairy industry, however, where the ability to ramp In terms of exports, the outlook remains similarly
up (or down) the herd numbers is far more at the discretion promising, albeit with the same caution being felt by all
of the producers, this stabilisation indicates that producers other agri commodities. This is emphasised by the fact that
are not changing land use for sectors such as beef or sheep. China now makes up one-third of the value of Australia’s total
Rather, they are showing confidence in the sector by choosing dairy exports. The outlook for these exports remains unclear.
to stay in it, over the alternatives. While China has initiated trade bans or disruptions on a number
of agri sectors, it is also possible that the importance placed
A further reason for confidence in the future of the sector
by Chinese consumers on the perceived safety and quality
is the steady average yield growth of Australian cattle, at
of Australian Infant Milk Formulas and Skim/Whole Milk
a rate and consistency unmatched by any other major
Powders, particularly for their children, could make this
agri sector. For 2020–21, ABARES is forecasting the annual
a sensitive trade channel to disrupt.
litre/cow production at 6,432 litres. This is up 11 per cent over
the previous 10 years, 32 per cent over the previous 20 years, To a lesser extent, Australian dairy exports may also benefit
68 per cent since 1990 and a staggering 123 per cent since from some of the regulatory changes which may impact the
1980. Given that yields are continuing to rise while many New Zealand dairy industry, which are forecast to see milk
technological and efficiency gains are seeing costs fall, this production decline, potentially reducing export competition
bodes well as a positive sign for producers, particularly those with Australia in key markets.
looking to benefit from growth in scale.
One industry factor which will have a major bearing on the
On the domestic demand side, dairy is likely to be one of direction of the industry will be the rate of outside investment
the food categories which emerge stronger from the 2020 into the supply chain, particularly into the production sector.
COVID-19 disruption. As Australian households have cooked Looking back over the past decade, the growth of new entrants
far more at home, they have utilised far more ingredients such and investors into the sector was at its strongest around five
as cheese and natural yoghurt for their recipes. Interestingly, years ago, driven by the promise of growing exports to China,
one category which has suffered has been flavoured milk, as well as the reasonable availability of smaller or distressed
presumably due to the disruptions to people travelling to production assets. In the years since then, the investment flow
work, and to the trades who are traditionally the biggest has focused more on sectors such as grain and beef, potentially
consumers, although this is likely to return. due to their lower labour intensiveness and less volatile global
markets, as well as to permanent crops such as nuts and citrus.
While Australian per capita consumption of milk has been
falling marginally over the past decade, it remains among the Looking ahead, given that the consolidation of the sector
world’s largest consumers per head. Interestingly, Australians has led to the growth of greater average farm efficiencies,
have continued to drink more regular milk and less reduced fat and that infrastructure costs are falling for new and more
milk over the past decade, with the market shares moving from advanced dairy operations, and that the outlook for domestic
50 per cent regular/31 per cent low fat in 2010 to 57 per cent and export consumption remains reasonably strong, it is quite
regular/24 per cent low fat in 2020. The remainder of liquid milk foreseeable that investors keen to enter the Food, Beverage
consumption is largely made up of flavoured and UHT milk. and Agriculture (FBA) space will be having a whole new
look at the dairy industry.
PAG E 1 1PIG INSIGHTS
OVERVIEW
+ After a dramatic decline in numbers due to African Swine – The quick recovery of China’s pork supply chain may see
Fever (ASF), China’s domestic pig herd is recovering some disruption in the global pork and meat trade, which
reasonably quickly, almost back to pre-ASF levels had anticipated a greater import need by China in the
+ The Chinese pork supply chain is evolving rapidly from longer term
one of largely small farmers to more modern, efficient – While the threat of ASF to the Australian pork industry
and safer process has greatly reduced, it remains an area requiring diligence
+ The Australian pork industry continues to see steady by the sector
growth, including rising export premiums to key markets – Australian pork products continue to face competition
in the local market, particularly from the US
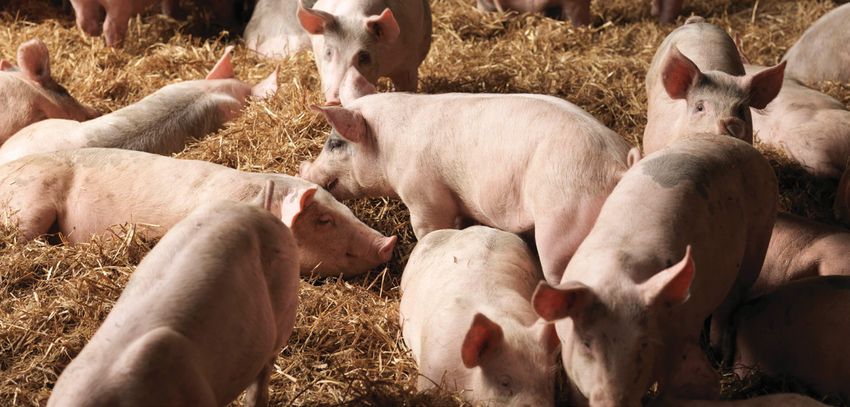
For the past two years, the main discussions around pigs and The challenge for exporters from Australia and globally will
pork in agricultural circles have been around their indirect impact. be how to plan and position for China’s meat consumption
The spread of ASF, through China and globally, has had major and import needs as the pig herd recovers. As part of this,
ramifications not just for the global pork market, but for the stakeholders will need to decide whether the Chinese per
entire global meat sector, especially beef and sheep meat. capita consumption of pork will or will not return to previous
levels, and if so, what proportion will be taken up by imported
At the same time, Australia’s domestic industry, while
beef, sheep meat and other meats.
considerably smaller than the other meat industries,
continues to grow at a steady rate of production. At the same time, global pork exporters will be looking to
gear their production levels or redirect certain levels of their
In China, while the impact of ASF continues to be felt, the
exports, if the previously forecast long term Chinese pork
country is also going through an impressive recovery period
import needs are reduced faster than originally forecast.
to build its pig herd and pork production numbers. Prior to the
start of ASF, China had around 420 million pigs, or over half of While the Australian pork industry is not on a major scale
all pigs on Earth. By late last year, this number had fallen over in comparison to the largest global pork producers, it has
a third, to 264 million pigs, though is now estimated to have continued to see an ongoing upward trend in production
recovered to around 375 million pigs. as well as yields. In terms of consumption, Australian pork has
continued to trend upwards for decades, from 100,000 tonnes
A major factor in this recovery has been the transformation of
60 years ago to a forecast of over 600,000 tonnes in 2021.
China’s pork production sector, from one dominated by small
Of this, around two-thirds is produced domestically, while
farmers, to one increasingly dominated by large scale industrial
around a third is imported.
pork production operations. By doing this, China is not only
working towards restoring the domestic supply of pork to The Australian pork industry is also seeing reasonable export
consumers, but seeking to avoid a repeat of the conditions value growth, with annual pork exports to September 2020
which led to the previous ASF outbreak. up almost 30 per cent to $165 million. In a sign of rising pork
prices, this is despite annual export volumes only being up
During the period of ASF, China markedly altered its animal
2 per cent, to 40,000 tonnes. Singapore is the largest market
protein consumption patterns, replacing the unavailable pork
for exports for almost half the export revenue, followed by
supplies with substantial imports of beef and, to a degree, sheep
Vietnam, Papua New Guinea, New Zealand and Hong Kong.
meat. In addition, China also sought to substantially increase
its imports of pork, particularly from the US.
PAG E 1 2At the same time, imports of pork to Australia continue to Looking ahead, the Australian pig industry is likely to continue
climb strongly. To mid-2020, Imports had reached almost to see steady growth, while being happy to stay out of the
$900 million or 183,000 tonnes, up 20 per cent on the previous headlines. As consumers return to some of their pre-COVID-19
year. Of this, the US accounted for around half, followed by food-buying behaviours, including becoming discerning about
Denmark, the Netherlands, Canada and Ireland. This is a the origins of their food purchases, one potential area of growth
considerable change from a decade ago, when Canada and would be for local producers to seek a greater share of the
Denmark accounted for two-thirds of Australian imports. processed market. Given the economies of scale by the major
processors in the US and other markets, it would seem likely
Given the attention paid by consumers to the origin of many
that Australian producers would need to market as a premium
of their food products, interestingly, less attention is paid to
product, seeking profitability through a price premium.
the origin of pork products. Essentially, all fresh pork products
are produced in Australia, while the pork ingredients such as
ham, bacon, salami and other smallgoods are mostly from
imported products.
AUSTRALIAN PORK INDUSTRY TIMELINE
1,100
1,000
900
Tonnes ('000)
800
700
600
0
1960 1970 1980 1990 2000 2010 2020
Production Imports Exports Consumption
Source: ABARES, Bloomberg, ANZ
AUSTRALIAN PORK IMPORT VOLUME (PERCENTAGE)
100
90
80
70
60
50
%
40
30
20
10
0
2008/9 2009/10 2010/11 2011/12 2012/13 2013/14 2014/15 2015/16 2016/17 2017/18 2018/19 2019/20 2020/21
Canada Denmark Netherlands US Other
Source: ABARES, Bloomberg, ANZ
PAG E 13SURVIVING COVID -19
COVID-19’s impact on the Australian economy was quicker
and deeper than the triggers for other recessions.
The 7 per cent GDP decline in Q2 was unprecedented, Price-adjusted sales growth for food retailers (i.e. grocers
as were the 870,000+ job losses that occurred between and the like, not restaurateurs) grew 9.1 per cent quarter
March and May. While things have improved greatly since on quarter in the March quarter, more than double the
the pandemic’s initial impacts, with more than 648,000 jobs previous record-high for price-adjusted food retail sales
regained, the flow-on effects are far from over. We expect growth. Annual growth for this sector in the September
to see more unemployment and record low wage growth quarter (7.5 per cent year-on-year) was higher than any other
during the gradual return to pre-pandemic levels of quarter since retail sales records began in 1983. But when we
economic activity in the future. take dining/takeaway spending into account, annual growth
in price-adjusted food spending falls to just +1.4 per cent
COVID-19 was fundamentally different from other downturns
year-on-year to the September quarter. Far from unusual,
because much of the economic loss came from the restriction
1.4 per cent year-on-year was the average annual growth
of people’s movement. Restrictions in access for households
for quarters between March 2014 and December 2019.
to earn and spend as they usually do was a major, if not the
biggest, factor in the economy’s record decline in Q2. At When we look to the recovery of Australia’s economy from
its worst, optional travel in major cities was 40–50 per cent the COVID-19 downturn, there are a number of international
lower than pre-pandemic. Household consumption fell risks. Border closures slow our population growth (from
by 12.1 per cent quarter on quarter in Q2, the biggest 1.5 per cent in 2018–19 to 0.2 per cent in 2019-20) and reduce
quarterly decline by more than 10 ppts since quarterly our exports from tourism and international education. Reports
records began in 1959. of possible issues for Australian exports to China of coal, barley,
sugar, timber, wine and lobster may also slow the recovery
But restrictions in household movement did not hurt all
of goods exports. The value of these in 2019 was about
types of spending. After a shaky June quarter, retail sales
AUD20 billion, representing around 5 per cent of total goods
grew stronger on an annual basis in the September quarter
exports. The coordinated global slowdown in economic
(+4.2 per cent year-on-year) than all but one quarter in the
activity from COVID-19 also limits the speed of recovery
12 years prior. Government income support had a big part
for our exports.
in this, not only by reducing the peak of unemployment
by keeping businesses afloat, but also by directly assisting Looking closer to home, the reduction in direct fiscal
households through JobKeeper payments and the support as the emergency policies put in place reach their
JobSeeker supplement. end-by date will slow local consumption growth, as elevated
unemployment continues in 2021. While this will decrease
Government support and the shift of consumption from
consumption for discretionary products more than food, it
services, entertainment and travel to physical goods were
may also make the average consumer more budget-conscious,
a boon for many retailers, particularly those that traded in
which affects all consumption categories. Overall, we expect
household goods, food and groceries. Household goods
a ‘Nike Swoosh’ shaped recovery, where Australia’s economic
sales grew 22.3 per cent year-on-year to the September
activity will increase more slowly than it fell, until we get back
quarter, while supermarket sales grew 11.8 per cent
to pre-pandemic levels of activity sometime in the future.
year-on-year. ANZ-observed spending has indicated that
shopping and grocery spending has been consistently
above pre-pandemic growth rates since May.
PAG E 1 4EMPLOYMENT TRAVEL
2 10
1 0
% deviation from base (7 day av)
0
-10
Unemployment rate (%)
-1
-20
-2
-3 -30
-4 -40
-5
-50
-6
-60
-7
0 15 30 45 60
-70
Months since lowest unemployment rate in the cycle Feb Mar Apr May Jun Jul Aug Sep Oct Nov
80s recession GFC NSW QLD SA
90s recession COVID-19 VIC WA
Source: ABS, ANZ Research Source: ABS, ANZ Research
OVERALL , WE EXPECT A ‘NIKE SWOOSH’ SHAPED RECOVERY, WHERE AUSTRALIA’S
ECONOMIC ACTIVITY WILL INCREASE MORE SLOWLY THAN IT FELL , UNTIL
WE GET BACK TO PRE-PANDEMIC LEVELS OF ACTIVITY SOMETIME IN THE FUTURE.
PERSONAL SPENDING
100
75
ANZ-observed personal spending (weekly),
% change y/y (2018–19 vs 2019–20)
50
25
0
-25
-50
-75
-100
Dec 2019 Jan 2020 Feb 2020 Mar 2020 Apr 2020 May 2020 Jun 2020 Jul 2020 Aug 2020 Sep 2020 Oct 2020 Nov 2020
Shopping Travel/movement Groceries Dining/takeaway Total
Source: ANZ Research
PAG E 1 5CONTACTS
MARK BENNETT IAN HANRAHAN
Head of Agribusiness & Specialised Head of Food, Beverage & Agribusiness,
Commercial, Commercial Banking Australia – Institutional Banking
T: +61 3 8655 4097 T: +61 7 3947 5299
E: mark.bennett@anz.com E: ian.hanrahan@anz.com
AUTHORS
MICHAEL WHITEHEAD MADELEINE SWAN VIVEKA MANIKONDA
Head of Agribusiness Associate Director Agribusiness Senior Analyst, Institutional
Insights, Institutional Research, Commercial Banking Client Insights & Solutions
T: +61 3 8655 6687 T: +61 419 897 483 T: +91 8067 953 036
E: michael.whitehead@anz.com E: madeleine.swan@anz.com E: vivekasri.manikonda@anz.com
BRYONY CALLANDER ADELAIDE TIMBRELL
Associate Director Agribusiness Economist, ANZ Research
Research, Commercial Banking T: +61 466 850 588
T: +61 3 8654 2563 E: adelaide.timbrell@anz.com
E: bryony.callander@anz.com
PAG E 1 6DISCLAIMER
The distribution of this document or streaming of this video broadcast officers, employees, contractors and agents of each of them (including the author)
(as applicable, “publication”) may be restricted by law in certain jurisdictions. (“Affiliates”), do not make any representation as to the accuracy, completeness or
Persons who receive this publication must inform themselves about and observe currency of the views or recommendations expressed in this publication. Neither
all relevant restrictions. ANZ nor its Affiliates accept any responsibility to inform you of any matter that
1. Disclaimer for all jurisdictions, where content is authored by ANZ Research: subsequently comes to their notice, which may affect the accuracy, completeness
or currency of the information in this publication.
Except if otherwise specified in section 2 below, this publication is issued and
distributed in your country/region by Australia and New Zealand Banking Except as required by law, and only to the extent so required: neither ANZ nor its
Group Limited (ABN 11 005 357 522) (“ANZ”), on the basis that it is only for the Affiliates warrant or guarantee the performance of any of the products or services
information of the specified recipient or permitted user of the relevant website described in this publication or any return on any associated investment; and,
(collectively, “recipient”). This publication may not be reproduced, distributed ANZ and its Affiliates expressly disclaim any responsibility and shall not be liable
or published by any recipient for any purpose. It is general information and has for any loss, damage, claim, liability, proceedings, cost or expense (“Liability”)
been prepared without taking into account the objectives, financial situation or arising directly or indirectly and whether in tort (including negligence), contract,
needs of any person. Nothing in this publication is intended to be an offer to equity or otherwise out of or in connection with this publication.
sell, or a solicitation of an offer to buy, any product, instrument or investment, If this publication has been distributed by electronic transmission, such as
to effect any transaction or to conclude any legal act of any kind. If, despite the e-mail, then such transmission cannot be guaranteed to be secure or error-free
foregoing, any services or products referred to in this publication are deemed to as information could be intercepted, corrupted, lost, destroyed, arrive late or
be offered in the jurisdiction in which this publication is received or accessed, no incomplete, or contain viruses. ANZ and its Affiliates do not accept any Liability as
such service or product is intended for nor available to persons resident in that a result of electronic transmission of this publication.
jurisdiction if it would be contradictory to local law or regulation. Such local laws, ANZ and its Affiliates may have an interest in the subject matter of this publication
regulations and other limitations always apply with non-exclusive jurisdiction as follows:
of local courts. Before making an investment decision, recipients should seek
independent financial, legal, tax and other relevant advice having regard to their • They may receive fees from customers for dealing in the products or services
particular circumstances. described in this publication, and their staff and introducers of business may
share in such fees or receive a bonus that may be influenced by total sales.
The views and recommendations expressed in this publication are the author’s.
They are based on information known by the author and on sources which the • They or their customers may have or have had interests or long or short
author believes to be reliable, but may involve material elements of subjective positions in the products or services described in this publication, and may at
judgement and analysis. Unless specifically stated otherwise: they are current any time make purchases and/or sales in them as principal or agent.
on the date of this publication and are subject to change without notice; and, • They may act or have acted as market-maker in products described in
all price information is indicative only. Any of the views and recommendations this publication.
which comprise estimates, forecasts or other projections, are subject to significant ANZ and its Affiliates may rely on information barriers and other arrangements to
uncertainties and contingencies that cannot reasonably be anticipated. On this control the flow of information contained in one or more business areas within
basis, such views and recommendations may not always be achieved or prove to ANZ or within its Affiliates into other business areas of ANZ or of its Affiliates.
be correct. Indications of past performance in this publication will not necessarily
be repeated in the future. No representation is being made that any investment Please contact your ANZ point of contact with any questions about this
will or is likely to achieve profits or losses similar to those achieved in the past, or publication including for further information on these disclosures of interest.
that significant losses will be avoided. 2. Country/region specific information:
Additionally, this publication may contain ‘forward looking statements’. Actual Australia. This publication is distributed in Australia by ANZ. ANZ holds an
events or results or actual performance may differ materially from those reflected Australian Financial Services licence no. 234527. A copy of ANZ's Financial
or contemplated in such forward looking statements. All investments entail a risk Services Guide is available at http://www.anz.com/documents/AU/aboutANZ/
and may result in both profits and losses. Foreign currency rates of exchange may FinancialServicesGuide.pdf and is available upon request from your ANZ point of
adversely affect the value, price or income of any products or services described contact. If trading strategies or recommendations are included in this publication,
in this publication. The products and services described in this publication are they are solely for the information of ‘wholesale clients’ (as defined in section
not suitable for all investors, and transacting in these products or services may 761G of the Corporations Act 2001 Cth). Persons who receive this publication
be considered risky. ANZ and its related bodies corporate and affiliates, and the must inform themselves about and observe all relevant restrictions.You can also read