Economic Analysis of IMO 2020 - The Benefits to the U.S. Economy of Full Participation and Compliance - Coalition for American Energy Security
←
→
Page content transcription
If your browser does not render page correctly, please read the page content below
Economic Analysis of IMO 2020
                  The Benefits to the U.S. Economy of Full
                  Participation and Compliance

Prepared by:

Charles River Associates

Contributor:

Baker & O’Brien
Economic Analysis of IMO 2020

June 2019                                                                                   Charles River Associates

                                                  Disclaimer

       The study was commissioned by Coalition for American Energy Security (CAES). The research, analysis, results and
       conclusions were all developed independently by the authors. The conclusions set forth herein are based on
       independent research, use of proprietary models, and publicly available material.
       The views expressed herein are the views and opinions of the authors and do not reflect or represent the views of
       Charles River Associates or any of the organizations with which the authors are affiliated. Any opinion expressed
       herein shall not amount to any form of guarantee that the authors or Charles River Associates has determined or
       predicted future events or circumstances and no such reliance may be inferred or implied. The authors and Charles
       River Associates accept no duty of care or liability of any kind whatsoever to any party, and no responsibility for
       damages, if any, suffered by any party as a result of decisions made, or not made, or actions taken, or not taken,
       based on this paper. Detailed information about Charles River Associates, a registered trade name of CRA
       International, Inc., is available at www.crai.com.
       Copyright 2019 Charles River Associates

       For questions about this study, please contact Jeff Plewes at jplewes@crai.com

                                                                                                                    Page i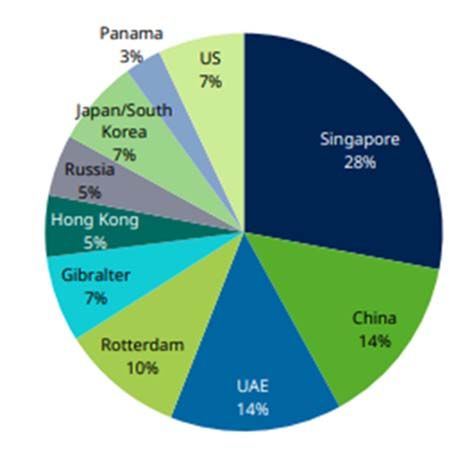
Economic Analysis of IMO 2020

June 2019                                                                                                         Charles River Associates

                                                       Table of contents

1.   Summary....................................................................................................................................... 1

2.   Introduction .................................................................................................................................. 2
     2.1.        Background ....................................................................................................................... 2
     2.2.        Analyzing Impacts ............................................................................................................. 2
     2.3.        Key Findings ..................................................................................................................... 4
     2.4.        Report Outline ................................................................................................................... 6

3.   Overview of IMO 2020 Economics ............................................................................................. 6
     3.1.        Marine Shipping Sector Response ................................................................................... 6
     3.2.        Refining Sector Response ................................................................................................ 9
     3.3.        Fuel Market Impacts ....................................................................................................... 13

4.   Defining the Compliance Scenarios ........................................................................................ 16
     4.1.        Baseline Scenario (“Baseline IMO 2020”) ...................................................................... 16
     4.2.        Partial Compliance Scenario (“Partial IMO 2020”) ......................................................... 17

5.   Modeling Methodology .............................................................................................................. 22
     5.1.        Initial Calibrations to EIA Forecasts ................................................................................ 23
     5.2.        EMR-IMO ........................................................................................................................ 24
     5.3.        PRISM ............................................................................................................................. 24

6.   Results ........................................................................................................................................ 26
     6.1.        Price Impacts of Lower IMO 2020 Compliance .............................................................. 26
     6.2.        Overall U.S. Economy Impacts ....................................................................................... 28
     6.3.        Refining Sector Impacts .................................................................................................. 29
     6.4.        Exploration and Production (Crude) Sector Impacts ...................................................... 31

7.   Conclusion ................................................................................................................................. 32

                                                                                                                                               Page ii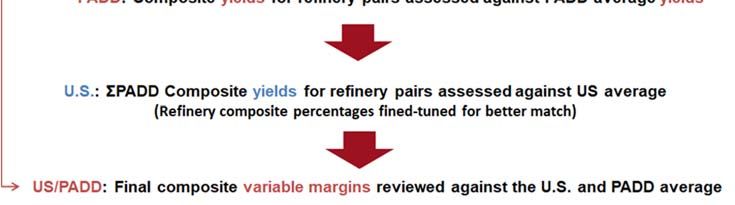
Economic Analysis of IMO 2020
June 2019 Charles River Associates
1. Summary
IMO 2020, a regulation developed by the International Maritime Organization (IMO) to
significantly reduce sulfur emissions from the global shipping sector, will come into effect on
January 1, 2020. The regulation will require a large reduction in the sulfur content of marine
fuels consumed by most ships around the world. The resulting shift in fuel demand, from
higher sulfur fuels to IMO 2020 compliant fuels, will be supported by a well-prepared global
refining sector. The U.S. refiners are particularly well prepared for the shift as a result of
significant investments to develop complex refineries.
While marine fuels represent only about 4% of global fuel consumption, the move to
compliant marine fuels may have some impact on broader refined product prices. The U.S.
Energy Information Administration (EIA) has forecast minimal fuel price impacts of IMO 2020.
Still, consternation around IMO 2020 remains among several large fuel consuming sectors.
There has been some political pressure for the U.S. to somehow support and encourage non-
compliance with IMO 2020 (by ships) through non-enforcement (by countries).
While it is well reported that non-enforcement by the U.S. and other countries faces legal,
political and regulatory hurdles, the economic implications of a U.S.-led “defection” from IMO
2020 have not been directly studied. This study evaluates the fuel price and macroeconomic
impacts of a move to less global IMO 2020 compliance. An advanced suite of models,
including CRA’s EMR-IMO macroeconomic model and Baker & O’Brien’s PRISM refinery
model, were employed in this analysis.
The key findings related to a shift to less IMO 2020 compliance include:
Gasoline prices see no discernable change. IMO 2020 has minor impacts in both
directions on gasoline prices.
Diesel prices may change by about $0.04/gallon – less than the average monthly
change in diesel prices over the past four years. EIA estimated that diesel prices
could increase by 5% on average from 2019 to 2020, though remain below 2018
levels. With less IMO 2020 compliance, the increase could be 3% instead.
U.S. refiners, which are well positioned to see margin benefit from IMO 2020 since
they produce the fuels that will increase in demand, would be expected to see a
decrease in margin from less IMO 2020 compliance.
Of the non-energy sectors in the U.S., only the relatively small marine transportation
sector sees an economic output change greater than 0.02% in either direction.
The impact on U.S. GDP growth is not detectable at the one-hundredth of a percent
level (i.e., GDP grows at 2.16% regardless of IMO 2020 compliance levels, based on
EIA’s baseline GDP estimate and CRA’s modeling of a partial compliance scenario).
As IMO 2020 implementation approaches, there is greater clarity into how the shipping and
refining sectors will respond, and it appears the industries are driving toward a transition with
minimal price disruption or fuel availability issues. The U.S. is in a unique position, based on
its low sulfur crude production and the significant investments made by refiners, to support
the global shift in marine fuel demand.
A U.S.-led defection from IMO 2020 compliance, which is clearly a difficult, if not impossible,
proposition to execute, does not drive material benefit for the U.S. economy, with any benefits
likely accruing to other global economies instead.
Page 1
Economic Analysis of IMO 2020

June 2019                                                                                  Charles River Associates

2.       Introduction
2.1.     Background
         On January 1, 2020, a regulation developed by the International Maritime Organization (IMO)
         to limit sulfur in marine fuels (“IMO 2020”) will come into effect. The regulation was
         announced in 2008 and has been set for implementation since 2016. It will significantly
         decrease sulfur emissions from international shipping, leading to benefits for human health
         and the environment.1 It will also lead to several forms of economic benefits for countries,
         such as the U.S., that are best suited to support global compliance.
         IMO 2020 will require a large reduction in the sulfur content of fuels consumed by most ships
         around the world. This shift will be facilitated by changes in fuel production and refining,
         industries that have been preparing for years to supply more low sulfur fuels to the shipping
         sector while meeting all other fuel demands. Refiners in the U.S. are particularly well situated
         to provide lower sulfur fuels and the crude oil produced in the U.S. is naturally lower in sulfur
         and therefore will see increased demand around the world.
         The pending fuel demand shifts have led to some consternation within fuel-consuming
         sectors, particularly around the impacts on fuel prices in 2020. This topic has been analyzed,
         both directly and indirectly, in a variety of studies, including by the U.S. Department of
         Energy’s Energy Information Administration (EIA). While some price movements are
         expected, the EIA does not forecast major disruptions or significant price movements. Our
         review suggests the fuel production and refining sectors are expected to find economical
         solutions. This conclusion is supported by the forward fuel prices at the time of this report.
         Despite these assurances, there has been some political pressure for the U.S. to somehow
         support and encourage non-compliance with IMO 2020 (by ships) through non-enforcement
         (by countries). Non-compliance involves ships continuing to use High Sulfur Fuel Oil
         (“HSFO”) while not scrubbing the exhaust gas to remove sulfur oxides. While it is well
         reported that non-enforcement by the U.S. and other countries faces legal, political and
         regulatory hurdles, the economic implications have not been directly studied.
         Other studies to-date have focused on full implementation (with minimal non-compliance)
         compared to a scenario with no implementation of IMO 2020. Such a comparison at this point
         is no longer realistic since IMO 2020 will be implemented in January 2020. Therefore, a more
         reasonable comparison is between full implementation and a partial implementation that
         involves additional non-compliance driven by U.S.-coordinated non-enforcement.

2.2.     Analyzing Impacts
         This study evaluates the economic implications in 2020 of the U.S. driving less global
         enforcement of IMO 2020, thus leading to lower overall compliance. It does so by comparing
         two scenarios:
              1) Baseline IMO 2020 (or “Full IMO 2020”) Scenario - Full implementation is assumed to
                 include 15% non-compliance globally,2 similar to non-compliance estimates in many

1 “Health Impacts Associated with Delay of MARPOL Global Sulphur Standards” presented by Finland to IMO, August 2016.

2 Percentage non-compliance = (total HSFO consumed by ships not running scrubbers) / (total marine fuels consumed)

                                                                                                                 Page 2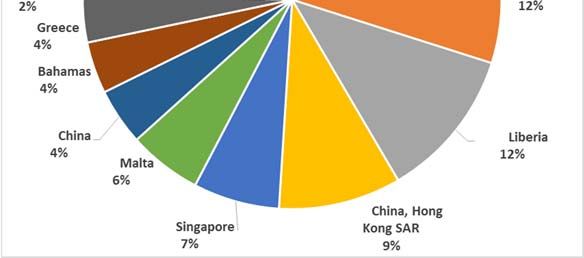
Economic Analysis of IMO 2020
June 2019 Charles River Associates
IMO 2020 studies, such as the April 2016 study by the International Energy Agency
(IEA).3
2) Partial IMO 2020 - Partial implementation assumes cumulative global non-
compliance of 30% of marine shipping fuels, allowing for greater use of HSFO. This
level of non-compliance is not a prediction of likely achievable levels, but rather an
indicative level based on one possible result of U.S.-led defections from IMO 2020
enforcement.
The following chart shows the percentages of marine shipping fuels consumed in the two
scenarios in 2019 and 2020, for both the U.S. and globally. The IMO 2020 compliant fuels
(blue) are any fuels with a sulfur content of no greater than 0.5%. The HSFO share (gray)
includes both compliant use (pre-IMO 2020 or in ships with scrubbers) and non-compliant use
(in ships without scrubbers in 2020). At the global level, in both scenarios about 15% of total
fuel use will be HSFO used in a compliant manner.
Figure 1: IMO 2020 compliant fuels as shares of marine transport fuels, 2019 to 2020
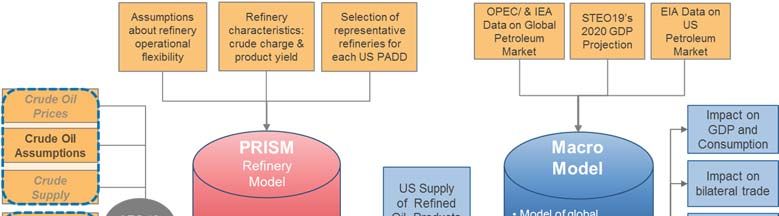
The analysis involved two advanced energy and economic models. Charles River Associates
(“CRA”) utilized a global macroeconomic model (“EMR-IMO”) to evaluate fuel price responses
to changes in compliance levels and to determine sector-level and economy-wide impacts.
Baker & O’Brien, Inc, (“Baker & O’Brien”) used its PRISM model to evaluate responses by
U.S. refiners. The PRISM model determined refinery output of various products, as well as
the refining sector’s economic outcomes in the scenarios.
Both models were calibrated to the EIA’s recently published forecasts of prices and quantities
in 2020 under full IMO 2020 implementation. To estimate the impacts of moving to partial
implementation, we modeled an increase in demand for higher sulfur fuels in the marine
shipping sector (and the associated decrease in lower sulfur fuels). The EMR-IMO model
3 International Energy Agency, “Oil Market Report”, April 2019
Page 3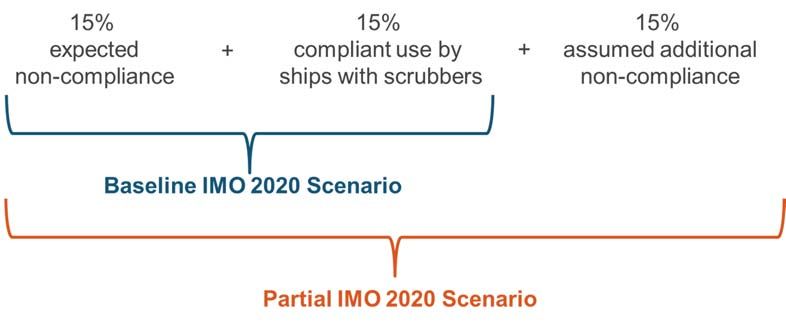
Economic Analysis of IMO 2020

June 2019                                                                                      Charles River Associates

         determined the macroeconomic response, and the PRISM model determined the response by
         U.S. refiners.

2.3.     Key Findings
         Assuming it is even possible, a move to partial IMO 2020 implementation would have
         competing impacts on the U.S. economy. There would be some reduction in refined product
         prices, which are mostly found in diesel and marine fuels. This has a slight, positive impact on
         a few sectors of the economy for which those fuels are a significant share of production costs.
         No modeled non-energy sector of the economy would see a benefit greater than 0.02% of its
         economic output. There would also be a loss of productivity and economic value added in the
         refining and oil production sectors. The overall impact on the U.S. economy is not detectable
         at the hundredth of a percent level of the GDP growth rate.
         Petroleum product prices are far more sensitive to changes in crude market developments
         than to changes in IMO 2020 implementation levels. For example, without IMO 2020 in effect,
         diesel prices dropped nearly 19.8% from January 2018 ($1.85/gal) to January 2019
         ($1.48/gal), mostly driven by a nearly identical (19.3%) drop in WTI crude price. The price
         changes between 2019 and 2020 are forecasted to be much more modest. In the Baseline
         IMO 2020 scenario, which is calibrated to EIA forecasts, average diesel prices increase 5%
         from 2019 to 2020. In the Partial IMO 2020 scenario, average diesel prices increase 3% from
         2019 to 2020. In both cases, average diesel prices remain under 2018 levels.
         The following charts show the refined product price impacts of reducing compliance with IMO
         2020. The prices are presented as “refiner prices,” which is the average price received by
         refiners, excluding taxes. These prices are highly dependent on crude oil prices, which in this
         study were calibrated to EIA’s STEO April 2019 forecast for the Baseline IMO 2020
         scenario.4 In addition to the diesel price changes discussed above, the chart below shows
         that gasoline prices see no discernable benefit from reduced global compliance with IMO
         2020.

4 The STEO April 2019 estimates for 2020 prices were: Brent $62/barrel, WTI $58/barrel. If crude prices are higher, we would
         expect both scenarios’ refined product prices to rise at about the same rate. Crude oil prices in the Partial IMO 2020
         scenario are determined by the EMR IMO model and do not change materially from the Baseline IMO 2020 scenario.

                                                                                                                      Page 4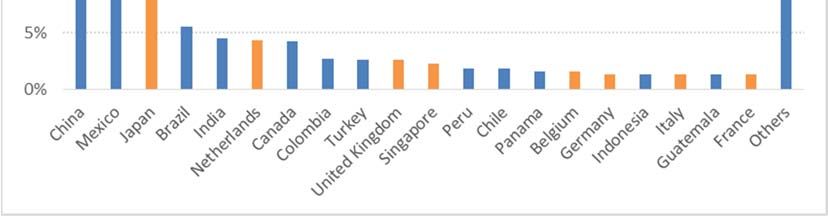
Economic Analysis of IMO 2020

June 2019                                                                       Charles River Associates

       Figure 2: Fuel prices, refiner prices (cents/gallon), 2018 to 2020

       Figure 3: Fuel oil prices, refiner prices (cents/gallon), 2018 to 2020

                                                                                                 Page 5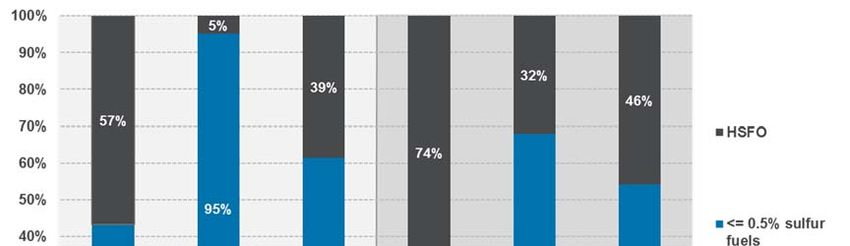
Economic Analysis of IMO 2020

June 2019                                                                    Charles River Associates

       U.S. refineries are well positioned to provide the types of fuels most needed in an IMO 2020
       future. They currently provide over 10% of marine fuels consumed in the world, and that
       share is expected to increase. Along with increased volume, refiners can expect to see their
       refining margins improve with IMO 2020, though remaining within their historical range. This
       is borne out in our analysis. Following the introduction of the new IMO 2020 regulations, we
       see average U.S. oil refining margins in 2020 outperforming the recent past. In the Partial
       IMO 2020 scenario, we see a minor reduction in product prices eroding refining margins,
       compared to the Baseline IMO 2020 scenario.
       Due to the option of using more of the lower-cost HSFO, the global marine transport sector
       would see the greatest benefit of less compliance with IMO 2020. However, that benefit
       would be mostly isolated to the trade routes for which the additional non-compliance occurs.
       These benefits would be moderated by rising HSFO prices and would mostly accrue to
       shipowners, as shipping rates would still largely be set by compliant vessels and the
       compliant fuels that do not change significantly in price on the whole.
       The overall impact on the economy is minimal. For example, under the baseline, GDP grows
       2.16% from 2019 to 2020 (an EIA estimate). Under the Partial IMO 2020 scenario, GDP also
       grows 2.16%. The difference is in the thousandths of a percent, which is well within the error
       of the assumptions and modeling.

2.4.   Report Outline
       Section 3 provides an overview of the economics of IMO 2020. The overview includes
       insights into both marine shipping sector and refinery sector responses to the regulation, as
       well as commentary on fuel market impacts. Section 4 presents the two scenarios of IMO
       2020 compliance. Section 5 describes the modeling at a high level. Section 6 presents the
       results of our study.

3.     Overview of IMO 2020 Economics
       This report section provides an overview of IMO 2020 economics. It describes how the
       shipping and refining sectors are likely to respond to the upcoming regulation. It also provides
       high-level insight into how the global fuel markets will respond. These insights support our
       assumptions used in modeling an increase in IMO 2020 non-compliance.

3.1.   Marine Shipping Sector Response
       Under the IMO 2020 regulation, ships must use fuel with no greater than 0.5% mass by mass
       (m/m) sulfur content, which is an 86% reduction from the current maximum sulfur content of
       3.5% m/m in most open waters. There is an exception for ships with exhaust gas cleaning
       systems, or “scrubbers,” that would allow them to continue to use fuel with up to 3.5% m/m
       sulfur content. Therefore, ships have three main options for responding to IMO: 1) use lower
       sulfur fuels that comply with IMO 2020 (“compliant fuels”), 2) install and use a scrubber, or 3)
       not comply and face potential consequences.
       There are many factors that drive the decisions for each shipowner, some at the fleet level
       and some at the vessel level. These factors include home or “flagged” states, trade routes,
       and vessel features (age, size, tank segregation, etc.). While this study is focused on
       macroeconomic impacts and fuel markets, we present a high level discussion of the marine
       shipping sector’s response options because they impact the demand for various fuels, which
       drives the impacts of IMO 2020 and the impacts of variable levels of non-compliance.

                                                                                                Page 6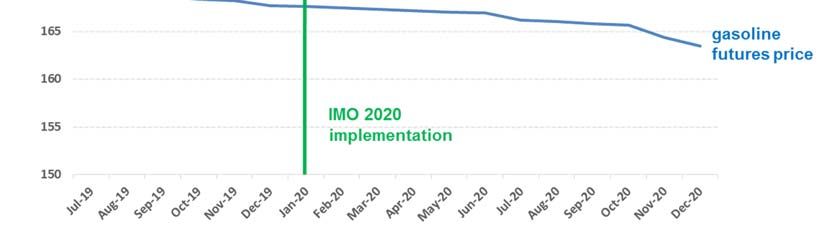
Economic Analysis of IMO 2020
June 2019 Charles River Associates
3.1.1. Using Compliant Fuels
Ships that plan to comply through using compliant fuels have many decisions to make in
preparation for implementation of IMO 2020. The main decision is which compliant fuels to
use. They will have several fuel types to choose between:
Marine gasoil (“MGO”) – Marine gasoil is similar to diesel fuel, but may have a higher
density, viscosity, or cold properties. It consists of distillates, which are evaporated
from crude oil then condensed into liquid. Unlike heavy fuel oil (the main bunker fuel),
most marine gasoils typically do not require heating during storage. It also produces
less particulate matter and soot when burned. While marine gasoil can have variable
sulfur contents, the most common form has sulfur content below 0.1% m/m to comply
with Emissions Control Areas (“ECA”s) in several regions around the world. However,
it can have sulfur content up to 1.5% m/m.
Marine gasoil has historically been more expensive than heavy fuel oil, principally
due to its similarity to diesel fuel and lower sulfur content. Because of this lower
sulfur content, marine gasoil has been primarily used for ECA compliance and for
shipping on inland waterways. Large ships can run on heavy fuel oil, marine gasoil
and blends.
Compliant fuel oils – There is inconsistent terminology used for describing fuel oils
with lower sulfur content than HSFO. The most common is the following:
o Low Sulfur Fuel Oil (“LSFO”) has sulfur content of 1% or less.5
o Very Low Sulfur Fuel Oil (“VLSFO”) has sulfur content of 0.5% or less.
o Ultra Low Sulfur Fuel Oil (“ULSFO”) has sulfur content of 0.1% or less.
VLSFO and ULSFO are considered compliant fuels for IMO 2020. VLSFO may have
different formulas from different producers. ULSFO is also compliant in ECAs,
however it is very rare as it contains such a high percentage of distillate that it is
essentially MGO.
The decision to use either of these fuels will be based on relative prices, fuel availability at
ports, and technical aspects specific to each ship.
There are mechanical and other technical challenges to switching from HSFO to either MGO
or lower sulfur fuel oils. For ships converting to alternative fuels (e.g., HSFO to VLSFO), there
is a required tank cleanout process that cannot be carried out while the ship is in operation.
The cleanout process takes about a week, and is necessary to ensure fuel-burning
compliance and to keep the equipment running efficiently.6 Due to a need to stagger
cleanouts, it is expected that a significant number of vessels will commence using compliant
fuels in late 2019.
3.1.2. Using Scrubbers
Ships can avoid buying compliant fuel if they have exhaust gas cleaning systems, or
“scrubbers,” installed. The decision to install a scrubber on a ship is mostly based on two key
variables: 1) the cost of the scrubber, and 2) expectations for the price spread between
compliant fuels and HSFO. Lower scrubber costs and higher price spreads reduce the
5 Many sources use the term LSFO for IMO 2020 compliant fuels. The distinction is important in this report due to the modeling
approach discussed later. LSFO in the traditional definition is mostly used in the power sector.
6 “IBIA offers practical advice on tank cleaning to IMO 2020 planning meeting,” IBIA, June 2018.
Page 7Economic Analysis of IMO 2020
June 2019 Charles River Associates
payback periods for investments in scrubbers. The cost of scrubbers are lower for new build
ships. Cost estimates for retrofitting existing vessels vary widely, ranging from $2 million to
$10 million. The price spread between compliant fuel and HSFO is discussed later. One
recent public analysis shows that a $200/MT price spread can lead to about $1 million in fuel
savings per year for ships with scrubbers.7
In addition to those key variables, owners evaluating the installation of scrubbers must
consider other factors. Factors supporting scrubbers include fuel diversification to hedge price
risk. Factors challenging scrubbers include concerns about the likely availability of HSFO,
which will be a secondary bunker fuel in many ports, and a rising opposition to discharge from
open-loop scrubbers in certain regions.
The amount of HSFO consumed by ships with scrubbers in 2020 is an important variable in
determining the impact of various levels of IMO 2020 compliance. To estimate the volume of
HSFO, most studies begin with estimating the number of scrubbers that will be installed
across the over 90,000 ships expected to be operational in 2020. The 2019 IEA oil report
estimated that 2,500 ships will have scrubbers by the end of 2019, 4,000 by the end of 2020,
and 5,200 by the end of 2024.8 While the longer term installation estimates seem to line up
with other industry estimates, the IEA seems to be more pessimistic than others regarding
installations prior to 2020. DNV GL reports that the total number of ships in operation and on
order with scrubbers fitted through 2019 is 2,859.9
The ships that will be fitted with scrubbers are generally much larger than average sized
vessels and have trading routes that involve more time at sea. DNB Markets estimates that
the top 5% of fuel-consuming ships (which translates to under 4,500 vessels) consume 38%
of marine shipping fuel.10 The 2019 IEA oil report estimates that the 2,500 ships with
scrubbers (plus the additional ships adding scrubbers throughout 2020) will consume 700
kbpd of HSFO, which represents about 16% of global marine fuel consumption.11 Using IEA’s
estimates, an additional 500 scrubbers could lead to the marine sector having 10% greater
HSFO demand and 7% lower MGO demand than IEA’s current estimate.
3.1.3. Converting to LNG
Another option for ship owners is to convert their existing vessels or purchase new vessels
that run on liquefied natural gas (“LNG”). Burning LNG emits only trace amounts of sulfur,
thus qualifying LNG as an IMO 2020 compliant fuel. The capital costs are much more
substantial than installing scrubbers and LNG is much more limited in availability. Each of
those factors is changing, and the economics could improve depending on the relative prices
of marine fuel oils, MGO and LNG. The likely impact of LNG as a bunker fuel will be gradual,
with most impact expected after 2020. As this analysis is focused on the year 2020, LNG is
not a modeled IMO 2020 compliant fuel and is not discussed further in this report.
7 Scorpio Tankers, “Company Presentation,” May 2019.
8 International Energy Agency, Oil 2019 Analysis and forecast to 2024
9 DNV GL, Alternative Fuels Insight, https://afi.dnvgl.com/
10 “DNB: Scrubbers are a good investment”, Splash247, September 17, 2018.
11 International Energy Agency, Oil 2019 Analysis and forecast to 2024
Page 8Economic Analysis of IMO 2020
June 2019 Charles River Associates
3.1.4. Not Complying
Shipowners also have an option of not complying with the IMO 2020 regulation by continuing
the use of HSFO without using scrubbers (either not installing them or not using installed
scrubbers). With this option comes a variety of potential consequences that can vary
significantly and are highly uncertain as IMO 2020 implementation approaches.
The first uncertainty is related to the likelihood of getting caught for not complying.
Enforcement is mostly driven by Port States (countries that ships visit, to load/unload cargo,
to dry dock for repairs, or to take on bunker fuel). Most Port States will force compliance by
simply not providing HSFO to ships without scrubbers. Many Port States have shared plans
to support enforcement both directly, by monitoring/testing emissions and fuels, and
indirectly, through evaluating bunker logs. Enforcement is expected to vary by Port State and
region.
The second uncertainty is related to the many penalties and other costs of getting caught.
Port and Flag States are charged with determining direct penalties for non-compliance. A
likely Port State enforcement mechanism will be demanding the costly and time-consuming
process of unloading non-compliant fuels and re-bunkering with compliant fuel before the ship
may leave the port. There can also be more extreme direct penalties such as significant fines
or jail. Indirectly, ship owners may face reputation risk and could face loss of insurance. For
example, the largest insurance broker in the world published a report discussing the
likelihood of denied insurance claims for ships not complying with IMO 2020.12
The topic of enforcement by Port and Flag States is discussed further in Section 4.2.1.
3.2. Refining Sector Response
While the marine shipping sector’s responses to IMO 2020 will determine the changes in fuel
demand, the refining sector’s responses will determine the changes in fuel supply. How
refiners respond to changes in demand for lower sulfur fuels in the marine shipping sector will
drive prices and fuel availability in 2020 and beyond. Refiners, particularly U.S.-based
refiners, have proven adaptable many times in the past.
Over the past 30 years, road transport fuel quality regulations, particularly in OECD markets,
have been tightened with a focus on reducing sulfur content (and associated sulfur oxide
related exhaust emissions). Global oil refiners have invested in their facilities to meet this
challenge primarily by installing process units to remove and recover sulfur. IMO 2020
extends onshore “clean fuels” programs into the marine sector. However, while shippers can
comply with IMO 2020 by installing scrubbers that allow for continued use of high sulfur fuel
oil, regulations for ultra clean diesel and gasoline land transportation fuels did not allow for
the continued consumption of higher sulfur fuels. Rather, the land fuel regulations required
that all vehicles use lower sulfur fuels. Also, unlike some other regulations, refiners have seen
the introduction of IMO 2020 on the horizon for many years and have been able to factor it
into their long term plans.
As IMO 2020 implementation approaches, there is more clarity into how the sector will
respond, and it appears the industry is driving toward a transition with minimal price
disruption or fuel availability issues. This section addresses several key issues and topics that
will frame the refining sector response.
12 “Emissions Regulations: Concerns for the Marine Industry,” Marsh, Q1 2018.
Page 9Economic Analysis of IMO 2020
June 2019 Charles River Associates
3.2.1. Economics of Refinery Response
The global refining sector is highly complex, competitive and diverse, with significant
variations in capabilities between regions and refinery technologies. While the industry does
not explicitly operate in a coordinated manner, it adjusts to short and long-term changes in
fuel markets in a manner that may seem coordinated since it is generally guided by
economics (short-term) and regulations (long-term). When there are small demand changes,
a combination of price signals and expectations lead to operational adjustments seen in
refinery utilization levels and product yields. Refineries can respond similarly to changes in
crude oil prices and availability.
Oil refineries generally benefit from inherent production flexibilities associated with their
complexity; in addition to adjusting the volume of crude oil processed, i.e. adjusting the
utilization rate, refineries generally can also, to a certain degree, adjust their product yields by
changing the type of crude oil they process and by modifying their plant operations. This
enables refiners to respond to minor/modest changes in their downstream markets (e.g.,
refined product pricing and/or demand changes) and upstream markets (e.g., crude oil pricing
and supply).
For larger industry changes (such as a step-change in fuel quality specifications), adjusting
existing operations, realigning infrastructure and changing crude inputs may not be sufficient.
However, many of the constraints can be resolved with price responses and adequate time.
Higher prices can incentivize increased production of certain products and/or demand shifts
to other products. Lower prices can have the opposite impacts. However, the potential
impacts of these price changes can often be anticipated, and the industry can respond by
relieving potential constraints.
The industry players consider strategic competitive positioning but the overall response is
motivated by regulatory compliance and by the refiners’ evaluation of returns from making
investments to increase production of the fuels that are in demand and would therefore
receive higher prices. Paradoxically, the refiner response of increased production often leads
to a muting of price impacts. However, this is not guaranteed given the lack of perfect
foresight, particularly around aggregate refiner response. The question is therefore whether
refiners in the aggregate will make the adjustments to operations and infrastructure
necessary to mute a price change.
3.2.2. IMO 2020 Compliant Fuel Production
As discussed in Section 2.1.1, shipowners will have three main fuel options in 2020: 1)
HSFO, used either in a compliant or non-compliant manner, 2) very lower sulfur fuel oil
(VLSFO) with sulfur content of 0.5% m/m or lower, or 3) marine gasoil and diesel fuel oils. As
discussed, the decisions by shipowners will be based on ship or fleet-specific factors (e.g.,
technology, operations, and intended compliance levels), combined with expectations for fuel
prices and fuel availability. Actual fuel prices and availability in 2020 will be determined by the
global refining sector’s ability to increase output of marine gasoil and VLSFO while
maintaining production of other fuels.
Producing more marine gasoil – Marine gasoil is produced as a middle distillate in the
refining process, which places it in-between lighter distillates (such as gasoline) and
heavy distillates/residuals (such as residual fuel oils and solids). Middle distillates
(from lightest to heaviest) include jet fuel, heating kerosene, diesel/heating oil, and
marine gasoil. The IEA estimates 2019 global production of 36.8 mbpd of these
Page 10Economic Analysis of IMO 2020
June 2019 Charles River Associates
products combined.13 In the same report, the IEA estimates that the IMO 2020
regulation will lead to an additional 1.1 mbpd increase in demand for marine gasoil,
or a 3% increase in total distillate demand.
To meet such an increase in middle distillate demand, refiners can either increase
overall throughput using existing refinery setups, maximize middle distillate
production or, over a longer time period, they can increasingly employ technologies,
such as hydrocrackers, for more significant yield shift. Both approaches are likely as
IMO 2020 implementation approaches.
Producing compliant fuel oil – Refiners have already begun to test and produce
compliant fuel oils, or VLSFOs. The VLSFOs available in the market will be a range
of residual fuels that have been desulfurized through the refining process (generally
starting with lower sulfur crude) or blends of higher sulfur fuel oils with distillates.
More technically speaking, the VLSFOs will originate from “sweet crudes, de-
sulphurised fractions, cracked fractions, heavy and lighter hydrotreated fractions and
residual fuels blended down with distillates to meet the sulphur limit...”14 Therefore,
the main ways refiners will commence and then increase production of VLSFO will be
to increase the use of certain refining technologies, adjust crude inputs, and increase
distillate production (as discussed above).
Given these approaches to providing the marine shipping sector with compliant fuels, the
options for refiners fall into five main categories, as listed below.
1) Increasing overall throughput – This option could have the most impact on other
refined product markets beyond compliant fuels, with price impacts in both directions.
It can increase supply of other refined products, which would tend to decrease their
prices. However, there is an upward pressure on crude prices given the increased
overall demand.
The extent to which increased throughput is an available option for each refinery
depends on the pre-2020 utilization and the total capacity. Total capacity by refinery
has proven to be an imprecise estimate of potential. Many refineries can run above
their rated capacities for limited periods of time. In fact, in the U.S., entire PADDs
have had multiple weeks of utilization over 100% since 2014 (7 weeks in PADD 2
and 2 weeks in PADD 4).15 Over the longer term, even in the absence of substantial
investment in new capacity, the U.S. refining sector continues to debottleneck
facilities resulting in small increases in capacity (known as capacity creep).
Another possible constraint is the potential over-production of high sulfur fuel oils
without adequate disposal options. A significant portion of HSFO that will no longer
be used in the shipping sector is expected to be absorbed in the global power sector,
or used in carbon black or asphalt production. Additional HSFO production can also
be used as an input in refineries, particularly by refineries that may use these fuels as
an alternative to heavy sour crudes, like Venezuelan crude, that has been in short
supply.
13 IEA Oil Market Report 2019
14 “Detailed information on preparation and operation on fuels with maximum 0.50% sulphur", MAN Energy Solutions, March
2019.
15 “Refinery Operable Capacity Percent Utilization,” U.S. EIA, May 8, 2019.
Page 11Economic Analysis of IMO 2020
June 2019 Charles River Associates
2) Changing operations while using existing infrastructure – The refining sector has
repeatedly proven creative and resourceful in adapting to demand and fuel quality
changes in the industry. There is significant market uncertainty as to the extent
operational and other small changes can alter product yields. As discussed, there are
multiple degrees of freedom for refiners to adjust operations and change yields. With
the industry anticipating demand for compliant fuels, operational changes are already
underway. Many changes associated with improving their operating flexibilities (such
as additional tankage to segregate crude oil and fuel oil products) will be made during
maintenance activities throughout 2019.
3) Utilizing certain refineries more – It is commonly understood that the refinery-level
impacts of the IMO 2020 regulation will vary depending on refinery type. Generally,
more complex refineries with more heavy fuel oil upgrading technology (such as
cokers) are likely to benefit and target increasing production. These refiners are able
to process and upgrade heavy sour crudes into refined products (gasoline and
distillates), while producing minimal fuel oil products. They are also able to upgrade
high sulfur oil produced by other refineries. Therefore, they are likely to benefit from
improved distillate margins/prices and heavy sour crude oil price discounts, and lower
prices for high sulfur fuel oil. The U.S. has a higher concentration of these refineries,
often referred to as “deep conversion” refineries, than the rest of the world.16
Conversely, “simple” refineries that have limited heavy fuel oil upgrading capacity
generally produce more fuel oil for sale, and as a result are more exposed to high
sulfur fuel oil price changes, and potentially may be forced to switch to light sweet
crudes. These refineries are more likely to cut rates either to reduce high sulfur fuel
oil production or accommodate an alternative light-sweet crude oil. The refineries
most likely to see negative impacts are these “simple” refineries, particularly those
processing higher sulfur crudes and unable to adjust crude inputs or to make the
more in-demand fuels. These types of refineries are more common in Europe and
Asia.
4) Adding conversion and treating technologies to change yields – Refiners have known
about IMO 2020 for many years. They have had a decent amount of certainty of its
implementation for at least four years. In that time period, many refineries have
added desulfurization, coking or hydrocracking capacity that would reduce the
amount of HSFO they produce and/or increase volumes of the fuels needed for IMO
2020 compliance.
5) Altering crude inputs – Many refineries can alter the type of crudes they process
based on price spreads and availability of the various crude types. There will likely be
economic incentive for many simpler refineries to shift to sweeter crude oil (such as
U.S.-produced crude oil, see Section 3.3.2), thus improving the production of
compliant fuels and/or distillates that will see higher demand. With the curtailing of
the marine bunker fuels market as an outlet for heavy, high sulfur residues, intra-
refinery trade of these intermediates – from simpler to complex refineries – is likely to
increase. For U.S. refineries this provides potentially an alternative feedstock to
sanctioned Venezuelan heavy oil for maximizing the utilization of their heavy oil
upgrading units, such as cokers.
Each of the refinery options are interrelated, and all are likely responses to IMO 2020 in
varying degrees. There are many indications that refinery responses are already underway.
This is indicated by many announcements by refiners that they are already testing and will be
16 IEA, “Oil Refineries,” Energy Technology Systems Analysis Programme, April 2014.
Page 12Economic Analysis of IMO 2020
June 2019 Charles River Associates
prepared to offer compliant fuels well before IMO 2020 implementation on January 1, 2020.
=For example, the following refiners, among others, have made such public announcements:
Shell,17 Exxon Mobil,18 Chevron,19 Marathon,20 and BP.21
In sum, oil refiners in the U.S. and elsewhere have successfully met previous clean fuel
regulatory tightening with a smooth and coordinated transition. They have seen IMO 2020 on
the horizon and have a multitude of operation and investment “levers” at their disposal to
respond to its implementation before the end of this year. As a result of significant
investments to develop complex refineries, the U.S. refiners are particularly well prepared
and set to benefit.
3.3. Fuel Market Impacts
Given the expected responses by the shipping and refining sectors, the EIA and others have
forecasted minimal fuel market impacts of IMO 2020 (as discussed later). This conclusion is
supported by expectations that fuel price changes will lead to shipowner and refiner
responses that will mute any possible impacts. In this section, several significant fuel market
topics are discussed in relation to IMO 2020 response.
3.3.1. Regarding Short-term Price Impacts
Short-term price impacts are generally driven by unexpected shifts in demand (or supply) in
an environment in which either supply (or demand) is inflexible, constrained, or highly
sensitive to small changes. Such price impacts are particularly acute when the change is not
predictable and occurs too fast to allow responses by the market. The IMO 2020 regulation is
not such a change. It has been expected for years and, even though implementation begins
on a set date, the market will begin responding well before January 2020.
There are both supply-related and demand-related reasons to expect that price increases
during IMO 2020 implementation will be muted. On the supply side, there is a significant
amount of fuel storage available in and near ports across the world that could begin accepting
compliant fuels months in advance of January 2020. There are also options to expand
storage opportunistically. Storage of VLSFO has already begun at the time of this report,
including off-shore storage in large vessels near ports in Singapore and Malta. 22 Many global
ports have increased fuel storage capacity and segregation capabilities in anticipation of IMO
2020 implementation.
On the demand side, shipowners have no choice but to begin to take on compliant fuels prior
to January 1, 2020. Most ships switching fuels will require tank cleanouts which, due to port
availability and trip schedules, requires staggering for months prior to IMO 2020. Even
without extensive cleanouts, ships will likely begin using compliant fuels early to avoid holding
non-compliant fuels as of January 1, 2020.
17 Shell: https://www.shell.com/business-customers/marine/imo-2020.html
18 ExxonMobil: https://www.exxonmobil.com/en/marine/technicalresource/press-releases/2020-compliant-fuels
19 Chevron: https://www.reuters.com/article/us-chevron-shipping-idUSKCN1T61G7
20 Marathon Pertroleum: https://www.marathonpetroleum.com/content/documents/Responsibility/MPC-ClimateReport-2018.pdf
21 BP: https://www.bp.com/content/dam/bp/business-sites/en/global/bp-global-energy-trading/documents/what-we-
do/marine/marpol-technical-guide-oct-2018.pdf
22 Cheong and Cang, “A Fleet of Tankers Is Hoarding Oil for a Gathering Storm,” Bloomberg, April 29, 2019.
Page 13Economic Analysis of IMO 2020
June 2019 Charles River Associates
In addition to the EIA, and with the exception of a few studies, the market seems to agree that
significant refined product price increases before or during January 2020 are unlikely, as well
as in the months following January 2020 (though trade volume is extremely low that far in the
future). This can be inferred by reviewing commodity futures prices for refined petroleum
products. Diesel and gasoline are the refined products with the highest product consumption
and futures trade volumes. Most other refined products, such as heating oil, jet fuel and
bunker fuels, are not traded forward at a high volume, and instead they can be hedged
through diesel and gasoline futures, or through crude futures or forward contracts. While
there are also compliant bunker fuel futures contracts available, they are not yet traded at a
volume to be informative.
The following chart shows futures prices for diesel (New York Harbor Ultra-Low Sulfur Diesel)
and gasoline from July 2020 through the end of 2020.
Figure 4: Diesel and gasoline futures prices (cents/gallon), July 2019 to Dec 2020
Source: Bloomberg
Diesel prices see a gradual price increase prior to IMO 2020 implementation, but the price
increase is only $0.04/gallon (Economic Analysis of IMO 2020
June 2019 Charles River Associates
can explain why – if fuel consumers (or speculators) believe there is a likelihood of a spike, it
would make sense to secure future pricing at the low current futures prices, at the very least
as a hedge. As such purchases are made, the price would increase in response to the
demand. Eventually, an equilibrium price would be found at the market’s collective view of the
most likely price at the future delivery date (with minor adjustments for risk and asymmetric
information). Any significant deviation would be an arbitrage opportunity in a liquid market. If
the market believed the studies that estimate price impacts of 20% or more, the futures prices
would certainly reflect that by now.
3.3.2. Crude Oil Price and Production Response
Crude oils are generally defined and differentiated by two properties: sulfur content and
relative density. Crude oil sulfur content ranges from sweet (low sulfur) to sour (high sulfur),
with a gradient in between. Crude oil relative density , measured in API Gravity, ranges
from light (high API gravity) to heavy (low API gravity), with a gradient in between. The
combination of these properties, along with a few other physical characteristics, generally
drive the value of each crude type. In general, sulfur content is considered undesirable, and
therefore sweeter crudes are more valuable for simple refineries. Lighter crudes have a
higher percentage of light hydrocarbons that can be recovered by simple refineries.
The price spreads between different crudes are driven by a complex interaction between
supply and demand dynamics for each crude and each refined product. These dynamics are
influenced by exploration and production economics, refining technologies and economics,
and market demand for fuels. The most important consideration for evaluating the impact of
IMO 2020 (or a reduction in compliance with IMO 2020) is that a shift toward lower sulfur
bunker fuels will result in more demand for sweeter crudes. It is commonly accepted that IMO
2020 will increase the value of light sweet crude and decrease the value of heavy sour crude.
The following chart shows the share of crude production in the U.S. and the world excluding
the U.S. for each major crude type. Sweet crudes are highlighted with gray boxes. The U.S.
light sweet crude share was over 60% in 2017. Only about 5% of U.S. production was heavy
sour crude.
Figure 5: Share of Crude Production by Type, U.S. and Rest of World (2017) 24
Source: eni
24 “World Oil Review 2018,” eni, 2018.
Page 15Economic Analysis of IMO 2020
June 2019 Charles River Associates
The IMO 2020 regulation will benefit countries that produce light sweet crudes, such as the
U.S., and will negatively impact producers of heavy sour crudes (such as Saudi Arabia,
Russia, Iraq, Iran, Venezuela, and Canada). Therefore, the opposite can be said of a move to
Partial IMO, as the higher demand for HSFO and lower value of low sulfur fuels lead to a
decrease in the value of U.S. crude oil.
The global fuels markets are already experiencing a “lightening” and “sweetening” of crude
oil. This is mostly driven by the expansion of U.S. production. More recently, there have been
significant production cuts by several countries with more sour crudes, such as Iran and
Venezuela.25 Interestingly, this has the impact of making HSFO scarcer since there is less
residuum from processing heavy sour crudes. This will likely decrease impacts of IMO 2020
since it represents a crude-driven reduction in the spreads between HSFO and other marine
fuels.26
4. Defining the Compliance Scenarios
This study evaluates the economic implications in 2020 of a U.S.-led defection from full global
implementation of the IMO 2020 regulation. This required a comparison of two scenarios that
differ only in the level of compliance. The first scenario is the “baseline” scenario that
assumes full implementation of IMO and compliance at the rates commonly estimated by
studies of IMO 2020. The second scenario is almost identical, except the U.S. leads
increased non-compliance. The differences in economic outcomes between the scenarios is
the economic impact of additional non-compliance. In both scenarios the IMO 2020 regulation
will begin implementation on January 1, 2020.
4.1. Baseline Scenario (“Baseline IMO 2020”)
The Baseline IMO 2020 scenario includes a certain level of non-compliance that reflects the
most common views for various forms of non-compliance. Some non-compliance is expected
in certain international shipping routes between ports and countries with low expectations of
enforcement and on vessels flagged in countries with low likelihood of enforcement. Non-
compliance within the IMO 2020 framework is also expected for ships fueling at ports with is-
sues related to compliant fuel quality and availability. While this particular form of “non-com-
pliance” may be excused under IMO 2020, it is included as part of the baseline non-compli-
ance since it may result in additional HSFO use by ships without scrubbers. More of this form
of non-compliance is expected in the earlier part of 2020 as certain ports convert their fuel of-
ferings.
The EIA discusses non-compliance in its stand-alone report on IMO 2020.27 While they do
not cite a specific assumption about non-compliance, the majority of analyses to date include
estimates between 10-20% of total shipping fuel consumed in 2020. For example, in April
2019 the IEA estimated baseline non-compliance in 2020 of 16%.28 Consist with these
studies, the Baseline IMO 2020 scenario assumes that non-compliance represents 15% of
total marine fuels.
25 Xu. Conglin. “Crude quality imbalances,” Oil and Gas Journal, March 26, 2019.
26 “How the bottom of the barrel became the top of refining margins,” International Shipping News, May 6, 2019.
27 “The Effects of Changes to Marine Fuel Sulfur Limits in 2020 on Energy Markets,” EIA, March 2019.
28 International Energy Agency, Oil 2019 Analysis and forecast to 2024
Page 16Economic Analysis of IMO 2020
June 2019 Charles River Associates
4.2. Partial Compliance Scenario (“Partial IMO 2020”)
Despite the health, environmental and certain economic benefits expected from IMO 2020,
there have been policy discussions in the U.S. about trying to delay implementation. The de-
lay proposals are mostly based on concerns of fuel price impacts of IMO 2020. Such pro-
posals have failed at the international level, most recently in 2018 when the IMO rejected a
delay proposal and confirmed explicit enforcement measures. It is therefore assumed that
any reduction in compliance led by the U.S. would involve deliberate non-enforcement in cer-
tain regions, between certain ports, and/or on ships flagged in certain countries.
This study is not designed to critique the legality or practicality of the U.S. coordinating
significant levels of IMO 2020 non-compliance. Nevertheless, to evaluate a “partial
compliance” scenario, it was necessary to formulate a view on the possible pattern and extent
of non-compliance that could be driven by the U.S. Given the complexities of a single country
attempting to materially influence global compliance rates, it was difficult to envision a
scenario with significantly less compliance.
The Partial IMO 2020 scenario is considered to be at the high end of possible levels of global
non-compliance with IMO 2020 that could be driven by the U.S. The scenario assumes an
additional 15% global non-compliance, leading to total HSFO consumption of about 45% of
marine fuels, up from 30% in the Baseline IMO 2020 scenario. The Baseline IMO 2020
scenario assumed 15% total non-compliance and 15% of marine fuels consumed as HSFO
by ships with scrubbers in a compliant manner. The figure below shows the global share of
marine fuels consumed as HSFO in the two scenarios.
Figure 6: Global Share of Marine Fuels Consumed as HSFO in the Scenarios (2020)
In the Partial IMO 2020 scenario, U.S. consumption of HSFO is allowed to significantly
increase. It is only constrained by the mostly fixed demand for lower sulfur fuels consumed by
ships requiring compliant fuels (for reasons such as complying with Flag State requirements
or heading to destinations in Port States that enforce IMO 2020 compliance). In the Partial
IMO 2020 scenario, HSFO consumption in the U.S. reaches 40% of marine fuel sales,
compared to only 5% of bunker sales in the Baseline IMO 2020 scenario. This includes
HSFO sales to both scrubber-less ships (non-compliant) and ships with scrubbers (possibly
compliant). The global and U.S. shares of marine fuel volumes are shown in the figure below.
Page 17Economic Analysis of IMO 2020
June 2019 Charles River Associates
Figure 7: Shares of Marine Fuels, U.S. and Global, 2019-2020 (% of total)
The following sub-section describes the analysis supporting the definition of the Partial IMO
2020 scenario.
4.2.1. Additional Discussion of Partial Compliance Scenario
Under IMO regulations, compliance is enforced by Flag States and/or Port States. A U.S.-led
defection would likely require coordination of non-enforcement among many different Member
States with either significant numbers of flagged vessels or active bunkering ports. Neither
would be straight-forward:
Flag States – The U.S. itself is not a significant Flag State for merchant ships. U.S.-flagged
merchant ships represent about 1% of total global merchant shipping volume capacity (by
deadweight tonnage, or “DWT”). The following chart shows the share of shipping capacity for
ships flagged in the U.S. and in the 10 countries with greater than 2% of global capacity.29 Of
note, the five countries that proposed an “experience building phase” in October 2018 (Baha-
mas, Liberia, Panama, the Marshall Islands and the U.S.) represent 46.1% of capacity.
29 UNCTADSTAT, “Merchant fleet by flag of registration and by type of ship, annual, 1980-2018.” United Nations Conference
on Trade and Development.
Page 18Economic Analysis of IMO 2020
June 2019 Charles River Associates
Figure 1: Merchant Fleet by Flag Country, 2018 (by DWT)
Flag States could encourage non-compliance either by refusing to fine vessels or, more likely,
by staying somewhat compliant with IMO 2020 by levying extremely low fines. However, Flag
States’ control over compliance is limited since Port States can enforce compliance on any
ship entering their ports and waterways. It is therefore highly unlikely that significant levels of
non-compliance would be driven by Flag State non-enforcement.
Port States – Driving non-compliance through Port States would require a more blatant dis-
regard for the IMO 2020 rules, particularly after March 2020. As of March 1, 2020, ships with-
out scrubbers are not permitted to carry non-compliant fuels, meaning that Port States allow-
ing fuel suppliers to sell HSFO to ships without scrubbers would be directly disregarding the
MARPOL regulation.30 Assuming the Port States were to comply with that regulation, their
only option for encouraging non-compliance would be offering lax or non-existent monitoring
of ships entering their ports and waterways. This could allow both scrubber-less ships to ar-
rive with non-compliant fuels and ships with scrubbers to arrive without proof of having used
their scrubbers.
Even if the U.S. was willing to violate its IMO 2020 obligations as a Port State and allow ships
without scrubbers to bunker with HSFO, it would still need to coordinate with other Port
States that would commit to not enforcing IMO 2020 regulations on incoming vessels. Even
then, such an arrangement alone would only have a minor impact on global non-compliance
given the U.S. position in global bunker fuel sales and the high percentage of ships leaving
the U.S. for countries that would not be willing partners in a non-compliance scheme.
According to the IEA, the U.S. is responsible for about 7% of global bunker fuel sales. This is
shown in the chart below, which was provided in a report by asset manager Shroders.31 The
30 “Implementation of sulphur 2020 limit - carriage ban adopted,” IMO, October 26, 2018.
31 Odey and Lacey, “IMO 2020 – Short-term implications for the oil market,” Schroders, August 2018.
Page 19You can also read