INVESTOR PRESENTATION - Spartan Delta Corp. (SDE: TSXV) March 26, 2021

Page created by Alfred Wilson
 
CONTINUE READING
INVESTOR PRESENTATION - Spartan Delta Corp. (SDE: TSXV) March 26, 2021
INVESTOR PRESENTATION
Spartan Delta Corp. (SDE: TSXV)

March 26, 2021
INVESTOR PRESENTATION - Spartan Delta Corp. (SDE: TSXV) March 26, 2021
SPARTAN DELTA CORPORATE STRATEGY
Building a Sustainable Energy Company for Global Investors
                                                 DISCIPLINED CONSOLIDATOR
                                                  Building towards >100,000 BOE/d

WEST-CENTRAL ALBERTA DEEP BASIN – Liquids-Rich                                                                 ALBERTA MONTNEY – Oil-Weighted
 ▪ Low base decline 200%
                                                                                                                     ▪ Drill ready inventory with owned
 ▪ Drill ready inventory with owned                                                                                    infrastructure
   infrastructure
                                                                                                                     ▪ Organic growth with top tier Montney
 ▪ Asset sustaining capital
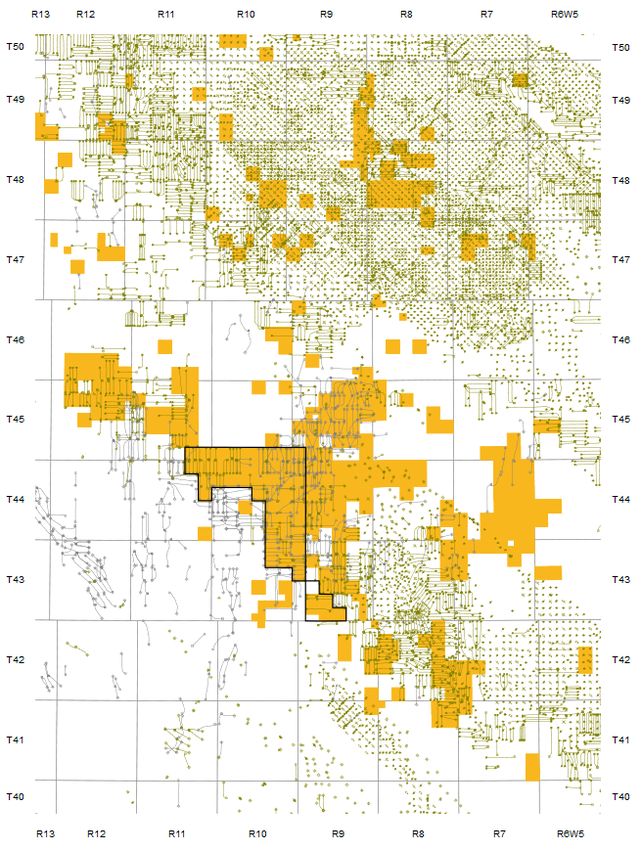
INVESTOR PRESENTATION - Spartan Delta Corp. (SDE: TSXV) March 26, 2021
COMPANY OVERVIEW
Spartan Delta Corp.

                                                                                                                                                ALBERTA MONTNEY:
                                                                                                                                                 ▪     Oil-weighted Montney
                                                                                                                                                       focus
Capitalization (as at March 25, 2021)                                                                                                            ▪     Additional consolidation
                                                                                                                                                       opportunities
Spartan Delta Corp.                                                 TSX-V                      SDE                                               ▪     Oil and Liquids-Rich
                                                                                                                                                       Montney drilling upside

Share Price (1)                                                      $/sh                      4.04

Market Capitalization (basic) (1)                                   $MM                       460.2

Common Shares Outstanding (basic)                                     MM                      113.9

Net Debt (as at Dec 31, 2020) (2)                                   $MM                        12.3

Estimated YE 2021 Net Debt (Surplus) (2)(3)                         $MM                       (115)

Insider Ownership (basic)                                               %                      13.5

Dilutive Instruments

   Warrants, ITM Options and Share Awards (4)                        MM                        21.2
                                                            (5)      MM                         6.5
   Zero Coupon Convertible Note (maximum issuance)
   Dilutive Proceeds                                                $MM                        26.3
Fully Diluted Shares Outstanding                                      MM                      141.6                                                                  WEST-CENTRAL DEEP BASIN:
                                                                                                                                                                       ▪    Cretaceous Oil and Liquids-
                                                                                                                                                                            Rich Gas focus
                                                                                                                                                                       ▪    Additional consolidation
                                                                                                                                                                            opportunities
                                                                                                                                                                       ▪    Spirit River and Cardium
                                                                                                                                                                            drilling upside

              March 26, 2021                                                                                                                                                                              3
                                              1)   Share price as at closing on March 25, 2021        4)   Excludes ~1.10MM out-of-the-money Options with an exercise price of $4.08/sh
                                              2)   See “Non-GAAP Measures” in Disclaimers             5)   Assumes maximum issuance at conversion of $7.67/sh
                                              3)   See “Forward Looking Statements” in Disclaimers
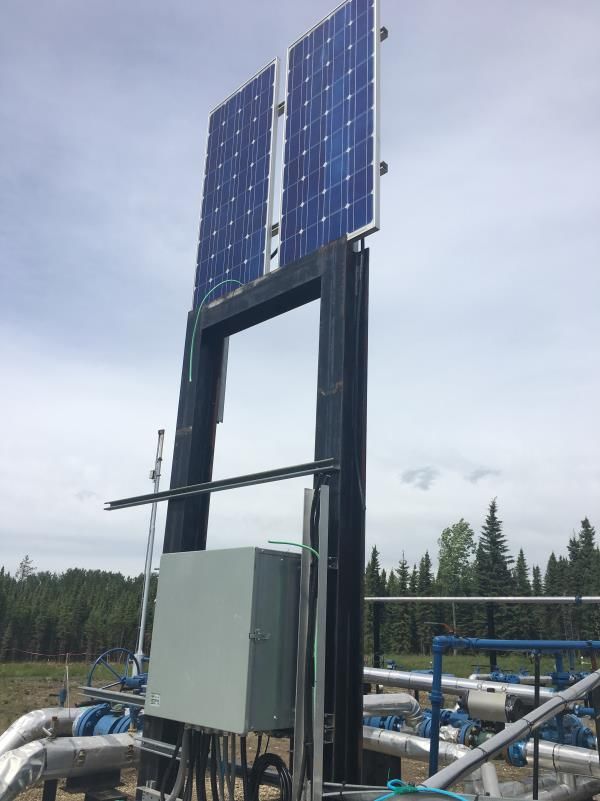
INVESTOR PRESENTATION - Spartan Delta Corp. (SDE: TSXV) March 26, 2021
YE 2020 HIGHLIGHTS
Optimization of Production and Cost Reductions Generate Material Free Funds Flow in 2020

Actuals                                    Q1 2020   Q2 2020        Q3 2020             Q4 2020                 FY 2020
Crude Oil                           %       10%        1%             1%                    1%                        1%
                                                                                                                             Low-cost production optimization              Current (3)
Condensate                          %         -        4%             4%                    4%                        4%     offset declines in H2

Natural Gas Liquids (NGLs) (1)      %        7%       25%            26%                   26%                        26%

Natural Gas                         %       83%       70%            69%                   69%                        69%

Average Production                 boe/d     251      8,906         26,282               26,010                  15,421

Operating Expenses                 $/boe    22.57     6.96           6.10                  5.68                       6.11

Transportation                     $/boe      -       1.38           1.34                  1.37                       1.36

Royalties                           %       0.4%      6.5%           8.5%                 10.5%                       9.0%

Operating Netback                  $/boe    (4.33)    5.90           8.32                  9.59                       8.46                 18% reduction in OPEX since West-
                                                                                                                                           Central Alberta Deep Basin
G&A                                $/boe                             1.50                                             1.64                 acquisition (7% reduction Q3 to Q4)
                                            37.76     1.48                                 1.48

Interest                           $/boe    (3.48)    0.23           0.26                  0.19                       0.21

Adjusted Funds Flow (2)            $MM      (1.5)      2.8           14.4                  16.8                       32.5

Capital Expenditure (net of A&D)   $MM      0.38       1.0            1.2                  14.0                       16.8

Well Count                           #        0         0              0                      4                        4

Free Funds Flow (2)                $MM      (1.9)      1.7           13.1                   2.8                       15.7

Exit Net Debt (Surplus) (2)        $MM      (21.7)    26.2           14.5                  12.3                       12.3

                 March 26, 2021                                                                                                                                              4
                                                               1)       See “Oil and Gas Advisories” in Disclaimers
                                                               2)       See “Non-GAAP Measures” in Disclaimers
                                                               3)       As of March 24, 2021
INVESTOR PRESENTATION - Spartan Delta Corp. (SDE: TSXV) March 26, 2021
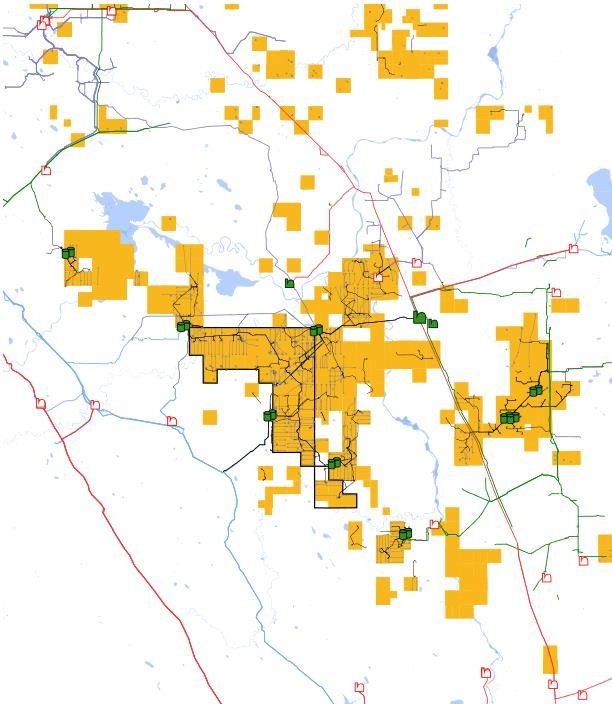
WEST-CENTRAL ALBERTA DEEP BASIN LIQUIDS-RICH DEVELOPMENT
Free Funds Flow Generating Core Area - Driven by Industry Leading Capital Efficiencies

West-Central Alberta Deep Basin Asset Characteristics
                                                                                                                           Tidewater BRC
                                                                                                                        185 mmscf/d Deep Cut
Top Quality Resource:
  ▪ Top tier, delineated liquids-rich Spirit River and condensate-rich
    Cardium gas development
  ▪ Primary targets: Falher, Notikewin and Cardium sands
                                                                                                                                                                                      SDE O’Chiese Nees-Ohpawaganu’ck 10-09
  ▪ 425 net risked Spirit River and Cardium locations (1)                                                                                                                                 230mmscf/d Deep Cut (25% WI)

                                                                                                                                     CVE Sand Creek
Land:                                                                                                                                  75 mmscf/d
                                                                                                                                        (9.6% WI)
                                                                                        SDE 5-5
  ▪ >54,000 (2) net acres of delineated Spirit River and Cardium land                 1,000 bbl/d

  ▪ Additional consolidation opportunities in the vicinity leveraging off                                                                                                                                           CVE Alder
                                                                                                                                                                                                                   75 mmscf/d
    infrastructure advantage                                                                                                                                                                                          (20% WI)

                                                                                                                  SDE 2-10                                          SDE 13-5
                                                                                                                 20 mmscf/d                                        74 mmscf/d
Infrastructure:
  ▪ Significant owned and operated strategic infrastructure in place to                                                             SDE 9-3
                                                                                                                                                                                                                    SDE 5-3
    grow production >40,000 boe/d with minimal incremental capital                                                                45 mmscf/d
                                                                                                                                                                                                                  20 mmscf/d
                                                                                                                                                                          SDE 6-21
  ▪ Deep-cut gas processing enhances margins on liquids recovery                                                                                                         40 mmscf/d
                                                                                                                                                                                                    SDE 8-4
                                                                                                                                                                                                  20 mmscf/d
  ▪ Direct tie-in to NGTL with optionality on liquids marketing
  ▪ Tangible operating cost savings as throughput increases over time
                                                                                                                                                                                        OBE Crimson
Low Decline Base Production:                                                                                                                                 SDE 4-29                   60 mmscf/d
                                                                                                                                                             350 bbl/d
  ▪ Current base decline of 19%

Material Free Funds Flow Driven by Low Sustaining Capital:
  ▪ Sustaining capital of $30 million vs. corporate NOI (3)(4) of $170 million
    ~$4,000/flowing barrel capital efficiency (1)
                                                                                                Spartan Working Interest Gas Plant                       Spartan Wells                          Pembina HVP / LVP
                                                                                                Third Party Gas Plant                                    Spartan Pipelines                      Tidewater Pipelines
                                                                                                Spartan Compressor Station / Battery                     NOVA NGTL                              Keyera Pipelines
               March 26, 2021                                                                                                                                                                                             5
                                                                                 1)    See “Oil and Gas Advisories” in Disclaimers                           4)          See “Non-GAAP Measures” in Disclaimers
                                                                                 2)    As of December 31, 2020
                                                                                 3)    Estimate, based on Spartan Budget Price Deck as defined on slide 36
INVESTOR PRESENTATION - Spartan Delta Corp. (SDE: TSXV) March 26, 2021
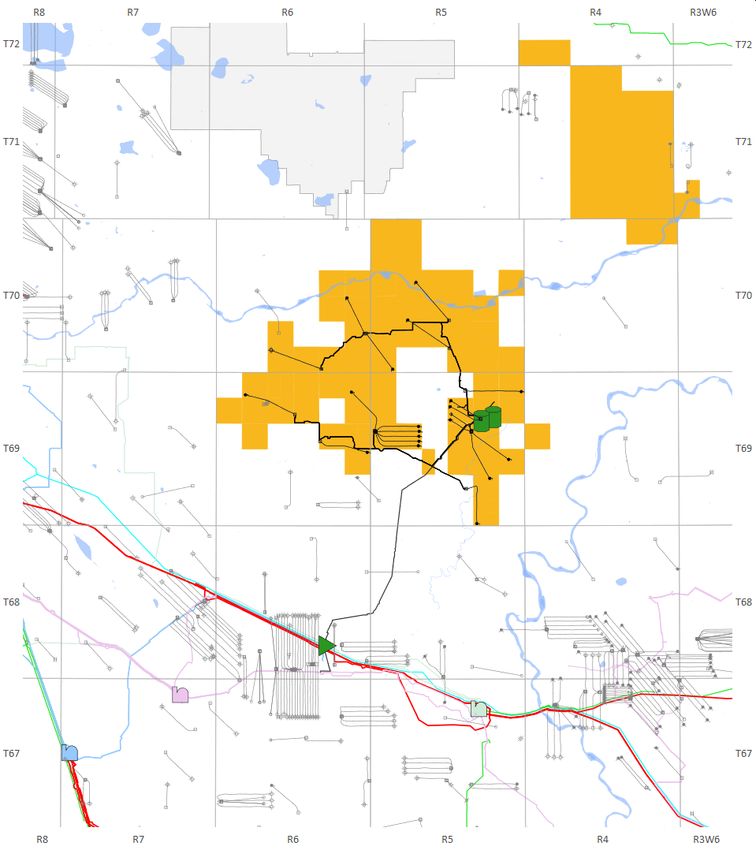
YE2020 RESERVES HIGHLIGHTS
Extended Reach Horizontals (“ERH”) Drives Step Change in F&D and Development Economics

YE2020 West-Central Alberta Deep Basin Reserves Highlights:
                                                                                                                                               Oil           Natural Gas         NGL's              Total    NPV10
  ▪ Spartan’s Year-End 2020 Reserves demonstrate the superior             Reserves Category                                                  (MMbbl)            (Bcf)           (MMbbl)           (MMboe)   ($MM) (1)
    economics of its West-Central Alberta Deep Basin core area:           Proved Developed Producing                                           0.9              277.3            20.2               67.3      375.9
                                                                          Total Proved                                                         2.6              557.0            39.6              135.0      777.3
          ▪ Recycle Ratio   (1) of   2.4x (TP) and 2.9x (TPP)
                                                                          Total Proved + Probable                                              5.0              847.8            60.6              206.9     1,078.1
          ▪ F&D (1) of $3.94/boe (TP) and $3.35/boe (TPP)
          ▪ 99% of the Reserve NPV10 (1) is within the West-                                                                                                Total (MMboe) (1)
                                                                                                                                      250
            Central Alberta Deep Basin core area; newly acquired                                                                                                                          206.9
            Alberta Montney core area to be included in the next                                                                      200
            reserves update

                                                                                                                   Reserves (MMboe)
                                                                                                                                      150                               135.0
  ▪ Reserve plan matches Spartan’s current business plan; modest
    capital expenditures to maintain significant free cash flow:
                                                                                                                                      100
                                                                                                                                                     67.3
          ▪ Optimized FDC (1) of $267MM (TP) and $417MM
            (TPP); only 1.9x (TP) and 3.0x (TPP) of Spartan’s                                                                          50
            current Adjusted Funds Flow (2) Guidance ($139MM)
                                                                                                                                        0
  ▪ Highly economic and achievable development plan delivers                                                                                         PDP                 TP               TPP
    $620MM of NOI (2) after capital in McDaniel’s 5-year reserves
    model
                                                                                                                                                            NPV10 ($MM) (1)
          ▪ 72% of booked and 56% of total inventory are now                                                            $1,200                                                             $1,078
            configured as ERH locations
                                                                                                                        $1,000
  ▪ Material future reserves growth potential remains unbooked:                                                                                                          $777

                                                                                                     NPV10 ($MM)
                                                                                                                                      $800
          ▪ Only booked reserves in four main formations
            (Cardium, Falher A, Falher B, and Notikewin)                                                                              $600
                                                                                                                                                     $376
          ▪ Over 425 Spirit River and Cardium locations (1) remain                                                                    $400
            in inventory (>75% unbooked)
                                                                                                                                      $200
  ▪ Spartan’s YE2020 Reserves do not include any values
                                                                                                                                        $0
    attributable to transactions announced in 2021                                                                                                   PDP                   TP               TPP

              March 26, 2021                                                                                                                                                                                            6
                                                                     1)        See “Oil and Gas Advisories” in Disclaimers
                                                                     2)        See “Non-GAAP Measures” in Disclaimers
INVESTOR PRESENTATION - Spartan Delta Corp. (SDE: TSXV) March 26, 2021
WEST-CENTRAL ALBERTA DEEP BASIN 2020 YE RESERVE AUDITOR MODEL
McDaniel’s TPP Bookings Generate $620 Million of NOI (2) After Capital Expenditure in First 5 Years

                    TPP Production Forecast                                                        YE 2020 TPP NOI (2) Summary (5yr McDaniel’s Forecast)
            Achievable Development with Steady Production Growth                        TPP Development Generates Material Net Operating Income at Reserve Auditor Pricing

                                       Spartan can show reserve and value growth for the next 5+ years:

                                       ▪   101 Net locations booked (63 PUD, 38 PBUD), TP FDC (1) = $266.5MM, TPP FDC (1) = $417.3MM
                                       ▪   Additional 425 locations in inventory with strong economics (>75% unbooked)
                                       ▪   Ability to increase capital expenditures and accelerate growth within cash flow

         March 26, 2021                                                                                                                                                7
                                                                         1)      See “Oil and Gas Advisories” in Disclaimers
                                                                         2)      See “Non-GAAP Financial Measures” in Disclaimers
INVESTOR PRESENTATION - Spartan Delta Corp. (SDE: TSXV) March 26, 2021
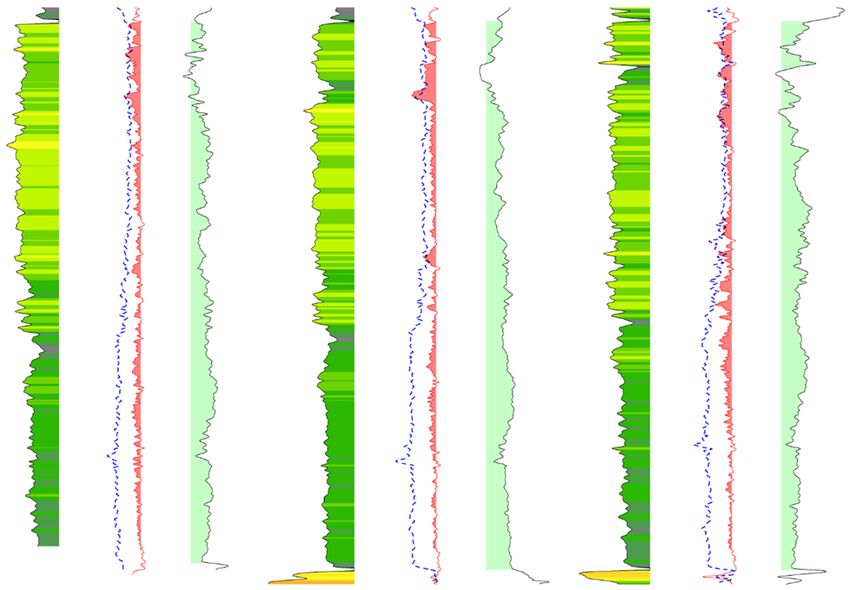
WEST-CENTRAL ALBERTA DEEP BASIN INVENTORY SUMMARY
Robust Inventory with Years of Future Growth at High Rates of Return

Updated Inventory:                                                                                           YE2020 Inventory Summary (1)

  ▪ As at year end 2020, prior to acquisitions announced on February 16, 2021
                                                                                                      Zone                                                          Booked            Unbooked                Total               % ERH
  ▪ Rigorous review of every location within the West-Central Alberta Deep
    Basin inventory                                                                                     Cardium                                                       37                 121                   158                 65%
                                                                                                        Spirit River (2)                                              57                 211                   268                 52%
  ▪ In 2020, Spartan reconfigured its reserves inventory to capture Extended                          Total Cardium & Spirit River                                    93                 332                   425                 57%
    Reach Horizontal (ERH) locations where available                                                    Other (6)                                                      8                 157                   165                 53%
                                                                                                      Total                                                           101                489                   590                 56%
Highly Economic and Efficient Inventory:
  ▪ Reconfiguring to ERH has made locations more economic. Compared with
    1.0-mile locations, 2.0-mile extended reach horizontals:
           ▪ Require 1.25x more CAPEX
                                                                                                                                                 Cumulative Distribution of Location IRR (3)(5)
           ▪ 1.80x higher 1P/2P reserves                                                                                                                   By Booking Category
                                                                                                                                     100%
           ▪ Results in 1.7x higher IRR (5)                                                                                          90%
  ▪ YE2020 Inventory is now ~56% extended reach                                                                                      80%

                                                                                                       Percentage of Inventory (%)
  ▪ Spartan has identified ~200 net Spirit River and Cardium locations with IRRs                                                     70%
    (3)(5) exceeding 100%
                                                                                                                                     60%

What Drives the Robustness of the Inventory?                                                                                         50%

  ▪ High quality, over pressured reservoir with high liquids yield                                                                   40%

                                                                                                                                     30%
  ▪ Infrastructure is built out: full cycle economics require little to no
    infrastructure capital                                                                                                           20%                                    5 Year Plan | 13 net wells/yr | Mean IRR = 306%
                                                                                                                                                                            Booked | 93 net wells | Mean IRR = 216%
  ▪ Deep cut processing enhances liquids recovery                                                                                    10%
                                                                                                                                                                            Unbooked | 218 net wells | Mean IRR = 111% (4)
  ▪ Field optimization since acquisition has reduced operating costs and                                                              0%
                                                                                                                                            0%   100%            200%               300%                400%               500%
    increased margins
                                                                                                                                                                         IRR (%)

               March 26, 2021                                  1)     Net locations rounded to the nearest whole number                          4)      Unbooked excludes Falher D/E and Wilrich
                                                                                                                                                                                                                                             8
                                                               2)     Spirit River includes Notikewin, Falher A/B/D/E and Wilrich                5)      See “Non-GAAP Measures “in Disclaimers
                                                               3)     Based on Spartan Budget Price Deck, as seen on slide 36                    6)      Other includes 8 Booked PRA locations, and all other zones in West-Central Alberta Deep Basin
INVESTOR PRESENTATION - Spartan Delta Corp. (SDE: TSXV) March 26, 2021
WEST-CENTRAL ALBERTA DEEP BASIN SPIRIT RIVER TYPE WELL
Operational Efficiencies and ERH Drilling Drives Step Change in Well Economics

Highlights:
  ▪ Next 5-year estimated development capital efficiency (4): ~$4,000/boepd
  ▪ >88 locations with less than 10-month payout (4)
  ▪ Considerable room for future reserve growth: 22% booked
  ▪ Diversification potential through complementary zones (Falher D/E, Wilrich excluded)
  ▪ Diverse land base: 58% Crown / 42% IOGC

                                                                              1P Type Curve and Economics (1)

                                                                                                                                                     Spirit River Single Well 1P Economics (2)

                                                                                                            Inputs                                                           Tier 6+                 Tier 5   Tier 3-4
                                                                                                               1P Reserves                                  Mboe              1,545                  1,069      673
                                                                                                                   Gas                                      MMcf              6,657                  4,620     2,841
                                                                                                                   Cond                                     Mbbl                52                     36        22
                                                                                                                   NGLs                                     Mbbl               383                    201       131
                                                                                                               % Liquids                                     %                 28%                    22%       23%
                                                                                                               DCET                                         C$M              $4,465                  $3,912   $3,454
                                                                                                               Average lateral length                        mi                1.9                     1.7       1.4

                                                                                                            Outputs
                                                                                                               NPV10                                        C$M              $8,692                  $5,866   $3,186
                                                1                                                              IRR                                           %                271%                    221%     120%
                                                                                                               Payout                                      Years               0.6                     0.7      1.2
                                                                                                               Capital Efficiency                         $/boepd            $3,044                  $4,098   $5,611
                                                                                                                                              (3)
                                                                                                               Net Location Count                            #                 37                      31       71
                                                                                                               % of Inventory                                %                21%                     18%      41%

              March 26, 2021                                                                                                                                                                                             9
                                           1)       See “Oil and Gas Advisories” in Disclaimers, Type Curve prepared by McDaniel, Dec. 2020         4)      See “Non-GAAP Measures” in Disclaimers
                                           2)       Based on Spartan Budget Price Deck as seen on slide 36; Jan 1, 2021 Effective Date
                                           3)       Includes Falher B, Notikewin and select Falher A locations
INVESTOR PRESENTATION - Spartan Delta Corp. (SDE: TSXV) March 26, 2021
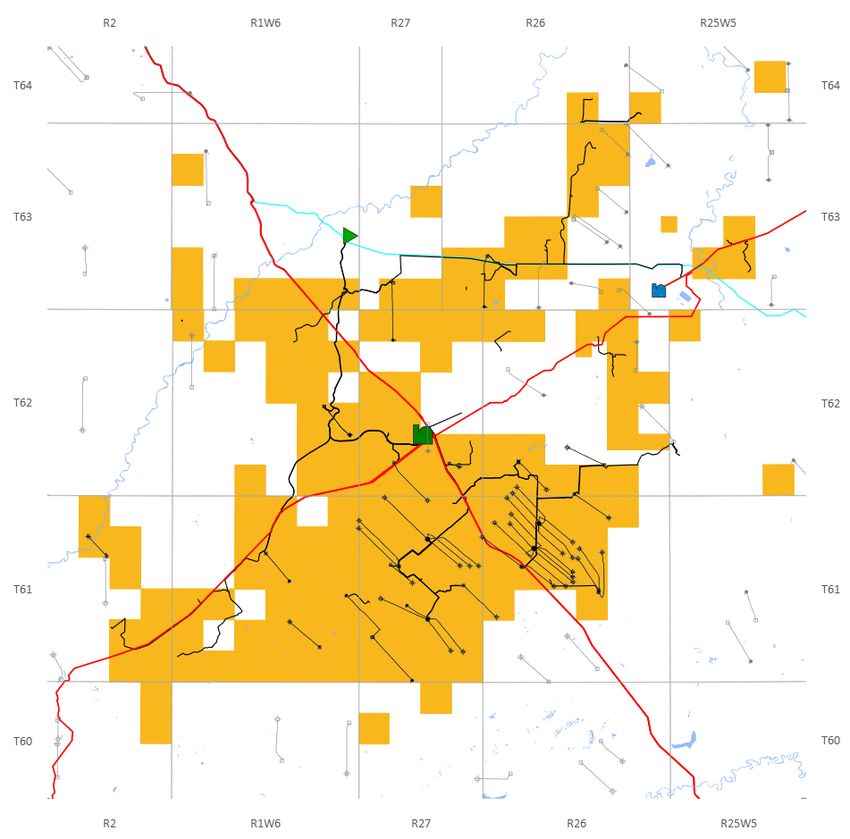
WEST-CENTRAL ALBERTA DEEP BASIN CARDIUM TYPE WELL
Over-Pressured Cardium Provides Compelling Condensate-Rich Economics

Highlights:                                                                                                                         Inventory IRR of Cardium
  ▪ Next 5-year estimated development capital efficiency   (3):   ~$5,000-6,000/boepd
  ▪ >107 locations with less than 1 year payout (3)
  ▪ 65% of inventory is booked as ERH
  ▪ Considerable room for future reserves growth: 24% booked
  ▪ Diverse land base: 63% Crown / 37% IOGC

                                                                  1P Type Curve and Economics (1)

                                                                                                                                                                                 (2)
                                                                                                                Cardium Average Tier Single Well 1P Economics

                                                                                         Inputs                                                                         Tier 3         Tier 1
                                                                                            1P Reserves                                         Mboe                     963            579
                                                                                                Oil                                             Mbbl                      62             67
                                                                                                Gas                                             MMcf                    3,097          1,764
                                                                                                Cond                                            Mbbl                      36             19
                                                                                                NGLs                                            Mbbl                     349            199
                                                                                            % Liquids                                            %                       46%            49%
                                                                                            DCET                                                C$M                     $4,222         $3,595
                                                                                            Average lateral length                               mi                      1.9            1.4

                                                                                         Outputs
                                                                                            NPV10                                                C$M                    $6,803         $3,983
                                                                                            IRR                                                   %                      212%           136%
                                                                                            Payout                                              Years                     0.7            0.9
                                                                                            Capital Efficiency                                 $/boepd                  $5,357         $6,846
                                                                                            Net Location Count                                     #                      57             50

               March 26, 2021                                                 1)    See “Oil and Gas Advisories “in Disclaimers, Type Curve prepared by McDaniel, Dec. 20                       10
                                                                              2)    Based on Spartan Budget Price Deck as seen on slide 36; Jan 1, 2021 Effective Date
                                                                              3)    See “Non-GAAP Measures” in Disclaimers
WEST-CENTRAL ALBERTA DEEP BASIN WINTER DRILLING RESULTS
Winter Drilling Program – Exceeding Expectations

Highlights:
                                                                                                                                                                                          102/16-23-045-09W5
  ▪ 8 well program: six extended reach horizontal Spirit River wells, one 2.0-                                                                                                             Cardium, 2 mile HZ
                                                                                                                                                                                                                                  SDE 10-09 Deep Cut Gas Plant

    mile Cardium well and one 1.0-mile Spirit River                                                                                                               100/06-25-044-10W5
                                                                                                                                                                  Falher B, 1.6 mile HZ

  ▪ 8 wells are now on production, with several wells producing at restricted
    rates to manage declines and operational efficiencies
                                                                                                                                   102/04-25-044-10W5
  ▪ 7 of the 8 locations feed the Spartan operated 10-09 deep cut gas plant                                                         Falher B, 2 mile HZ

                                                                                                                                   103/04-25-044-10W5
  ▪ All operations were completed successfully under budgeted DCET cost                                                            Notikewin, 2 mile HZ

                                                                                                                                               100/07-01-044-10W5
                                                   Spartan Production – Net Sales                                                              Falher B, 1.8 mile HZ
                                                                                                                                                                                                                         100/01-26-044-07W5
                                  35,000                                                                                                       102/08-01-044-10W5
                                                                                                                                                                                                                         Notikewin, 2 mile HZ
                                                                                                                                               Falher B, 1.8 mile HZ

                                  30,000
                                                                                                                                                                         102/01-16-043-09W5
   Net Sales Production (boe/d)

                                                                                                                                                                          Falher B, 1 mile HZ
                                  25,000

                                  20,000

                                  15,000

                                  10,000

                                   5,000
                                                                                                                                                                                              DCET (1)            IP30 (2)            IP60 (3)
                                      0
                                      2020-10      2020-11      2020-12        2021-01        2021-02
                                                                                                                                                                                             ($MM)               (boe/d)            (boe/d)
                                                                                                                                                     Q4/Q1 Program                              $3.8              1,523              1,642
                                                 Spartan Base    Q4 Drilling    Q1 Drilling

                                           March 26, 2021                                                                                                                                                                                                   11
                                                                                                        1)   Average DCET over 8 well program; including 6 two-mile Spirit River wells, 1 Cardium two-mile and 1 single-mile Spirit River
                                                                                                        2)   Average IP30 Production Sales Estimates for 8 Spirit River wells
                                                                                                        3)   Average IP60 Production Sales Estimates for 6 Spirit River wells
SUMMARY OF RECENT ACQUISITIONS
Acquisition of High-Quality Assets Establishes Second Core Development and Consolidation Area

Spartan has entered into three definitive acquisition agreements which
execute upon its consolidation strategy.

Alberta Montney Core Area Entry Acquisitions:                                                                                                                 SDE Gold Creek
  ▪ Gold Creek Oil Montney with the corporate acquisition of Inception Exploration                                                                           Processing Facility

  ▪ Simonette Liquids-Rich Montney and Spirit River with assets coming out of a CCAA
    restructuring
                                                                                                                                         Gold Creek
West-Central Alberta Deep Basin Core Area Expansion Acquisition:                                                                                                                   Simonette Gas Plant
  ▪ Willesden Green, Cardium and Spirit River Assets with production, royalties, facilities
    and land
Summary of Acquisitions

Production - Feb 16, 2021 (22.5% Oil, 4.5% Condensate, 8% NGLs)               boe/d                9,700
Proved Reserves (1)                                                           Mboe                91,517                       Simonette
Proved plus Probable Reserves (1)                                             Mboe               215,381
Run Rate Net Operating Income (2)                                             $MM                   50.0
Total Land                                                                    net acres          235,393
    Total Montney Land                                                        net acres           85,388
Total Net Drilling Locations (1)                                              #                      414
                                             (1)                              #                      343
    Total Net Montney Drilling Locations

Metrics of Acquisitions                                                                                                                                                                           SDE O’Chiese Nees-
                                                                                                                                                                                                                             Alder Gas Plant
                                                                                                                                                                                                Ohpawaganu’ck Gas Plant
Production - Feb 16, 2021                                                     $/boe/d             15,247
Proved Reserves (1)                                                           $/boe                 1.62
Proved plus Probable Reserves (1)                                             $/boe                 0.69
                                                                                                                                                                       Sand Creek Gas Plant
Multiple of Run Rate Net Operating Income (2)                                 x                     2.95

Total Purchase Price

Cash consideration, after estimated adjustments                               $MM                     18.4
                                                                                                                                                                                                                                      Willesden
Common Shares                                                                 $MM                     96.7                                                                                                                            Green
                                                                       (3)
Convertible Unsecured Promissory Note (Principal - $50.0MM)                   $MM                     25.0
Working Capital Deficit                                                       $MM                      7.8
                                                                                                                                                                                               Spartan (Pre-acquisitions)
Total consideration (estimate)                                                $MM                   147.9
                                                                                                                                                                                               Inception Exploration
                                                                                                                                                                                               Simonette Acquisition
                                                                                                                                                                                               Willesden Green Acquisition
                  March 26, 2021        1)         See “Oil and Gas Advisories” in Disclaimers
                                                                                                                                                                                                                                               12
                                        2)         Run Rate NOI based on Spartan Budget Price Deck as seen on slide 36, See Non-GAAP Measures in Disclaimers
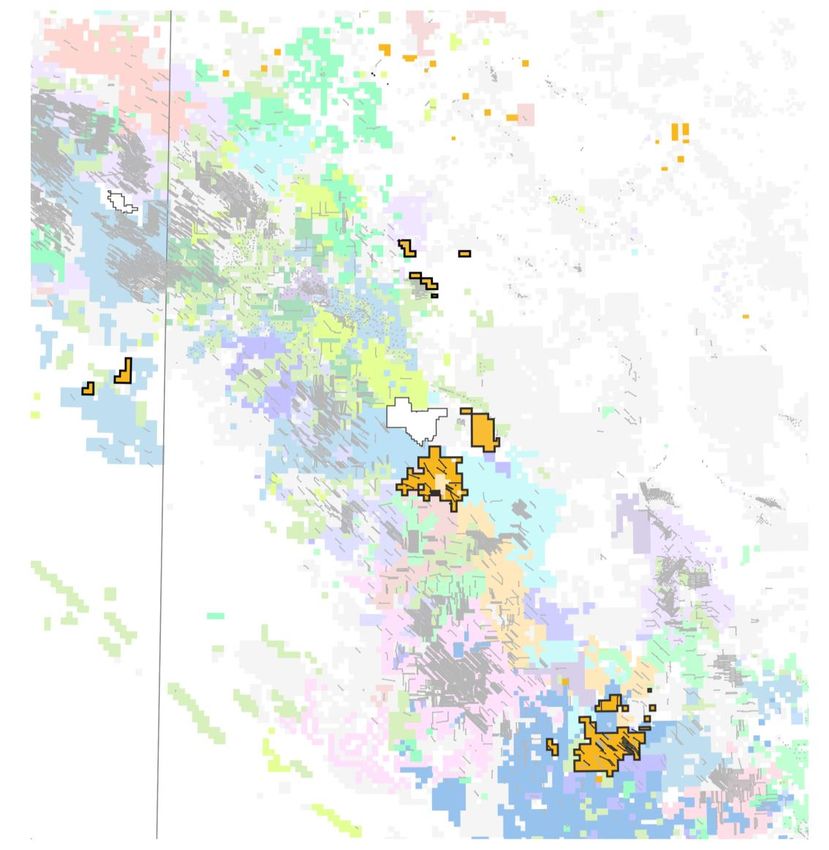
                                        3)         Convertible at Spartan’s election after second anniversary at greater of $7.67/sh or 10-day VWAP of SDE equity on conversion date
MATERIAL ENTRY INTO THE ALBERTA MONTNEY FAIRWAY
Introducing Spartan’s New Core Area for Development and Consolidation
Best in Class Resource:                                                                                                                                                                             Spartan Montney Lands
                                                                                                                                                                                                    Velvet Energy
  ▪ One of Canada’s most prolific plays with attractive economics                               Leucrotta                                                                                           Hammerhead Resources
    across a broad range of commodity prices                                                                                                                                                        Pipestone Energy
                                                                                                                                                                                                    Shell
  ▪ Delineated and repeatable development - well suited to
                                                                                                                                                                                                    Paramount Resources
    Spartan’s low-cost execution skill set                                                                                                                                                          Advantage

  ▪ Higher oil and liquids rates provide commodity diversification to                               Arc                                                                                             Kelt
                                                                                                                                                                                                    NuVista
    the business
                                                                                                                                                                                                    Seven Generations
                                                                                                                                                                                                    Distinction / Kiwetinohk
                                                                                                                                         Tourmaline
Near-term Development Pathway to >25,000 boepd of Oil-                                                                                                                                              XTO
Weighted Alberta Montney Production:                                                                                                                                                                Whitecap
                                                                                                                                                                                                    Cenovus
  ▪ Deep inventory with drill ready locations                                                                                                                                                       Canadian Natural
                                                                                                                                                                                                    Leucrotta
  ▪ Spartan owned infrastructure in place to accommodate growth                                                                                                                                     Arc
    without incremental spend                                                                                                          Advantage                                                    Ovintiv
                                                                                                                                                      Kelt                                          Tourmaline
  ▪ Multiple egress pathways provide flexible marketing options
                                                                                                                                                  Grande Prairie
Inception Acquisition (Gold Creek):
                                                                                                                                                 Pipestone
  ▪ Current Production ~4,200 boe/d (~53% liquids) (1)(3)
                                                                                                                                    Gold Creek                            Velvet
  ▪ Infrastructure in place to grow to 20,000 boe/d                                                                                                          Shell
                                                                                                                                                 Paramount
  ▪ Near-term focus of development                                                                                                     NuVista                 CNRL

                                                                                                                                                                      Hammerhead
Simonette Acquisition:
  ▪ Current production ~4,500 boe/d (17% liquids) (2)(3)
  ▪ Infrastructure in place to grow to 25,000 boe/d
                                                                                                                                                               Seven               Whitecap
  ▪ Mid-term development focus                                                                                                                                 Generations

January Land Acquisition:                                                                                                                                                                               Ovintiv
                                                                                                                                                                             XTO
  ▪ 26 sections of Montney rights                                                                                                                                                             Cenovus         Distinction /
                                                                                                                                                                               Simonette                      Kiwetinohk
  ▪ Future development potential upon expansion of infrastructure
    footprint

                March 26, 2021                                                                                                                                                                                                 13
                                                   1)       43% crude oil, 10% NGLs and 47% conventional natural gas
                                                   2)       4% crude oil, 9% condensate, 4% NGLs and 83% conventional natural gas
                                                   3)       As of March 12, 2021
GOLD CREEK MONTNEY DEVELOPMENT
Acquisition of Inception Exploration Anchors Second Core Development and Consolidation Area

Inception Asset Characteristics
                                                                                                                           CITY OF GRANDE PRAIRIE
                                                                                                                                                                                                           Bezanson
Top Quality Resource:
  ▪ Top tier Montney asset in the core of the Alberta Montney Oil
                                                                                             Pipestone
    development fairway
  ▪ >128 net risked Middle Montney locations (1)(2)

Land:                                                                                                                                                                            SDE Battery & Gas Processing:
                                                                                                                                                                                 •    10,000 bopd
  ▪ >30,000 net acres of delineated Montney land                                                                                                                                 •    5,000 bwpd
                                                                                                                                                                                 •    40 mmscf/d sour gas

  ▪ Additional consolidation opportunities in the vicinity leveraging off
    infrastructure advantage

Infrastructure:
  ▪ Significant 100% working interest (“WI”) infrastructure in place to
    grow production >20,000 boe/d with minimal incremental capital                          Elmworth

  ▪ Processing optionality: dual gas plant connection, ability to add third                                          SDE Sales Compressor
    connection with minimal capital
  ▪ Sales optionality: dual connection to NOVA and Alliance                                                                                                       Gold Creek

  ▪ No minimum-volume processing commitments
  ▪ Many components already in place for a future Spartan gas plant

State of Readiness:                                                                                    SemCams Wapiti
                                                                                                                                                                    CNRL Gold Creek
  ▪ Drill ready, multi-well pad development set to begin in 2021
                                                                                   Keyera Wapiti

                                                                                                                 Wapiti

                                                                                                      Spartan Montney WI Lands                      Acquisition Montney Wells               CNRL Gold Creek System
                                                                                                                                                    Montney Wells                           SemCams System
                                                                                                                                                    Acquisition Infrastructure              Keyera System
                  March 26, 2021                                              1)    See “Oil and Gas Advisories” in Disclaimers
                                                                                                                                                                                                                 14
                                                                              2)    Assumes 300m well spacing and scaling up of frac density
GOLD CREEK MONTNEY
       Oil-Weighted Development Across a Well Delineated Land Base
         ▪ Over 160m of net reservoir situated in the over-pressured (>10 kPa/m) oil prone
           fairway of the Alberta Montney
                                                                                                                                                             CITY OF GRANDE PRAIRIE
         ▪ De-risked future development with 21 horizontals drilled to date across land
           base
         ▪ Single layer Middle Montney development; potential for “wine-rack” style
           geometry currently being modelled with wells in both Middle and Lower Middle
           Montney
                                                                                                                                                                                                          Oil
         ▪ Evolution in completion design from 2013 to 2020 demonstrates significant
                                                                                                                                                                                                    (>400 bbls/MMcf)

           improvement in deliverability with implementation of tighter stage spacing and
           increased tonnage
         ▪ 2021 budget includes 3-4 net wells in TWP 69-05W6 targeting the Middle and                                                                                                                    8-36 HZ
           Lower Middle Montney; finalizing completion designs for summer program                                                                                      A

  A      100010307006W600                    100041906905W600                          100162606905W600           A’                                                                                            A’
         Gamma   NPHI   DPHI   RESD         Gamma   NPHI   DPHI   RESD                Gamma     NPHI   DPHI   RESD
TOP
MNTN

                                                                                                                                                Gas Condensate
                                                                                                                                                   (~50 bbls/MMcf)

                                                                         MIDDLE
                                                                         Montney

  D2
                                                                          Lower                                               Spartan Montney WI Lands                     SDE Montney Wells                           Pressure Gradient
                                                                         MIDDLE                                                                                            Industry Montney Wells
                                                                         Montney
                                                                                                                       ▪ 100/08-36-069-05W6 HZ drilled from 7-34 pad; on production Dec. 2019
 LWR
                                                                                                                         ▪ Cumulative oil to date >185 mbbls w/ peak monthly rate of 900 bbls/d
                                                                         LOWER
                                                                         Montney
                                                                                                                         ▪ 1.8-mile lateral, completed with 160 stage 50t/stage multi-stage frac;
BELLOY
                                                                                                                         ▪ Step change in results compared to offsets with 75 stages and lower tonnage

                           March 26, 2021
                                                                                   Middle Montney Landing Depth          ▪ Basis for development in 2021/22 program                                                                        15
SIMONETTE MONTNEY DEVELOPMENT
Acquisition of Simonette Asset Bolsters Second Core Development and Consolidation Area

Simonette Asset Characteristics
Undercapitalized, High-Quality Resource:                                                                                 Alliance Connection

  ▪ The Simonette asset represents a significant resource footprint within the
    Alberta Montney fairway with delineated and attractive development
    opportunities across liquids-rich, gas and oil prone horizons
                                                                                                                                                                           Keyera Simonette
  ▪ Primary target of Middle Montney; Lower Montney has also been
    identified as highly prospective
                                                                                              Kanata Simonette 13-11 Plant:
                                                                                              •    120mmscf/d capacity
  ▪ >214 net risked Middle Montney locations (1)                                              •    30mmscf/d throughput
                                                                                              •    50% WI

Land:
  ▪ >54,000 net acres of delineated Montney land
  ▪ Additional consolidation opportunities in the vicinity leveraging off
    infrastructure advantage

Infrastructure:
  ▪ 50% WI in a 120 mmcf/d natural gas plant allows for production growth
    >25,000 boe/d
  ▪ Sales optionality: dual connection to NOVA and Alliance

Low Decline Base Production:
  ▪ Stable base decline of
SIMONETTE MONTNEY
     Diverse Montney Opportunity Set Within a Large Underexploited Resource Base
         ▪ Over 100m net reservoir of Montney resource at predominantly higher than
           normal reservoir pressure (> 10 kPa/m)

         ▪ De-risked future development with 38 horizontals (34 gas to liquids-rich and four
           oil) drilled to date across 62,000 acres of Montney rights

                                                                                                                                                              4-34 HZ
         ▪ Analogue wells with lower landing depths in the Middle Montney demonstrate
           potential for higher liquids yields in both gas and liquids fairways

         ▪ Modern completion design with increased length and tonnage in combination
           with lower landing depth yield significant improvement in deliverability                                        9-18 PAD

                                                                                                                                                     Oil
         ▪ Additional opportunities identified in the Spirit River within the core of the asset                                                 (>100 bbls/MMcf)

     A   100111606127W500                    100133606127W500                         100012906126W500
                                                                                                                  A’                                                                          A’

TOP      Gamma   NPHI   DPHI   RESD         Gamma   NPHI   DPHI   RESD                Gamma      NPHI   DPHI   RESD                                                                    Gas
MNTN                                                                                                                                                                A             (
2021 GUIDANCE
Adjusted Funds Flow Sensitivities

 2021 Guidance (1)(2)                                                                       West-Central Alberta Deep Basin Assets Drive Robust Cash Generation:
                                                                                               ▪ 100% of natural gas production priced at AECO
 Average Production                boe/d         35,500 - 37,500                               ▪ West-Central Alberta Deep Basin sustaining capital (3) requirement:
    Crude Oil                       %                         4                                  26% reduction since acquisition in June 2020)
                                                                                               ▪ Free Funds Flow (3) will be applied to continued consolidation of
 Operating Netback (3)             $/boe                  12.74
                                                                                                 quality assets at attractive metrics
 Adjusted Funds Flow (3)           $MM                      139
                          (4)      $MM                      101
 Capital Expenditures
 Free Funds Flow (3)               $MM                       38
                                                                                              2021 Adjusted Funds Flow Sensitivity (1)(2)(3)
 Net Debt (Surplus) (3)            $MM                    (115)
                                                                                              WTI                            US$/bbl                         $50    $55     $60
                                                                                              Edm. Oil Diff                   US$/bbl                         $4     $4      $5
 2021 Capital Allocation            %                     Wells
                                                                                              Edm. Cond Diff                  US$/bbl                         $1     $1      $3
 West-Central Alberta Deep Basin   65%                       13                               Conway Propane                 US$/GAL                        $0.65   $0.70   $0.75
 Alberta Montney - Gold Creek      35%                        4
                                                                                              FX                                US/C                         1.27   1.26    1.25

                                                                                                                                $/GJ        $2.50           $123    $132    $141
                                                                                              AECO                              $/GJ        $2.75           $131    $139    $147
                                                                                                                                $/GJ        $3.00           $138    $146    $154

             March 26, 2021                                                                                                                                                         18
                                    1)     See “Forward Looking Statements” and “FOFI” in Disclaimers                                       4)      Excluding A&D
                                    2)     Based on midpoint production of 36,500 boe/d and Spartan Budget Price Deck as seen on slide 36
                                    3)     See “Non-GAAP Measures” in Disclaimers
SPARTAN SUSTAINABILITY
Environmental, Social & Governance
Canada is a world leader with respect to producing sustainable energy responsibly

Environment:
  ▪ Spartan is committed to industry leading environmental practices:
           ▪ Spartan has ~400 solar panels, with solar power generation at nearly every pad site within its core operating area
           ▪ Spartan has participated in or operated 36 wells and one facility abandonment since March 2020 and progressed
             towards reclamation certification on over 100 abandoned locations
           ▪ Achieved a 100% satisfactory rating with the AER in 2020 vs. industry average of 78%
           ▪ Spartan assets generated over 17,544 tCO2e credits in 2019 and a further 13,247 tCO2e credits in 2020 from:
                      ▪ High to low bleed instrumentation conversion

                      ▪ Converting fuel gas chemical pumps to solar driven

                      ▪ Fuel gas to instrument air conversion

                      ▪ Fuel gas instrumentation to solar powered instrumentation

Social:
  ▪ Spartan has implemented health and safety COVID-19 protocols into its operations
  ▪ Based on the WCB Industry 6300 for 2020, Spartan ranks 1 out of 256 employers in the Large Business Experience
    Rating (ER) program (1)

Governance:
  ▪ Spartan is significantly aligned with shareholders with 13% Insider Ownership (basic)
  ▪ Diversity – 30% Female in Management Positions & 42% Female Workforce

                                                                                                                                                          Spartan Delta wellsite solar power generation

                March 26, 2021                                                                                                                                                                            19
                                                                                                 1)   As per the Workers’ Compensation Board – Alberta Employer Report Card
INDIGENOUS PARTNERSHIPS
Committed to Sustainable and Responsible Resource Development

O’Chiese First Nation:
 ▪ Spartan has a partnership with the O’Chiese First Nation based on
   responsible development of oil & gas resources on the O’Chiese First
   Nation lands
         ▪ Spartan prioritizes First Nation owned and operated business
           with respect to its operations
         ▪ Spartan has created a soci-economic plan with the O’Chiese to
           create long-term social benefits for the First Nation

Leading Environmental Stewardship on First Nation lands:
 ▪ Spartan, together with the O’Chiese First Nation, have created an
   industry leading Abandonment & Reclamation Program to protect
   Indigenous lands for future generations
         ▪ The ARO program outlines and commits Spartan to timely
           abandonment & reclamation of all wells on the O’Chiese First
           Nation lands

 ▪ Spartan has also committed to working with both the Saddle Lake
   First Nation and Whitefish (Goodfish) Lake First Nation to abandon
   and reclaim wells on First Nation lands

            March 26, 2021                                                 20
MARKETING & RISK MANAGEMENT
High Torque to Strengthening AECO Fundamentals

Natural Gas Exposure – 100% AECO:
 ▪ Spartan is uniquely positioned with 100% exposure to AECO pricing,
   and no economic burden of transport to underperforming markets
 ▪ Natural gas production is hedged approximately 28% in 2021

Natural Gas Fundamentals continue to be positive:
 ▪ Natural gas power generation is the largest component of the North
   American power stack and will continue to grow as coal is phased out

            Current Operating Capacity by Technology

                                                     Coal
                                                     Wind
                                                     Solar
                                                     Other
                                                     Nuclear
                                                     Natural Gas
        Source: ARM Energy

 ▪ Alberta gas egress coupled with increasing Western Canadian
   Sedimentary Basin gas demand paints an attractive story for AECO
   versus other markets

             March 26, 2021                                               21
INVESTOR HIGHLIGHTS
Platform for Acquisitive Growth and Free Funds Flow Generation

     Experienced team with a record of efficient capital discipline and value creation through consolidation

        Material position in the Spirit River, Cardium and Montney, three of Canada’s most prolific plays

                         Two Core Areas – West-Central Alberta Deep Basin and Alberta Montney

                         Targeting internally funded organic growth and material free funds flow

                                  Balance Sheet strength to fund further consolidation

                     Modern company with a clean operating platform and minimal ARO overhang

               Owned infrastructure footprint provides opportunistic tuck-in consolidation potential

                Deep inventory of economic drilling on strip pricing – active drilling program in 2021

        March 26, 2021                                                                                         22
Appendix

March 26, 2021              23
WEST-CENTRAL ALBERTA DEEP BASIN
Asset Quality Drives Top Tier Capital Efficiencies and Sustainable Free Funds Flow
    ▪ Targeting liquids-rich Spirit River and liquids-rich gas and oil Cardium
    ▪ Favorable subsurface properties:
                                                                                                       Deep Basin
                                                                                                       Fairway
               ✓ Situated in the over-pressured deep basin fairway

               ✓ Considerably higher liquids yield than most Spirit River assets                                                                                Pembina

    ▪ Multiple stacked targets in the Spirit River provide significant
      resource development opportunities, including maximizing recoveries
      and surface pad synergies

    ▪ 10+ years of de-risked, highly economic Spirit River and Cardium                                                          Brazeau
      locations across >130,000 (1) net acres of land in West-Central Alberta

A                                                                                                 A’
      100132304410W500                    100030404509W500                  100013304309W500
     Gamma   NPHI   DPHI                 Gamma   NPHI   DPHI                Gamma   NPHI   DPHI                                                                            Alder Flats

                                                                                                                                                            A
                             Cardium                             Cardium                                                                    Ferrier

                                                                                                                                                                      A’
                                                                                                                                                                                                Willesden Green
                                                                                                                                                                           Baptiste

                              Falher A                           Falher A

                                                                 Falher B
                             Falher B

                              Wilrich
                                                               Wilrich

                                                                                                                            Spartan Lands     O’Chiese First Nation         Spirit River Well            Cardium Well

                    March 26, 2021                                                                                                                                                                                      24
                                                                                                  1)       As of December 31, 2020
ANALYST COVERAGE & CONTACT INFORMATION

Institution                       Analyst             EXECUTIVE OFFICE                         STOCK EXCHANGE LISTING

                                                      Spartan Delta Corp.                      The TSX Venture Exchange
ATB Capital Markets               Patrick O’Rourke                                             Trading Symbol: SDE.V
                                                      500, 207 – 9th Avenue SW
                                                      Calgary, Alberta T2P 1K3                 INVESTOR INFORMATION
BMO Capital Markets               Ray Kwan
                                                      P: 403 265 8011
                                                      W: www.spartandeltacorp.com              Visit our website
Cormark Securities                Garett Ursu
                                                                                               W: www.spartandeltacorp.com
                                                      TRANSFER AGENT                           or contact
Desjardins Capital Markets        Chris MacCulloch                                             Investor Relations
                                                      Odyssey Trust Inc.                       E: IR@spartandeltacorp.com
                                                      1230 – 300 - 5th Avenue SW
Eight Capital                     Phil Skolnick       Calgary, Alberta T2P 3C4                 CORPORATE CALENDAR
                                                      P: 587 885 0960
Haywood Capital Markets           Christopher Jones                                            May 14, 2021
                                                      AUDITORS                                 First Quarter 2021 Results
National Bank Financial           Dan Payne
                                                      PricewaterhouseCoopers LLP
                                                      Calgary, Alberta
Paradigm Capital                  Adam Gill
                                                      ENGINEERING CONSULTANTS
Peters & Co. Limited              Dan Grager
                                                      McDaniel & Associates Consultants Ltd.
                                                      Calgary, Alberta
Raymond James                     Jeremy McCrea
                                                      LEGAL COUNSEL
Scotia Capital                    Cameron Bean
                                                      Stikeman Elliott LLP
Stifel - FirstEnergy              Cody Kwong          Calgary, Alberta

TD Securities                     Aaron Bilkoski

                 March 26, 2021                                                                                             25
MANAGEMENT TEAM & BOARD OF DIRECTORS
 MANAGEMENT TEAM
       Richard McHardy
                                  ➢   Former President, CEO and co-founder of Spartan Energy, Spartan Oil and Spartan Exploration
  Executive Chairman & Director
        Fotis Kalantzis
                                  ➢   Former SVP and co-founder of Spartan Energy, Spartan Oil and Spartan Exploration
    President, CEO & Director
         Geri Greenall
                                  ➢   Former CFO and co-founder, Camber Capital Corp., former Portfolio Manager & Chief Compliance Officer, Canoe Financial
              CFO
        Thanos Natras
                                  ➢   Former Geoscience Manager, Spartan Energy, former VP Exploration, Arcan Resources
         VP Exploration
         Craig Martin
                                  ➢   Former Manager D&C, Spartan Energy and Spartan Oil
         VP Operations
          Randy Berg
                                  ➢   Former VP Land, Spartan Energy, former VP Business Development & Land, Renegade Petroleum
            VP Land
        Mark Hodgson
                                  ➢   Former VP Operations, Obsidian Energy, former VP New Ventures & Country Manager, Bankers Petroleum
   VP Corporate Development
        Brendan Paton
                                  ➢   Director, Canoe Point Energy, former Production Engineer, Shell Canada
         VP Engineering
         Ashley Hohm
                                  ➢   Former VP Finance, Kelt Exploration, former Manager Financial Reporting, Celtic Exploration
     VP Finance & Controller

 INDEPENDENT BOARD OF DIRECTORS
                                  ➢   Former Director of Spartan Energy, Spartan Oil, and Spartan Exploration  former President, Cypress Energy; Chairman &
      Donald Archibald
                                      CEO, Cequel Energy; President & CEO, Cyries Energy
                                  ➢   Former Director of Spartan Energy, Spartan Oil and Spartan Exploration  former Chairman, President & CEO, Big Horn
       Reg Greenslade
                                      Resources, Enterra Energy, Enterra Energy Trust, JED Oil; President & CEO, Tuscany International Drilling
                                  ➢   Founder and a principal of KO Capital Advisors  former Vice Chairman & Co-Head Energy Investment Banking, GMP
       Kevin Overstrom
                                      FirstEnergy
                                  ➢   Former SVP, Corporate and Business Development, Crescent Point Energy  Director of Southern Energy Corp., and Equinor
     Tamara MacDonald
                                      Canada
                                  ➢   Former Chairman & CEO, New Age (African Global Energy) Ltd.  former Executive Director & Officer, Marathon Oil and
        Steve Lowden
                                      Premier Oil

     Elliot S. Weissbluth         ➢   Former Chairman, Hightower Inc.  former Founder, Director & President, U.S. Fiduciary

           March 26, 2021                                                                                                                                      26
SPARTAN ENERGY – SPARTAN OIL – SPARTAN EXPLORATION
Western Canada’s Best-in-Class Performer: Proven Low-Cost Operator

 ▪ From 2010 through 2018, Spartan assembled and developed
   multiple high-quality assets throughout Central & Southern
   Alberta and Southeast Saskatchewan

 ▪ Through infill horizontal development drilling and its
   application of multi-stage frac technology, Spartan unlocked
   significant resource potential in both light and tight oil plays

 ▪ Developed a deep inventory of highly economic light oil drilling
   locations and waterflood projects capable of delivering
   sustainable growth and free cash flow

 ▪ Focused capital on high quality, long life, operated, multi-zone
   potential with existing infrastructure and capacity

 ▪ Spartan Exploration: grew production from ~400 boe/d to
   ~2,500 boe/d and sold to Penn West, outperforming the TSX
   Energy Index by ~90%

 ▪ Spartan Oil: sold to Bonterra for ~$480 million in 2013 after
   growing production to >4,000 boe/d

 ▪ Spartan Energy: sold to Vermilion Energy for C$1.4 billion in
   2018 at a production level of 23,000 boe/d and independently
   evaluated P+P reserves of 113.5 MMBoe

            March 26, 2021                                            27
THE SPARTAN DOMESTIC ADVANTAGE
Domestic Operational Track Record

From 2014 to its sale to Vermilion Energy, Spartan Energy                            Management’s ability to acquire and efficiently integrate assets
established itself as the lowest cost operator in the Southeast                      has been proven through past transaction activity
Saskatchewan area

 ▪ Average DCET costs for Mississippian wells below area peers at                      ▪ Management steadily reduced operating costs following two
   $750k                                                                                 separate “acquisition cycles”

 ▪ Strong relationships with key service providers are intact and                      ▪ Spartan Energy completed 11 transactions (asset and corporate) in
   ensure efficiencies through preferential rates and pre-existing                       just under a four-year time frame, more than any other
   personnel                                                                             corporation in the basin

                 Mississippian DCET Capex ($000’s)                                            Spartan Energy - Operating Costs ($/boe)

$1,200                                                                               $22.00
                                                                          $1,000                                                         Acquisition OPEX
$1,000                                   $900                    $920                $20.00

 $800            $750                                                                $18.00

 $600                                                                                $16.00

 $400                                                                                $14.00

 $200                                                                                $12.00

   $0                                                                                $10.00
          Spartan Energy             Company 1               Company 2   Company 3            Q2 Q3 Q4 Q1 Q2 Q3 Q4 Q1 Q2 Q3 Q4 Q1 Q2 Q3 Q4 Q1

         (1) Peer group includes Vermilion, TORC, and Crescent Point                            2014         2015           2016            2017      2018

                 March 26, 2021                                                                                                                         28
SPARTAN ENERGY
263% Total Return and 33% CAGR | December 2013 – May 2018

                                                              Overview                                                                                                          Relative Performance (Indexed to 100)
                                                                                                                                                 300
               ▪ Spartan Energy completed the recapitalization of Alexander Energy                                                                                                   Spartan
                 in December 2013 and shortly after acquired Renegade Petroleum                                                                                                      TSX Energy                                     Post-recapitalization,
                 in March 2014                                                                                                                   250                                                                                 Spartan consistently
                                                                                                                                                                                                                                    outperformed the TSX
                                                                                                                                                                                                                                        Energy Index
               ▪ Over a 4-year period, management grew production from ~650                                                                      200
                 boe/d to ~22,750 boe/d through an acquisition and development
                 strategy
                                                                                                                                                 150

               ▪ During a period of significant uncertainty in the energy markets,
                                                                                                                                                 100
                 management stewarded capital efficiently and delivered above
                 market shareholder returns
                                                                                                                                                       50
                                                                                                                                                        Dec-13              Jun-14      Dec-14    Jun-15     Dec-15     Jun-16     Dec-16     Jun-17    Dec-17

                                                     Production Growth                                                                                                                             Cash Flow Growth

                     25,000                                                                                       150.0                                            $60.0                                                                                            $0.60

                                                                                                                                                                                                                                                                            Cash Flow Per Share ($/mmsh.)
                     20,000                                                                                       120.0
                                                                                                                          Production Per Share
Production (boe/d)

                                                                                                                                                 Cash Flow ($mm)   $40.0                                                                                            $0.40
                                                                                                                             (boe/d/mmsh.)

                     15,000                                                                                       90.0

                     10,000                                                                                       60.0
                                                                                                                                                                   $20.0                                                                                            $0.20

                      5,000                                                                                       30.0

                         0                                                                                        0.0                                               $0.0                                                                                            $0.00
                              Q2   Q3     Q4   Q1   Q2   Q3   Q4   Q1   Q2   Q3   Q4   Q1   Q2   Q3   Q4   Q1                                                              Q2   Q3     Q4   Q1    Q2   Q3   Q4     Q1   Q2   Q3   Q4    Q1    Q2   Q3   Q4   Q1

                                   2014              2015                2016                2017          2018                                                                 2014               2015                  2016                  2017          2018

                                                                                                                                                                                                       Cash Flow        Cash Flow per Share
                                                    Total Production         Production per Share

                                    March 26, 2021                                                                                                                                                                                                                                   29
HISTORICAL EV/DACF MULTIPLE COMPARISON
           Spartan Energy Corp. vs Premium Light Oil Peers (1)

                               16.0x
                                                      Spartan Energy Corp.

                                                      Light Oil Peer Avg.        (2)

                               14.0x                                                                                                              The Spartan management team has
                                                                                                                                             historically traded at, or above, the premium
                                                                                                                                                 light oil company average multiple (1)

                               12.0x
Fwd EV/NTM DACF Multiple (x)

                               10.0x

                                8.0x

                                6.0x
                                                                                                                                                                                                                      Light Oil Peer Avg.

                                4.0x

                                2.0x

                                       Source: Factset Consensus Estimates (-)

                                              March 26, 2021                                                                                                                                                                    30
                                                                                       1)   Light Oil Peer Avg. includes: CPG, ERF, RRX, SGY, TOG, TVE, WCP
                                                                                       2)   Comparable EV/NTM DACF period subject to Factset broker estimate availability (May 9, 2014 to the close of the acquisition of
                                                                                            Spartan Energy Corp. by Vermilion Energy Inc. on May 28, 2018)
SPARTAN OIL
268% Total Return and 128% CAGR | June 2011 – January 2013

                                                        Overview                                                                                      Relative Performance (Indexed to 100)
                                                                                                                            250
               ▪ Formed through the spin-out of certain Cardium assets and SE                                                                              Spartan
                                                                                                                                                                                            As a public company, Spartan
                 Saskatchewan assets from Spartan Exploration                                                                                              TSX Energy                       outperformed the TSX Energy
                                                                                                                                                                                                   Index by ~130%
                                                                                                                            200
               ▪ Spartan continued to consolidate its position in the Pembina
                 Cardium, where it successfully built a large contiguous land
                 position and drilled 80 gross wells with 100% success rate
                                                                                                                            150

               ▪ In less than two years, Spartan Oil grew production per share
                 >500% and cash flow per share >1,000%
                                                                                                                            100

               ▪ Announced its sale to Bonterra in December 2012 at top decile
                 metrics
                                                                                                                                50
                                                                                                                                 Jun-11               Sep-11              Dec-11        Mar-12        Jun-12          Sep-12   Dec-12

                                              Production Growth                                                                                                              Cash Flow Growth

                     5,000                                                                    60.0                                            $25.0                                                                                     $0.30

                                                                                                                                                                                                                                                Cash Flow Per Share ($/mmsh.)
                     4,000                                                                    48.0                                            $20.0                                                                                     $0.24
                                                                                                     Production Per Share
Production (boe/d)

                                                                                                                            Cash Flow ($mm)
                                                                                                       (boe/d/mmsh.)

                     3,000                                                                    36.0                                            $15.0                                                                                     $0.18

                     2,000                                                                    24.0                                            $10.0                                                                                     $0.12

                     1,000                                                                    12.0                                             $5.0                                                                                     $0.06

                        0                                                                     0.0                                              $0.0                                                                                     $0.00
                             Q2         Q3         Q4       Q1          Q2          Q3   Q4                                                           Q2             Q3            Q4        Q1          Q2             Q3     Q4
                                       2011                                  2012                                                                                    2011                                      2012

                                               Production        Production per Share                                                                                         Cash Flow           Cash Flow per Share

                                  March 26, 2021                                                                                                                                                                                                                       31
SPARTAN EXPLORATION
            573% Total Return and 80% CAGR | January 2010 – May 2011

                                                   Overview                                                                                            Relative Performance (Indexed to 100)
                                                                                                                                            250
                     ▪ Spartan Exploration was formed in Q1-2008 with a view of                                                                             Spartan
                       targeting tight oil resources plays in western Canada
                                                                                                                                                            TSX Energy              As a public company,
                                                                                                                                                                                  Spartan outperformed the
                                                                                                                                            200                                   TSX Energy Index by ~90%
                     ▪ Spartan accumulated Cardium, Bakken and Shaunavon assets
                       throughout 2008 and 2010 followed by a reverse takeover (RTO)
                       recap transaction of a TSX listed shell company
                                                                                                                                            150

                     ▪ From the RTO transaction in Q1-2010 to its sale in Q1-2011,
                       Spartan grew production from ~400 boe/d to ~2,500 boe/d                                                              100
                       delivering production per share growth of >425% and cash flow per
                       share growth of >650%
                                                                                                                                             50
                                                                                                                                              Jan-10        Apr-10            Jul-10          Oct-10           Jan-11      Apr-11

                                           Production Growth                                                                                                              Cash Flow Growth

                     3,000                                                                  90.0                                            $14.0                                                                                   $0.35

                                                                                                                                                                                                                                            Cash Flow Per Share ($/mmsh.)
                     2,500                                                                  75.0                                            $12.0                                                                                   $0.30
                                                                                                   Production Per Share
Production (boe/d)

                                                                                                                          Cash Flow ($mm)
                                                                                                                                            $10.0                                                                                   $0.25
                                                                                                      (boe/d/mmsh.)

                     2,000                                                                  60.0
                                                                                                                                             $8.0                                                                                   $0.20
                     1,500                                                                  45.0
                                                                                                                                             $6.0                                                                                   $0.15
                     1,000                                                                  30.0
                                                                                                                                             $4.0                                                                                   $0.10
                      500                                                                   15.0                                             $2.0                                                                                   $0.05

                        0                                                                   0.0                                              $0.0                                                                                   $0.00
                              Q1          Q2             Q3              Q4          Q1                                                                Q1                Q2              Q3               Q4            Q1
                                                 2010                                2011                                                                                        2010                                   2011

                                            Production        Production per Share                                                                                        Cash Flow           Cash Flow per Share

                               March 26, 2021                                                                                                                                                                                               32
DISCLAIMER
Forward Looking Statements                                                                                         effect on Spartan. While the precise impact of the COVID-19 virus on Spartan remains unknown,
▪   Certain information included in this presentation constitutes forward-looking information under                rapid spread of the COVID-19 virus may have a material adverse effect on global economic
    applicable securities legislation. Forward looking information typically contains statements with              activity, and can result in volatility and disruption to global supply chains, operations, mobility of
    words such as "anticipate", "believe", "expect", "plan", "intend", "estimate", "propose", "project" or         people and the financial markets, which could affect interest rates, credit ratings, credit risk,
    similar words suggesting future outcomes or statements regarding an outlook. Forward-looking                   inflation, business, financial conditions, results of operations and other factors relevant to
    information in this presentation may include, but is not limited to, statements about: corporate               Spartan. Please refer to the Spartan's most recent Annual Information Form and MD&A for
    strategy, objectives, strengths and focus of Spartan; the intentions of management and Spartan                 additional risk factors relating to Spartan, which can be accessed either on Spartan's website at
    with respect to its growth strategy and business plan; Spartan's expectations regarding its                    www.spartandeltacorp.com or under the Company's profile on www.sedar.com. Readers are
    2020/2021 drilling program, including the location of wells, scheduled drilling dates and the timing           cautioned not to place undue reliance on this forward-looking information, which is given as of the
    of expected pay out from such wells; Spartan's intentions to maintain balance sheet flexibility to             date hereof, and to not use such forward-looking information for anything other than its intended
    allow Spartan to take advantage of future opportunities; Spartan's acquisition and consolidation               purpose. Spartan undertakes no obligation to update publicly or revise any forward-looking
    strategy and targets; Spartan plans to deliver strong operational performance and reduce debt;                 information, whether as a result of new information, future events or otherwise, except as
    Spartan's production forecasts; Spartan 2021 guidance and budget, including anticipated capital                required by law.
    expenditures and Spartan's ability to fund capital expenditures through operating activities;              ▪   The forward-looking information contained in this presentation is made as of the date hereof and
    Spartan's cost-cutting measures and the results thereof; Spartan's ESG initiative; predictions                 Spartan undertakes no obligation to update publicly or revise any forward-looking information,
    regarding commodities pricing and industry fundamentals, including natural gas demand and                      whether as a result of new information, future events or otherwise, unless required by applicable
    supply; the continuation of Spartan's strategic partnerships, and expected benefits therefrom.                 securities laws. The forward looking information contained in this presentation is expressly
    Statements relating to "reserves" are also deemed to be forward looking statements, as they                    qualified by this cautionary statement.
    involve the implied assessment, based on certain estimates and assumptions, that the reserves
    described exist in the quantities predicted or estimated and that the reserves can be profitably           ▪   FOFI. This presentation contains future-oriented financial information and financial outlook
    produced in the future.                                                                                        information (collectively, "FOFI") about Spartan's prospective results of operations, production,
                                                                                                                   working capital, capital efficiency, sustaining capital, capital expenditures, enterprise value,
▪   The forward-looking statements contained in this presentation are based on certain key                         recycle ratio, payout, operating netback, share price, investment yield, net debt (surplus),
    expectations and assumptions made by Spartan, including expectations and assumptions                           adjusted free funds flow, free funds flow, NPV10, NOI, IRR, return of capital, operating costs,
    concerning the performance of Spartan's management team and board, the success of future                       cost reductions and components thereof, all of which are subject to the same assumptions, risk
    drilling, development and completion activities, the performance of existing wells, the                        factors, limitations and qualifications as set forth in the above paragraphs. FOFI contained in this
    performance of new wells, the availability and performance of facilities and pipelines, the                    presentation was approved by management of the date of this presentation and was provided for
    geological characteristics of Spartan's properties, the successful application of drilling, completion         the purpose of providing further information about Spartan's anticipated future business
    and seismic technology, prevailing weather and break-up conditions and access to drilling                      operations. Spartan disclaims any intention or obligation to update or revise any FOFI contained
    locations, commodity prices, price volatility, price differentials and the actual prices received for          in this presentation, whether as a result of new information, future events or otherwise, unless
    products, royalty regimes and exchange rates, the application of regulatory and licensing                      required pursuant to applicable law. Readers are cautioned that the FOFI contained in this
    requirements, the availability of capital, labour and services, Spartan's ability to complete planned          presentation should not be used for purposes other than for which it is disclosed herein.
    capital expenditures within budgeted cost estimates, the ability to market oil and gas successfully,
    Spartan's ability to integrate assets and employees acquired through acquisitions and the                  ▪   Third Party Information. Certain information contained herein has been obtained from published
    creditworthiness of industry partners.                                                                         sources prepared by independent industry analysts and third-party sources (including industry
                                                                                                                   publications, surveys and forecasts). While such information is believed to be reliable for the
▪   Although Spartan believes that the expectations and assumptions on which the forward-looking                   purpose used herein, none of the directors, officers, owners, managers, partners, consultants,
    statements are based are reasonable, undue reliance should not be placed on the forward-                       shareholders, employees, affiliates or representatives assumes any responsibility for the
    looking statements because Spartan can give no assurance that they will prove to be correct.                   accuracy of such information. Some of the sources cited in this presentation have not consented
    Since forward-looking statements address future events and conditions, by their very nature they               to the inclusion of any data from their reports, nor has Spartan sought their consent.
    involve inherent risks and uncertainties. Actual results could differ materially from those currently
    anticipated due to a number of factors and risks. These include, but are not limited to, stock
    market volatility, risks associated with the oil and gas industry in general (e.g., operational risks in
    development, exploration and production; the uncertainty of reserve estimates; the uncertainty of
    estimates and projections relating to production, costs and expenses and health, safety and
    environmental risks), incorrect assessment of the value of acquisitions, failure to complete or
    realize the benefits of acquisitions, constraint in the availability of services, commodity price and
    exchange rate fluctuations, actions of OPEC and OPEC+ members, changes in legislation
    (including but not limited to tax laws, royalty regimes and environmental legislation), adverse
    weather or break-up conditions and uncertainties resulting from potential delays or changes in
    plans with respect to exploration or development projects or capital expenditures. Production
    forecasts are directly impacted by commodity prices and the actual timing of our capital
    expenditures. Actual results may vary materially from forecasts due to changes in interest rates,
    oil differentials, exchange rates and the timing of expenditures and production additions. In
    addition, Spartan cautions that current global uncertainty with respect to the spread of the
    COVID-19 virus and its effect on the broader global economy may have a significant negative

                  March 26, 2021                                                                                                                                                                                      33
DISCLAIMER CONT’D
Oil and Gas Advisories
▪    BOE Disclosure. The term barrels of oil equivalent ("boe") may be misleading, particularly if used     ▪   "Undeveloped F&D costs" are calculated as the sum of development capital, divided by the
     in isolation. A BOE conversion ratio of six thousand cubic feet of natural gas to barrels of oil           undeveloped reserves at the proved undeveloped and proved plus probable undeveloped levels.
     equivalence is based on an energy equivalency conversion method primarily applicable at the            ▪   "Operating netback" see "Reader Advisories – Non-GAAP Measures".
     burner tip and does not represent a value equivalency at the wellhead. All BOE conversions in
     this presentation are derived from converting gas to oil in the ratio mix of six thousand cubic feet   ▪   "Recycle ratio" is measured by dividing operating netback by F&D cost per boe for the year.
     of gas to one barrel of oil.                                                                           ▪   "Payout" is achieved when revenues, less royalties, production and transportation costs are
▪    Product Types. Throughout this presentation, "crude oil" or "oil" refers to light and medium crude         equal to the total capital costs associated with drilling, completing, equipping and tying in a well.
     oil product types as defined by NI 51-101. Condensate is a natural gas liquid as defined by                Management considers payout an important measure to evaluate its operational performance and
     National Instrument 51-101 – Standards of Disclosure for Oil and Gas Activities ("NI 51-101").             capital allocation processes. It demonstrates the return of cash flow and allows Spartan to
     References to "natural gas liquids" or "NGLs" throughout this presentation comprise pentane,               understand how a capital program is funded under different operating scenarios, which helps
     butane, propane, and ethane, being all NGLs as defined by NI 51-101 other than condensate,                 assess Spartan's ability to generate value.
     which is disclosed separately because the value equivalency of condensate is more closely              ▪   "Finding and development (F&D) cost" is the sum of capital expenditures incurred in the period
     aligned with crude oil. References to "natural gas" or "gas" relates to conventional natural gas.          and the change in future development capital ("FDC") required to develop reserves. F&D cost per
▪    Reserves Disclosure. All reserves information in this presentation was prepared by McDaniel &              BOE is determined by dividing current period net reserve additions into the corresponding
     Associates Consultants Ltd. ("McDaniel") effective December 31, 2020 (the "McDaniel Report")               period's F&D cost. Readers are cautioned that the aggregate of capital expenditures incurred in
     using average forecast pricing of McDaniel, GLJ Ltd. ("GLJ") and Sproule Associates Limited                the year, comprised of exploration and development costs and acquisition costs, and the change
     ("Sproule") in accordance with NI 51-101 and the Canadian Oil and Gas Evaluation Handbook                  in estimated FDC generally will not reflect total FD&A costs related to reserves additions in the
     (the "COGE Handbook"). Reserves information in relation to the Acquisitions was prepared by:               year.
     (a) Sproule effective December 31, 2019, regarding the Inception assets; and (b) GLJ effective         ▪   "IP30" is the initial production from a well for the first 720 hours (30 days) based on
     October 1, 2020, regarding the Simonette assets, in accordance with NI 51-101 and the COGE                 operating/producing hours.
     Handbook. The estimates of reserves in this presentation do not include reserves attributed to the
     newly acquired Willesden Green assets. The estimates of reserves and future net revenue for the        ▪   "IP60" is the initial production from a well for the first 1,440 hours (60 days) based on
     assets to be acquired pursuant to the Acquisitions may not reflect the same confidence level as            operating/producing hours.
     estimates of reserves and future net revenue for all of Spartan's properties, due to the effects of    ▪   "NPV10" is the anticipated net present value of the future net operating income after capital
     aggregation. While the above referenced reserves reports use different forecasted pricing and              expenditures, discounted at a rate of 10% (before tax).
     cost assumptions as of their respective effective dates, Spartan has performed sensitivity             ▪   Type Curves. The reservoir engineering and statistical analysis methods utilized is broad and can
     analysis on such assumptions and has determined that variances in reserves values due to the               include various methods of technical decline analyses, and reservoir simulation all of which are
     different effective dates do not lead to materially misleading results when reserves are disclosed         generally prescribed and accepted by the COGE Handbook and widely accepted reservoir
     on a pro-forma basis. Given the foregoing, management believes that pro-forma estimates of                 engineering practices. These type curves were generated by McDaniel, an independent qualified
     reserves disclosed herein are not misleading with respect to assumptions, input data and the               reserves evaluator. These type curves incorporate the most recent data from actual well results
     professional judgment of the qualified reserves evaluators. All reserve references in this                 and would only be representative of the specific drilled locations. There is no guarantee that
     presentation are "Company share reserves". Company share reserves are the applicable                       Spartan will achieve the estimated or similar results derived therefrom.
     company's total working interest reserves before the deduction of any royalties and including any
     royalty interests payable to the company. It should not be assumed that the present worth of           ▪   Drilling Locations / Inventory. This presentation discloses drilling inventory in three categories: (i)
     estimated future amounts presented in the tables above represents the fair market value of the             proved locations; (ii) probable locations; and (iii) unbooked locations. Proved locations and
     reserves. There is no assurance that the forecast prices and costs assumptions will be attained,           probable locations are derived from the McDaniel Report and account for drilling locations that
     and variances could be material. The recovery and reserve estimates of the crude oil, natural gas          have associated proved and/or probable reserves, as applicable. Unbooked locations are internal
     liquids and natural gas reserves provided herein are estimates only and there is no guarantee              estimates based on our prospective acreage and an assumption as to the number of wells that
     that the estimated reserves will be recovered. Actual crude oil, natural gas and natural gas liquids       can be drilled per section based on industry practice and internal review. Unbooked locations do
     reserves may be greater than or less than the estimates provided herein. All evaluations and               not have attributed reserves or resources. Of the 864 (590 net) total drilling locations identified
     summaries of future net revenue are stated prior to the provision for interest, debt service               herein, 75 (63 net) are proved locations, 43 (38 net) are probable locations and 746 (489 net) are
     charges or general and administrative expenses and after deduction of royalties, operating costs,          unbooked locations. Of the 118 (101 net) FDC drilling locations identified herein, 75 (63 net) are
     estimated well abandonment and reclamation costs and estimate future capital expenditures.                 proved locations, and 43 (38 net) are probable locations. Unbooked locations have been
                                                                                                                identified by management as an estimation of our multi-year drilling activities based on evaluation
▪    Oil and Gas Metrics. This presentation contains metrics commonly used in the oil and natural gas           of applicable geologic, seismic, engineering, production and reserves information. There is no
     industry which have been prepared by management, such as "development capital", "F&D costs",               certainty that we will drill all unbooked drilling locations and if drilled there is no certainty that such
     "operating netback", "recycle ratio", "payout", "F&D costs", "IP90" and "NPV10". These terms do            locations will result in additional oil and gas reserves, resources or production. The drilling
     not have a standardized meaning and may not be comparable to similar measures presented by                 locations on which we drill wells will ultimately depend upon the availability of capital, regulatory
     other companies, and therefore should not be used to make such comparisons. Management                     approvals, seasonal restrictions, oil and natural gas prices, costs, actual drilling results, additional
     uses these oil and gas metrics for its own performance measurements and to provide                         reservoir information that is obtained and other factors. While certain of the unbooked drilling
     shareholders with measures to compare our operations over time. Readers are cautioned that the             locations have been de-risked by drilling existing wells in relative close proximity to such
     information provided by these metrics, or that can be derived from the metrics presented in this           unbooked drilling locations, other unbooked drilling locations are farther away from existing wells
     presentation, should not be relied upon for investment or other purposes.                                  where management has less information about the characteristics of the reservoir and therefore
▪    "Development capital" means the aggregate exploration and development costs incurred in the                there is more uncertainty whether wells will be drilled in such locations and if drilled there is more
     financial year on reserves that are categorized as development. Development capital excludes               uncertainty that such wells will result in additional oil and gas reserves, resources or production.
     capitalized administration costs.

                  March 26, 2021                                                                                                                                                                                        34
You can also read