TD Securities Mining Conference - January 27-29, 2021 TSX: IMG l NYSE: IAG
←
→
Page content transcription
If your browser does not render page correctly, please read the page content below
TD Securities Mining Conference
January 27-29, 2021               TSX: IMG l NYSE: IAG
Cautionary Statement
All information included in this presentation whether in narrative or chart form, including any information as to the Company’s future financial or operating performance, and other statements that express management’s expectations or estimates of future performance, other than statements
of historical fact, constitute forward-looking information or forward-looking statements and are based on expectations, estimates and projections as of the date of this presentation. Forward-looking statements contained in this presentation include, without limitation, statements with respect
to: the Company’s guidance for production, cash costs, total cash costs, all-in sustaining costs or AISC, depreciation expense, effective tax rate, and operating margin, capital expenditures, operations outlook, cost management initiatives, development and expansion projects, exploration,
the future price of gold, the prospects in respect of the Company’s projects, the estimation of mineral reserves and mineral resources, the grade of the mineral reserves and mineral resources, the realization of mineral reserve and mineral resource estimates, the timing and amount of
estimated future production, costs of production, estimated amount of throughput, grade, estimated average life of mine strip ratio, recovery rates, recovered gold, gold production, production schedule, timeline, project timeline, labour ramp-up, various other economic analysis in respect of
production, estimated net present value of the project, estimated internal rate of return on production, life of the mine or mine life, reserves, permitting timelines, currency fluctuations, initial capital, sustaining capital, gold price assumption, requirements for additional capital, estimated labour
requirements, fluctuations in cash reserves, estimated wage forecast and job creation, generation of economic activity, estimates with respect to key project metrics, government regulation of mining operations, environmental risks, unanticipated reclamation expenses, title disputes or claims
and limitations on insurance coverage, as well as Project metrics and estimations of value including “net present value”, “NPV”, “internal rate of return”, “IRR” and “payback”. Forward-looking statements are provided for the purpose of providing information about management’s current
expectations and plans relating to the future. Forward-looking statements are generally identifiable by, but are not limited to, the use of the words “may”, “will”, “should”, “continue”, “expect”, "budget", "forecast", “planned”, “anticipate”, “estimate”, “believe”, “prospective”, “significant”,
“significant potential”, “substantial”, transformative”, “transformational”, “rare”, “valuable”, “world class”, “top-tier”, “contributes to lower all-in sustaining costs, “increases production profile”, “delivers robust economics supported by an attractive 2nd quartile aisc profile”, “strong free cash flow
forecast from existing operations”, “intend”, “plan”, "schedule", “spend", "guidance”, “outlook”, “catalyst”, “potential”, “seek”, “targets”, “strategy”, "superior“, or “project” or the negative of these words or other variations on these words or comparable terminology, with such forward-looking
statements found throughout this presentation including, without limitation slides entitled “Key Project Notes”. Forward-looking statements are necessarily based upon a number of estimates and assumptions, including material assumptions considered reasonable by the Company as at the
date of this presentation in light of Management’s experience and perception of current conditions and expected developments, that, while considered reasonable by management, are inherently subject to significant business, economic and competitive uncertainties and contingencies. Many
of these uncertainties and contingencies can affect the Company’s actual results and could cause actual results to differ materially from those expressed or implied in any forward-looking statements made by, or on behalf of, the Company. Readers are cautioned that forward-looking
statements are not guarantees of future performance and undue reliance must not be placed upon forward-looking statements. The Company cautions the reader that reliance on such forward-looking statements involve risks, uncertainties and other factors that may cause the actual
financial results, performance or achievements of IAMGOLD to be materially different from the Company’s estimated future results, performance or achievements expressed or implied by those forward-looking statements, and the forward-looking statements are not guarantees of future
performance. These risks, uncertainties and other factors include, but are not limited to, changes in the global prices for gold, copper, silver or certain other commodities (such as diesel and electricity); changes in the U.S. dollar and other currency exchange rates, interest rates or gold lease
rates; risks arising from holding derivative instruments; the level of liquidity and capital resources; access to capital markets, and financing; mining tax regimes; ability to successfully integrate acquired assets; legislative, political or economic developments in the jurisdictions in which the
Company carries on business; operating or technical difficulties in connection with mining or development activities including geotechnical difficulties and seismicity; laws and regulations governing the protection of the environment; employee relations; availability and increasing costs
associated with mining inputs and labour; negotiations with respect to new, reasonable collective labour agreements may not be successful which could lead to a strike or work stoppage in the future, and any such strike or work stoppage could have a material adverse effect on the
Company's earnings and financial condition; risks and uncertainties in relation to the COVID-19 pandemic, the speculative nature of exploration and development, including the risks of diminishing quantities or grades of reserves; adverse changes in the Company’s credit rating; contests
over title to properties, particularly title to undeveloped properties; the ability to deliver gold as required under forward gold sale arrangements; the rights of counterparties to terminate forward gold sale arrangements in certain circumstances, the inability to participate in any gold price
increase above the cap in any collar transaction entered into in conjunction with a forward gold sale arrangement, such as the collar entered into in conjunction with the gold sold forward in January of 2019; and the risks involved in the exploration, development and mining business, including
among other things, without limitation, failure to meet expected, estimated or planned gold production, unexpected increases in all-in sustaining costs, unexpected increases in capital expenditures and exploration expenditures, failures of pit walls, failures of tailings dams, variation in the
mineral content within the material identified as Mineral Resources and Mineral Reserves from that predicted, changes in development, construction schedule or mining plans due to changes in logistical, technical or other factors including, but not limited to, throughput, recovery rates, grade
reconciliation, strip ratio, the possibility that future exploration results will not be consistent with the Company's expectations and other risks disclosed in IAMGOLD’s most recent Form 40-F/Annual Information Form (“AIF”) on file with the United States Securities and Exchange Commission
and Canadian securities regulatory authorities. The Company is also subject to litigation and legal and political risks. With respect to development projects, IAMGOLD’s ability to sustain or increase its present levels of gold production is dependent in part on the success of its projects. Risks
and unknowns inherent in all projects include the inaccuracy of estimated reserves and resources, metallurgical recoveries, capital and operating costs of such projects, and the future prices for the relevant minerals. Development projects have no operating history upon which to base
estimates of future cash flows. The capital expenditures and time required to develop new mines or other projects are considerable, and changes in costs or construction schedules can affect project economics. Actual costs and economic returns may differ materially from IAMGOLD’s
estimates or IAMGOLD could fail to obtain the governmental approvals necessary for the operation of a project; in either case, the project may not proceed, either on its original timing or at all.
This presentation includes certain non-International Financial Reporting Standards (“IFRS”) measures such as life of mine total cash costs and life of mine average AISC. These measures are not defined under IFRS and should not be considered in isolation. The Company believes that
these measures, together with other measures determined in accordance with IFRS, provide investors with an improved ability to evaluate the project. The inclusion of these measures is meant to provide additional information and should not be used as a substitute for performance
measures prepared in accordance with IFRS. These measures are not necessarily standard and therefore may not be comparable to other issuers. For a reconciliation of these measures to the most directly comparable financial information reported in the consolidated financial statements
prepared in accordance with IFRS and for an explanation of how management uses these measures, see "Non-GAAP Performance Measures" in the MD&A filed on SEDAR at www.sedar.com.
For a more comprehensive discussion of the risks faced by the Company, and which may cause the actual financial results, performance or achievements of IAMGOLD to be materially different from the company’s estimated future results, performance or achievements expressed or implied
by forward-looking information or forward-looking statements, please refer to the Company’s latest AIF, filed with Canadian securities regulatory authorities at www.sedar.com, and filed under Form 40-F with the United States Securities Exchange Commission at www.sec.gov/edgar.shtml.
The risks described in the AIF (filed and viewable on www.sedar.com and www.sec.gov/edgar.shtml, and available upon request from the Company) are hereby incorporated by reference into this presentation.
Any forward-looking statement speaks only as of the date on which it is made and, except as may be required by applicable securities laws, the Company disclaims any intention or obligation to update or revise any forward-looking statements whether as a result of new information, future
events or otherwise.
All amounts in this presentation are expressed in U.S. dollars except as otherwise noted.

                                                                                                                                                                                                                                                                                                                2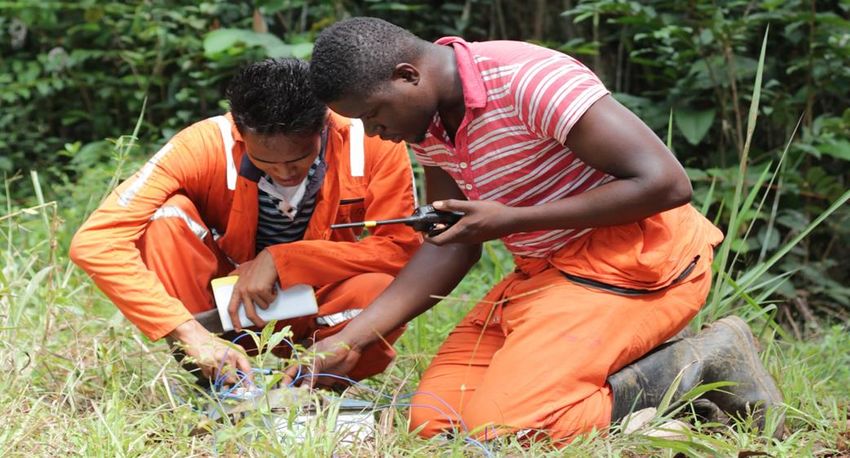
Technical Information and Qualified Persons
The Mineral Resource and Reserve Estimates contained in this presentation have been prepared in accordance with National Instrument 43-101 Standards of Disclosure for Mineral Projects ("NI 43-101"). The Qualified Person (“QP”) responsible for the
review and approval of all year-end Mineral Resource and Reserve Estimates for IAMGOLD contained herein is Lise Chenard, Eng., Director, Mining Geology. Lise has worked in the mining industry for more than 35 years, mainly in operations, project
development and consulting. She joined IAMGOLD in April 2013 and acquired her knowledge of the Company's operations and projects through site visits, information reviews and ongoing communication and oversight of mine site technical service
teams or consultants responsible for resource and reserve modeling and estimation. She is considered a QP for the purposes of NI 43-101 with respect to the mineralization being reported on. The technical information has been included herein with the
consent and prior review of the above noted QP. The QP has verified the data disclosed, and data underlying the information or opinions contained herein.
Côté: The 2018 Côté Gold FS was prepared by both Wood and IAMGOLD QPs (as defined under NI 43-101). Wood QPs are independent of IAMGOLD. The affiliation and areas of responsibility for each QP involved in preparing the 2018 Côté Gold FS,
upon which the technical report will be based, can be found in our November 1, 2018 News Release.
Boto: The initial FS and subsequent optimization studies were completed by IAMGOLD and Lycopodium and incorporates the work of IAMGOLD, Lycopodium and Specialist Consultants QPs (as defined under NI 43-101). QPs are independent of
IAMGOLD and have reviewed and approved this presentation. IAMGOLD QPs are not independent of IAMGOLD and have reviewed and approved this presentation. The areas of responsibility for each QP involved in preparing the FS, upon which the
technical report will be based, can be found in our January 13, 2020 News Release.
Westwood: The Mineral Resource and Reserve Estimates contained in this presentation have been prepared in accordance with NI 43-101. The QP responsible for the resource estimate contained herein is Mr. Donald Trudel, P.Geo., senior geologist,
Westwood Mine. The QP responsible for the underground reserve estimate contained herein is Mr. Mauril Gauthier, P.Eng., senior mine engineer. The QP responsible for the open pit reserve estimate contained herein is Mr. Philippe Chabot, P.Eng.,
Director mining, Technical services at Longueuil. The QP responsible for the information concerning exploration sites is Marie-France Bugnon, P. Geo., General Manager Exploration. The information in this presentation was approved by Daniel Vallieres,
Vice President, Operations Services for IAMGOLD.
Drilling results in this presentation have been prepared in accordance with NI 43-101 Standards of Disclosure for Mineral Projects. The sampling of, and assay data from, drill core is monitored through the implementation of a quality assurance - quality
control (“QA-QC”) program designed to follow industry best practice. The QP responsible for the supervision of the preparation, verification, and review of these results is Craig MacDougall, P.Geo., Senior Vice President, Exploration for IAMGOLD. Mr.
MacDougall is a QP as defined by NI 43-101.
For readers to fully understand the information in this presentation, they should read the relevant Technical Report in their entirety, including all qualifications, assumptions and exclusions that relate to the information set out in the Technical Report which
qualifies the technical information contained in the Technical Report. The Technical Report is intended to be read as a whole, and sections should not be read or relied upon out of context. The Technical Report describes the Mineral Resource and
Reserve estimation methodologies and the assumptions used, and to which those estimates are subject. INV Metals’ AIF includes details of certain risk factors that could materially affect the potential development of the Mineral Resources and Mineral
Reserves and should be considered carefully. A discussion of these and other factors is contained in “Risk Factors” and elsewhere in the Company’s AIF, which was filed on SEDAR on February 19, 2020.
Exploration Target Potential: The potential quantity and grade of the exploration targets referred to are conceptual in nature and insufficient exploration work has been completed to define a Mineral Resource. The property will require significant future
exploration to advance to a resource stage and there can be no certainty that the exploration target will result in a Mineral Resource being delineated. The exploration targets are consistent with similar deposits in the area, deposit models or derived
from initial drilling results.
Cautionary Note to Investors Concerning Estimates of Measured and Indicated Resources
This presentation uses the term "indicated resources". We advise investors that while that term is recognized and required by Canadian regulations, the United States Securities and Exchange Commission (the “SEC”) does not recognize them. Investors
are cautioned not to assume that any part or all of mineral deposits in these categories will ever be converted into reserves.
Cautionary Note to Investors Concerning Estimates of Inferred Resources
This presentation also uses the term "inferred resources". We advise investors that while this term is recognized and required by Canadian regulations, the SEC does not recognize it. "Inferred resources" have a great amount of uncertainty as to their
existence and great uncertainty as to their economic and legal feasibility. It cannot be assumed that all or any part of an inferred Mineral Resource will ever be upgraded to a higher category. Under Canadian rules, estimates of Inferred Mineral
Resources may not form the basis of feasibility or pre-feasibility studies, except in rare cases. Investors are cautioned not to assume that part or all of an inferred resource exists, or is economically or legally mineable.

                                                                                                                                                                                                                                                                   3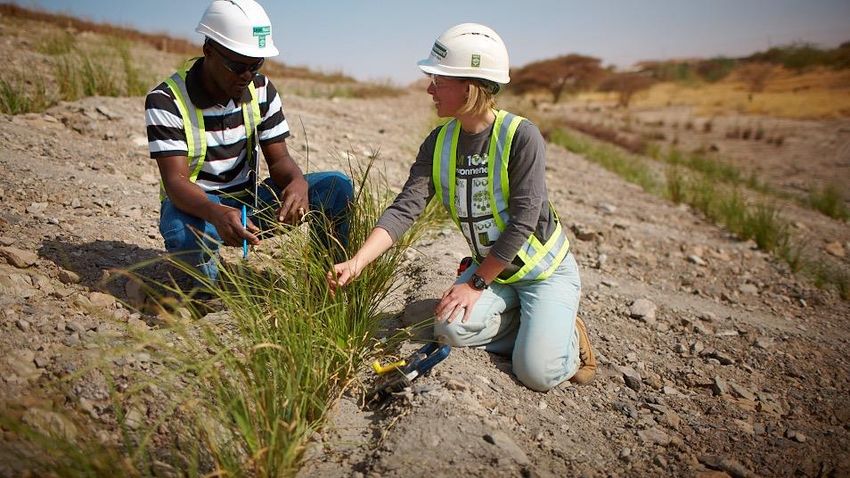
IAMGOLD – Positioned for Profitable Growth
                                                          • Three operating mines on three continents with 2021 guidance of 630-700koz1
       Diversified Operating
 I                                                        • Disciplined approach to realizing value – targeting a self-funding model at each operation
             Portfolio
                                                          • Operating improvements: Essakane optimization, Saramacca ramp-up, WW ‘hub-and-spoke’

                                                          • Peer-leading organic growth profile targeting gold production to >1 Mozpa by 2024 as Côté Gold
       Compelling Value &                                      brought online2,3
 II    Production Growth                                  • Attractive value opportunity relative to peers on P/CF, EV/EBITDA and P/NAV metrics

                                                          • Strong liquidity position of close to $1.5B, including $986M in cash & cash equivalents, and
         Strong Financial                                      improving operating margins at existing operations4
 III         Position                                     • Fully funded growth pipeline with no need to pursue expensive M&A transactions

                                                          • Zero Harm© commitment and Focus on Safety, while building strong community partnerships
           Culture of
 IV                                                       • Rapid COVID-19 response with extensive steps taken to protect the health & safety of employees and
       Accountable Mining                                      contractors

                                                          • Industry leading Reserve growth exceeding 100% since 2016 to 16.7Moz5 as at YE19
         Robust Pipeline
 V                                                        • Near-site district growth: Saramacca (RGM), Gosselin (Côté), Fayolle / Rouyn (WW)
           of Projects
                                                          • Re-seeding the pipeline with long-term growth: Boto & Bambouk District, Nelligan / Monster Lake

                 1. Refer to IAMGOLD news release dated January 19, 2021. 2. Based on 2024 target production range of 1.0-1.3Moz, not intended to be guidance.
                 3. Forward-looking statement. Please refer to the Cautionary Statement. 4. As at December 31, 2020; excludes restricted cash of $39 million. 5. On an attributable basis.
                                                                                                                                                                                             4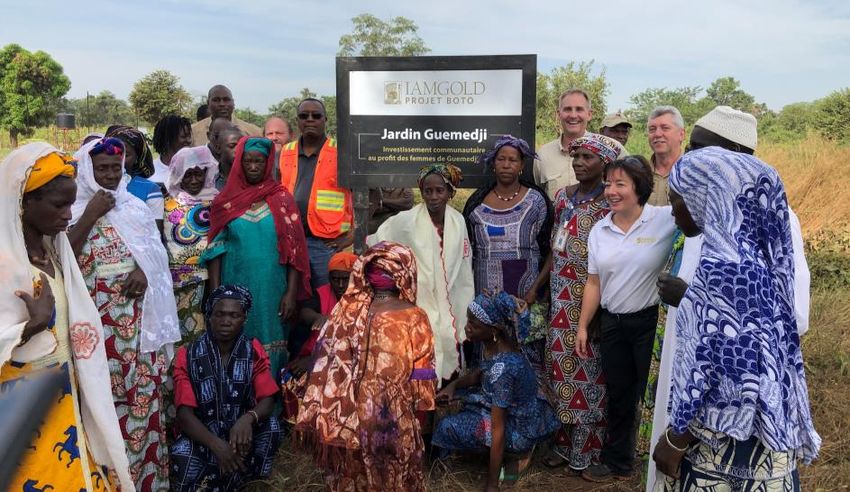
Strategic Focus
TRANSFORMATION THROUGH ORGANIC GROWTH TO REALIZE VALUE

                 Strategic Deliverables                                     Strategic Focus
   •   Improved consolidated costs / increased margins /   •   Achieve self-funding at each operating site
       positive cash flow
   •   Increased gold production                           •   Sequence development of organic growth
   •   Greater operational flexibility                         projects
   •   Enhanced geographical diversity of production            – Execute on Côté construction
   •   Predictable results                                      – Continue de-risking Boto
   •   Generate material returns for shareholders
                                                           •   Advance district exploration targets
                                                                – Gosselin
                                                                – Karita, Diakha-Siribaya (Bambouk)
                                                                – Nelligan / Monster Lake
                                                                – Saramacca-Brokolonko Trend
                                                                – Essakane regional
                                                                – Westwood ‘hub & spoke’ model

                                                           •   Maintain ESG leadership position

                                                                                                             5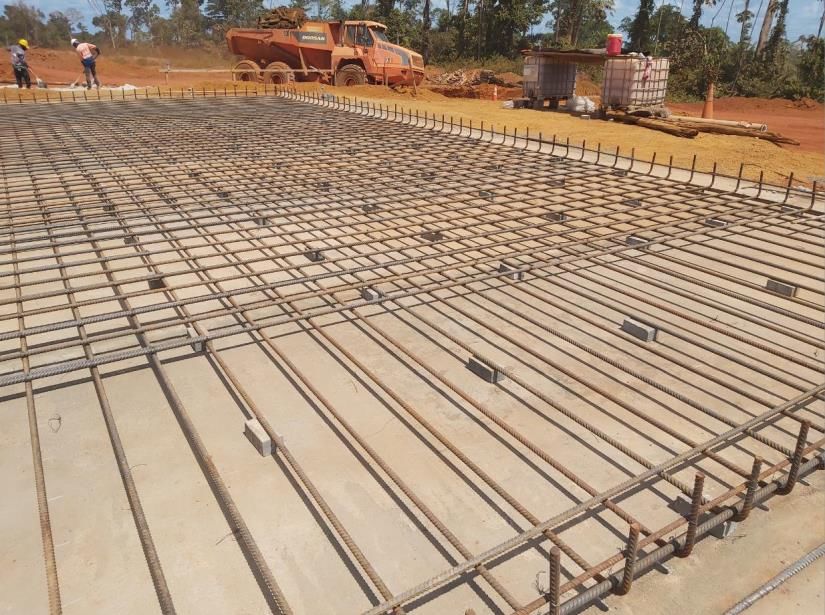
I      Diversified Operating Portfolio

Diversified Operating Portfolio
GLOBAL OPERATING, DEVELOPMENT AND EXPLORATION PROJECTS                                                                                                                                      ATTRIBUTABLE M&I RESOURCES1

                                                                                                                                         Operating Mine

                                                                                                                                                                                                                            30%
                                                                                                                                         Development Project
                                                                                                                                         Advanced Exploration
                                                                                                                                         Strategic Equity Interest                                           36%            North America
     NORTH AMERICA                                                                                                                                                                                           West
     Côté Gold
                                                                                                                                                                                                             Africa    27.2
     Westwood
                                                                                                                                                                                                                       Moz2

                                                                                                                                                                                                                       34%
     Nelligan
     Monster Lake

                                                                                                                                                                                                                       South America

                                                                                                                                                                                               630-700 koz                         +1 Moz
                                                                                                                                                                                               Gold Production                    Gold Production
                                                                                                                                                                                               2021 Guidance*                     Target by 20243

     SOUTH AMERICA                                                                                                WEST AFRICA
     Loma Larga                                                                                                   Essakane
                                                                                                                                                                                               ~$900/oz                                5,000+
     (INV Metals)                                                                                                                                                                                 AISC Cost                            Employees
                                                                                                                  Diakha-Siribaya
     Rosebel                                                                                                                                                                                    Target by 2024                          Globally
                                                                                                                  Boto Gold
     Camp Caiman
     Pitangui                                                                                                                                                                                  16.7 Moz                           27.2 Moz
                                                                                                                                                                                           Proven & Probable                    Measured & Indicated
                                                                                                                                                                                          Gold Reserves (2019)*                Gold Resources (2019)*
                                                                                                                                                                                *On an attributable basis.

                                  1. Mineral resources as at December 31, 2019. 2. M&I resources are have been estimated using a $1,500/oz gold price. Does not include attributable inferred resources of 12.0 Moz.
                                  3. Target range, not intended to be guidance. Includes development projects, assuming 2020 construction start for Côté and 2023 for Boto, subject to capital review.
                                                                                                                                                                                                                                                        6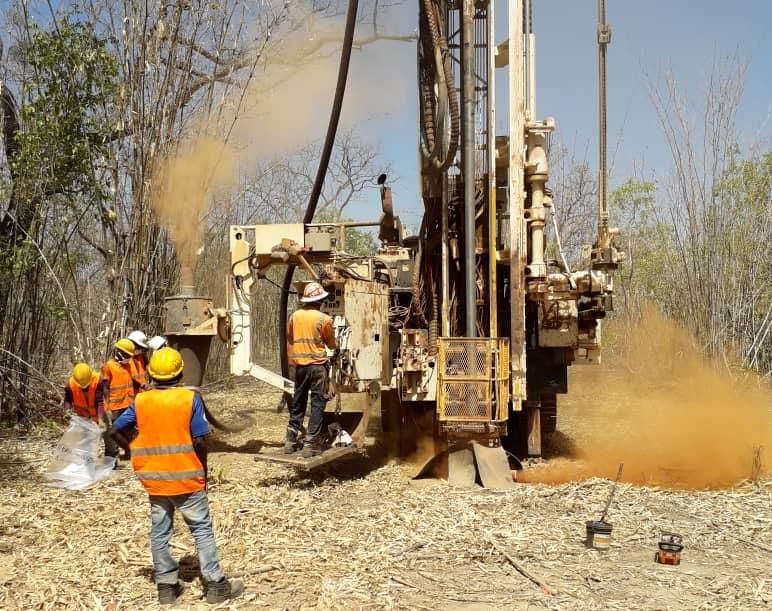
I   Diversified Operating Portfolio

2020 Preliminary Operating Results1
IAMGOLD ACHIEVED THE MID-POINT OF 2020 PRODUCTION GUIDANCE2

                                                                             ATTRIBUTABLE GOLD PRODUCTION

                                                                                                                                                           2020      2020
(000s ounces)                                         Q1/20                             Q2/20                              Q3/20                  Q4/20   ACTUAL   GUIDANCE

Essakane (90%)                                           84                                 83                                 94                 103      364     350 – 370

Rosebel (95%)                                            64                                 52                                 42                  52      210     210 – 230

Westwood (100%)                                          22                                 20                                 23                  14       79      70 – 80

TOTAL                                                   170                                155                               159                  169      653     630 – 680

• Attributable gold sales of 646,000 ounces for the year and 172,000 ounces for the fourth quarter
• Total cash costs3 expected at the bottom end of guidance of $980 to $1,010 per ounce produced
• All-in sustaining costs3 expected around the lower end of guidance of $1,240 to $1,270 per ounce sold

                               1. Refer to IAMGOLD news release dated January 19, 2021. 2. Guidance dated November 4, 2020.
                               3. This is a non-GAAP measure. Refer to the non-GAAP performance measures section of IAMGOLD’s most recent MD&A.
                                                                                                                                                                               7
I      Diversified Operating Portfolio

2021 Operating Outlook1

PRODUCTION & COST GUIDANCE                                                                                                                       CAPITAL EXPENDITURE GUIDANCE

                                                                                                                                                                                                                                     Non-
(000s oz)                                                                                      2021        GUIDANCE1                             ($ millions)                                    Sustaining1                      Sustaining2                       Total3
 Essakane (90%)                                                                                         365 – 390                                Essakane                                                $60                               $90                      $150
 Rosebel (95%)                                                                                          220 – 245                                Rosebel                                                 $50                               $75                      $125
 Westwood (100%)                                                                                          45 – 65                                Westwood                                                $10                               $10                       $20

 Total Attributable Production                                                                          630 – 700                                Operating                                              $120                              $175                      $295

 Cost of sales 2 ($/oz)                                                                           $980 – $1,030                                  Côté Gold Project                                          –                             $355                      $355

 Total cash costs 3,4 ($/oz)                                                                        $930 – $980                                  Boto Gold Project                                          –                              $60                       $60

 All-in sustaining costs 3,4 ($/oz)                                                             $1,230 – $1,280                                  Total (±5%)             3,4,5                          $120                              $590                      $710

1 2021 Guidance is based on full year assumptions with an average realized gold price of $1,750 per ounce, USDCAD exchange rate of 1.30,         1 Sustaining capital includes capitalized stripping of $10 million for Essakane.
EURUSD exchange rate of 1.19 and average crude oil price of $47 per barrel.                                                                      2 Non-sustaining capital includes capitalized stripping of $65 million for Essakane and $45 million for Rosebel.
2 Cost of sales, excluding depreciation, is on an attributable ounce sold basis (excluding the non-controlling interest of 10% at Essakane and   3 Includes $13 million of capitalized exploration and evaluation expenditures.
5% at Rosebel).                                                                                                                                  4 Capitalized borrowing costs are not included.
3 This is a non-GAAP measure. Refer to the non-GAAP performance measures section of IAMGOLD’s most recent MD&A.                                  5 In addition to the above capital expenditures, $23 million in total principal lease payments are expected.
4 Consists of Essakane, Rosebel, and Westwood on an attributable basis.

                                                1. Refer to IAMGOLD news release dated January 19, 2021.
                                                                                                                                                                                                                                                                             8
II Compelling Value & Production Growth
Meaningful Production Growth
FULLY FUNDED PEER-LEADING ORGANIC GROWTH PROFILE SUPPORTED BY SOLID OPERATING BASE
(2021 Attributable Gold Production, koz2)
1,642 1,620 2024
+73%
Target1
Achievable 1.0-1.3MOZ 2021
975 Guidance
Pathway to 880 867
743 709 698
>1Moz 630-700KOZ
493 446
Producer 419
343
Status
Endeavour Northern Star IAMGOLD B2Gold Yamana Centerra Equinox Evolution SSRM IAMGOLD Alamos Eldorado OceanaGold New Gold
(PF) (PF) (PF)
2021-2024 (% production growth, 2021-20243)
Growth
50% – 95% +69% IAMGOLD boasts an industry-leading growth profile with a fully-funded organic pipeline of
development projects with no need to pursue expensive M&A
Peer-Leading
+39% +38%
Production
+25%
Growth +17% +17%
(2021 – 2024) +9%
Yamana SSRM B2Gold Endeavour (PF) Centerra
IAMGOLD Equinox OceanaGold New Gold Eldorado Northern Star Alamos Evolution (2%) (3%) (6%)
(PF) (PF)
(12%)
(18%)
Source: Company disclosures. Broker research.
1. Target range, not intended to be guidance. Includes development projects, assuming 2020 construction start for Côté and 2023 for Boto, subject to capital review.
2. 2021 production estimates based on consensus estimates. 3. Peer gold production growth based on consensus estimates.
9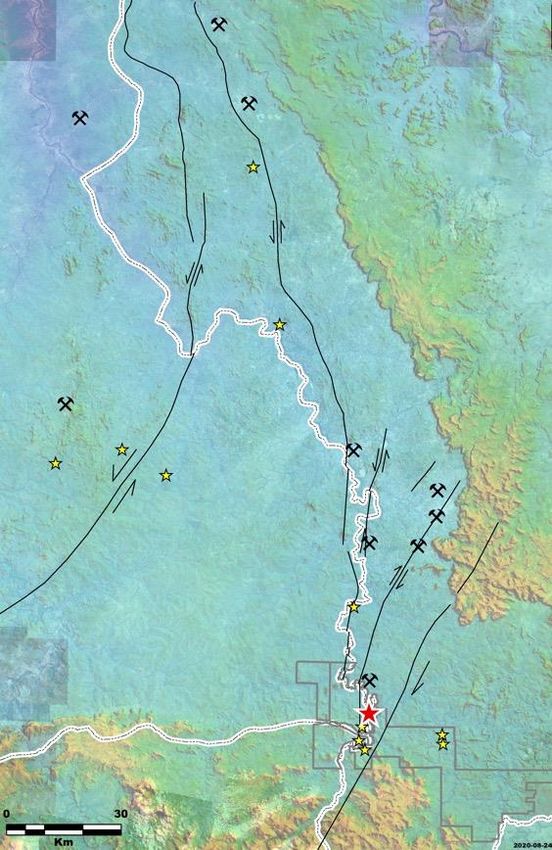
II    Compelling Value & Production Growth

Building Long Term Value

                     Generating                                                                           Near-term                                                       Investing in
                      Mine-Site                                                                            Project                                                         Long-term
                        FCF1                                                                               Growth                                                           Pipeline

(US$M)
                                                   $145.5
                                                                                                               •     Construction commenced in
                                                                                                                     September 2020                              NELLIGAN (75% JV)        3.2 MOZ3
                                                                                                               •     66% project engineering                     QC, CANADA                1.0 G/T
                                                                                       CANADA                        complete as at Q3 2020
                                                                             UNDER CONSTRUCTION                •     ~500 kozpa production in the
                                                                                                                     first 5 years2
              $80.0                                                           TARGET PRODUCTION
                                                                                   2023-2024                   •     Fully funded
                                                                                                                                                                 MONSTER LAKE (100%)       0.4 MOZ
                                                                                                                                                                 QC, CANADA                12.1 G/T
                                                                                                               •     De-risking for future
                                                                              BOTO GOLD                              construction decision
     $23.2                                                                                                     •     50% project engineering
                                                                                      SENEGAL                        complete as at Q3 2020
                                      $3.7                                        SHOVEL READY                 •     ~160 kozpa production in the                GOSSELIN (70% JV)
                                                                                                                                                                                          MAIDEN
                                                                                                                     first 6 years2                                                      RESOURCE
                                                                               BAMBOUK COMPLEX                                                                   ON, CANADA
                                                                                                                                                                                            2021
      Q3       Q3                    YTD            YTD                          DISTRICT SCALE                •     Assessing Bambouk Complex
     2019     2020                   2019           2020

                             1. This is a non-GAAP measure. Refer to the non-GAAP performance measures section of IAMGOLD’s Q3 2020 MD&A for more information.
                             2. On a 100% attributable basis. 3. Inferred resources on a 100% attributable basis.
                                                                                                                                                                                                      10
II Compelling Value & Production Growth
Industry Leading Reserve Growth
17.9Moz 18
16.7Moz
IAMGOLD P&P Reserves 14.5Moz
13
11.3Moz
10.1Moz
8.6Moz +101% Growth in Reserve Base
7.7Moz 7.8Moz 8
512Moz
87 3
422Moz (18%) Decline in Reserve Base
24 395Moz
19 78 365Moz -2
349Moz
60 75 328Moz
23 69 314Moz
17 26 65 286Moz
62
43 20 22 54 -7
19 23
34 20 20 19 53
156 33 21
31 22 15
26 26 22
119
108 24 -12
107 100 78 75
71
-17
166
143 131 114 110 122 118 100
-22
2012 2013 2014 2015 2016 2017 2018 2019
Newmont Barrick Kinross Agnico Yamana Newcrest IMG
Source: Company filings. Reserves are presented on an attributable basis. Newmont (Goldcorp) and Barrick (Randgold) pre-merger data is presented on a consolidated basis.
1. IAMGOLD Reserves pre-2017 do not include reduction as part of 2017 JV agreement with SMM (30% or 1.8Moz).
11II Compelling Value & Production Growth
Côté Gold – Potential Global Tier I Gold Asset
CÔTÉ HAS SIGNIFICANT DISTRICT SCALE POTENTIAL IN MINING-FRIENDLY CANADA
Tier I Asset Criteria*
I
Mine Life
>10 Years I 18+ Year Mine Life
with district expansion potential
• Based on only current mineral reserves of 7.3Moz1, with 10.2Moz in
M&I2 and 3.8Moz in the Inferred resource category
II
Annual Production 493,000 ounces
>500,000 ounces II over the first 5 years3
• Life-of-mine production of 367kozpa driven by lower grade years
following the initial 5 year production profile
III • New discovery 1.5km NE, Gosselin & Young-Shannon, with
exploration target potential of 3-5Moz, which could potentially
Total Cash Costs support production levels ~500kozpa beyond the first 5 years
1st or 2nd quartile cost curve
*Barrick Gold defines a Tier One Gold Asset as a mine with a stated life in excess of 10 years, annual production of at least 500koz
of gold and TCC per ounce over the mine life that are in the lower half of the industry cost curve
III $600/oz 2nd Quartile TCC
2nd quartile4 AISC cost curve of $771/oz LOM3
Source: Company disclosures. Barrick Gold. S&P Market Intelligence.
1. On a 100% attributable basis. 2. Inclusive of Mineral Reserves. 3. Based on June 2020 update assuming $1,350/oz gold price; Forward-looking statement. Please refer to the Cautionary
Statement. 4. Based on 2020 S&P Market Intelligence global TCC and AISC cost curves.
12II Compelling Value & Production Growth
Côté Gold – Sensitivity to Gold Price
SIGNIFICANT LEVERAGE TO THE GOLD PRICE
After-Tax Net Present Value (NPV5%) – 100% Basis1 After-Tax Internal Rate of Return (IRR) – 100% Basis1
(US$Bn) (%)
Spot Gold2 Spot Gold2
$2.8 27.6%
Base 25.9%
$2.5
Case 24.2%
$2.3 22.4%
Base
Case $2.0 20.5%
$1.8 18.6%
16.4%
$1.5 15.3%
14.1%
$1.3 12.8%
$1.1
$1.0
$0.8
$1,250 $1,300 $1,350 $1,400 $1,500 $1,600 $1,700 $1,800 $1,900 $2,000 $1,250 $1,300 $1,350 $1,400 $1,500 $1,600 $1,700 $1,800 $1,900 $2,000
Gold Price Forecast (US$/oz) Gold Price Forecast (US$/oz)
1. 100% attributable basis, after-tax, including equipment financing.
2. As at January 15, 2021 spot gold price of ~US$1,830/oz.
13II Compelling Value & Production Growth
Compelling Value Proposition
ATTRACTIVE UPSIDE RELATIVE TO MID-TIER PRODUCER PEER GROUP
Financial Metrics1 Mineral Reserves & Net Asset Value2
PRICE / 2021E OPERATING CASH FLOW (P/CF, x) ENTERPRISE VALUE / P&P RESERVES P&P Reserves (Moz)2 (US$/oz)
9.4x 9.1x 7.3 6.5 19.4 7.0 3.6 15.5 15.4 9.7 5.4 11.1 15.2 17.3 16.7
$854
$782
6.0x 5.9x 5.9x
Mid-tier Producer Avg. = 5.2x $594 Producer Avg.
4.9x 4.9x 4.8x $572
~$400/oz
3.8x Value $447
3.4x 3.4x $395 $362
3.0x 2.8x Gap $297 $268 $257
$214
$120 $75
EVN NST AGI EQX BTO SSRM YRI ELD OGC EDV CG NGD IMG EVN BTO NST SSRM NGD EDV YRI AGI OGC CG EQX ELD IMG
ENTERPRISE VALUE / 2021E EBITDA (EV/EBITDA, x) PRICE / NET ASSET VALUE (NAV)3 (P/NAV, x)
7.8x
7.3x 1.2x
1.1x
1.0x 1.0x
0.9x
4.9x 0.8x 0.8x Mid-tier Producer Avg. = 0.8x
4.3x Mid-tier Producer Avg. = 4.2x 0.7x
4.2x 4.1x 4.0x 4.0x 0.7x
3.5x 0.6x
3.2x 0.6x 0.5x
2.9x 2.6x Value 0.4x
1.8x Gap
EVN NST AGI YRI SSRM BTO EQX ELD OGC NGD EDV CG IMG EVN NST BTO YRI NGD CG SSRM EDV AGI EQX OGC ELD IMG
Source: Company disclosures. S&P Capital IQ. Market data as at January 15, 2021.
1. 2021E Operating Cash Flow and EBITDA based on consensus estimates. 2. Mineral reserves on an attributable basis.
3. NAV based on analyst consensus estimates.
14III Strong Financial Position
Strong Financial Position & Expected FCF from Operations
IAMGOLD is well positioned to execute on Côté given existing liquidity and expected free cash flow from operations
Senior Notes Outstanding
~$1.5B1 EXPECTED
Total Liquidity
FREE CASH FLOW ($450 M)
FROM EXISTING OPERATIONS
Coupon: 5.75%; Maturity: Oct.15, 2028
$500 M Corp Rating: B1 (Moody’s) and B+ (S&P)
Credit
• Successfully refinanced old
Facility
7.0% $400 million notes due
2025
$947 M Côté Gold
Cash &
Fully Funded • $450 million new senior notes
with lower 5.75% interest rate
Equiv.1 $875-$925 M and maturity extended to 2028
• S&P and Moody’s credit rating
agencies re-affirmed
IAMGOLD’s stable outlook
Cash & ST Undrawn Credit Total Available Côté Gold
Investments Facility Liquidity Go-Forward Capital following refinancing
Q4 2020 (70% IMG)
1. As at December 31, 2020; excludes restricted cash of $39 million.
15III Strong Financial Position
Leverage Leader Among Peers
DISCIPLINED APPROACH FAVOURABLY POSITIONS COMPANY AMONG PRODUCER PEER GROUP
Net Debt / 2021E EBITDA1,2 0.7x
Net Cash / 2021E EBITDA1,2 0.6x
0.6x
0.5x
0.4x
Net 0.4x 0.4x
Debt
0.1x
Net (0.3x)
Cash
(0.4x)
(0.4x)
(0.5x)
Source: S&P Capital IQ and company disclosures. Market data as at December 31, 2020.
1. Total debt includes leases, based on most recently disclosed publicly available financial information.
2. EBITDA based on average broker consensus estimates.
16IV Culture of Accountable Mining
Environmental, Social and Governance (ESG)
Recent
Highlights
*
IAMGOLD supporting local beekeepers in
Antioquia Municipality (Colombia) Strong ESG
practices • Donations to local communities in response to the global
COVID-19 crisis, allocating $1.5 million to date:
– Cleaning equipment and supplies (hand-washing
stands, hand-sanitizing gel)
• Implemented the Toward Sustainable – Protective medical equipment (masks, gloves, etc.)
Mining framework at all operations – Life support equipment (ventilators, hospital beds)
In place since 2007
• Implementing the World Gold – Supporting local entrepreneurs (protective masks, PPE
Council’s Responsible Gold suppliers)
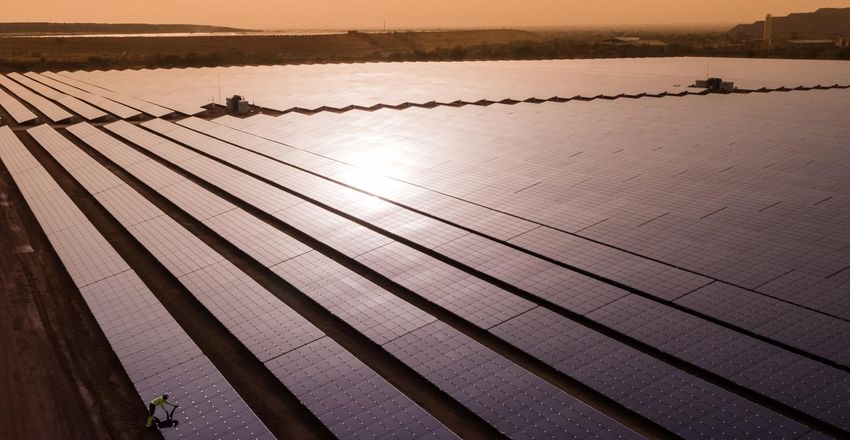
Mining Principles • Commissioning of the world’s largest hybrid
• Respecting the natural environment • Received highest level (GA-1) of solar/thermal plant at Essakane
• Building strong community Moody’s Corporate Governance for • Investment of $1.35 million to improve community access
partnerships the Metals and Mining Sector to high-quality medical care in Suriname
• Putting the health and safety of our • One of the 2019 Top 50 Sustainable • Public-Private Partnership with Canadian Gov’t, One Drop
employees first. Companies in Canada by Corporate Foundation, and Cowater on Triangle de l’Eau project,
Knights completed Phase I bringing potable water to 60,000
• Inclusion in the 2020 Bloomberg people near ESK; Advancing Phase II (200,000 people)
Gender Equality Index for • Rosebel Community Fund, with initial funding of $2.5
organizational commitment to equality million to provide grants to local projects which demonstrate
and advancement of women in the positive economic and/or social impacts
Fore more information, see our Sustainability report at https://www.iamgold.com
workplace • Moody’s1 ESG ranks IAMGOLD 4th out of 45 sector peers
1. Moody’s affiliate Vigeo Eiris.
*2020: THE USE BY IAMGOLD OFANY MSCI ESG RESEARCH LLC OR ITS AFFILIATES (“MSCI”) DATA, AND THE USE OF MSCI LOGOS, TRADEMARKS, SERVICE MARKS OR INDEX NAMES HEREIN, DO NOT CONSTITUTE A SPONSORSHIP, ENDORSEMENT, RECOMMENDATION, OR PROMOTION OF IAMGOLD BY MSCI. MSCI SERVICES AND DATA
17
ARE THE PROPERTY OF MSCI OR ITS INFORMATION PROVIDERS, AND ARE PROVIDED ‘AS-IS’ AND WITHOUT WARRANTY. MSCI NAMES AND LOGOS ARE TRADEMARKS OR SERVICE MARKS OF MSCI.IV Culture of Accountable Mining
Adapting to Our New Normal: COVID-19 Response
Zero Harm© is our commitment to continually strive to reach the highest standards in human health & safety, minimize our
environmental footprint, and work co-operatively with our host communities.
• COVID-19 in Q3 2020: Health & Safety Protocols Embedded in our Operations and Projects
• Essakane – completed the expansion of sleeping quarters adding 200 beds; operations back to normal capacity
• Westwood – back online mid-April following Quebec’s COVID-19 Care & Maintenance directive
• Rosebel – continue to expand camp capacity to facilitate social distancing; targeting Q1 2021
• Côté – protocols include screening, assessments, mandatory protective wear, social distancing, temperature tests
Medical equipment donations to the Dori
Hospital
• Community Support and Engagement
• Essakane employees made an in-kind donation to vulnerable Below: Rosebel Community
Fund contributes US$ 250,000
communities near Ouagadougou to the fight against COVID-19
• Local entrepreneurs supply protective masks to Rosebel
• Medical / PPE supplies and food baskets distributed to
vulnerable communities near exploration projects in West
Africa, Colombia and Peru Local entrepreneurs supply protective masks to
Rosebel contributing sustainable socio-economic
development of local communities
18IV Culture of Accountable Mining
Focus on Safety: Historical DART & TRI Rates
HISTORICAL GLOBAL DART & TRI RATES PER 200,000 HOURS WORKED
DART1: 2020 TARGET – 0.57
2.40
TRI1: 2020 TARGET – 0.94
1.98
1.81* 1.76*
1.53* 1.56
1.44* 1.44
1.18 1.13
1.06 1.06 1.00 0.87
0.93
0.85 0.67
0.68 0.66
0.53 0.53 0.51 0.46
0.30
2009 2010 2011 2012 2013 2014 2015 2016 2017 2018 2019 2020
2020 Q1 Q2 Q3 Q4 Targets 2020
DART Days Away, Restricted or Transferred Duty 0.65 0.11 0.36 0.72 0.57 Below 0.46
Target
TRI Total Recordable Injuries 0.95 0.30 0.48 0.95 0.94 0.67
*excluding Niobec
1. DART and TRI rates per 200,000 man-hours worked.
19V Robust Pipeline of Projects
Ensuring a Robust Pipeline
FUTURE PRODUCTION AND GROWTH OPPORTUNITIES GROWTH OPPORTUNITIES
• Gosselin (Côté), Ontario
• Diakha-Siribaya, Mali
• Karita, Guinea
• Monster Lake, Quebec
Saramacca, Suriname Mill Optimization, Burkina Faso Côté Gold Project, Ontario
• Fayolle, Quebec
• Rouyn, Quebec
• Pitangui, Brazil
Boto Gold Project, Senegal Bambouk Complex, Nelligan Gold Project, Quebec
Senegal/Mali/Guinea
20V Robust Pipeline of Projects
Robust Exploration Pipeline
West Africa North America South America
Fala/Fala E Grand Duc Saramacca >5 Moz Au
Production >2 Moz AuUpcoming Catalysts
2021 KEY MILESTONES*
o Rosebel Ramp-up with Saramacca
o Essakane Optimized Mill
o Advancing Growth Projects
o Côté – Major Earthworks, Plant construction kickoff, Initiate Pre-strip
o Boto – Access Road & other Project Infrastructure
o Gosselin – Targeting Maiden Resource
o Resource Delineation (Nelligan, Fayolle, Rouyn, Gosselin, Karita)
o Westwood Underground Re-start and Ramp-up**
* The global COVID-19 crisis is expected to continue to affect our operations, including incremental costs and productivity impacts. While the precise impact continues to
evolve, the impact could be significant in future periods, affecting our guidance for future years.
** Subject to assessment of a business continuity plan.
22Operations
Photo: Wärtsilä
23Rosebel Gold Mine, Suriname
24Rosebel – Long Operating History with Attractive District Upside
OVERVIEW KEY NOTES Brokopondo district in north-eastern Suriname
Ownership • Gross Rosebel Concession:
95% IAMGOLD, 5% Saramacca Development
Government of Suriname First ore delivered October 31, 2019
• Saramacca UJV: 70% Road connection established in Q1’20
IAMGOLD, 30% Staatsolie Online – H2’20 GUYANA
(66.5% IAMGOLD effective1)
• Future potential – reserve extension FRENCH
Mining • Conventional open pit and underground potential assessment GUIANA
Method methods
Production • Began commercial Extensive Regional Land Package
Status production in 2004 • Building on exploration success at
Saramacca BRAZIL
LOM • To 2033, with Saramacca
Source: NI 43-101 (Q3/2018) • Ongoing assessment of district targets
2020 RESERVES AND RESOURCES3
• 210 koz
Production Rosebel Community Fund (IMG Attributable)
2021 • 220 – 245 koz2 • Launched in 2019 with a US$2.5M Tonnes Grade
Contained
Ounces
Guidance • $50M sustaining capex endowment, supporting socio- (000) (g/t)
(000 Au)
economic development, health and
• $75M non-sustaining capex well-being of local communities
P&P Reserves 133,208 1.0 4,364
M&I Resources* 286,729 1.0 8,856
Inferred Resources 68,754 0.8 1,876
* Inclusive of mineral reserves
1. 70/30 UJV (IAMGOLD / Staatsolie) and 95% Rosebel ownership (70% x 95% = 66.5%)
2. Refer to IAMGOLD news release dated January 19, 2021. 3. Refer to IAMGOLD news release dated February 18, 2020.
25Saramacca Update
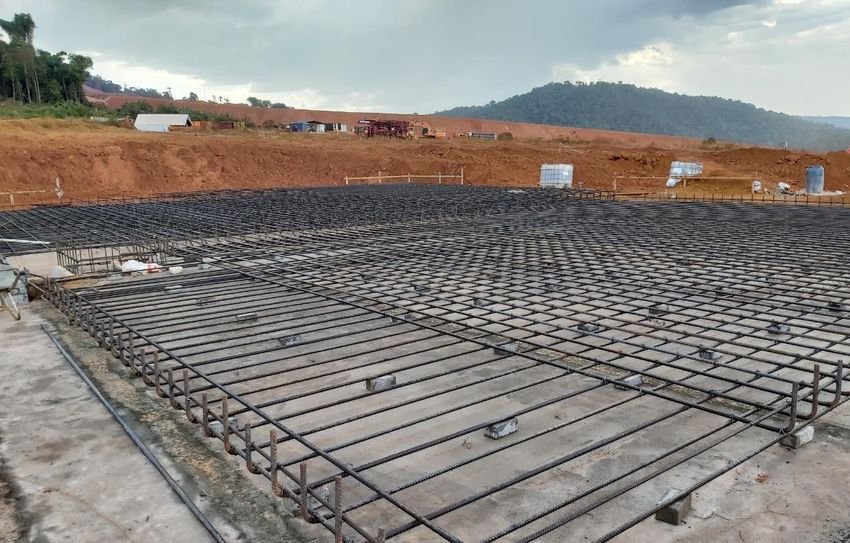
ABOVE: ROM FACILITY PAD
TRUCK SHOP
RIGHT: FORMWORKS &
CONCRETE AT FACILITY PAD
26Essakane Gold Mine, Burkina Faso
27Essakane – Stable Producer of ~400kozpa on a 100% basis
OVERVIEW KEY NOTES North-eastern Burkina Faso, West Africa
Ownership • 90% IAMGOLD, 10%
Government of Burkina Faso CIL (carbon-in-leach) Debottlenecking
Mining • Conventional drill, blast, load and • Improve throughput and gravity NIGER
Method haul surface mining method recovery, $9M capex MALI
Production • Began commercial production in • ~10% Increase in CIL Mill throughput
Status July 2010 on hard rock 2020+
BENIN
• Plant expansion was completed
on time and under budget at the NIGERIA
end of 2013 Satellite Prospects
CÔTE
• Expanded plant nameplate • Evaluating resource potential of D'IVOIRE GHANA
capacity on 100% hard rock from satellite prospects and identified
10.8 Mtpa to 11.7 Mtpa targets within 1-15km of mill
LOM • CIL to 2026 • Gossey initial resource2, comprising
• HL 2027-2031 291 koz Indicated and 85 koz Inferred
Source: NI 43-101 (Q4/2019) RESERVES AND RESOURCES4
(IMG Attributable)
2020 Heap Leaching3
• 364 koz Contained
Production
• Heap Leach after CIL Tonnes
(000)
Grade
(g/t)
Ounces
• 365 – 390 koz
2021
Guidance1
• Initial capex $115M (incl. $9M CIL (000 Au)
• $60M sustaining capex optimization) P&P Reserves 112,242 1.0 3,425
• $90M non-sustaining capex M&I Resources* 135,624 1.0 4,219
Inferred Resources 11,327 1.1 401
* Inclusive of mineral reserves
1. Refer to IAMGOLD news release dated January 19, 2021. 2. Refer to IAMGOLD news release dated February 18, 2020.
3. Refer to IAMGOLD news release dated November 6, 2019. 4. Refer to IAMGOLD news release dated May 4, 2020.
28CIL/HL Feasibility Study Highlights
HIGHLIGHTS1 KEY NOTES
Mine Life 2031
CIL Optimization Study
Mining Capacity 55.0 Mtpa • FS supported increasing mill throughput to 11.7Mtpa (hard rock) from 10.8Mtpa
CIL Milling Capacity
11.7 Mtpa
• Minimal capital outlay of $9 million with commissioning targeted for Q1/21
(100% hard rock equivalent)
Heap Leach Project
HL Processing Capacity 8.5 Mtpa
• Construction not required until 2025, providing project optionality
HL Tonnage 43.1 Mt
• Opportunity to potentially maximize returns and minimize capital investment by utilizing
Average diluted grade 1.24 g/t Au the existing CIL circuit to process HL ore (gold price dependent)
(CIL / HL) / 0.40 g/t Au
LOM Average Recovery Rate
92% / 67%
(CIL / HL) PRODUCTION PROFILE
(100% Gold Production, koz)
LOM Average Annual Gold 433 koz
Production (CIL) (2020-2026) 531
Regional
LOM Average Annual Gold 74 koz 436 Exploration
425 420 410 412
Production (HL) (2027-2031) 400 Potential
HL Initial Capital Expenditure $115 M
(+20% / -15%) (2025-2026)
LOM Average Direct Cash Costs $778/oz CIL Processing Heap Leach Project
LOM Average AISC $949/oz 81 85 70 69
63
After-tax NPV6%
$874 M
($1,350/oz Au price)
2020 2021 2022 2023 2024 2025 2026 2027 2028 2029 2030 2031
1. Refer to IAMGOLD news release dated November 6, 2019.
29Westwood Gold Mine, Canada
30Westwood – Established Base in the Prolific Abitibi Gold Camp
OVERVIEW KEY NOTES
Northwestern Québec
Ownership • 100% IAMGOLD
Current Status
Mining
• Underground • Assessing business continuity
Method
Production • Began commercial production in
following seismic event in the west
Status July 2014 part of the mine in 2020
LOM • To 2033 • Potential to focus on near term mining
in the eastern part of the mine
2020
• 79 koz
Production
2021 • 45 – 65 koz Progressing Development
Guidance1 • $10M sustaining capex • Targeting safe, profitable, long life
• $10M non-sustaining capex mine
Underground • Ramp-up production and cost
• Anticipated 3-4 year period
Ramp-up guidance issued2
• 100 – 125 koz
Period2,3 • NI 43-101 Study delivered RESERVES AND RESOURCES2
• $1,125 – $1,225 /oz AISC (IMG Attributable)
Underground • 130 – 145 koz Contained
Resource Conversion Tonnes Grade
Ounces
Steady State2,3 • $1,000 – $1,100 /oz AISC (000) (g/t)
• Delineation drilling to target conversion (000 Au)
of resources into reserves P&P Reserves 2,698 7.1 618
M&I Resources* 4,764 10.2 1,557
Inferred Resources 6,384 8.6 1,771
* Inclusive of mineral reserves
1. Refer to IAMGOLD news release dated January 19, 2021. 2. Refer to IAMGOLD news release dated August 5, 2020.
3. Subject to assessment of business continuity plan.
31Westwood – “Hub-and-Spoke” Model
ATTRACTIVE DISTRICT EXPLORATION POTENTIAL1 THAT COULD SUPPLEMENT EXCESS MILL CAPACITY
FAYOLLE PROPERTY (OP) A B ROUYN GOLD PROJECT (UG)
100% ACQUIRED FROM MONARCH GOLD IN JUNE 2020 OPTION TO ACQUIRE 100% FROM YORBEAU RESOURCES
A Fayolle
• ~35 km northeast of Rouyn-Noranda and ~29
Property
• 4 km south of Rouyn-Noranda and ~40 km
km northwest from Westwood west from Westwood
• Consists of 39 mineral claims covering an • Excellent access to infrastructure & skilled
area of 1,373 hectares (14 km2) mining personnel
• Excellent potential1 to provide • Contains 4 known gold deposits on a 2,700
supplemental feed following depletion of hectare property covering a 12 km stretch
Grand Duc of the prolific Cadillac-Larder Lake Break
Home 5
• Resource estimate work ongoing with Rouyn-Noranda
Westwood • Exploration Target Potential1 of
focus on high-grade near-surface Mine 400-600koz at 6-8 g/t Au at underground
mineralization B Lac Gamble zone
Lac Gamble Zone Rouyn Project
Granada
• Target production 20-25koz over 2 years, • Anticipated 3-4 year permitting timeline1
commencing Q4 2022, pending permitting1
• Recent Lac Gamble drill highlights3:
Westwood
• Historical 2019 drill highlights2: 65-75%
Underground • GA20-750: 9.8m grading 27.8g/t
• FA19-103: 6.1m grading 8.37g/t Mill Utilization
Westwood 1.1 Mtpa • GA20-709W2: 9.8m grading 10.4g/t
Mill Nameplate
• FA19-107: 2.7m grading 50.94g/t
Capacity
Design
Excess Capacity • GA19-694: 29.7m grading 9.0g/t
• FA19-108: 3.0m grading 37.97g/t Fayolle (2022-2024)
25-35% Rouyn (2024+)
• (incl.) 11.1m grading 17.5g/t
• FA19-109: 4.0m grading 15.79g/t Other Exploration Upside
1. Forward-looking statement. Please refer to the Cautionary Statement. 2. See Monarch Gold Corp. press release dated Sep 5, 2019 (these drill results have not been verified by IAMGOLD and
should not be relied on). 3. See IAMGOLD press releases dated May 13, 2020 and Jun 12, 2019.
32Construction Review
33Transformational Value in Canada
CÔTÉ GOLD – HIGHLIGHTS
• NPV5% of $2.5B and IRR of 25.9% at US$1,900 / oz gold1,2
• NPV5% of $1.1B and IRR of 15.3% at US$1,350 / oz gold1,2
ONTARIO
QUÉBEC
• Annual gold production 469 koz at $693 / oz AISC, first 6 years2
• 18+ year potential mine life2 Kapuskasing
Timmins
• 7+ Moz in reserves at $1,200 / oz gold price2
Gogama
• Risk mitigation – technical: +66% detailed engineering complete Chapleau
Sudbury
• Risk mitigation – costs: 55% of capital in firm bids Ottawa
• Finance through cash flows, balance sheet, credit facility Toronto
• Key permits and approvals in hand:
• Federal Fisheries Act: Sec. 35, Sec. 36 (Schedule 2)
• Environment Assessment, Closure Plan, Leave to Construct (powerline)
• LRIA (fish collection/habitat offsets, haul roads), ECA, Permit to take Water
• Ownership: 92.5% JV (70:30 IAMGOLD/SMM); 7.5% 3rd party
• Strong stakeholder relationships:
• Mining friendly jurisdiction – near Gogama, ON, Canada
• Sumitomo Metal Mining – Joint Venture Partner
• 130 km SW of Timmins, and 200 km NW of Sudbury.
• Indigenous and northern communities
• Skilled local labour pool.
• District Potential: Gosselin and Young Shannon
• Close to infrastructure:
• Gosselin & Young-Shannon discoveries,Côté Gold: Key Project Metrics C$ 10B* C$ 5B*
In estimated economic activity during In wages forecast through direct
PROJECT HIGHLIGHTS: GO-FORWARD UPDATE1,2 the mine’s operations and indirect job creation
(100% basis, average LOM)
Mine Life 18 years
Open Pit Mining 70 Mtpa
Mill Capacity 13.1 Mtpa (36,000 tpd)
450
Full time, well paying jobs anticipated IAMGOLD will be working closely with
Strip Ratio (w:o) 2.7 : 1 during operations and over 1,000 local Indigenous and Northern communities to
construction jobs build and operate the project
Gold Head Grade 0.96 g/t
* Figures referenced (C$10B in estimated economic activity during the mine’s operations and C$5B in wages) from independent report
Gold Recovery 91.8% conducted by RIAS July 13, 2018.
Total Recovered Gold 6.61 Moz
Average Annual Production 367 koz
MEANINGFUL SCALE & MINE LIFE4,5
Initial Capex $1.30B3 469 KOZPA 367 KOZPA
First 6 years Life-of-mine
Sustaining Capex $1.07B (100% Gold Production, koz)
District Exploration Goal Focused on Maintaining
Gold Price Assumption $1,350/oz $1,700/oz Production Levels Beyond 2028-2029
Total Cash Costs $600/oz $663/oz
AISC $771/oz $835/oz 559 549
500 488
431 456
369 376 386 390 387
348 314 325
After-Tax NPV5% $1.1B $2.0B 245
179 161 145
After-Tax IRR 15.3% 22.4%
'24 '25 '26 '27 '28 '29 '30 '31 '32 '33 '34 '35 '36 '37 '38 '39 '40 '41
1. Refer to IAMGOLD news release dated July 21, 2020. 2. Based on the FS Extended Case, which is subject to receipt of permitting. 3. Net of equipment financing.
4. Production profile based on June 2020 update. 5. Forward-looking statement. Please refer to the Cautionary Statement.
35Project Timeline – Key Milestones
EXECUTION PLAN
• Construction commenced at Côté in early September following ground-breaking ceremony
• Fish salvage, construction camp preparation and road access development
• Activities ramp-up into Q4 2020 with ~66% project engineering now complete
TIMELINE
Construction Process
Major Building TMF Phase 1
Approval Commercial Production
Earthworks Enclosed Complete
Start
Commissioning Full Production
Construction Completed Achieved
Start
2020 2021 2022 2023 2024
Q1 Q2 Q3 Q4 Q1 Q2 Q3 Q4 Q1 Q2 Q3 Q4 Q1 Q2 Q3 Q4 Q1 Q2 Q3 Q4
Expected Go-forward Capital Obligation Allocation3
~$66M 45% 35% 10% $875 – $925 million
Go-Forward Capital Obligation3
Construction Labour Ramp-up (average)
n.a. n.a. 75 230 410 660 990 870 800 1,150 1,300 1,025 650 410
~450 Full-Time Jobs during operations
>1,000 jobs during construction
1. Refer to IAMGOLD news release dated February 18, 2020. 2. Refer to news release dated November 1, 2018.
3. 70% basis, assuming leasing. Refer to news release dated July 21, 2020. Leasing of major mining equipment. Go-forward U.S. $ / Canadian $ exchange rate of 1.35.
Annual capital allocations to be updated following Q4 2020 Financial and Operating results.
36Ground-breaking & Site Preparation
CHESTER CAMP – 264 MAN CAMP
GROUND-BREAKING CEREMONY
TREE CLEARING – 456 HECTARES COMPLETED
FISH RELOCATION IN TMF AREA 37Development and Exploration Projects
38Exploration Potential at Côté
GOSSELIN, YOUNG-SHANNON 1.5 KM NORTHEAST OF CÔTÉ
Gosselin Drill Hole Highlights1
• GOS19-17: 342.5 metres grading 0.98 g/t Au
• includes: 225.0 metres grading 1.34 g/t Au
• GOS19-24: 412.0 metres grading 1.28 g/t Au
• includes: 221.4 metres grading 1.47 g/t Au
CONCEPTUAL PLAN
Exploration Target Potential*: 3 to 5 million ounces grading @ 0.7 to 1.2 g/t Au
(Targeting maiden resource in 2021)
* Refer to Exploration Target Potential cautionary language on slide 3
1. See News Release dated July 30, 2019.
39Boto Gold – High Margin Investment in Prospective District
OVERVIEW RESERVE AND RESOURCE1 OPTIMIZATION STUDY HIGHLIGHTS1
(100% Basis) (100% Basis)
Location • Senegal, West Africa Contained Mine Capacity:
Tonnes Grade Mining: open pit
Ounces 38 Mtpa
Ownership • 90% IAMGOLD / 10% Gov’t of Senegal (000) (g/t)
(000 Au) Mill Capacity:
Process: crush, grind, gravity, leach,
Highlights • Along same trend as B2Gold’s Fekola Probable 2.7 Mtpa (HR
29,040 1.7 1,593 CIP (hard rock equivalent)
Mine in Mali Reserves equivalent)
• Mining permit received December 23, LOM Average Annual Gold Production 130,000 oz
Measured &
2019 for an initial period of 20 years1 40,567 1.6 2,033 Average Annual Gold Production
Indicated * 160,000 oz
• De-risking for future construction (years 1-6)
decision (estimated 13 month pre- Inferred 8,196 1.8 469
LOM Average Recovery Rate 89.4%
production period) * Inclusive of Reserves
Mine Life 11 years
LOM Average Total Cash Costs $778/oz
LOM Average AISC $842/oz
Average Grade 1.71 g/t Au
Average LOM Strip Ratio 7.5 : 1
Estimated capital expenditure
Initial Capital $271 million
Sustaining Capital $68 million
Investment metrics
Gold Price Assumption $1,350/oz
After-tax NPV (6%) $219 million
After-tax IRR 22.6%
Payback Period 3.2 years
Community market garden near Boto sponsored by IAMGOLD to help Operating RC Drill Rig
promote sustainable business ventures for the local community
1. Refer to Optimized Feasibility Study news release dated February 18, 2020.
40Bambouk District: Boto – Karita – Diakha-Siribaya
BOTO GOLD PROJECT, SENEGAL Gold Price After-tax NPV6%1 After-tax IRR1 Yatela Deposit
Operation
(US$/oz) (US$M) (%)
• Announced the receipt of the exploitation permit $2,000 $732 55%
Sadiola
for an initial period of 20 years $1,900 $652 50%
• De-risking Detail Engineering and Preliminary $1,800 $572 45%
Infrastructure construction $1,500 $329 30%
• Optimization Study1 completed in 2019 confirms $1,350 $219 23%
robust project economics on a standalone basis: $1,250 $151 18%
MALI
KARITA GOLD PROJECT, GUINEA Boto Deposit
• Reported results from 2019 drilling program3, Sabodala
5Moz P&P
comprising 16 reverse circulation (RC) drill holes Teranga
Massawa
totaling 1,839 metres. Highlights included: Loulo
Segala
KRC19-006: 29.0 m grading 2.96 g/t Au 8Moz P&P
Barrick Gold
Tabakoto
KRC19-009: 16.0 m grading 3.17 g/t Au
SENEGAL Gounkoto
KRC19-011: 21.0 m grading 9.01 g/t Au
Fekola 4Moz P&P
Karita Discovery B2Gold Corp.
BAMBOUK
DIAKHA-SIRIBAYA GOLD PROJECT, MALI DISTRICT
• Resource ounces increased by 57%2 with a significant Boto
1.6Moz P&P
Karita
conversion to indicated ounces. Converted >700 koz to Discovery
Diakha Deposit
Indicated category
GUINEA Diakha-Siribaya
IAMGOLD
M&I 0.7Moz | Inf.1.2Moz
1. See IAMGOLD news release dated January 13, 2020. 2. See IAMGOLD news release dated January 30, 2019.
3. See IAMGOLD news release dated October 2, 2019.
41Chibougamau: Emerging Prospective District in Quebec, Canada
NELLIGAN (75% JV INTEREST)
• 15 kilometres south of Monster Lake
• Exercised option to increase undivided interest to 75% (from 51%), following
completion of NI 43-101 Technical Report MONSTER LAKE (Au)
• Completed initial resource estimate1, comprising approximately 97 million tonnes
grading 1.02 g/t Au for 3.2 million ounces, on a 100% basis Joe Mann
• Awarded 2019 AEMQ Discovery of the Year
NELLIGAN (Au)
• Recent drill highlights2:
Windfall
• 39.1 metres @ 2.14 g/t Au
• 34.5 metres @ 1.85 g/t Au
MONSTER LAKE (100% INTEREST)
• Hosts an inferred resource1 of 1.1 million tonnes grading 12.1 grams of gold per tonne for
433 thousand ounces
• Acquired remaining 25% held by TomaGold to hold 100% interest
• Recent drill highlights3:
• 3.8 metres @ 16.9 g/t Au
• 2.82 metres @ 5.63 g/t Au
• 12.3 metres @ 2.09 g/t Au
1. See IAMGOLD news release dated February 18, 2020. 2. See IAMGOLD news release dated August 11, 2020.
3. See IAMGOLD news release dated August 13, 2020.
42Exploration Around the World
IP Survey – Saramacca
Suriname
Drill Barge at Gosselin, Ontario
RC Drilling – Diakha
Mali
Geological Field Visit
Peru
Visible Gold in core
Rouyn Gold Project, QuebecYou can also read