Chapter 11. The World of Imperfect Competition Start Up: eBay Needs Google, Google Needs eBay, and Neither Trusts the Other
←
→
Page content transcription
If your browser does not render page correctly, please read the page content below

Chapter 11. The World of Imperfect
Competition
Start Up: eBay Needs Google, Google Needs
eBay, and Neither Trusts the Other
The Internet auction site eBay has had a close and cooperative relationship with Google, the giant search
engine. eBay has relied heavily on Google to advertise its products. Google relies heavily on the advertising
revenue it gets from eBay. The greater the success of eBay, the greater the revenue Google will have from
eBay’s advertising. The greater the success of Google as a search engine, the greater will be the impact of
eBay’s advertising. To paraphrase Rick’s line from Casablanca, “This could be a beautiful relationship.” It is
not. The two Internet giants simply do not get along.+

Consider what happened in 2007. A Google spokesman said the firm was hosting a “Freedom Party” to
announce the inauguration of a new payments service that would compete directly with PayPal, the online
payment service owned by eBay. eBay was quick to retaliate. It pulled all of its advertising from Google later
on the same day Google made its announcement. Two days later, Google backed down. It canceled its party
and the payment service the party was to kick off.[20]+

In 2003, eBay had commissioned an analysis of whether Google represented a threat to its operations. The
study concluded that Google was unlikely to enter into e-commerce and was not a potential rival to eBay.
That sanguine conclusion started to unravel in 2005. Google began recruiting eBay engineers. In October,
Google started testing Google Base, a free classified advertising service that threatened eBay’s auction
service.+

Executives at eBay took the threat seriously. In private meetings, they divided into two teams. A green team
represented eBay’s interests; a red team tried to emulate Google’s strategy. The red team concluded that
Google represented a serious threat, and eBay executives began exploratory talks with Microsoft and Yahoo
to see if some collaborative effort could ward off the Google threat.+

eBay spokesman Chris Donlay describes the firm’s dilemma of dealing with a firm that has been a valuable
ally but at the same time could be a competitive threat. “Given how really fast the Internet changes, it
comes as no surprise that the line between competition and cooperation is sometimes blurry.”+

By the late spring of 2006, eBay’s management was still in a quandary about what to do about Google.
Some executives, fearful of losing the advantages of continuing to work with Google, want to maintain
eBay’s ties to the firm. Others worried that continuing a close relationship with Google was akin to putting
the fox in the proverbial henhouse. They want to move quickly to establish a relationship with Yahoo or with
Microsoft that would compete with Google.[21]+

The tension between eBay and Google hardly suggests the aloof world of perfect competition where
consumers are indifferent about which firm has produced a particular product, where each firm knows it can
sell all it wants at the going market price, where firms must settle for zero economic profit in the long run.
Nor is it the world of monopoly, where a single firm maximizes its profits, believing that barriers to entry will
keep out would-be competitors, at least for a while. This is the world of imperfect competition, one that lies
     between the idealized extremes of perfect competition and monopoly. It is a world in which firms battle over
     market shares, in which economic profits may persist, in which rivals try to outguess each other with
     pricing, advertising, and product-development strategies.+

     Unlike the chapters on perfect competition and monopoly, this chapter does not provide a single model to
     explain firms’ behavior. There are too many variations on an uncertain theme for one model to explain the
     complexities of imperfect competition. Rather, the chapter provides an overview of some of the many
     different models and explanations advanced by economists for the behavior of firms in the imperfectly
     competitive markets. The analytical tools you have acquired in the course of studying the models of
     competitive and monopoly markets will be very much in evidence in this discussion.+

     The spectrum of business enterprise ranges from perfectly competitive firms to monopoly. Between these
     extremes lies the business landscape in which the vast majority of firms—those in the world of imperfect
     competition—actually operate. Imperfect competition is a market structure with more than one firm in
     an industry in which at least one firm is a price setter. An imperfectly competitive firm has a degree of
     monopoly power, either based on product differentiation that leads to a downward-sloping demand curve or
     resulting from the interaction of rival firms in an industry with only a few firms.+

     There are two broad categories of imperfectly competitive markets. The first is one in which many firms
     compete, each offering a slightly different product. The second is one in which the industry is dominated by
     a few firms. Important features of both kinds of markets are advertising and price discrimination, which we
     examine later in this chapter.+

     [20]
            Victoria Murphy Barrett, “Reading Your Mind,” Forbes Online, October 29, 2007, 180 Issue 9, p. 50.

     [21]
            Mylene Mangalindan and Robert A. Guth, “eBay Talks to Microsoft, Yahoo About a Common Foe:
     Google,” The Wall Street Journal Online, April 21, 2006, p. A1.

     Monopolistic Competition: Competition
     Among Many
                                L E A R N I N G             O B J E C T I V E S

1.   Explain the main characteristics of a monopolistically competitive industry, describing both its
     similarities and differences from the models of perfect competition and monopoly.

2.   Explain and illustrate both short-run equilibrium and long-run equilibrium for a
     monopolistically competitive firm.
3.   Explain what it means to say that a firm operating under monopolistic competition has excess
     capacity in the long run and discuss the implications of this conclusion.

     +

     The first model of an imperfectly competitive industry that we shall investigate has conditions quite similar
     to those of perfect competition. The model of monopolistic competition assumes a large number of firms. It
     also assumes easy entry and exit. This model differs from the model of perfect competition in one key
     respect: it assumes that the goods and services produced by firms are differentiated. This differentiation
     may occur by virtue of advertising, convenience of location, product quality, reputation of the seller, or
     other factors. Product differentiation gives firms producing a particular product some degree of price-setting
     or monopoly power. However, because of the availability of close substitutes, the price-setting power of
     monopolistically competitive firms is quite limited. Monopolistic competition is a model characterized by
     many firms producing similar but differentiated products in a market with easy entry and exit.+

     Restaurants are a monopolistically competitive sector; in most areas there are many firms, each is different,
     and entry and exit are very easy. Each restaurant has many close substitutes—these may include other
     restaurants, fast-food outlets, and the deli and frozen-food sections at local supermarkets. Other industries
     that engage in monopolistic competition include retail stores, barber and beauty shops, auto-repair shops,
     service stations, banks, and law and accounting firms.+

     Profit Maximization

     Suppose a restaurant raises its prices slightly above those of similar restaurants with which it competes. Will
     it have any customers? Probably. Because the restaurant is different from other restaurants, some people
     will continue to patronize it. Within limits, then, the restaurant can set its own prices; it does not take the
     market prices as given. In fact, differentiated markets imply that the notion of a single “market price” is
     meaningless.+

     Because products in a monopolistically competitive industry are differentiated, firms face downward-sloping
     demand curves. Whenever a firm faces a downward-sloping demand curve, the graphical framework for
     monopoly can be used. In the short run, the model of monopolistic competition looks exactly like the model
     of monopoly. An important distinction between monopoly and monopolistic competition, however, emerges
     from the assumption of easy entry and exit. In monopolistic competition, entry will eliminate any economic
     profits in the long run. We begin with an analysis of the short run.+

     The Short Run

     Because a monopolistically competitive firm faces a downward-sloping demand curve, its marginal revenue
     curve is a downward-sloping line that lies below the demand curve, as in the monopoly model. We can thus
     use the model of monopoly that we have already developed to analyze the choices of a monopsony in the
     short run.+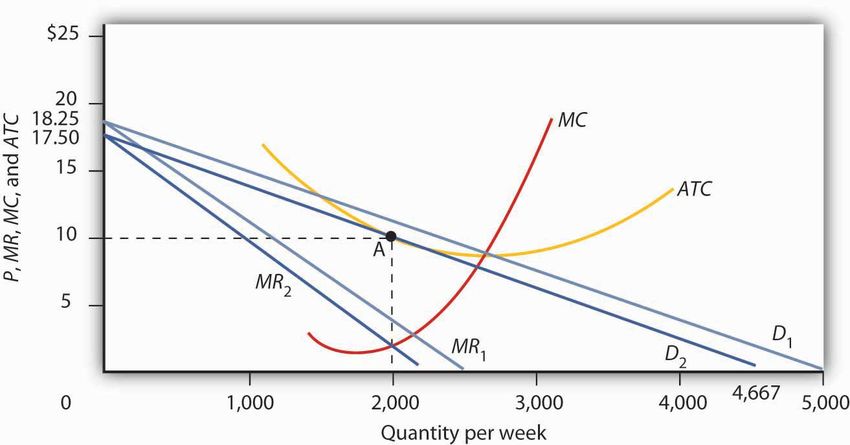
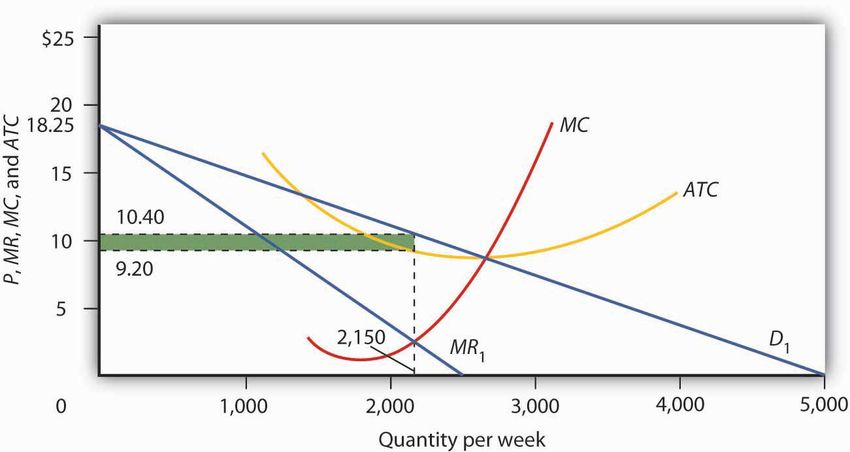
Figure 11.1, “Short-Run Equilibrium in Monopolistic Competition” shows the demand, marginal revenue,
marginal cost, and average total cost curves facing a monopolistically competitive firm, Mama’s Pizza.
Mama’s competes with several other similar firms in a market in which entry and exit are relatively easy.
Mama’s demand curve D1 is downward-sloping; even if Mama’s raises its prices above those of its
competitors, it will still have some customers. Given the downward-sloping demand curve, Mama’s marginal
revenue curve MR1 lies below demand. To sell more pizzas, Mama’s must lower its price, and that means its
marginal revenue from additional pizzas will be less than price.+

Figure 11.1. Short-Run Equilibrium in Monopolistic Competition

Looking at the intersection of the marginal revenue curve MR1 and the marginal cost curve MC,
we see that the profit-maximizing quantity is 2,150 units per week. Reading up to the average
total cost curve ATC, we see that the cost per unit equals $9.20. Price, given on the demand
curve D1, is $10.40, so the profit per unit is $1.20. Total profit per week equals $1.20 times
2,150, or $2,580; it is shown by the shaded rectangle.

+

Given the marginal revenue curve MR and marginal cost curve MC, Mama’s will maximize profits by selling
2,150 pizzas per week. Mama’s demand curve tells us that it can sell that quantity at a price of $10.40.
Looking at the average total cost curve ATC, we see that the firm’s cost per unit is $9.20. Its economic
profit per unit is thus $1.20. Total economic profit, shown by the shaded rectangle, is $2,580 per week.+

The Long Run

We see in Figure 11.1, “Short-Run Equilibrium in Monopolistic Competition” that Mama’s Pizza is earning an
economic profit. If Mama’s experience is typical, then other firms in the market are also earning returns that
exceed what their owners could be earning in some related activity. Positive economic profits will encourage
new firms to enter Mama’s market.+

As new firms enter, the availability of substitutes for Mama’s pizzas will increase, which will reduce the
demand facing Mama’s Pizza and make the demand curve for Mama’s Pizza more elastic. Its demand curve
will shift to the left. Any shift in a demand curve shifts the marginal revenue curve as well. New firms will
continue to enter, shifting the demand curves for existing firms to the left, until pizza firms such as Mama’s
no longer make an economic profit. The zero-profit solution occurs where Mama’s demand curve is tangent
to its average total cost curve—at point A in Figure 11.2, “Monopolistic Competition in the Long Run”.
Mama’s price will fall to $10 per pizza and its output will fall to 2,000 pizzas per week. Mama’s will just cover
its opportunity costs, and thus earn zero economic profit. At any other price, the firm’s cost per unit would
be greater than the price at which a pizza could be sold, and the firm would sustain an economic loss. Thus,
the firm and the industry are in long-run equilibrium. There is no incentive for firms to either enter or leave
the industry.+

Figure 11.2. Monopolistic Competition in the Long Run

The existence of economic profits in a monopolistically competitive industry will induce entry
in the long run. As new firms enter, the demand curve D1 and marginal revenue
curve MR1 facing a typical firm will shift to the left, to D2 andMR2. Eventually, this shift
produces a profit-maximizing solution at zero economic profit, where D2 is tangent to the
average total cost curve ATC (point A). The long-run equilibrium solution here is an output of
2,000 units per week at a price of $10 per unit.

+
Had Mama’s Pizza and other similar restaurants been incurring economic losses, the process of moving to
long-run equilibrium would work in reverse. Some firms would exit. With fewer substitutes available, the
demand curve faced by each remaining firm would shift to the right. Price and output at each restaurant
would rise. Exit would continue until the industry was in long-run equilibrium, with the typical firm earning
zero economic profit.+

Such comings and goings are typical of monopolistic competition. Because entry and exit are easy, favorable
economic conditions in the industry encourage start-ups. New firms hope that they can differentiate their
products enough to make a go of it. Some will; others will not. Competitors to Mama’s may try to improve
the ambience, play different music, offer pizzas of different sizes and types. It might take a while for other
restaurants to come up with just the right product to pull customers and profits away from Mama’s. But as
long as Mama’s continues to earn economic profits, there will be incentives for other firms to try.+

Heads Up!

The term “monopolistic competition” is easy to confuse with the term “monopoly.” Remember, however, that the
two models are characterized by quite different market conditions. A monopoly is a single firm with high barriers
to entry. Monopolistic competition implies an industry with many firms, differentiated products, and easy entry and
exit.+

Why is the term monopolistic competition used to describe this type of market structure? The reason is that it
bears some similarities to both perfect competition and to monopoly. Monopolistic competition is similar to perfect
competition in that in both of these market structures many firms make up the industry and entry and exit are
fairly easy. Monopolistic competition is similar to monopoly in that, like monopoly firms, monopolistically
competitive firms have at least some discretion when it comes to setting prices. However, because
monopolistically competitive firms produce goods that are close substitutes for those of rival firms, the degree of
monopoly power that monopolistically competitive firms possess is very low.+

+
Excess Capacity: The Price of Variety

The long-run equilibrium solution in monopolistic competition always produces zero economic profit at a
point to the left of the minimum of the average total cost curve. That is because the zero profit solution
occurs at the point where the downward-sloping demand curve is tangent to the average total cost curve,
and thus the average total cost curve is itself downward-sloping. By expanding output, the firm could lower
average total cost. The firm thus produces less than the output at which it would minimize average total
cost. A firm that operates to the left of the lowest point on its average total cost curve has excess
capacity.+

Because monopolistically competitive firms charge prices that exceed marginal cost, monopolistic
competition is inefficient. The marginal benefit consumers receive from an additional unit of the good is
given by its price. Since the benefit of an additional unit of output is greater than the marginal cost,
consumers would be better off if output were expanded. Furthermore, an expansion of output would reduce
average total cost. But monopolistically competitive firms will not voluntarily increase output, since for them,
    the marginal revenue would be less than the marginal cost.+

    One can thus criticize a monopolistically competitive industry for falling short of the efficiency standards of
    perfect competition. But monopolistic competition is inefficient because of product differentiation. Think
    about a monopolistically competitive activity in your area. Would consumers be better off if all the firms in
    this industry produced identical products so that they could match the assumptions of perfect competition?
    If identical products were impossible, would consumers be better off if some of the firms were ordered to
    shut down on grounds the model predicts there will be “too many” firms? The inefficiency of monopolistic
    competition may be a small price to pay for a wide range of product choices. Furthermore, remember that
    perfect competition is merely a model. It is not a goal toward which an economy might strive as an
    alternative to monopolistic competition.+

                                     K E Y        T A K E A W A Y S

•   A monopolistically competitive industry features some of the same characteristics as perfect competition: a
    large number of firms and easy entry and exit.+

•   The characteristic that distinguishes monopolistic competition from perfect competition is differentiated
    products; each firm is a price setter and thus faces a downward-sloping demand curve.+

•   Short-run equilibrium for a monopolistically competitive firm is identical to that of a monopoly firm. The firm
    produces an output at which marginal revenue equals marginal cost and sets its price according to its
    demand curve.+

•   In the long run in monopolistic competition any economic profits or losses will be eliminated by entry or by
    exit, leaving firms with zero economic profit.+

•   A monopolistically competitive industry will have some excess capacity; this may be viewed as the cost of
    the product diversity that this market structure produces.+

    +
                                                  T R Y        I T !

    Suppose the monopolistically competitive restaurant industry in your town is in long-run equilibrium, when
    difficulties in hiring cause restaurants to offer higher wages to cooks, servers, and dishwashers. Using
    graphs similar to Figure 11.1, “Short-Run Equilibrium in Monopolistic Competition” and Figure 11.2,
    “Monopolistic Competition in the Long Run”, explain the effect of the wage increase on the industry in the
    short run and in the long run. Be sure to include in your answer an explanation of what happens to price,
    output, and economic profit.+

    Case in Point: Craft Brewers: The Rebirth of a Monopolistically Competitive Industry

    Figure 11.3.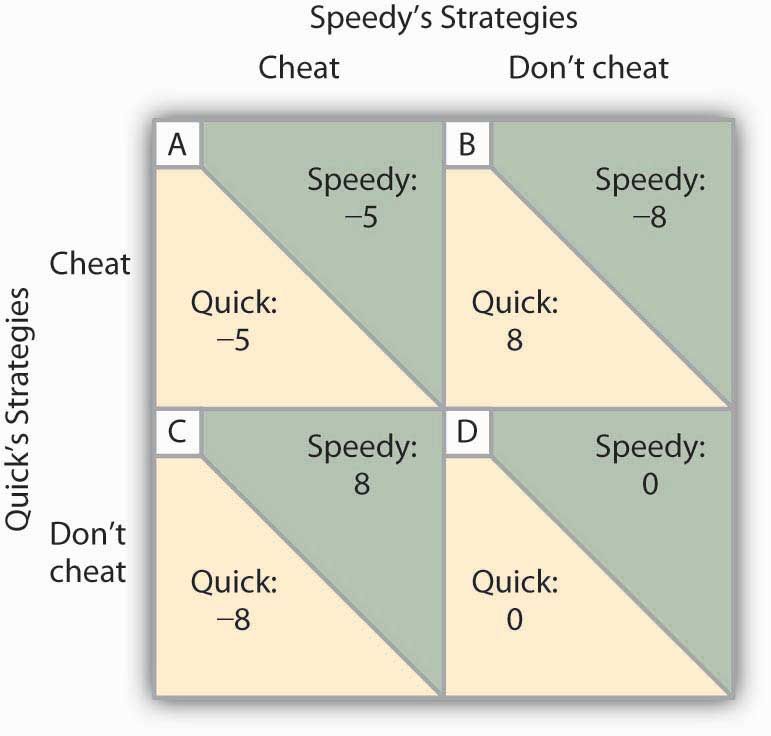
+
In the early 1900s, there were about 2,000 local beer breweries across America. Prohibition in the 1920s squashed
the industry; after the repeal of Prohibition, economies of scale eliminated smaller breweries. By the early 1980s
only about 40 remained in existence.+
But the American desire for more variety has led to the rebirth of the nearly defunct industry. To be sure, large,
national beer companies dominated the overall ale market in 1980 and they still do today, with 43 large national
and regional breweries sharing about 85% of the U.S. market for beer. But their emphasis on similarly tasting,
light lagers (at least, until they felt threatened enough by the new craft brewers to come up with their own
specialty brands) left many niches to be filled. One niche was filled by imports, accounting for about 12% of the
U.S. market. That leaves 3 to 4% of the national market for the domestic specialty or “craft” brewers.+
The new craft brewers, which include contract brewers, regional specialty brewers, microbreweries, and brewpubs,
offer choice. As Neal Leathers at Big Sky Brewing Company in Missoula, Montana put it, “We sort of convert
people. If you haven’t had very many choices, and all of a sudden you get choices—especially if those choices
involve a lot of flavor and quality—it’s hard to go back.”+
Aided by the recent legalization in most states of brewpubs, establishments where beers are manufactured and
retailed on the same premises, the number of microbreweries grew substantially over the last 25 years. A recent
telephone book in Colorado Springs, a city with a population of about a half million and the home of the authors of
your textbook, listed nine microbreweries and brewpubs; more exist, but prefer to be listed as restaurants.+
To what extent does this industry conform to the model of monopolistic competition? Clearly, the microbreweries
sell differentiated products, giving them some degree of price-setting power. A sample of four brewpubs in the
downtown area of Colorado Springs revealed that the price of a house beer ranged from 13 to 22 cents per
ounce.+
Entry into the industry seems fairly easy, judging from the phenomenal growth of the industry. After more than a
decade of explosive growth and then a period of leveling off, the number of craft breweries, as they are referred
to by the Association of Brewers, stood at 1,463 in 2007. The start-up cost ranges from $100,000 to $400,000,
according to Kevin Head, the owner of the Rhino Bar, also in Missoula.+
The monopolistically competitive model also predicts that while firms can earn positive economic profits in the
short run, entry of new firms will shift the demand curve facing each firm to the left and economic profits will fall
toward zero. Some firms will exit as competitors win customers away from them. In the combined microbrewery
and brewpub sub-sectors of the craft beer industry in 2007, for example, there were 94 openings and 51
closings.+
+
A N S W E R T O T R Y I T ! P R O B L E M
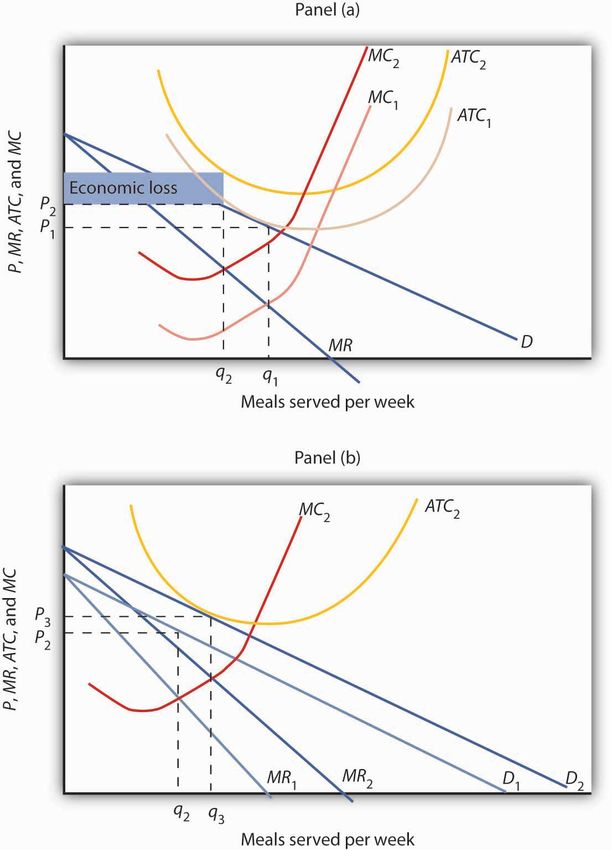
As shown in Panel (a), higher wages would cause both MC and ATC to increase. The upward shift
in MC from MC1 to MC2 would cause the profit-maximizing level of output (number of meals served per
week, in this case) to fall from q1 to q2 and price to increase from P1 to P2. The increasein ATC from ATC1 to ATC2 would mean that some restaurants would be earning negative economic profits, as shown by the shaded area.+ As shown in Panel (b), in the long run, as some restaurants close down, the demand curve faced by the typical remaining restaurant would shift to the right from D1 to D2. The demand curve shift leads to a corresponding shift in marginal revenue from MR1 to MR2. Price would increase further from P2 to P3, and output would increase to q3, above q2. In the new long-run equilibrium, restaurants would again be earning zero economic profit.+ Figure 11.4.
+

Oligopoly: Competition Among the Few
L E A R N I N G              O B J E C T I V E S

1.   Explain the main characteristics of an oligopoly, differentiating it from other types of market
     structures.

2.   Explain the measures that are used to determine the degree of concentration in an industry.

3.   Explain and illustrate the collusion model of oligopoly.

4.   Discuss how game theory can be used to understand the behavior of firms in an oligopoly.

     +

     In July, 2005, General Motors Corporation (GMC) offered “employee discount pricing” to virtually all GMC
     customers, not just employees and their relatives. This new marketing strategy introduced by GMC
     obviously affected Ford, Chrysler, Toyota and other automobile and truck manufacturers; Ford matched
     GMC’s employee-discount plan by offering up to $1,000 to its own employees who convinced friends to
     purchase its cars and trucks. Ford also offered its customers the same prices paid by its employees. By mid-
     July, Chrysler indicated that it was looking at many alternatives, but was waiting for GMC to make its next
     move. Ultimately, Chrysler also offered employee discount pricing.+

     Toyota had to respond. It quickly developed a new marketing strategy of its own, which included lowering
     the prices of its cars and offering new financing terms. The responses of Ford, Chrysler, and Toyota to
     GMC’s pricing strategy obviously affected the outcome of that strategy. Similarly, a decision by Procter &
     Gamble to lower the price of Crest toothpaste may elicit a response from Colgate-Palmolive, and that
     response will affect the sales of Crest. In anoligopoly, the fourth and final market structure that we will
     study, the market is dominated by a few firms, each of which recognizes that its own actions will produce a
     response from its rivals and that those responses will affect it.+

     The firms that dominate an oligopoly recognize that they are interdependent: What one firm does affects
     each of the others. This interdependence stands in sharp contrast to the models of perfect competition and
     monopolistic competition, where we assume that each firm is so small that it assumes the rest of the market
     will, in effect, ignore what it does. A perfectly competitive firm responds to the market, not to the actions of
     any other firm. A monopolistically competitive firm responds to its own demand, not to the actions of
     specific rivals. These presumptions greatly simplify the analysis of perfect competition and monopolistic
     competition. We do not have that luxury in oligopoly, where the interdependence of firms is the defining
     characteristic of the market.+

     Some oligopoly industries make standardized products: steel, aluminum, wire, and industrial tools. Others
     make differentiated products: cigarettes, automobiles, computers, ready-to-eat breakfast cereal, and soft
     drinks.+
Measuring Concentration in Oligopoly
Oligopoly means that a few firms dominate an industry. But how many is “a few,” and how large a share of
industry output does it take to “dominate” the industry?+
Compare, for example, the ready-to-eat breakfast cereal industry and the ice cream industry. The cereal
market is dominated by two firms, Kellogg’s and General Mills, which together hold more than half the
cereal market. This oligopoly operates in a highly concentrated market. The market for ice cream, where the
four largest firms account for just less than a third of output, is much less concentrated.+
One way to measure the degree to which output in an industry is concentrated among a few firms is to use
a concentration ratio, which reports the percentage of output accounted for by the largest firms in an
industry. The higher the concentration ratio, the more the firms in the industry take account of their rivals’
behavior. The lower the concentration ratio, the more the industry reflects the characteristics of
monopolistic competition or perfect competition.+
The U.S. Census Bureau, based on surveys it conducts of manufacturing firms every five years, reports
concentration ratios. These surveys show concentration ratios for the largest 4, 8, 20, and 50 firms in each
industry category. Some concentration ratios from the 2002 survey, the latest available, are reported
in Table 11.1, “Concentration Ratios and Herfindahl–Hirschman Indexes”. Notice that the four-firm
concentration ratio for breakfast cereals is 78%; for ice cream it is 48%.+
Table 11.1. Concentration Ratios and Herfindahl–Hirschman Indexes
Largest
4
Largest
8
Largest
20
Largest
50
Industry HHI
firms firms firms firms
*D,
data
withheld
by
the
government
to
avoid
revealing
information
about
specific
firms.
Ice
cream 48 64 82 93 736
Breakfast
cereals 78 91 99 100 2521
Cigarettes 95 99 100
*D
Men’s
and
boys’
shirts 38 53 73 89 481Largest
4
Largest
8
Largest
20
Largest
50
Industry HHI
firms firms firms firms
Women’s
and
girls’
21 32 49 70 186
blouses
and
shirts
Automobiles 76 94 99 100 1911
Sporting
and
athletic
23 32 46 62 182
goods
Dental
laboratories 13 18 23 30 54
Two measures of industry concentration are reported by the Census Bureau: concentration ratios and the
Herfindahl–Hirschman Index (HHI).
+
An alternative measure of concentration is found by squaring the percentage share (stated as a whole
number) of each firm in an industry, then summing these squared market shares to derive a Herfindahl–
Hirschman Index (HHI). The largest HHI possible is the case of monopoly, where one firm has 100% of
the market; the index is 1002, or 10,000. An industry with two firms, each with 50% of total output, has an
HHI of 5,000 (502 + 502). In an industry with 10,000 firms that have 0.01% of the market each, the HHI is
1. Herfindahl–Hirschman Indexes reported by the Census Bureau are also given in Table 11.1,
“Concentration Ratios and Herfindahl–Hirschman Indexes”. Notice that the HHI is 2,521 for breakfast
cereals and only 736 for ice cream, suggesting that the ice cream industry is more competitive than the
breakfast cereal industry.+
In some cases, the census data understate the degree to which a few firms dominate the market. One
problem is that industry categories may be too broad to capture significant cases of industry dominance.
The sporting goods industry, for example, appears to be highly competitive if we look just at measures of
concentration, but markets for individual goods, such as golf clubs, running shoes, and tennis rackets, tend
to be dominated by a few firms. Further, the data reflect shares of the national market. A tendency for
regional domination does not show up. For example, the concrete industry appears to be highly competitive.
But concrete is produced in local markets—it is too expensive to ship it very far—and many of these local
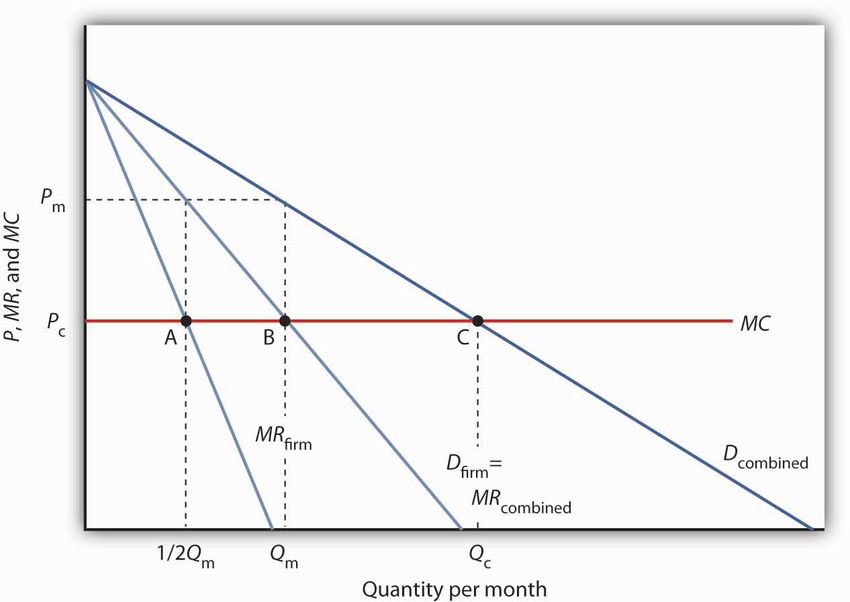
markets are dominated by a handful of firms.+The census data can also overstate the degree of actual concentration. The “automobiles” category, for example, has a four-firm concentration ratio that suggests the industry is strongly dominated by four large firms (in fact, U.S. production is dominated by three: General Motors, Ford, and Chrysler). Those firms hardly account for all car sales in the United States, however, as other foreign producers have captured a large portion of the domestic market. Including those foreign competitors suggests a far less concentrated industry than the census data imply.+ The Collusion Model There is no single model of profit-maximizing oligopoly behavior that corresponds to economists’ models of perfect competition, monopoly, and monopolistic competition. Uncertainty about the interaction of rival firms makes specification of a single model of oligopoly impossible. Instead, economists have devised a variety of models that deal with the uncertain nature of rivals’ responses in different ways. In this section we review one type of oligopoly model, the collusion model. After examining this traditional approach to the analysis of oligopoly behavior, we shall turn to another method of examining oligopolistic interaction: game theory.+ Firms in any industry could achieve the maximum profit attainable if they all agreed to select the monopoly price and output and to share the profits. One approach to the analysis of oligopoly is to assume that firms in the industry collude, selecting the monopoly solution.+ Suppose an industry is a duopoly, an industry with two firms. Figure 11.5, “Monopoly Through Collusion” shows a case in which the two firms are identical. They sell identical products and face identical demand and cost conditions. To simplify the analysis, we will assume that each has a horizontal marginal cost curve, MC. The demand and marginal revenue curves are the same for both firms. We find the combined demand curve for the two firms, Dcombined, by adding the individual demand curves together. Because one firm’s demand curve, Dfirm, represents one-half of market demand, it is the same as the combined marginal revenue curve for the two firms. If these two firms act as a monopoly, together they produce Qm and charge a price Pm. This result is achieved if each firm selects its profit-maximizing output, which equals 1/2 Qm. This solution is inefficient; the efficient solution is price Pc and output Qc, found where the combined market demand curve Dcombined and the marginal cost curve MC intersect.+ Figure 11.5. Monopoly Through Collusion
Two identical firms have the same horizontal marginal cost curve MC. Their demand
curves Dfirm and marginal revenue curves MRfirm are also identical. The combined demand curve
is Dcombined; the combined marginal revenue curve is MRcombined. The profits of the two firms are
maximized if each produces 1/2 Qm at point A. Industry output at point B is thus Qm and the
price is Pm. At point C, the efficient solution output would be Qc, and the price would equal MC.

+

In the simplest form of collusion, overt collusion, firms openly agree on price, output, and other decisions
aimed at achieving monopoly profits. Firms that coordinate their activities through overt collusion and by
forming collusive coordinating mechanisms make up a cartel.+

Firms form a cartel to gain monopoly power. A successful cartel can earn large profits, but there are several
problems with forming and maintaining one. First, in many countries, including the United States, cartels are
generally illegal.[22] They are banned, because their purpose is to raise prices and restrict output. Second,
the cartel may not succeed in inducing all firms in the industry to join. Firms that remain outside the cartel
can compete by lowering price, and thus they prevent the cartel from achieving the monopoly solution.
Third, there is always an incentive for individual members to cheat on cartel agreements. Suppose the
members of a cartel have agreed to impose the monopoly price in their market and to limit their output
accordingly. Any one firm might calculate that it could charge slightly less than the cartel price and thus
capture a larger share of the market for itself. Cheating firms expand output and drive prices down below
the level originally chosen.+
The Organization of Petroleum Exporting Countries (OPEC), perhaps the best-known cartel, is made up of
13 oil-producing countries. In the 1970s, OPEC successfully acted like a monopoly by restricting output and
raising prices. By the mid-1980s, however, the monopoly power of the cartel had been weakened by
expansion of output by nonmember producers such as Mexico and Norway and by cheating among the
cartel members.+

An alternative to overt collusion is tacit collusion, an unwritten, unspoken understanding through which
firms agree to limit their competition. Firms may, for example, begin following the price leadership of a
particular firm, raising or lowering their prices when the leader makes such a change. The price leader may
be the largest firm in the industry, or it may be a firm that has been particularly good at assessing changes
in demand or cost. At various times, tacit collusion has been alleged to occur in a wide range of industries,
including steel, cars, and breakfast cereals.+

It is difficult to know how common tacit collusion is. The fact that one firm changes its price shortly after
another one does cannot prove that a tacit conspiracy exists. After all, we expect to see the prices of all
firms in a perfectly competitive industry moving together in response to changes in demand or production
costs.+

Game Theory and Oligopoly Behavior

Oligopoly presents a problem in which decision makers must select strategies by taking into account the
responses of their rivals, which they cannot know for sure in advance. The Start Up feature at the beginning
of this chapter suggested the uncertainty eBay faces as it considers the possibility of competition from
Google. A choice based on the recognition that the actions of others will affect the outcome of the choice
and that takes these possible actions into account is called a strategic choice. Game theory is an
analytical approach through which strategic choices can be assessed.+

Among the strategic choices available to an oligopoly firm are pricing choices, marketing strategies, and
product-development efforts. An airline’s decision to raise or lower its fares—or to leave them unchanged—
is a strategic choice. The other airlines’ decision to match or ignore their rival’s price decision is also a
strategic choice. IBM boosted its share in the highly competitive personal computer market in large part
because a strategic product-development strategy accelerated the firm’s introduction of new products.+

Once a firm implements a strategic decision, there will be an outcome. The outcome of a strategic decision
is called a payoff. In general, the payoff in an oligopoly game is the change in economic profit to each firm.
The firm’s payoff depends partly on the strategic choice it makes and partly on the strategic choices of its
rivals. Some firms in the airline industry, for example, raised their fares in 2005, expecting to enjoy
increased profits as a result. They changed their strategic choices when other airlines chose to slash their
fares, and all firms ended up with a payoff of lower profits—many went into bankruptcy.+

We shall use two applications to examine the basic concepts of game theory. The first examines a classic
game theory problem called the prisoners’ dilemma. The second deals with strategic choices by two firms in
a duopoly.+
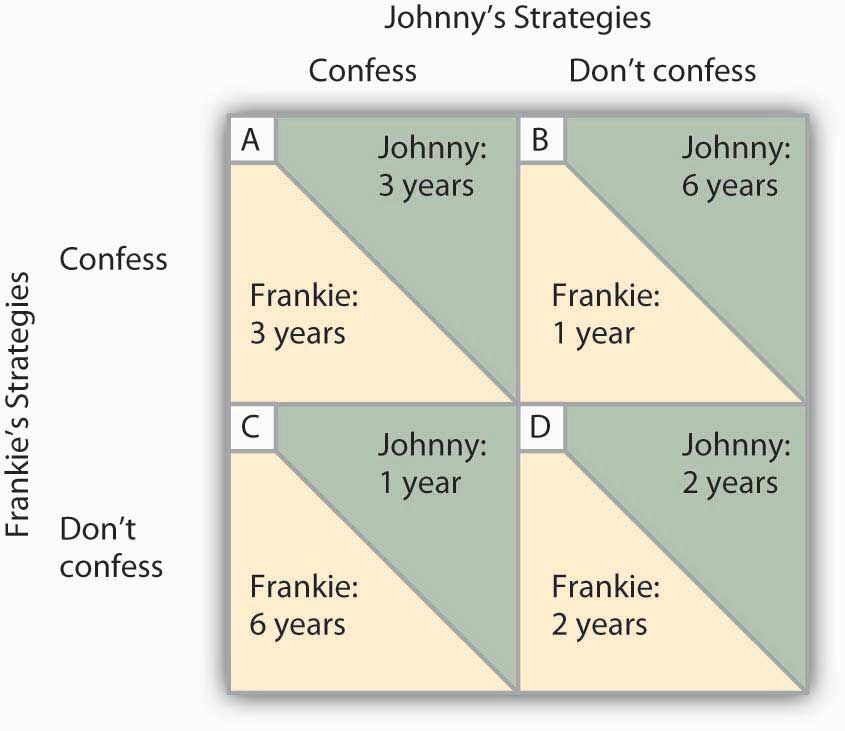
The Prisoners’ Dilemma

Suppose a local district attorney (DA) is certain that two individuals, Frankie and Johnny, have committed a
burglary, but she has no evidence that would be admissible in court.+

The DA arrests the two. On being searched, each is discovered to have a small amount of cocaine. The DA
now has a sure conviction on a possession of cocaine charge, but she will get a conviction on the burglary
charge only if at least one of the prisoners confesses and implicates the other.+

The DA decides on a strategy designed to elicit confessions. She separates the two prisoners and then
offers each the following deal: “If you confess and your partner doesn’t, you will get the minimum sentence
of one year in jail on the possession and burglary charges. If you both confess, your sentence will be three
years in jail. If your partner confesses and you do not, the plea bargain is off and you will get six years in
prison. If neither of you confesses, you will each get two years in prison on the drug charge.”+

The two prisoners each face a dilemma; they can choose to confess or not confess. Because the prisoners
are separated, they cannot plot a joint strategy. Each must make a strategic choice in isolation.+

The outcomes of these strategic choices, as outlined by the DA, depend on the strategic choice made by the
other prisoner. The payoff matrix for this game is given in Figure 11.6, “Payoff Matrix for the Prisoners’
Dilemma”. The two rows represent Frankie’s strategic choices; she may confess or not confess. The two
columns represent Johnny’s strategic choices; he may confess or not confess. There are four possible
outcomes: Frankie and Johnny both confess (cell A), Frankie confesses but Johnny does not (cell B), Frankie
does not confess but Johnny does (cell C), and neither Frankie nor Johnny confesses (cell D). The portion at
the lower left in each cell shows Frankie’s payoff; the shaded portion at the upper right shows Johnny’s
payoff.+

Figure 11.6. Payoff Matrix for the Prisoners’ Dilemma
The four cells represent each of the possible outcomes of the prisoners’ game.

+

If Johnny confesses, Frankie’s best choice is to confess—she will get a three-year sentence rather than the
six-year sentence she would get if she did not confess. If Johnny does not confess, Frankie’s best strategy is
still to confess—she will get a one-year rather than a two-year sentence. In this game, Frankie’s best
strategy is to confess, regardless of what Johnny does. When a player’s best strategy is the same regardless
of the action of the other player, that strategy is said to be a dominant strategy. Frankie’s dominant
strategy is to confess to the burglary.+

For Johnny, the best strategy to follow, if Frankie confesses, is to confess. The best strategy to follow if
Frankie does not confess is also to confess. Confessing is a dominant strategy for Johnny as well. A game in
which there is a dominant strategy for each player is called adominant strategy equilibrium. Here, the
dominant strategy equilibrium is for both prisoners to confess; the payoff will be given by cell A in the
payoff matrix.+
From the point of view of the two prisoners together, a payoff in cell D would have been preferable. Had
they both denied participation in the robbery, their combined sentence would have been four years in
prison—two years each. Indeed, cell D offers the lowest combined prison time of any of the outcomes in the
payoff matrix. But because the prisoners cannot communicate, each is likely to make a strategic choice that
results in a more costly outcome. Of course, the outcome of the game depends on the way the payoff
matrix is structured.+

Repeated Oligopoly Games

The prisoners’ dilemma was played once, by two players. The players were given a payoff matrix; each
could make one choice, and the game ended after the first round of choices.+

The real world of oligopoly has as many players as there are firms in the industry. They play round after
round: a firm raises its price, another firm introduces a new product, the first firm cuts its price, a third firm
introduces a new marketing strategy, and so on. An oligopoly game is a bit like a baseball game with an
unlimited number of innings—one firm may come out ahead after one round, but another will emerge on
top another day. In the computer industry game, the introduction of personal computers changed the rules.
IBM, which had won the mainframe game quite handily, struggles to keep up in a world in which rivals
continue to slash prices and improve quality.+

Oligopoly games may have more than two players, so the games are more complex, but this does not
change their basic structure. The fact that the games are repeated introduces new strategic considerations.
A player must consider not just the ways in which its choices will affect its rivals now, but how its choices
will affect them in the future as well.+

We will keep the game simple, however, and consider a duopoly game. The two firms have colluded, either
tacitly or overtly, to create a monopoly solution. As long as each player upholds the agreement, the two
firms will earn the maximum economic profit possible in the enterprise.+

There will, however, be a powerful incentive for each firm to cheat. The monopoly solution may generate
the maximum economic profit possible for the two firms combined, but what if one firm captures some of
the other firm’s profit? Suppose, for example, that two equipment rental firms, Quick Rent and Speedy Rent,
operate in a community. Given the economies of scale in the business and the size of the community, it is
not likely that another firm will enter. Each firm has about half the market, and they have agreed to charge
the prices that would be chosen if the two combined as a single firm. Each earns economic profits of
$20,000 per month.+

Quick and Speedy could cheat on their arrangement in several ways. One of the firms could slash prices,
introduce a new line of rental products, or launch an advertising blitz. This approach would not be likely to
increase the total profitability of the two firms, but if one firm could take the other by surprise, it might
profit at the expense of its rival, at least for a while.+

We will focus on the strategy of cutting prices, which we will call a strategy of cheating on the duopoly
agreement. The alternative is not to cheat on the agreement. Cheating increases a firm’s profits if its rival
does not respond. Figure 11.7, “To Cheat or Not to Cheat: Game Theory in Oligopoly” shows the payoff
matrix facing the two firms at a particular time. As in the prisoners’ dilemma matrix, the four cells list the
payoffs for the two firms. If neither firm cheats (cell D), profits remain unchanged.+

Figure 11.7. To Cheat or Not to Cheat: Game Theory in Oligopoly

Two rental firms, Quick Rent and Speedy Rent, operate in a duopoly market. They have
colluded in the past, achieving a monopoly solution. Cutting prices means cheating on the
arrangement; not cheating means maintaining current prices. The payoffs are changes in
monthly profits, in thousands of dollars. If neither firm cheats, then neither firm’s profits will
change. In this game, cheating is a dominant strategy equilibrium.

+
This game has a dominant strategy equilibrium. Quick’s preferred strategy, regardless of what Speedy does,
is to cheat. Speedy’s best strategy, regardless of what Quick does, is to cheat. The result is that the two
firms will select a strategy that lowers their combined profits!+

Quick Rent and Speedy Rent face an unpleasant dilemma. They want to maximize profit, yet each is likely to
choose a strategy inconsistent with that goal. If they continue the game as it now exists, each will continue
to cut prices, eventually driving prices down to the point where price equals average total cost (presumably,
the price-cutting will stop there). But that would leave the two firms with zero economic profits.+

Both firms have an interest in maintaining the status quo of their collusive agreement. Overt collusion is one
device through which the monopoly outcome may be maintained, but that is illegal. One way for the firms
to encourage each other not to cheat is to use a tit-for-tat strategy. In a tit-for-tat strategy a firm
responds to cheating by cheating, and it responds to cooperative behavior by cooperating. As each firm
learns that its rival will respond to cheating by cheating, and to cooperation by cooperating, cheating on
agreements becomes less and less likely.+

Still another way firms may seek to force rivals to behave cooperatively rather than competitively is to use
a trigger strategy, in which a firm makes clear that it is willing and able to respond to cheating by
permanently revoking an agreement. A firm might, for example, make a credible threat to cut prices down
to the level of average total cost—and leave them there—in response to any price-cutting by a rival. A
trigger strategy is calculated to impose huge costs on any firm that cheats—and on the firm that threatens
to invoke the trigger. A firm might threaten to invoke a trigger in hopes that the threat will forestall any
cheating by its rivals.+

Game theory has proved to be an enormously fruitful approach to the analysis of a wide range of problems.
Corporations use it to map out strategies and to anticipate rivals’ responses. Governments use it in
developing foreign-policy strategies. Military leaders play war games on computers using the basic ideas of
game theory. Any situation in which rivals make strategic choices to which competitors will respond can be
assessed using game theory analysis.+

One rather chilly application of game theory analysis can be found in the period of the Cold War when the
United States and the former Soviet Union maintained a nuclear weapons policy that was described by the
acronym MAD, which stood for mutually assured destruction. Both countries had enough nuclear weapons
to destroy the other several times over, and each threatened to launch sufficient nuclear weapons to
destroy the other country if the other country launched a nuclear attack against it or any of its allies. On its
face, the MAD doctrine seems, well, mad. It was, after all, a commitment by each nation to respond to any
nuclear attack with a counterattack that many scientists expected would end human life on earth. As crazy
as it seemed, however, it worked. For 40 years, the two nations did not go to war. While the collapse of the
Soviet Union in 1991 ended the need for a MAD doctrine, during the time that the two countries were rivals,
MAD was a very effective trigger indeed.+

Of course, the ending of the Cold War has not produced the ending of a nuclear threat. Several nations now
have nuclear weapons. The threat that Iran will introduce nuclear weapons, given its stated commitment to
destroy the state of Israel, suggests that the possibility of nuclear war still haunts the world community.+
K E Y        T A K E A W A Y S

•    The key characteristics of oligopoly are a recognition that the actions of one firm will produce a response
     from rivals and that these responses will affect it. Each firm is uncertain what its rivals’ responses might
     be.+

•    The degree to which a few firms dominate an industry can be measured using a concentration ratio or a
     Herfindahl–Hirschman Index.+

•    One way to avoid the uncertainty firms face in oligopoly is through collusion. Collusion may be overt, as in
     the case of a cartel, or tacit, as in the case of price leadership.+

•    Game theory is a tool that can be used to understand strategic choices by firms.+

•    Firms can use tit-for-tat and trigger strategies to encourage cooperative behavior by rivals.+

     +
                                                   T R Y        I T !

     Which model of oligopoly would seem to be most appropriate for analyzing firms’ behavior in each of the
     situations given below?+

1.   When South Airlines lowers its fare between Miami and New York City, North Airlines lowers its fare
     between the two cities. When South Airlines raises its fare, North Airlines does too.+

2.   Whenever Bank A raises interest rates on car loans, other banks in the area do too.+

3.   In 1986, Saudi Arabia intentionally flooded the market with oil in order to punish fellow OPEC members for
     cheating on their production quotas.+

4.   In July 1998, Saudi Arabia floated a proposal in which a group of eight or nine major oil-exporting countries
     (including OPEC members and some nonmembers, such as Mexico) would manage world oil prices by
     adjusting their production.+

     +
     Case in Point: Memory Chip Makers Caught in Global Price-Fixing Scheme

     Figure 11.8.
+ It may have been the remark by T.L. Chang, vice president of the Taiwan-based memory chip manufacturer Mosel-Vitelic that sparked the investigation by the U.S. Department of Justice Antitrust Division. Mr. Chang was quoted in Taiwan’sCommercial Times in May 2002 as admitting to price-fixing meetings held in Asia among the major producers of DRAM, or dynamic random access memory. DRAM is the most common semi-conductor main memory format for storage and retrieval of information that is used in personal computers, mobile phones, digital cameras, MP3 music players, and other electronics products. At those meetings, as well as through emails and telephone conferences, the main manufacturers of DRAM decided not only what prices to charge and how much to make available, but also exchanged information on DRAM sales for the purpose of monitoring and enforcing adherence to the agreed prices. The collusion lasted for three years—from 1999 to 2002. In December 2001, DRAM prices were less than $1.00. By May of 2002, price had risen to the $4 to $5 range.+ The companies that were directly injured by the higher chip prices included Dell, Compaq, Hewlett-Packard, Apple, IBM, and Gateway. In the end, though, the purchasers of their products paid in the form of higher prices or less memory.+ In December 2003, a Micron Technology sales manager pled guilty to obstruction of justice and served six months of home detention. The first chipmaker to plead guilty a year later was Germany-based Infineon Technologies, which was fined $160 million. As of September 2007, five companies, Samsung being the largest, had been charged fines of more than $732 million, and over 3,000 days of jail time had been meted out to eighteen corporate executives.+
The sharp reduction in the number of DRAM makers in the late 1990s undoubtedly made it easier to collude. The
     industry is still quite concentrated with Samsung holding 27.7% of the market and Hynix 21.3%. The price,
     however, has fallen quite sharply in recent years.+

     +
                   A N S W E R S             T O      T R Y       I T !      P R O B L E M S

1.   North Airlines seems to be practicing a price strategy known in game theory as tit-for-tat.+

2.   The banks could be engaged in tacit collusion, with Bank A as the price leader.+

3.   Saudi Arabia appears to have used a trigger strategy, another aspect of game theory. In general, of course,
     participants hope they will never have to “pull” the trigger, because doing so harms all participants. After
     years of cheating by other OPEC members, Saudi Arabia did undertake a policy that hurt all members of
     OPEC, including itself; OPEC has never since regained the prominent role it played in oil markets.+

4.   Saudi Arabia seems to be trying to create another oil cartel, a form of overt collusion.+

     +

     [22]
            One legal cartel is the NCAA, which many economists regard as a successful device through which
     member firms (colleges and universities) collude on a wide range of rules through which they produce
     sports.
You can also read


