Economic Contribution of the Sport Horse Industry to the Irish Economy - School of Agriculture and Food Science
←
→
Page content transcription
If your browser does not render page correctly, please read the page content below
fa

     School of Agriculture and Food Science

     Economic Contribution
                   of the
     Sport Horse Industry to
         the Irish Economy

0
Contents
Introduction .......................................................................................................................... 3
    Summary Findings ............................................................................................................. 3
    Background ....................................................................................................................... 3
    Government Support ......................................................................................................... 4
    Executive Summary by Dr Alan Fahey (UCD) ...................................................................... 5
    Research ............................................................................................................................ 5
1      Report Methodology ...................................................................................................... 6
    1.1       Areas for study ........................................................................................................ 6
    1.2       Methodology and Study Design............................................................................... 6
    1.3       Data Collection and Analysis ................................................................................... 7
2      Sport Horse Population .................................................................................................. 9
    2.1       Introduction ............................................................................................................ 9
    2.2       Central Statistics Office data ................................................................................... 9
       2.2.1        CSO Data Summary ........................................................................................ 11
    2.3       Equine registration data ........................................................................................ 11
       2.3.1        Studbook Registered Breeding Population - Broodmares and Foals ............... 12
       2.3.2        Non-studbook Documented Breeding Population - Broodmares and Foals .... 13
       2.3.3        Stallions ......................................................................................................... 13
       2.3.4        Total Registered Population in the Breeding Sector ....................................... 13
    2.4       Affiliated Competition Population ......................................................................... 13
    2.5       Leisure Sector Population ..................................................................................... 14
    2.6       Estimated Total Sport Horse Population ................................................................ 15
3      Study Findings on Expenditure ..................................................................................... 16
    3.1       Breeding ............................................................................................................... 16
       3.1.1        Breeders' Expenditure.................................................................................... 18
    3.2       Competition Sector Expenditure ........................................................................... 23
       3.2.1        International Equestrian Competition in Ireland ............................................ 24
       3.2.2        Total Competition Sector ............................................................................... 24
    3.3       Equestrian Leisure Sector Expenditure .................................................................. 25
    3.4       Hunting Expenditure ............................................................................................. 25
       3.4.1        Fox Hunting.................................................................................................... 25

                                                                                                                                         1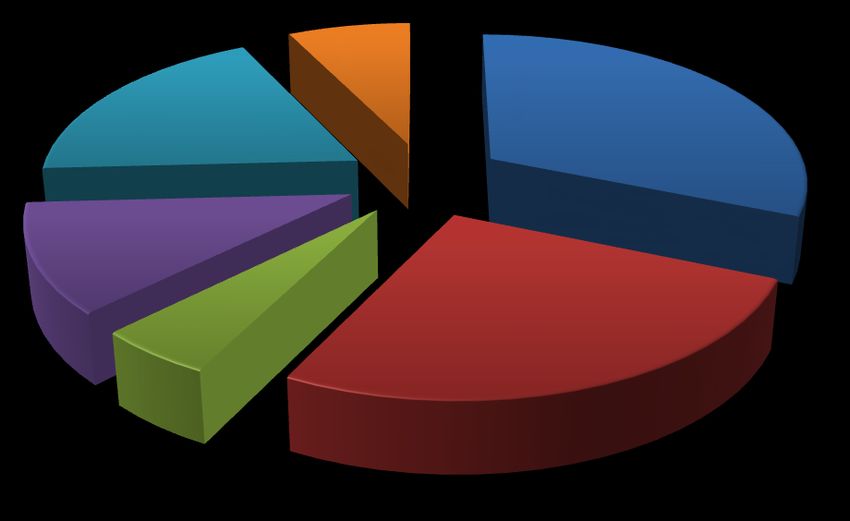
3.4.2        Mounted Hunting with Harrier Hounds .......................................................... 25
      3.4.3        Ward Union Stag Hunt ................................................................................... 25
      3.4.4        Frequency and Attendance during Hunt Meetings in 2007 ............................. 26
      3.4.5        Expenditure by Participants involved in Hunting: Mounted followers ............ 27
      3.4.6        Total Expenditure by Participants involved in Hunting with Hounds ............... 28
      3.4.7        Employment by Hunts.................................................................................... 29
      3.4.8        Aggregate Hunting Expenditure ..................................................................... 29
    3.5     Showing and Country Shows Expenditure ............................................................. 30
    3.6     Equestrian Inter-schools Ireland............................................................................ 33
    3.7     AIRE Equestrian Centre Expenditure ..................................................................... 34
    3.8     Riding Club Expenditure ........................................................................................ 37
    3.9     Pony Club Expenditure .......................................................................................... 38
    3.10 Leisure horses maintenance costs ......................................................................... 38
    3.11 Structured Leisure Sector - Total Expenditure ....................................................... 38
4     External Sport Horse Trade .......................................................................................... 40
    4.1     External Trade....................................................................................................... 40
      4.1.1        Central Statistics Office data .......................................................................... 40
      4.1.2        Sales at auction .............................................................................................. 40
      4.1.3        Private sales and total value of horse transactions ......................................... 42
5     Employment within the Irish Sport Horse industry ....................................................... 44
    5.1     Direct Employment ............................................................................................... 44
    5.2     Breeding Sector Employment ................................................................................ 45
    5.3     Competition Sector Employment .......................................................................... 46
    5.4     Leisure Sector Employment................................................................................... 46
    5.5     Additional Employment......................................................................................... 47
    5.6     Involvement .......................................................................................................... 47
6     Aggregate Contribution to the Economy of the Irish Sport Horse industry ................... 48
7     Acknowledgements and Disclaimer .............................................................................. 50
8     Bibliography ................................................................................................................. 51

2
Introduction
Summary Findings
1. The contribution of the Irish Sport Horse industry to the Irish economy is in excess of
€708 million per annum.
2. There are 12,512 full-time job equivalents in the Irish Sport Horse industry, of which
11,417 are directly employed.
3. There are 47,096 people involved in the Sport Horse sector and it was estimated that
involvement with sport horses contributes to the household income of 29,295
people.
4. The current Sport Horse population is estimated at 124,000 animals in Ireland.
5. Expenditure specifically on goods and services has increased to €454 million in 2012
from €400 million estimated in the Profile of the Industry Report in 2007.
6. Breeding is the largest sector and accounts for a total expenditure of €226 million
(32%) within the economy and there are 15,110 active breeders in the Irish Sport
Horse sector.
7. The competition sector accounted for €135 million expenditure in the Sport Horse
sector.
8. A total of €119 million is spent within the affiliated leisure sector, of which €35
million is expenditure on showing and country shows.
9. A total of 6,599 sport horses to the value of €26,100,062 were exported in 2011,
with net exports amounting to €15.9 million.
10. There are 11,900 equine classes held at national country shows each year, helping to
attract over 270,000 spectators of which 5% attend from overseas.
Background
This report was commissioned by Horse Sport Ireland (HSI) and has been funded by the
National Development Plan 2007-2013. The objective of this report was to evaluate the
economic impact of the Sport Horse industry in Ireland in 2012 and to chart the progress of
the industry in recent years.
3This report is the third in a series of collaborations between UCD and the Irish Sport Horse industry. In 1996, the UCD Corbally report evaluated the contribution of the Sport Horse industry to the Irish economy for the first time. In 2007, the UCD Quinn & Hennessy report profiled the Sport Horse industry including a detailed profile of direct expenditure on goods and services. It was estimated that annual expenditure on goods and services within the Sport Horse industry in Ireland was over €400 million in 2005. In addition to its formal and structured elements, the sport horse industry has significant informal and unstructured elements. For the study the sources of data were confined to the formal, structured elements of the industry so as to provide well-founded and trustworthy inputs and to provide a firm basis for any evaluation of the industry as a whole. The definition of sport horses adopted for the purpose of this study was: The sport horse is a riding horse or pony of a single breed or a combination of breeds used for, or intended to be used for, recreational and competitive activities other than racing. The economic contribution of the Sport Horse industry estimated in this report refers to the contribution made by the industry to the Irish Economy in 2012. Information relating to sport horse industry activities in 2012 was used whenever possible and where such information was not available estimates were used based on 2011 data. Government Support Horse Sport Ireland (HSI) was established on 1 st January 2008 from the amalgamation of the Equestrian Federation of Ireland (EFI) and the Irish Horse Board (IHB). HSI is a 32-county body and is a limited company run by a board of directors made up of 19 members nominated by the various Affiliate Bodies. The 22 Affiliate Bodies are: Army Equitation School (Dept. of Defence), Association of Irish Riding Clubs (AIRC), Association of Irish Riding Establishments (AIRE), Carriage Driving Section of HSI, Dressage Ireland (DI), Eventing Ireland (EI), Federation of Irish Polo Clubs (FIPC), Hunting Association of Ireland (HAI), Irish Long Distance Riding Association (ILDRA), Irish Polocrosse Association (IPA), Irish Pony Club (IPC), Irish Pony Society (IPS), Irish Shows Association (ISA), Irish Universities Riding Clubs Association (IURCA), Medical Equestrian Association (MEA), Para Equestrian Ireland (PEI), Pentathlon Ireland, Reining & Western Section of HSI, Riding for the Disabled Association of Ireland (RDAI), Royal Dublin Society (RDS), Showjumping Ireland (SJI), TREC Ireland (Tourism Related Equestrian Competitions). HSI has responsibility for both the sport and breeding sectors and accordingly is in receipt of funds from the Department of Agriculture, Food and the Marine (DAFM) and the Department of Transport, Tourism and Sport, through the Irish Sports Council (ISC). DAFM transferred responsibility for maintaining the Irish Horse Register (Irish Sport Horse and Irish Draught Horse Studbooks) to HSI in July 2008. 4
The budget income for HSI of  €4.638m  in  2012  consists  of  €2.957m  (63%)  Exchequer  funds
and  €1.681m  (37%)  generated  from  earned income as shown in the table 1-1. HSI’s  overall
budget  has  declined  by  30.5%  since  2008  (decrease  of  €2.04m)  due  to  a  reduction  in  state
funds by 31.4% and a decline in own income by 32.6%.

Table 1-1 Budget income for Horse Sport Ireland in 2012

                       2008               2009               2010              2011             2012*
Breeding
DAFM1 funds          €2.547m            €2.097m            €1.855m           €1.781m           €1.670m
Own Income           €1.648m            €1.220m            €1.190m           €1.171m           €1.062m
                     €4.195m            €3.317m            €3.075m           €2.952m           €2.732m
Sport
ISC2 Grant           €1.767m            €1.589m            €1.490m           €1.368m           €1.287m
Own Income           €0.848m            €0.682m            €0.776m           €0.594m           €0.619m
                     €2.615m            €2.271m            €2.266m           €1.962m           €1.906m

Total Income     €6.681m          €5.588m        €5.341m        €4.914m      €4.638m
1                                               2                     *
  Department of Agriculture, Food and the Marine Irish Sports Council budget figure

Executive Summary by Dr Alan Fahey (UCD)
This report was commissioned to determine the contribution made by the Irish Sport Horse
industry to the economy. The findings of this report show that the Sport Horse industry
provides  a  major  contribution  in  excess  of  €708 million to the Irish economy and provides
12,512 jobs in the sport horse breeding, competition and leisure sectors. This has been
achieved with a relatively  low  level  of  investment  of  €3 million per annum from the
Government.

In order to grow the Irish Sport Horse industry in both domestic and global markets, an
increase in financial investment from the Government is essential. In a time of economic
recession the Sport Horse industry provides the Government with an excellent opportunity
to yield a high return for their investment and increase employment in rural Ireland.

Research
This report was prepared under the guidance of Dr Alan Fahey, UCD School of Agriculture
and Food Science. It was managed and authored by Alison Corbally and Katherine Quinn
Brady with research assistance from Deirdre Harty and Christine Cummins.

The report was commissioned by HSI and was funded by the National Development Plan
2007-2013.

November 2012.

                                                                                                        5
1 Report Methodology
1.1 Areas for study
A study of the structures in the sport horse industry readily identified four distinct areas:
breeding, competition, leisure and employment.
The breeding, competition and leisure areas each have a distinctive structure with their own
affiliated bodies. For these three areas the study was confined to registered animals and
establishments.
Figure 1-1 Structured Elements of the Sport Horse Industry
• Show jumping
• Population • Eventing
dynamics • Dressage
• Breeders
• Employment
BREEDING COMPETITION
EXPORTS
LEISURE EMPLOYMENT
• Hunting • Direct
• Showing • Indirect
• Riding establishments
• Riding & pony clubs
• Equestrian Inter-
schools
1.2 Methodology and Study Design
In assessing the economic contribution of a sector to the national economy three
established approaches can be considered: income or output or expenditure.
6Income - The value of all incomes received by individuals and firms
Output - The value of all types of production (products and services)
Expenditure - Total expenditure on goods and services
Conceptually each of these economic approaches produces the same value. Each approach
has its own strengths and weaknesses in accessibility and processing of data, and the
selection for a particular study is determined by the circumstances of the case. For this
study the determining factor was the feasibility of obtaining reliable data.
While the output approach may initially appear to be the most appropriate method, there
are serious difficulties in obtaining basic data. As regards the ’product value’ element, it is
widely believed that the majority of higher priced animals are sold privately in both
domestic and export transactions, and that, therefore, public sales results reflect the less
valuable end of the market. Consequently the available data are not reliably representative
of the total product value. In relation to the value of the services element of output, data of
service suppliers’ income is not in the public domain and is a notoriously sensitive and
unsatisfactory area for survey methods.
Those latter considerations also ruled out the income approach as a basis for the study.
Therefore, the expenditure approach was selected as the most effective approach to assess
the economic contribution of the sport horse industry to the Irish economy. It was judged
that responses to queries about expenditure would be less affected by defensive attitudes
and statistical problems than either income or output approaches.
1.3 Data Collection and Analysis
The main methods of data collection were postal and phone questionnaires and surveys.
The breeding, competition and leisure sectors of the industry each received a specifically
designed questionnaire relating to the expenditure involved in their particular area.
Following a review of the relevant literature the data headings were selected and
appropriate questions were devised and confined to unambiguous factual matter. To ensure
reliability, questions were tested on a small sample prior to general issue, and were refined
as necessary.
The breeders’ questionnaire was distributed to current members of the Irish Horse Board (a
total of 1,200 questionnaires were returned). Data were also collected by questionnaire
about the main sport horse competition activities of show jumping and eventing.
Showjumping Ireland (SJI) and Eventing Ireland (EI) co-operated by identifying their
members over 18 years of age, and one hundred percent of this list was surveyed. The
Association of Irish Riding Establishments (AIRE) provided a list of approved equestrian
centres who each received a postal questionnaire. For the purpose of this study data were
collected in the form of surveys from spectators and horse exhibitors at Irish Shows
7Association (ISA) country shows (a total of 521 surveys were collected) and the results were extrapolated to determine national expenditure in the country show sector. The data collected to establish spectator and exhibitor expenditure included travel and accommodation costs, expenditure at the show and the number of accompanying people. Similar questionnaires were distributed to collect information from riding club and pony club secretaries. From the questionnaire results, national values were extrapolated for the total affiliated and registered population for each sector and the sum of these national values provides the value of overall expenditure for the structured element of the industry in 2012. The net value of sport horse exports (exports minus imports) was added. The net value of sport horse exports does not include the value of exports of equine-related goods and services, e.g. feed exports, coaching services, and therefore is an underestimation. In addition to the expenditure value, the research data provided the basis for estimating the extent and value of employment in each sector, and in the industry as a whole. 8
2    Sport Horse Population

    2.1 Introduction
As a prerequisite to the study of the economic contribution of the sectors of the sport horse
industry, an attempt was made to identify the total sport horse population together with a
breakdown across the three sectors – breeding, competition and leisure. As no single source
of adequate data for the purpose exists, in addition to the survey data in the study, a
number of areas were examined:

        Central Statistics Office data (CSO);
        Equine studbook registration data from DAFM and the Irish Horse Register (IHR);
        and,
        Equine competition and leisure organisation data.

    2.2 Central Statistics Office data
The most accessible source of information is the CSO. The CSO conducted the last relevant
full Agricultural Census in 2010, drawing information from all operational farms in the
country. A farm is defined by CSO as:

        "a single unit both technically and economically, which has a single

        management and which produces agricultural products .. Agricultural

        production covers the growing of all crops and the raising of all livestock".

        (CSO, 2010)

Additionally, the CSO (1991) classifies the horses most directly relevant to this study in a
category called ‘Other’ which includes all non-thoroughbred horses and ponies.

There are three sources of information on the size of the overall population in Ireland from
the CSO:

        The Crops and Livestock Survey carried out in June each year;
        The Farm Structure Survey carried out a number of times between each full census
        and last carried out in 2007;
        The Census of Agriculture carried out approximately every 10 years and last carried
        out in 2010.

                                                                                               9
Table 2-1 CSO Statistics - Estimates of the horse and pony population in Ireland in 2011
Region County Horse Population
Border Cavan 13,300
Donegal
Leitrim
Louth
Monaghan
Sligo
Midlands Laois 10,000
Longford
Offaly
Westmeath
West Galway 21,200
Mayo
Roscommon
Dublin and Mid-East Dublin 14,100
Kildare
Meath
Wicklow
Mid-West Limerick 14,100
Clare
Tipperary North
South East Waterford 19,600
Carlow
Kilkenny
Wexford
Tipperary South
South West Cork 13,700
Kerry
Total 106,000
Although the CSO data has been the most consistent data available, not all horse owners are
farmers and hence the recorded data under-represents the true value for the sport horse
population. The highest concentration of horses was in the West region with large
concentrations also found in the South-East region.
The horse population increased dramatically since 2005 (Figure 2-1) having been relatively
stable for a number of years. Current estimates indicate that this rise in population has now
leveled off and is likely to be due to a combination of a reduction in foaling rates and an
10increase in equine slaughter rates. The proportion of the horse population made up of
Thoroughbred horses has fallen from a high of 44% in 2005 to 35% in 2011. Consequently, it
is estimated that sport horses now make up approximately two-thirds of the horse
population in Ireland.
Figure 2-1 Changes in horse population between 2000 and 2011 including a breakdown into Thoroughbred
and Other horses
120000
100000
80000
No. of horses
60000
40000
20000
0
2000 2001 2002 2003 2004 2005 2006 2007 2008 2009 2010 2011
CSO All horses CSO Thoroughbred horses CSO Other horses
2.2.1 CSO Data Summary
The CSO equine population data provides the overall picture annually, but identification of
the sport horse element is less satisfactory. For the particular needs of this study it is
insufficiently detailed on the distribution of the sport horse population across the breeding,
competition and leisure sectors. Consequently, additional data were examined from the
other sources mentioned above and some survey data from the study itself was also taken
into consideration.
2.3 Equine registration data
There are two registration methods available within the sport horse sector. The majority of
horses are registered with pedigree in DAFM approved studbooks, however, a number of
breeders opt to receive identity documents. Within the industry, studbook passports are
commonly referred to as ’green books’ while identity documents are referred to as ‘white
books’.
11The size of the breeding sector of the sport horse population in Ireland was determined
through an analysis of the horse numbers within the studbook registered sector (section
2.3.1) and the identity documented sector (section 2.3.2).
2.3.1 Studbook Registered Breeding Population - Broodmares and Foals
Estimates of the breeding population were derived from data in the Irish Horse Register
(lHR), currently maintained by HSI, data received from DAFM for studbooks operating under
their approval and responses to the breeder survey.
The main categories of horses within the breeding sector are broodmares, youngstock and
stallions.
Table 2-2 Foal registrations in approved studbooks in 2011
Number of foals Estimated number of
active broodmares
Irish Horse Register1 5,285 11,245
Connemara 3,204 6,817
Warmblood Studbook of Ireland 31 66
Irish Cob Society Pure-bred studbook 288 613
Irish Cob Society Part-bred studbook 38 81
Irish Piebald & Skewbald Society 433 921
Irish Pony Society 25 53
Appaloosa 10 21
Kerry Bog Pony 5 11
Miniature Horse 5 11
Total in approved studbooks in 2011 9,324 19,839
Total in approved studbooks in 2005 9,311 22,000
1
The Irish Horse Register includes the Irish Sport Horse Studbook and the Irish Draught Horse Studbook
The number of foals registered in 2011 in studbooks approved by the DAFM was 9,324
across 11 studbooks. The breakdown is shown in Table 2-2. As all broodmares in the sport
horse population are not covered each year and not all foals are born alive and registered
immediately, the total number of broodmares is higher than the number of foals registered.
The ratio of foals to broodmares on a holding was estimated using breeder survey responses
and registration data, and based on this the number of broodmares in the studbook
registered breeding sector is estimated to be approximately 20,000. Foal registration levels
are similar to those observed in 2005. The change in the estimate of the number of
broodmares since 2005 reflects the implementation of mandatory horse registrations,
whereby foals are more likely to be registered at birth than was the case in 2005.
122.3.2 Non-studbook Documented Breeding Population - Broodmares and Foals
Owners may opt for less informative identity documents for their horses. Based on trends
in the issue of identity documents (white books) by HSI over the last number of years, it is
estimated that the number of identity documents likely to be issued for horses born in 2011
will be 4,153 out of an estimated 8,834 broodmares. This figure is likely to be
underestimated as it does not include identity documents issued by other agencies or the
portion of the sport horse population that does not meet the mandatory registration
requirements.
Based on these figures, when mortality and exports are taken into account, it is estimated
that the documented sport horse foal population in Ireland for 2011 is 13,477 with a
broodmare population of 28,673 and a total youngstock population of 42,864 horses up to
three years of age.
2.3.3 Stallions
Accurate measurement of the number of sport horse stallions and colts used for breeding in
Ireland is difficult outside of the studbook registered sector, as their availability may not be
known: for example, they may be dead, infertile, exported or unavailable for breeding due
to competitive activities or some other reason. Based on the breeders’ survey, however, it
is estimated that there are 1,812 stallions standing in Ireland.
2.3.4 Total Registered Population in the Breeding Sector
For the purpose of this study the total registered sport horse population in the breeding
sector is taken to consist of stallions, mares, foals, yearlings, two year olds and three year
olds. From the information above, the overall 2011 total registered breeding population is
73,349 sport horses.
2.4 Affiliated Competition Population
Competition is the second area where organisations are an important source of data.
The principal competition organisations are:
• Showjumping Ireland (SJI)
• Eventing Ireland (EI)
• Dressage Ireland (DI)
The data obtained from the affiliates were adjusted to take account of any duplication
between the competition and breeding sector, it was also adjusted to reflect horses found
to be competing in more than one discipline.
13Table 2-3 Affiliated competition population - adjusted for duplication with breeding and competition sectors
Owners Horses Ponies Total Horses &
Ponies
6,470 7,419 2,935 10,354
The overall 2011 total registered competition population is 10,354 sport horses.
2.5 Leisure Sector Population
For horses in the leisure sector registration with an affiliate is not obligatory, and as a
consequence the data available from the relevant associations is not comprehensive. The
sources of data used in arriving at an estimate were the surveys of AIRE, AIRC and IPC
members.
The results of the survey of equestrian centres estimates a national figure of 3,006 horses
when extrapolated for the total number of approved equestrian centres.
The survey of riding clubs that are members of AIRC provided an estimate of the number of
horses whose primary usage was in riding club events. This provided an estimate of 1,760
horses. This estimate has been adjusted to avoid duplication arising from horses that may
be registered for both riding club and affiliated competition activities.
In addition to this estimate, survey results indicated that there is an estimated 24,629 sport
horses between the hunting, showing and unaffiliated leisure sectors and 6,487
retired/recuperating horses. These categories include horses documented at birth but that
are outside the breeding and affiliated competition and leisure sectors.
The overall total from the above is 35,882 sport horses in the leisure sector.
142.6 Estimated Total Sport Horse Population
The overall estimate of horses in each sector is outlined in Table 2-4. In addition, survey
responses indicated that 4% of the horses owned by members of affiliated organisations are
unregistered. This represents a total of 4,783 horses. The number of unregistered horses
with unaffiliated owners has not been estimated or included in this study.
Table 2-4 Total Sport Horse Population
Category No. of horses and
ponies
Breeding sector
Broodmares 28,673
Youngstock 42,864
Stallions 1,812
Breeding sector total 73,349
Competition sector
Affiliated SJI, EI & DI 10,354
Competition sector total 10,354
Leisure sector
AIRE 3,006
AIRC 1,760
Hunting, showing, other 31,116
Leisure sector total 35,882
Unregistered horses with affiliated 4,783
owners
National Total 124,368
The sport horse population estimated by the study is 124,368. This estimate is considerably
higher than the ’other horse’ population from the CSO population estimates. The most likely
explanation for the disparity is in the CSO definition of a farm, which excludes many
equestrian establishments and non-farming horse owners.
153 Study Findings on Expenditure
The results of the study are shown in summary form below under the individual sectors.
3.1 Breeding
The breeders who replied to the postal questionnaire provided information on the numbers
of broodmares kept and the numbers by breed of horses kept up to three years of age.
The average number of broodmares kept by respondents was 2.8. The average number of
animals (including broodmares, youngstock and stallions) kept by each breeder on the
premises was 5.13 animals. It was estimated that there are 15,110 active (bred a foal within
last three years) sport horse breeders in Ireland.
The age profile and the length of ownership profile of breeders identified through the
questionnaires are shown in Figure 3-1 and Figure 3-2.
Figure 3-1 Age profile of breeders
30
25
20
15
10
5
0
under 20 20 -30 years 31-40 years 41-50 years 51-60 years 60+ years
% 1.4 6.7 16.1 26.0 27.1 22.7
Results from the questionnaire showed that only 8.1% of breeders were less than 30 years
of age and almost 23% were over 60 years of age. This is similar to the age profile of farm
holders, of whom 26.3% were over 65 years of age in 2010 (CSO Agricultural Labour Input
Report, 2010). The length of ownership profile showed that only 4.62% of breeders had
owned horses for less than five years and that 83% have owned horses for more than 10
years.
16Figure 3-2 Length of horse ownership profile for breeders surveyed
100
80
60
40
20
0
More than 10
less than 5 years 5 to 10 years
years
% 4.62 12.84 82.54
Breeders were asked to indicate which disciplines they were aiming to breed their foals for.
Figure 3-3 Breeding objectives of broodmare owners
7%
19% 31% Show Jumping
Eventing
Dressage
12% Showing
Leisure
5%
26%
Other
173.1.1 Breeders' Expenditure
The data requested related to the costs per breeder for 2012 and was based on the
broodmare unit, i.e. one mare and her progeny. The total contribution to the economy from
all 15,110 breeders currently active was extrapolated from the sample questionnaire data.
The breeding sector included expenditure on horses up to three year olds, as illustrated in
Figure 3-4, after which the horses move on as indicated to other sectors, and the expenditure
is considered later in the study under the sections of competition, leisure and exports.
Figure 3-4 Composition of Breeding Sector used in this study
Year 1 Broodmare & Stallion
E
X
Year 2 Foal P
E
N
Year 3 Yearling D
I
T
Year 4 2 Year Old U
R
E
Year 5 3 Year Old
Breeding Competition Leisure Export
The respondents to the survey owned an average of 2.8 broodmares and 5.1 equine animals
on their premises.
Of the broodmares, 49% were Irish Sport Horses, 18% were Irish Draught, 11%
Thoroughbred, 9.4% Connemara Ponies, 2.25% Irish Riding Ponies, 0.86% Kerry Bog Ponies,
2.06% were foreign sport horse mares, 2.44% were of other breeds and 4.12% were
unregistered.
18The contribution to the economy of the breeding sector is summarised in the following table
(Table 3-1).
Table 3-1 Total Breeding Sector Contribution to the Economy
Expenditure per Total National Breeders
Breeder Expenditure
CAPITAL EXPENDITURE (€) (€)
Depreciation of Broodmare Population 576.31 8,708,044.10
Depreciation of Equine only Equipment 1,383.47 20,904,231.70
Depreciation of Housing 4,750.00 71,772,500.00
CURRENT EXPENDITURE
Bedding 669.56 10,117,051.60
Concentrates 1,746.40 26,388,104.00
Hay/Grazing 1,587.43 23,986,067.30
Stud Related Expenditure 1,120.30 16,927,733.00
Tack & Equipment Expenditure 104.02 1,571,742.20
Farrier Expenditure 560.00 8,461,600.00
Veterinary Expenditure 1,210.33 18,288,086.30
Schooling Expenditure 1,175.58 17,763,013.80
Registration 41.66 629,482.60
Total Employment See chapter 5 See chapter 5
TOTAL 14,925.06 225,517,656.60
Feed expenditure was requested under two headings, concentrates and hay. The average
expenditure on concentrates per breeder was €1,746.40. Those breeders who also had
three year old horses incurred an additional average expenditure of €387.70 on
concentrates, which was removed from this breeding sector calculation to prevent double
counting in competition or leisure sectors. The data showed an average hay utilisation by
breeders of 64.15 round 4 x 4 bales of hay at a reported average cost per bale of €24.20. All
other sizes of hay bales were converted to round 4 x 4 bale equivalents.
Stud-related expenditure covers three areas: stud fees, keep fees and travel costs. The
average stud fee ranged from €60 to €8,000, with €500 the most frequent fee reported. The
breeders reported that only 36% of mares are left at stud and thus incur keep fees. The
average keep fee (i.e. livery charges) for mares while at stud was €222.85.
Travel expenditure, computed on the basis of kilometers travelled to and from stud,
accounted for €279.49 on average per breeder (using Automobile Association cost per mile).
19The average distance travelled to and from studs was 169 kilometers per mare, 85% used their own horse boxes for transport. The usage of artificial insemination (AI) in Ireland was investigated initially in the 2005 study by comparing records from the Irish Horse Register with information supplied by other sport horse studbooks through the Interstallion website (www.interstallion.org). Figure 3-5 Usage of artificial insemination in sport horse studbooks in 2005 In 2005 the usage of AI in Ireland was significantly lower than in other European countries with only about 16% of Irish Sport Horse foals bred by AI compared to over 90% in other European sport horse breeds, e.g. Hannoverian, KWPN, etc. However, 32% of breeders covered their mares through AI in 2011. Of that percentage, 20% of mares were covered through using fresh semen, a further 8% through frozen semen from Ireland and just 4% through frozen semen imported from abroad. While the reported use of AI has more than doubled in Ireland in the last six years, the use of this technology still lags well behind its use in the main European studbooks. It would be of interest to know whether this is due purely to tradition or if logistical factors and additional cost are influencing breeders’ reticence to use AI when covering their mares. 20
Figure 3-6 Percentage of Mares covered naturally and by AI in 2011

                  Natural                                AI - Fresh Chilled
                  AI - Frozen semen from Ireland         AI - Frozen semen from abroad

                                                                                       8%
                68%                        32%
                                                                     20%
                                                                                       4%

The survey indicated clearly that expenditure on tack and equipment such as replacement
rugs, head collars and lead ropes is a very small item for breeders.

The questionnaire sought information on the number of farrier visits in 2012, and the
associated costs. Table 3-2 shows the average number of visits per category of horse.

Table 3-2 Average Number of Farrier Visits per breeder per category of Horse in 2012

       Category of Horse                          Average number of farrier visits per
                                                           breeder in 2012
       Mares                                                    4.00
       Foals                                                    3.00
       Yearlings                                                3.50
       2 Year Olds                                              3.50
       3 Year Olds                                              3.75
       Stallions                                                4.50

                                                                                            21
Veterinary expenditure, including worming and all vaccinations, was requested. Table 3-3
shows the rather surprising low level of veterinary expenditure.
Table 3-3 Annual veterinary expenditure reported by Breeders, including worming and vaccinations in 2012
Category of Horse Veterinary expenditure (€)
Mares 412.22
Foals 190.98
Yearlings 150.49
2 Year Olds 149.05
3 Year Olds 190.04
Showing data for breeders was collected under two categories: travel and entry fee
expenditure. The results indicate that 28% of breeders showed animals in 2011.
On schooling, 28% of breeders reported having their horses schooled professionally, at an
average cost per week of €54.74 for 14 weeks per horse. Breeders' own time spent
schooling was costed conservatively at the basic statutory adult pay rate for Agricultural
Workers.
Overall, the average current expenditure per breeder was €14,925.06 see Table 3-1. Breeders
have 5.1 horses less than four years of age per enterprise.
Employment within the breeding sector will be dealt with in Chapter 5.
223.2 Competition Sector Expenditure
The competition sector in Ireland comprises both national and international events. The
national data was collected from competitors whose main livelihood is derived from
schooling and competing on customer’s horses. This ensured a population capable of
providing accurate and identified costs, as distinct from casual recreational competitors
who, although subject to similar costs, may not normally keep detailed records.
With the co-operation of the SJl and EI questionnaires were sent to members over 18 years
who matched this description. One hundred percent of this list was surveyed and the results
were extrapolated to show national expenditure in the competition sector.
Data were collected to establish the horse owners' expenditure on maintaining a
competition horse for 2012, including all related costs e.g. livery, labour, entry fee
registration and travel expenditure.
From the questionnaire results 5.4% of members of Showjumping Ireland are also members
of either Eventing Ireland or Dressage Ireland.
In total across the three disciplines there are 10,345 registered competition animals.
(Source: Registration Figures from SJI, EI and DI). The responses to the survey covered a
sample of 390 equestrian yards in the country which had 3,182 horses and ponies.
Registration expenditure below represents both membership and registration costs. Horses
are required to be registered annually to compete in show jumping, eventing or dressage.
Additionally, owners and riders must be members of the affiliate bodies for these sporting
disciplines. The aggregate national contribution of the competition sector was
€109,973,872.06 as shown in Table 3-4.
Table 3-4 Aggregate Contribution of National Competition Sector to the Economy in 2012
Expenditure per Respondent Owner Total National Expenditure
(€) (€)
Basic Livery 4,128.18 42,743,175.72
Extra Livery Expenditure
• Feed Supplements 432.00 4,472,928.00
• Training/Schooling 1,195.20 12,375,100.80
• Tack 500.00 5,177,000.00
• Veterinary Attention 616.90 6,387,382.60
• Farrier 674.68 6,985,636.72
• Entry Fees 961.78 9,958,270.12
Total Travel 1,937.65 20,062,428.10
Registration 175.00 1,811,950.00
TOTAL 10,621.39 109,973,872.06
23The sample yards provided data on their livery service and charges. Expenditure by customers on basic livery averaged €118 per week. The term ’Basic Livery’ covers, as a minimum, feed without supplements, bedding and stabling, together with the associated labour in almost all yards. Data showed that owners left their horses on livery for an average of 8.1 months of the year, thus giving a total annual expenditure per horse of €4,128.18. Grossed up, this gives a national total of €42,743,175.72. Feed supplements were charged as extra by 63% of establishments, while training/schooling and tack/equipment were extras charged by 55% and 69% respectively of the respondent establishments. Veterinary attention, including vaccinations, farrier attention and travel and entry fees were charged as extra by virtually all of the establishments. The travel expenditure shown is based on the informed estimates of the respondents, as to the average road transport expenditure by riders or owners, plus overnight stabling expenditure. 3.2.1 International Equestrian Competition in Ireland In 2012 there were 11 international equestrian events held in Ireland, of those the largest was the RDS Dublin Horse Show. The contribution to the economy of such events is significant and includes expenditure by exhibitors, spectators and overseas visitors. An Indecon report estimated that the RDS Horse Show contributed direct expenditure of €18.3m and further €24.7m in indirect expenditure, giving a total expenditure which was valued at €43m into the economy. Overseas tourists accounted for €3m of this expenditure. The RDS show has more than 1,400 horses and ponies on its premises over the five days, and their statistics show 3,000 bales of hay, 4,000 bales of straw, wood shavings, peat moss, oats, bran and carrots are used during the show. The animals compete in 15 international jumping competitions, 30 national jumping competitions and 95 showing classes. Due to the commercially sensitive nature of the data involved detailed breakdowns of the financial data of the other 10 international events have not been published, and as such are not shown in this report. Based on private communications they were worth an estimated €6.94m in direct expenditure to the economy. The RDS and the other international equestrian events held in 2012 are therefore estimated to contribute direct expenditure in excess of €25.24m to the Irish economy. 3.2.2 Total Competition Sector When combined the National and International Competition sector is worth a total €135,213,872 to the Irish economy. 24
3.3 Equestrian Leisure Sector Expenditure
The leisure sector is a significant element of the Irish Sport Horse industry comprising
35,882 of the total sport horses. The sport horse leisure sector information covered hunting,
showing and country shows, AIRE, AIRC, IPC and Equestrian Inter-schools Ireland.

   3.4 Hunting Expenditure
The expenditure data under this heading is based on David  Scallan’s  extensive study entitled
“A  Socioeconomic  Assessment  of  Hunting  in  the  Republic  of  Ireland”  which  was completed
in 2007 by the Department of Geography, National University of Ireland, Galway.

This research covered a wide variety of hunting activities, however, for this report we
focused only on the elements relevant to the sport horse sector, namely mounted hunting
with hounds. We are very grateful to the author of this research for making his results
available for this study.

This report focuses on expenditure of participants involved in three areas: fox hunting,
mounted hunting with harrier hounds and the Ward Union stag hunt.

3.4.1 Fox Hunting
At present, there are 36 fox hunts in the Republic of Ireland. Each hunt is affiliated to the
Irish Masters of Fox Hounds Association (IMFHA). The hunting season runs from September
to March.

3.4.2 Mounted Hunting with Harrier Hounds
Mounted hunting with harrier hounds is the hunting of foxes and to a lesser extent hares
while mounted on horseback with a pack of harrier hounds. Harrier hunting takes its name
from the type of hound used. The activity is governed by the Irish Masters of Harriers
Association (IMHA) which currently represents 44 hunts. The hunting season runs from
September to March.

3.4.3 Ward Union Stag Hunt
The Ward Union stag hunt is the only mounted hunt in the Republic of Ireland hunting deer
and has a long history dating from the 19th century. The hunting area comprises North
County Dublin together with the lands of south and east Meath. Hunting takes place two
days a week during the season from November to March each year.

                                                                                              25
In 2007, all hunts received a postal questionnaire which requested information relating to
the numbers of people involved in hunting with hounds, the frequency of the hunting
activity, and the direct levels of income and expenditure by hunts in Ireland. Lists of hunt
secretaries were obtained through respective hunting organisations.
Table 3-5 Number of hunts in Ireland in 2007
Number of Hunts
Activity
Fox hunts 36
Mounted harrier hunts 44
Ward Union hunt 1
Total 81
3.4.4 Frequency and Attendance during Hunt Meetings in 2007
Table 3-6 outlines the average number of meets per week, the average number of meets per
year, the total number of meets per year and the average attendance per meet. It also
outlines the total number of caps paid or the total number of times people followed the
course of hunts during 2007.
Table 3-6 Frequency of hunting and attendance per hunt meet
Av. num. Av. num. Total Av. num. Total
of meets of meets num. of present num. of
Activity per week per year meets per meet caps paid
Fox hunts 2.0 38 1,368 63 86,184
Mounted harrier hunts 1.2 27 1,188 59 70,029
Ward Union hunt 2.0 36 36 152 5,472
Total - - 2,592 - 161,685
As Table 3-6 indicates, all hunts met at least once per week during the hunting season. The
fox hunts and the Ward Union hunt met on average twice per week. Table 3-7 illustrates the
average attendance at hunt meets.
Table 3-7 Average attendance during the mounted hunt meets
Mounted Foot Other
Followers Followers Followers Visitors
Fox Hunts 39 10 10 4
Harrier Hunts 29 11 13 6
Ward Union Hunt 50 0 80 2
26Figure 3-7 Number of Equestrian Events organised in 2007 by mounted hunts
Equestrian Activities Organised by Fox and
Harrier Hunts
60
50
Number
40
30
20
10
0
ts
s
s
s
es
ws
l
nt
e
in
ia
ri d
as
o
e
po
Tr
Sh
ev
ch
try
r
to
te
n
or
m
un
a
un
t
in
a
tri
as
co
Te
Po
H
s
an
ue
ss
kh
eq
ro
ym
C
er
th
G
O
Figure 3-7 illustrates the number of equestrian activities organised by the mounted hunts in
Ireland. The results indicate that almost every mounted hunt organised at least one point-
to-point event during the year. The majority of hunts also organised hunter trials and cross-
country rides. Other sporting events organised by the hunts included team chases,
gymkhanas and horse shows.
3.4.5 Expenditure by Participants involved in Hunting: Mounted followers
The breakdown of expenditure on goods and services by the participants involved in hunting
with hounds can be seen in Table 3-8. The expenditure relating to stabling and livery fees for
maintaining horses for hunting was the largest expenditure category by the followers of the
mounted hunts in Ireland. Such expenditure consisted of horse food, stabling fees, as well as
veterinary expenses. The second largest expenditure category was from hunt-related social
and recreational activities. Such expenditure included events such as point-to-points and
hunt balls. Payments to hunts in the form of cap fees and subscriptions were also a
significant expenditure category.
27Table 3-8 Average expenditure by participants involved in mounted hunting
Expenditure Breakdown Mean in Euros
Payments to hunts €1,054.00
Hunt-related social activities €1,008.00
Travel (on hunting trips) €560.00
Stabling/livery fees €1,930.00
Vets Costs €568.00
Tack & riding equipment €509.00
Horse transport €584.00
Farriers €595.00
Other €124.00
Total €6,931.00
3.4.6 Total Expenditure by Participants involved in Hunting with Hounds
The participant expenditure estimates were grossed-up in an attempt to generate a number
of conclusions from the data.
In order to estimate the number of active hunting participants in 2007, hunt secretaries
were asked to state the number of members that were active (hunting) and dormant (not-
hunting). This information was then used to estimate the total number of active hunting
participants in 2007. In respect of this, the study only considered the active participants
registered with the hunts when generating economic estimates (see Table 3-9).
Table 3-9 Estimated numbers of active hunting participants in 2007
Mean active Grossed-up
membership active hunt
per hunt membership
Fox hunts 78 2,808
Mounted harrier hunts 39 1,716
Ward Union hunt 197 197
Total - 4,721
Table 3-10 Grossed-up Expenditure by the Participants involved in Hunting in 2007
Expenditure
Mounted Followers €32,721,251 €262,504 (SED)
283.4.7 Employment by Hunts
Table 3-11 Grossed-up direct hunt employment of the mounted hunts
Hunt Employment Fox Hunts Harrier Hunts Total
Total (grossed-up) employment 119 75 194
3.4.8 Aggregate Hunting Expenditure
Total annual hunting with hounds participant expenditure amounted to €32,721,251 in
2007, which when adjusted for inflation from 2007 to 2011 (source CPI: 0.94%) equals
€33,028,831 contributing directly to the Irish economy in 2011.
In addition, there is an employment contribution, which was estimated as 194 people
employed on a full-time basis. The wages have been based on the average agricultural wage
to give a total of €3,258,036.
293.5 Showing and Country Shows Expenditure
Each year approximately 140 country shows take place in Ireland with 130 of these affiliated
to the Irish Shows Association. In 2011, it was estimated that 540,620 spectators attended
shows with 5% of the spectators coming from overseas. It was established from the Irish
Shows Association that approximately 50% of spectators attended country shows
specifically to view equestrian events and classes. Accordingly, only 50% of the spectator
expenditure has been attributed to the sport horse industry’s contribution to the economy.
Equestrian classes are extremely important to country shows with some shows consisting
solely of equestrian classes and events. On average there are 85 equestrian classes per
country show, including show jumping, in-hand showing and ridden showing classes for
horses and ponies. Approximately 11,900 equestrian classes take place at country shows
each year with show jumping and showing being the most popular type of equestrian class.
Figure 3-8 Numbers of Classes per Discipline at Country Shows in 2011
Other, 448
Show Jumping, Ridden Other
3304 Showing, 3304
Ridden Showing
Showing - Mare/Foal
Showing - Young Horse
Showing - Other
Show Jumping
Showing -
Other, 1036 Showing -
Mare/Foal, 1792
Showing - Young
Horse, 2016
For the purpose of this study data were collected in the form of surveys from spectators and
horse exhibitors at ISA country shows (a total of 521 surveys were collected) and the results
were extrapolated to show national expenditure in the equestrian element of the country
show sector. The data collected to establish spectator and exhibitor expenditure included
travel costs, accommodation costs, expenditure at the show, and number of accompanying
people.
30For domestic spectators, most attended as a family and the average family size attending
country shows was 3.2 individuals and the average expenditure per family was €139.29.
Overseas visitors also had an average family size of 3.2 individuals per family but had an
average expenditure of €1,246. Overseas visitors stayed an average of 7 nights in Ireland
during their visit and 1.5 of these overnight stays were included in the estimation of
expenditure for overseas spectators. The overseas visitors surveyed came from a number of
different countries including Australia, the United Arab Emirates, France, the UK and US.
It was estimated that there are 4,231 individuals that exhibit horses at country shows in
Ireland (this estimate does not include individuals that compete in show jumping
competitions as their contribution is included in the competition sector analysis). On
average horse exhibitors attend shows in a family unit of 3 individuals and exhibit at 8.7
shows per year, entering on average 2.3 classes per show.
The average number of entries per class varied depending on the discipline. The highest
entries in 2011 were for show jumping classes at 16.74 entries per class, followed by ridden
showing classes at 6.3 entries per class.
It was estimated that there are 1,321 dedicated horses for showing in Ireland at a total
value of €2,029,056 (this excludes mares, foals and young stock whose contribution is
included in the breeding sector analysis).
Table 3-12 Average prize fund per class in various disciplines in 2011
Discipline Average Prize Fund per Class
(€)
Showing – Ridden 122.00
Showing – Mares/Foals 607.00
Showing – Young Horses 434.00
Showing - Other 145.00
Other equestrian classes 329.00
The aggregate contribution of the sport horse element from country shows to the economy
was €35,169,338.97 as shown in Table 3.4.
31Table 3-13 Aggregate Contribution of Country Shows to the Economy in 2011
Expenditure Total National Breeders
per Family Expenditure
(€) (€)
Domestic spectator families 139.29 11,177,814.00
Overseas spectator families 1246.00 5,263,104.00
Total Spectator Expenditure 16,440,918.00
Expenditure
Total National Showing
per Exhibitor
Exhibitor Expenditure
per Show
(€) (€)
Mileage, accommodation, food 214.09 7,880,589.00
Entry fees 20.39 750,549.78
Professional preparation of horse 1.71 62,944.59
Total Exhibitor Expenditure 236.19 8,694,083.37
CAPITAL EXPENDITURE1 (€)
Depreciation of show horses 202,905.60
CURRENT EXPENDITURE1
Basic livery 5,453,088.00
Feed supplements 570,672.00
Tack & equipment expenditure 2,101,495.00
Farrier expenditure 891,252.00
Veterinary expenditure 814,925.00
Total Expenditure on show horses 10,034,337.60
TOTAL COUNTRY SHOW EXPENDITURE 35,169,338.97
1
Expenditure figures are for dedicated show horses only and have been adjusted to avoid duplication with any sector of
the report
On average shows have a prize fund for equestrian classes that amounts to €18,892.60 and
the total prize fund for country shows for equestrian classes in 2011 was €2,644,964.00
(excluding show jumping prize money).
32You can also read