Technical Note: An open source library for processing weather radar data (wradlib)
←
→
Page content transcription
If your browser does not render page correctly, please read the page content below
Model Development

                                                                                                                   cess
                                                                                           Hydrology and

                                                                                                                   Open Access
Hydrol. Earth Syst. Sci., 17, 863–871, 2013
www.hydrol-earth-syst-sci.net/17/863/2013/
doi:10.5194/hess-17-863-2013                                                                Earth System
© Author(s) 2013. CC Attribution 3.0 License.                                                   Sciences

                                                                                                                   Open Access
                                                                                         Ocean Science

Technical Note: An open source library for processing weather

                                                                                                                   Open Access
radar data (wradlib)
                                                                                                Solid Earth
M. Heistermann1 , S. Jacobi1 , and T. Pfaff2
1 University of Potsdam, Institute of Earth and Environmental Sciences, Karl-Liebknecht-Str. 24–25,
14476 Potsdam, Germany

                                                                                                                   Open Access
2 University of Stuttgart, Institut für Wasser- und Umweltsystemmodellierung, Stuttgart, Germany

Correspondence to: M. Heistermann (maik.heistermann@uni-potsdam.de)
                                                                                        The Cryosphere
Received: 26 October 2012 – Published in Hydrol. Earth Syst. Sci. Discuss.: 2 November 2012
Revised: 18 January 2013 – Accepted: 4 February 2013 – Published: 28 February 2013

Abstract. The potential of weather radar observations for          drainage and reservoir control (see e.g. Cruse et al., 2006;
hydrological and meteorological research and applications          Hardegree et al., 2008; Kraemer and Verworn, 2009). The
is undisputed, particularly with increasing world-wide radar       actual availability of radar coverage is no longer a limiting
coverage. However, several barriers impede the use of              factor in many regions of the world (Fig. 1).
weather radar data. These barriers are of both scientific and         Nonetheless, many challenges remain, particularly from
technical nature. The former refers to inherent measurement        a hydrological perspective. From a scientific point of view,
errors and artefacts, the latter to aspects such as reading spe-   these challenges particularly arise from the multitude of po-
cific data formats, geo-referencing, visualisation. The radar      tential error sources which are typically inhomogeneous in
processing library wradlib is intended to lower these barri-       space and time (Harrison et al., 2000; Germann et al., 2006).
ers by providing a free and open source tool for the most          These error sources can introduce severe bias in quantita-
important steps in processing weather radar data for hydro-        tive hydrological studies, e.g. (eco-)hydrological modelling
meteorological and hydrological applications. Moreover, the        and forecasting. Hence, it requires the combination of state-
community-based development approach of wradlib allows             of-the-art correction algorithms to make the data useful for
scientists to share their knowledge about efficient process-       hydrological applications. Although many algorithms have
ing algorithms and to make this knowledge available to the         been published in peer-reviewed journals, the level of doc-
weather radar community in a transparent, structured and           umentation often is not sufficient for a straightforward re-
well-documented way.                                               implementation.
                                                                      From a technical point of view, other barriers exist that
                                                                   prevent hydrologists (and other users) from working with
                                                                   weather radar data; the first being a multitude of differ-
1   Introduction                                                   ent file formats for data storage and exchange. Although
                                                                   the OPERA project (http://www.knmi.nl/opera, URL will
The potential of weather radar observations for hydrologi-         change to http://www.eumetnet.eu/opera in the future) has
cal and meteorological research and applications is undis-         taken steps towards harmonizing the data exchange in Eu-
puted (Krajewski and Smith, 2002). Since the emergence of          rope, different dialects still exist in addition to a large va-
weather radar technology after World War II, research has          riety of legacy formats. Many radar data come in complex,
strived at tapping this potential, particularly in terms of pre-   and sometimes proprietary binary formats which require a
cipitation monitoring and forecasting with high spatiotem-         lot of expertise in handling, or even the use of commer-
poral resolution and coverage. These features not only make        cial software products. Other technical barriers are a lack
weather radar data useful for severe weather detection and         of experience in working with polar coordinates and in geo-
meso-scale flood forecasting, but potentially also for ero-        referencing three dimensional scan data, as well as the lack of
sion studies, precision agriculture, water harvesting, or urban

Published by Copernicus Publications on behalf of the European Geosciences Union.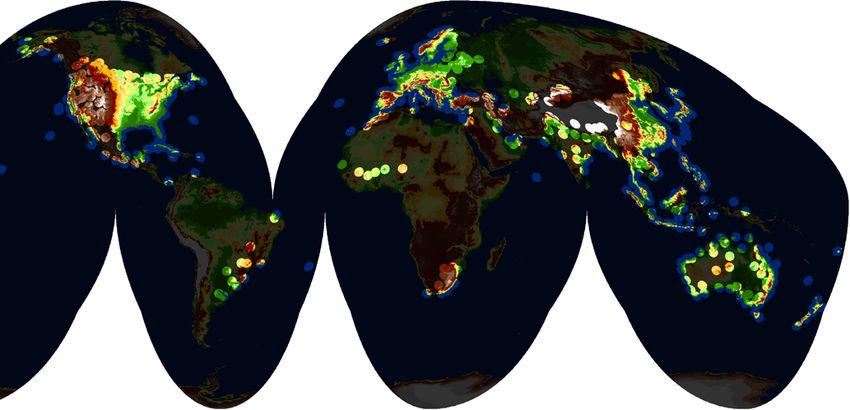
864                                        M. Heistermann et al.: An open source library for processing weather radar data

Fig. 1. Current weather radar coverage provided by national weather services (in Goode Homolosine projection). For computing the area
illuminated by terrestrial weather radars, we assumed a maximum range of 200 km per radar device. The underlying database was established
based on a web search of national weather services’ web pages, web documents, and the WMO radar database http://wwr.dmi.gov.tr (which
is quite incomplete, though, in comparison to the results shown in this figure). The sources of information are listed in the Supplement
Sect. 1. The figure shows that almost complete coverage is achieved for North and Central America, as well as Western and Central Europe.
Good coverage is also available for the Middle East, South, Southeast and East Asia, and Australia. Large parts of Africa and South America
remain uncovered, yet, as well as vast parts of Russia (although a new network with about 140 Doppler radars is planned to be established in
Russia by 2018).

out-of-the-box spatial visualisation tools outside GIS work-            which could be used much more efficiently if standard algo-
ing environments.                                                       rithms were available in a well- documented and easy to use
   Furthermore, specific users might have specific require-             manner.
ments to data processing. For example, one user might favour               In 2012, the situation changed as even two free and open
aggressive clutter elimination in order to assimilate the prod-         source software products for weather radar data processing
uct to a numerical weather prediction (NWP) model (see                  were released, one being the BALTRAD software (http://
e.g. Fornasiero et al., 2006), while another user might pre-            git.baltrad.eu) and the other being the wradlib library (http:
fer a more conservative product in order to detect small scale          //wradlib.bitbucket.org). This paper aims at introducing the
convective features. A single product from a radar operator,            conceptual and technical framework of the wradlib library. In
even if created with the best methods currently available,              Sect. 2, we will present the design and development goals of
will never be able to accommodate all these needs simul-                wradlib. Section 3 will illustrate the functionality of wradlib
taneously. For many potential users, this trickles down to a            based on a set of examples. Section 4 will outline the main
take-it-or-leave-it decision. The Hydro-NEXRAD initiative               future development challenges.
(Krajewski et al., 2011) aims to address this problem by pro-
viding a web interface through which the user can specify a
limited set of processing options; however, only for the US
weather radar network NEXRAD.                                           2   Design and development goals
   Researchers themselves typically hesitate to commit to
proprietary software products if they do not have the perspec-          2.1 wradlib is a library
tive to modify the software code according to their own best
knowledge – which would basically require an open source                It is important to understand wradlib not as an application,
concept. Until recently, no open source software for weather            but as a library. It is designed to provide the tools required
radar data processing has been available which lead many                for building complete radar processing chains. It allows users
researchers to develop their own software code. This option             to combine selected functionalities in order to create custom-
often implies reinventing the wheel: writing routines for data          tailored workflows. This is only possible because the library
I/O, error corrections, geo-referencing and visualisation, try-         design is strictly modular. One of the original motivations of
ing to find relevant literature and to extract algorithms from          the development team was to offer a toolbox in order to make
publications, which, often enough, do not offer all details re-         radar data usable for hydrological applications. However, the
quired for implementation. This takes a lot of time and effort,         scope of wradlib is certainly not restricted to hydrology.

Hydrol. Earth Syst. Sci., 17, 863–871, 2013                                              www.hydrol-earth-syst-sci.net/17/863/2013/
M. Heistermann et al.: An open source library for processing weather radar data                                                   865

2.2 wradlib is easy to use                                                   the so-called Pull Request mechanism. Corresponding
                                                                             guidance is provided in the tutorials section of the
Using Python as the main implementation language sub-                        wradlib documentation pages.
stantially lowers the barrier to create applications based on
wradlib. Python (http://python.org) is an open source, high               – Documentation: it is the belief of the authors that the
level interpreted language with an extensive built-in standard              paramount criterion for the usability of a library is its
library. It has a clear syntax, is well documented and easy to              documentation. Documentation should not only enable
learn. Using Python also allows embedding lower-level pro-                  the potential user to apply the software, but it should
gramming languages such as C/C++ or FORTRAN. This                           also contain key technical and scientific background in-
option can be used to include external code, but also to opti-              formation on the functions employed. Documentation
mise the performance of selected functions.                                 is thus a requirement for efficient development coop-
                                                                            eration, and is the main interface between developers
2.3 wradlib is platform independent                                         and users. This includes documentation of the source
                                                                            code and the application programming interface (API),
Building on top of Python makes wradlib platform-                           but also tutorials and code recipes to guide beginners
independent, provided that package dependencies can be sat-                 on their first steps as well as to explain more complex
isfied on the respective platform as well. This is straightfor-             applications, which cannot be covered by the individual
ward in Linux environments. On windows machines, most                       function or class documentation. wradlib makes exten-
dependencies can conveniently be resolved by installing free                sive use of Python’s docstring concept to keep the li-
scientific Python distributions such as Python(x, y) or the En-             brary documentation as close to the actual code as pos-
thought Python Distribution (EPD).                                          sible. The docstrings are automatically extracted, incor-
                                                                            porated in higher level documents, and finally converted
2.4 wradlib is a community project                                          into presentation formats like html or LaTeX. The re-
                                                                            sulting documentation is made available for download
wradlib is consequently open source and uses the permissive                 or can be accessed online (http://wradlib.bitbucket.org).
MIT License to ensure that students, researchers or compa-
nies who contributed to wradlib may continue to use their             Most of these concepts should be taken for granted in sci-
work even for commercial purposes. The open source license            entific software development; however, they are not. This is
model not only allows free access to all of wradlib’s process-        why the significance is stressed so much in this context.
ing capabilities, but is also a prerequisite to put into action the
concept of wradlib as a community-based development and               2.5 wradlib is interactive
exchange platform. This means that researchers and devel-
                                                                      wradlib enables interactive as well as presentation quality vi-
opers should understand wradlib as an opportunity to share
                                                                      sualisation of data, with and without spatial contexts, and in
their knowledge with other developers, and on the other hand
                                                                      the same environment that created the data. Together with
to benefit from user feedback. Apart from the permissive li-
                                                                      the interactive features readily available through the Python
cence model and platform independence, the following two
                                                                      interpreter or the IPython shell, wradlib may also become a
concepts are assumed to foster this kind of exchange:
                                                                      valuable tool for teaching weather radar related topics.
  – Distributed Version Control: version control allows de-
    velopers to track changes and to integrate code from
                                                                      3     Features by example
    several developers almost automatically. Distributed
    version control systems (DVCS) add a new level of                 As pointed out above, wradlib covers many aspects of a typ-
    cooperation as each developer may work with his or                ical radar data processing chain, with differing levels of ma-
    her own repository, having full access to the whole               turity. While some modules are still experimental, others are
    history, merging in changes from others when nec-                 already robust enough for operational environments (see Ta-
    essary, and pushing out own changes once these are                ble 1). A full library reference is available in the wradlib doc-
    deemed ready for application. wradlib uses the plat-              umentation at http://wradlib.bitbucket.org/reference.html.
    form independent DVCS Mercurial (http://mercurial.                   In the following, we will exemplify some of the features
    selenic.com). The source code is hosted at Bitbucket              contained in wradlib. The code as well as example data sets
    (http://bitbucket.org/wradlib/wradlib). Apart from host-          are contained in the wradlib distribution under the examples
    ing, Bitbucket offers additional services useful for col-         directory.
    laboration and community-building like issue-tracking,
    RSS feeds and e-mail notifications, or interactive com-           3.1    Reading common radar data formats
    ments on changesets. Developers without writing per-
    missions on the main repository can integrate their own           We already mentioned cryptic binary formats as a major
    developments into the main wradlib branch by using                barrier for radar data users. wradlib supports a number of

www.hydrol-earth-syst-sci.net/17/863/2013/                                            Hydrol. Earth Syst. Sci., 17, 863–871, 2013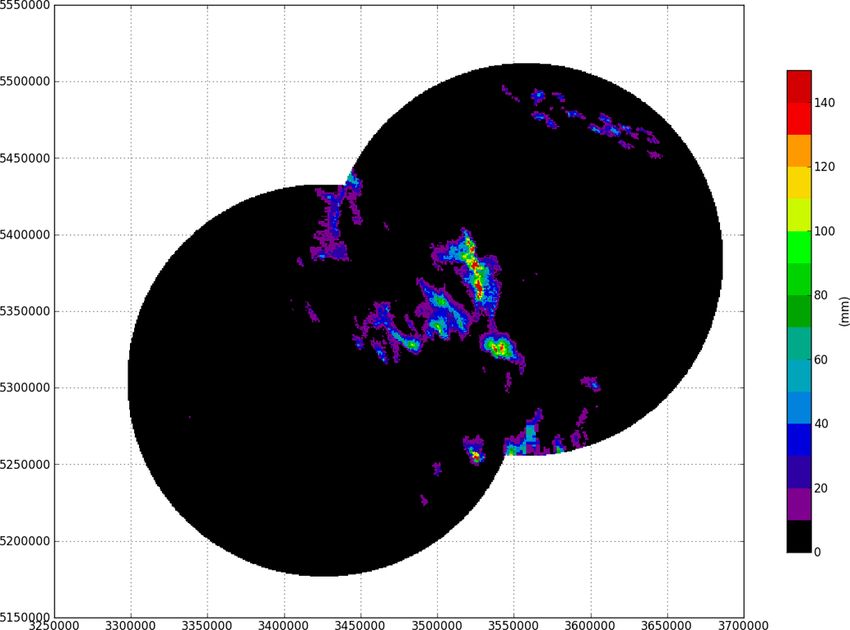
866 M. Heistermann et al.: An open source library for processing weather radar data
Table 1. Modules in wradlib.
Module General Description Examples
io Data import and export German Weather Service DX and RADOLAN formats
EDGE™ export files by EEC
OPERA-conform hdf5 and BUFR files
clutter Clutter identification Acc. to Gabella and Notarpietro (2002)
Based on statistics of accumulated precipitation
atten Attenuation correction Acc. to Hitschfeld and Bordan (1954)
Acc. to Kraemer (2008)
vpr Vertical data analyses Data interpolation to 3-D Cartesian coordinates
CAPPI and Pseudo-CAPPI
trafo Unit transformations dBZ to Z
mm h−1 to mm
zr Conversions Reflectivity to rainfall rate
Rainfall rate to reflectivity
georef Spatial transformation Polar coordinates to geographic coordinates
and geo-referencing Geographic coordinates to Cartesian coordinates
ipol Spatial interpolation Nearest Neighbours
Linear Interpolation
Inverse Distance Weighting
qual Measurement quality Height of radar beam according to Collier (1996)
indicators Pulse volume
comp Building composites from Interpolation of polar data to common grids
multiple radar locations Combining multiple data sources in overlapping
regions based on quality information
adjust Rain gage adjustment Based on a multiplicative error model (Brandes, 1975)
Based on an additive error model
Mixed additive and multiplicative error model
verify Verification Computation of diverse quality criteria based on
comparison with rain gage observations
vis Plotting and mapping Plan Position Indicator
Range Height Indicator
Volumetric Slice Plot
util Utility functions Aggregation and interpolation of time series data
data formats mainly used in Europe, but also world-wide. flexible and powerful container for homogeneous data, and
At the moment, these formats include the OPERA BUFR has become the de-facto standard for most scientific Python
(Paulitsch et al., 2010) and hdf5 formats (Michelson et al., packages. The wradlib.io module provides functions that
2011), NetCDF files generated by the commercial EDGE load data from files of different formats into numpy.ndarrays.
software, hdf5 files generated by the commercial GAMIC Metadata, if available, are returned as so-called dictionary
software, as well as the German Weather Services quantita- objects which can be browsed and inspected using keywords.
tive local scan format (DX) and the quantitative composite The level and detail of meta-information depends on the data
format (RADOLAN, see German Weather Service, 2004). source.
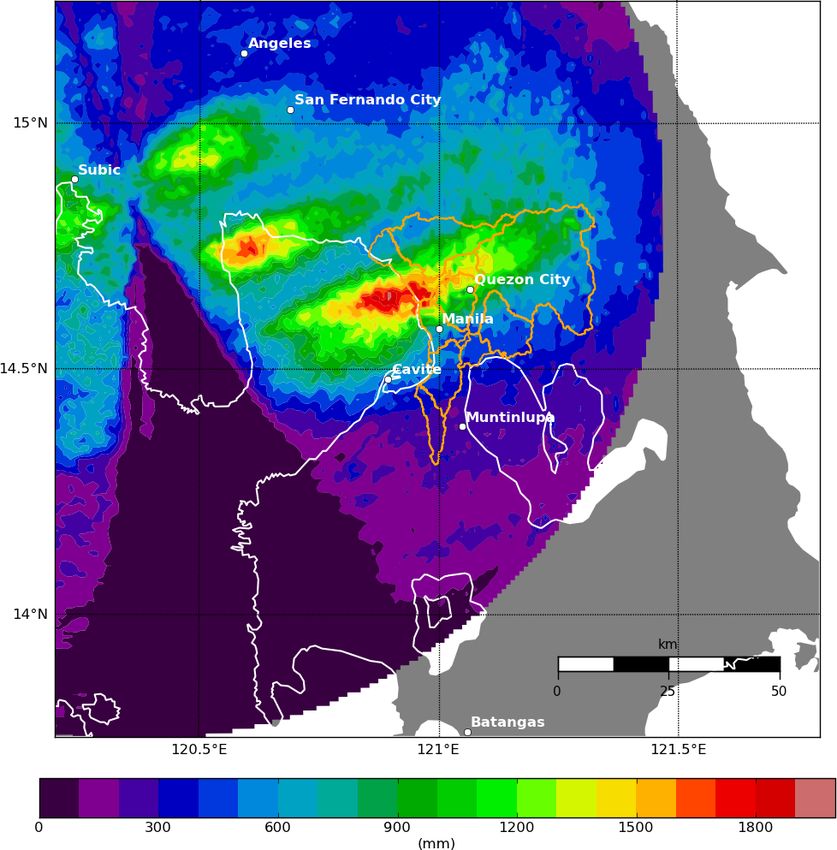
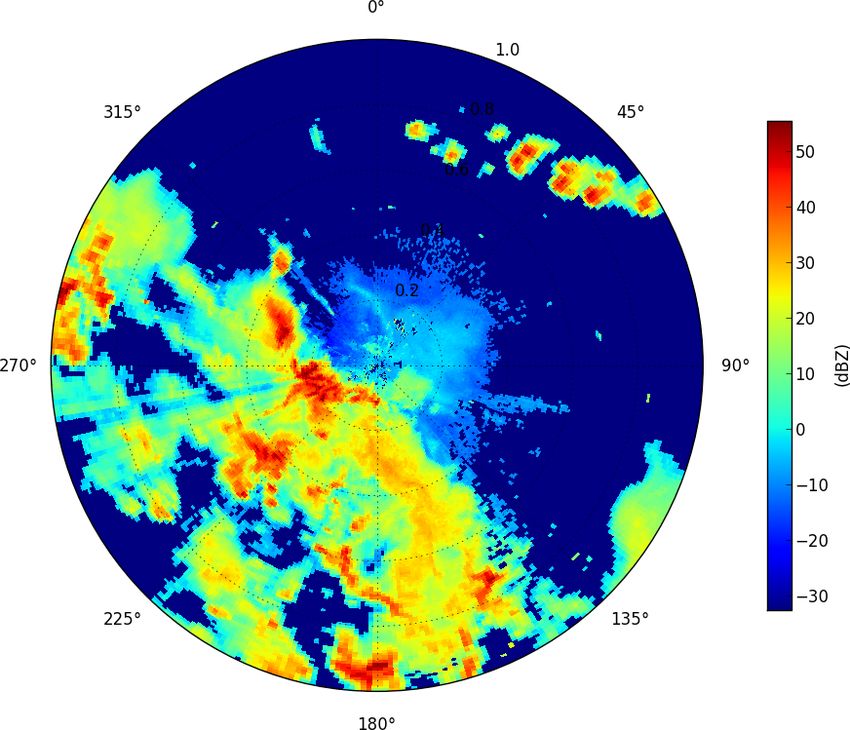
Other formats will be implemented dependent on demand The following example (see Fig. 2) shows how a local plan
and availability of documentation. wradlib deals with data position indicator (PPI) in polar coordinates from the Ger-
in both polar and Cartesian coordinate systems. man Weather Service’s C-band radar Tuerkheim is loaded
The basic data structure used by wradlib is a multi- and inspected with a quick diagnostic plot.
dimensional numerical array (the numpy.ndarray). It is a very
Hydrol. Earth Syst. Sci., 17, 863–871, 2013 www.hydrol-earth-syst-sci.net/17/863/2013/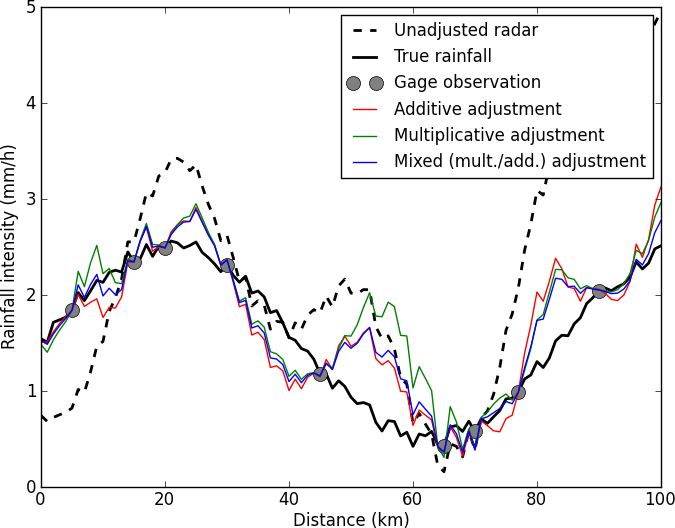
M. Heistermann et al.: An open source library for processing weather radar data                                              867

                                                                    Example 3 :
                                                                    >>> corrected = wradlib.ipol.interpolate polar
                                                                          (data, clutter)

                                                                    For attenuation correction several implementations of the re-
                                                                    cursive methods presented by Nicol and Austin (2003) and
                                                                    Kraemer (2008) exist. An implementation of the method pre-
                                                                    sented by Marzoug and Amayenc (1994) is underway as well
                                                                    as methods addressing the vertical profile of reflectivity.

                                                                    3.3   Data transformation

                                                                    The wradlib.trafo module contains utility functions to do
                                                                    common unit transformations like converting from and to
                                                                    decibel or transform rainfall intensities to depths depending
                                                                    on the integration interval. Due to the importance and the di-
Fig. 2. Simple diagnostic plot of polar reflectivity.               versity of algorithms for Z–R relations, corresponding func-
                                                                    tions are collected in the wradlib.zr module. Currently, the
                                                                    standard power-law relation and the 3-part relation currently
                                                                    in operational use by the German Weather Service accord-
                                                                    ing to German Weather Service (2004) are implemented. For
Example 1 :                                                         instance, the clutter corrected reflectivity (in dBZ) from Ex-
>>> import wradlib                                                  ample 3 can be converted to a 5 min (300 s) rainfall depth
>>> data, metadata=wradlib.io.readDX(’sample.dx’)                   using the following code sequence:
>>> wradlib.vis.polar plot(data)                                    Example 4 :
                                                                    >>> Z = wradlib.trafo.idecibel(corrected)
3.2   Error correction                                              >>> R = wradlib.zr.z2r(Z)
                                                                    >>> depth = wradlib.trafo.r2depth(R, 300)
There are several modules dedicated to the correction of the
major sources of error in weather radar data. wradlib.clutter       An additional configuration can be passed to many func-
implements functions for clutter detection, wradlib.atten and       tions using Python’s keyword mechanism. By default
wradlib.vpr deal with attenuation and errors due to the ver-        wradlib.zr.z2r uses the parameters a = 200 and b = 1.6.
tical profile of reflectivity (algorithms for VPR correction
are currently underway). In the following example, a map            3.4   Geo-referencing
of clutter signals is identified by using the filter described in
Gabella and Notarpietro (2002).                                     Geo-referencing includes the conversion from polar coordi-
                                                                    nates to geographical coordinates, and the projection of ge-
                                                                    ographical coordinates to Cartesian coordinate systems such
Example 2 :                                                         as Universal Transverse Mercator (UTM), Gauss–Krueger,
>>> clutter = wradlib.clutter.filter gabella                        or Azimuthal Equidistant. This functionality is particularly
                                                                    important since the only geographical reference typically
      (data, tr1=12, n p=6, tr2=1.1)
                                                                    provided with radar data is the location of the radar device.
The behaviour of this filter can be adjusted to the user’s          The radar location (in terms of latitude, longitude, and alti-
needs. In this example the three parameters of the filter are       tude) together with the azimuth, range and the elevation an-
set explicitly. If they were not given default values (usually      gle of the radar beam allows the computation of geograph-
those presented in the respective publication) would have           ical coordinates and the height of the radar beam (line 4 of
been used.                                                          example 5) as well as the subsequent projection to a Carte-
   The Boolean map returned by the function can then be             sian reference system (lines 5–6 of example 5), in this case
used to correct the original data, for example by interpola-        Gauss–Krueger Zone 3:
tion from surrounding radar bins:

www.hydrol-earth-syst-sci.net/17/863/2013/                                         Hydrol. Earth Syst. Sci., 17, 863–871, 2013
868 M. Heistermann et al.: An open source library for processing weather radar data
Fig. 4. Composite of a two hours event accumulation of clutter and
attenuation corrected data for 2 June 2008, 16:00–18:00 UTC, in-
cluding the German Weather Service’s C-band radars Tuerkheim
and Feldberg (5 min scan interval, 1◦ angular resolution, 128 km
range, and 1 km range resolution). This event caused a disastrous
flash flood in the central map region. Get details about the underly-
Fig. 3. Rainfall accumulation for Metropolitan Manila region, ing code at http://wradlib.bitbucket.org/recipes.html. For two hours
Philippines, from 6–9 August 2012, based on the S-band radar lo- of data, the complete workflow takes about 20 s of computation time
cated near Subic city, using wradlib modules io (reading NetCDF (on a 32bit Windows machine, using one out of eight threads of an
data), georef (geo-referencing), clutter (clutter identification), ipol Intel 2.93 GHz Quad-Core processor).
(gap filling), adjust (for mean field bias adjustment), and vis (for
plotting over a map). The orange lines indicate watersheds draining
to Manila Metropolitan region. Note that the southern sectors of the
radar exhibit significant beam shielding caused by Mount Natib, 3.5 Interpolation and composition
a volcano and caldera complex located in the province of Bataan.
Please note that a corresponding code recipe for this figure has not wradlib provides nearest neighbour, inverse distance weight-
been added to the wradlib documentation page because the code is ing and linear interpolation. Various Kriging methods are
part of a more complex application built on wradlib. currently being implemented. All methods have a unified in-
terface so that only minimal changes are necessary to switch
between different approaches. The interpolation methods are
used by several routines like infilling of missing or flagged
data, or the transfer from polar to Cartesian representations.
Example 5 : Combining data from several radar locations on one com-
>>> range = 100000. mon grid is usually referred to as composition. Creating
>>> azimuth = 45. composites is particularly challenging in areas where several
radar circles overlap. In these regions of overlap, wradlib ap-
>>> elev = 0.5
plies criteria related to data quality in order to weight differ-
>>> radar location = (48.5861, 9.7839, 500.) ent radar data sources. Users are free to define quality crite-
>>> lat, lon, alt = wradlib.georef.polar2latlonalt ria; however, the wradlib.qual module supports the evalua-
(range, azimuth, elev, radar location) tion of radar data quality for different criteria such as beam
height over ground, or pulse volume. Figure 4 shows the re-
>>> gk3 = wradlib.georef.create projstr("gk", zone=3)
sult of a composition based on a weighted combination, using
>>> x, y = wradlib.georef.project(lat, lon, gk3) the sampling volume as a quality criterion.
Geo-referencing also allows plotting radar data over a
3.6 Gage adjustment
map, including arbitrary, user-defined geographical features
such as coastlines, borders, cities or catchments, using the
Using rain gage observations to adjust the radar measure-
wradlib.vis module. A typical result of such a procedure is
ments has been shown to substantially reduce the error of
shown in Fig. 3, containing a four day rainfall accumulation
radar-based rainfall estimates (Goudenhoofdt and Delobbe,
for the Metropolitan Manila region in the Philippines for the
2009). The procedure of gage adjustment is considered in-
disastrous rainfall event in August 2012.
dispensable for hydrological applications (Heistermann and
Hydrol. Earth Syst. Sci., 17, 863–871, 2013 www.hydrol-earth-syst-sci.net/17/863/2013/M. Heistermann et al.: An open source library for processing weather radar data 869
Fig. 5. A 1-dimensional example with synthetic data for illustrating
different adjustment approaches in wradlib. The true rainfall was
generated by combining a sine curve with white noise. Contami-
nating the true rainfall with spatially variable additive and multi-
plicative error terms yields the unadjusted radar observation. Three
adjustment methods are then applied via wradlib.adjust – using the Fig. 6. Verification of the adjustment techniques, using the example
gage observations (grey circles) which are random samples of the shown in Fig. 5. The scatter plot and the error metrics were created
true rainfall. See Fig. 6 for a verification of this example adjustment. using wradlib.verify. The metrics are computed by comparing the
unadjusted and the adjusted radar observations against the synthetic
true rainfall (just a small selection of error metrics is shown here).
Kneis, 2011). The wradlib.adjust module provides different
adjustment techniques in order to identify the most effective
approach for a specific region and application. At the mo- radar values at specific gage locations, but also a set of error
ment, the implemented adjustment approaches mainly differ metrics which are computed from gage observations and the
with respect to the error model (additive, multiplicative, and corresponding radar-based precipitation estimates (includ-
a mixed multiplicative and additive approach), and whether ing standard metrics such as RMSE, mean error and Nash–
the error is assumed to be spatially homogeneous or not. An Sutcliffe efficiency). wradlib.adjust also contains a standard
illustrative one-dimensional example fo different adjustment procedure for leave-one-out cross validation which is appli-
techniques is given in Fig. 5. cable to each of the available adjustment method. Figure 6
illustrates the verification output for the one-dimensional ex-
3.7 Verification ample that was provided in Fig. 5.
Typically, radar-based precipitation estimation and the effec-
tiveness of the underlying correction and adjustment methods 4 Conclusions and outlook
are verified by comparing the results against rain gage obser-
vations on the ground (Kneis and Heistermann, 2009). This Currently, wradlib is used for different purposes and by dif-
can be done by cross-validation (in case rain gages were al- ferent working groups in Germany, but also in Europe and
ready used for gage adjustment), or by using a set of indepen- Southeast Asia (mainly in research environments). Although
dent, high-quality precipitation measurements on the ground. there is not yet a systematic comparison between the BAL-
This procedure has been criticized due to the limited spatial TRAD and the wradlib software, we suggest thinking of
representativeness of point observations and the problems re- wradlib as a lightweight, flexible, and experimental coun-
sulting from a comparison to the volume integrated radar terpart of the BALTRAD software which is geared more
observation (Einfalt et al., 2004; Germann and Joss, 2004; towards larger scale operational weather radar networks,
Kitchen and Blackall, 1992; Michelson and Koistinen, 2000; and focuses on speed and efficiency rather than flexibility.
Seed et al., 1996). Indeed, alternatives have been proposed, Nonetheless, wradlib also has the potential to be applied in
e.g. based on the hydrological catchment response (Heister- operational environments. For example, it is currently being
mann and Kneis, 2011). Nonetheless, the use of rain gage ob- used for operational rainfall estimation in the Philippine gov-
servations remains the main verification strategy. Therefore, ernment project NOAH (National Operational Assessment
wradlib.verify provides procedures not only to extract the of Hazards). Beyond, features such as interactive use and
www.hydrol-earth-syst-sci.net/17/863/2013/ Hydrol. Earth Syst. Sci., 17, 863–871, 2013870 M. Heistermann et al.: An open source library for processing weather radar data
platform independency might be used to distinguish wradlib Service, and the Philippine Atmospheric, Geophysical and As-
from BALTRAD. tronomical Services Administration (PAGASA). Until now, the
Apart from the user’s perspective, wradlib could sup- feedback of many wradlib users has already allowed for substantial
port radar related research by providing a unified interface improvements in the software library. Finally, we would like to
to a growing number of standard and research algorithms. thank Hidde Leijnse and an anonymous referee for reviewing the
manuscript.
Thereby, wradlib could enable extensive comparison studies,
and increase the reproducibility of research results. In addi- Edited by: R. Uijlenhoet
tion, the open source concept allows public code review of
any algorithm provided in the library. It already turned out
that, together with the community features and the DVCS References
concept, errors are rapidly identified and fixed.
In the future, the main development efforts in wradlib will Bouilloud, L., Delrieu, G., Boudevillain, B., and Kirstetter, P. E.:
have to be invested in the integration of algorithms related to Radar rainfall estimation in the context of post-event analysis of
the use of flash-flood events, J. Hydrol., 394, 17–27, 2010.
Brandes, E. A.: Optimizing Rainfall Estimates with the Aid of
– polarimetric radar moments e.g. the classification of hy- Radar, J. Appl. Meteorol., 14, 1339–1345, 1975.
drometeors, for the optimisation of Z–R relation param- Cao, Q., Yeary, M. B., Zhang, G.: Efficient Ways to Learn Weather
eters, or the correction of clutter, beam blockage and Radar Polarimetry, IEEE T. Educ., 55, 58–68, 2012.
attenuation (e.g. Matrosov et al., 2007; Friedrich et al., Cifelli, R., Chandrasekar, V., Lim, S., Kennedy, P. C., Wang, Y., and
Rutledge, S. A.: A New Dual-Polarization Radar Rainfall Algo-
2007; Lang et al., 2009; Cifelli et al., 2011; Tabary et
rithm: Application in Colorado Precipitation Events, J. Atmos.
al., 2011; Vulpiani et al., 2012; and Cao et al., 2012, for
Ocean. Tech., 28, 352–364, 2011.
a general introduction to weather radar polarimetry); Collier, C. G.: Applications of weather radar systems: A guide to
uses of radar data in meteorology and hydrology, 2nd Edn., John
– and 3-dimensional scan information to correct for the
Wiley and Sons, New York, 1996.
effects of non-homogeneous vertical profiles of reflec-
Cruse, R., Flanagan, D., Frankenberger, J., Gelder, B., Herzmann,
tivity (e.g. Franco et al., 2006; Tabary, 2007; Bouilloud D., James, D., Krajewski, W., Kraszewski, M., Laflen, J., Op-
et al., 2010; Kirstetter et al., 2010). somer, J., and Todey, D.: Daily estimates of rainfall, water runoff,
and soil erosion in Iowa, J. Soil Water Conserv., 61, 191–199,
The other wradlib modules also are highly dynamic and of-
2006.
fer a huge potential for further improvements (e.g. related to Einfalt, T., Arnbjerg-Nielsen, K., Golz, C., Jensen, N. E., Quirm-
interpolation, gage adjustment, quality assessment, and visu- bach, M., Vaes, G., and Vieux, B.: Towards a roadmap for use of
alisation). radar rainfall data in urban drainage, J. Hydrol., 299, 186–202,
2004.
Fornasiero, A., Bech, J., and Alberoni, P. P.: Enhanced radar pre-
5 How to use wradlib? cipitation estimates using a combined clutter and beam blockage
correction technique, Nat. Hazards Earth Syst. Sci., 6, 697–710,
– Get the wradlib source distribution at http://www. doi:10.5194/nhess-6-697-2006, 2006.
bitbucket.org/wradlib/wradlib; Franco, M., Sanchez-Diezma, R., and Sempere-Torres, D.: Im-
provements in weather radar rain rate estimates using a method
– see the wradlib documentation at http://www.wradlib.
for identifying the vertical profile of reflectivity from volume
bitbucket.org; radar scans, Meteorol. Z., 15, 521–536, 2006.
Friedrich, K., Germann, U., Gourley, J. J., and Tabary, P.: Effects of
– get community support by joining the mailing list
radar beam shielding on rainfall estimation for the polarimetric
https://groups.google.com/forum/?fromgroups#!forum/
C-band radar, J. Atmos. Ocean. Tech., 24, 1839–1859, 2007.
wradlib-users. Gabella, M. and Notarpietro, R.: Ground clutter characterization
and elimination in mountainous terrain. In Proceedings of ERAD
2002, Delft, The Netherlands, 305–311, available at: http://www.
Supplementary material related to this article is copernicus.org/erad/online/erad-305.pdf, 2002.
available online at: http://www.hydrol-earth-syst-sci.net/ Germann, U. and Joss, J.: Operational measurement of precipita-
17/863/2013/hess-17-863-2013-supplement.pdf. tion in mountainous terrain, in: Weather Radar: Principles and
Advanced Applications, Physics of Earth and Space Environ-
ments, edited by: Meischner, P., 52–77, Springer, Berlin, Ger-
many, 2004.
Acknowledgements. The development of wradlib was supported Germann, U., Galli, G., Boscacci, M., and Bolliger, M.: Radar pre-
by the University of Stuttgart, the University of Potsdam, and the cipitation measurement in a mountainous region, Q. J. Roy. Me-
German Federal Ministry for Education and Research (BMBF) teor. Soc., 132, 1669–1692, 2006.
through the PROGRESS project. The example radar data shown German Weather Service: Projekt RADOLAN – Routinever-
in this paper were provided by courtesy of the German Weather fahren zur Online-Aneichung der Radarniederschlagsdaten mit
Hydrol. Earth Syst. Sci., 17, 863–871, 2013 www.hydrol-earth-syst-sci.net/17/863/2013/M. Heistermann et al.: An open source library for processing weather radar data 871 Hilfe von automatischen Bodenniederschlagsstationen, Final Re- Lang, T. J., Nesbitt, S. W., and Carey, L. D.: On the Correction port, Offenbach, Germany, available at: http://www.dwd.de/ of Partial Beam Blockage in Polarimetric Radar Data, J. Atmos. RADOLAN (last access: February 2013), 2004 (in German). Ocean. Tech., 26, 943–957, 2009. Goudenhoofdt, E. and Delobbe, L.: Evaluation of radar-gauge Marzoug, M. and Amayenc, P.: A Class of Single-and Dual- merging methods for quantitative precipitation estimates, Hy- Frequency Algorithms for Rain-Rate Profiling from a Space- drol. Earth Syst. Sci., 13, 195–203, doi:10.5194/hess-13-195- borne Radar. Part I: Principle and Tests from Numerical Simu- 2009, 2009. lations, J. Atmos. Ocean. Tech., 11, 1480–1506, 1994. Hardegree, S. P., Van Vactor, S. S., Levinson, D. H., and Winstra, A. Matrosov, S. Y., Clark, K. A., and Kingsmill, D. E.: A polarimet- H.: Evaluation of NEXRAD radar precipitation products for nat- ric radar approach to identify rain, melting-layer, and snow re- ural resource applications, Rangeland Ecol. Manage., 61, 346– gions for applying corrections to vertical profiles of reflectivity, 353, 2008. J. Appl. Meteorol. Clim., 46, 154–166, 2007. Harrison, D. L., Driscoll, S. J., and Kitchen, M.: Improving pre- Michelson, D. B. and Koistinen, J.: Gauge-radar network adjust- cipitation estimates from weather radar using quality control and ment for the Baltic Sea Experiment, Phys. Chem. Earth Pt. B, correction techniques, Meteorol. Appl., 7, 135–144, 2000. 25, 915–920, 2000. Heistermann M. and Kneis, D.: Benchmarking quantitative precip- Michelson, D. B., Lewandowski, R., Szewczykowski, M., and itation estimation by conceptual rainfall-runoff modeling, Water Beekhuis, H.: EUMETNET OPERA weather radar informa- Res. Resour., 47, W06514, doi:10.1029/2010WR009153, 2011. tion model for implementation with the HDF5 file format, Ver- Hitschfeld, W. and Bordan, J.: Errors inherent in the radar mea- sion 2.1. OPERA Working Document WD 2008 03, available surement of rainfall at attenuating wavelengths, J. Meteorol., 11, at: http://www.knmi.nl/opera/opera3/OPERA 2008 03 WP2.1b 58–67, 1954. ODIM H5 v2.1.pdf (last access: February 2013), 2011. Kirstetter, P. E., Andrieu, H., Delrieu, G., and Boudevillain, B.: Nicol, J. C. and Austin, G. L.: Attenuation correction constraint for Identification of Vertical Profiles of Reflectivity for Correction single-polarisation weather radar, Meteorol. Appl., 10, 345–354, of Volumetric Radar Data Using Rainfall Classification, J. Appl. 2003. Meteorol. Clim., 49, 2167–2180, 2010. Paulitsch, H., Fuchsberger, J., and Köck, K.: FM94-BUFR En- Kitchen, M. and Blackall, R. M.: Representativeness errors in com- coding and Decoding Software, User Guidelines Version 1.6 parisons between radar and gauge measurements of rainfall, J. For BUFR Software Version 3, available at: http://www.knmi. Hydrol., 134, 13–33, 1992. nl/opera/bufr/doc/bufr sw desc.pdf, 2010. Kneis, D. and Heistermann, M.: Quality assessment of radar-based Seed, A. W., Nicol, J., Austin, G. L., Stow, C. D., and Bradley, S. precipitation estimates with the example of a small catchment, G.: The impact of radar and raingauge sampling errors when cal- Hydrol. Wasserbewirts., 53, 160–171, 2009. ibrating a weather radar, Meteorol. Appl., 3, 43–52, 1996. Kraemer, S.: Quantitative Radardatenaufbereitung für die Nieder- Tabary, P.: The new French operational radar rainfall product. Part schlagsvorhersage und die Siedlungsentwässerung. Mitteilun- I: Methodology, Weather Forecast., 22, 409–427, 2007. gen Institut für Wasserwirtschaft, Hydrologie und Land- Tabary, P., Boumahmoud, A.-A., Andrieu, H., Thompson, R. J., wirtschaftlichen Wasserbau Gottfried Wilhelm Leibniz Univer- Illingworth, A. J., Le Bouar, E., and Testud, J.: Evaluation of sität Hannover, Heft 92, ISSN 0343-8090, Hanover, Germany, two “integrated” polarimetric Quantitative Precipitation Estima- 2008. tion (QPE) algorithms at C-band, J. Hydrol., 405, 248–260, 2011. Kraemer, S. and Verworn, H. R.: Improved radar data processing Vulpiani, G., Montopoli, M., Passeri, L. D., Gioia, A. G., Giordano, algorithms for quantitative rainfall estimation in real time, Water P., and Marzano, F. S.: On the Use of Dual-Polarized C-Band Sci. Technol., 60, 175–184, 2009. Radar for Operational Rainfall Retrieval in Mountainous Areas, Krajewski, W. F. and Smith, J. A.: Radar hydrology: rainfall esti- J. Appl. Meteorol. Clim., 51, 405–425, 2012. mation, Adv. Water Res., 25, 1387–1394, 2002. Krajewski, W. F., Kruger, A., Smith, J. A., Lawrence, R., Gunyon, C., Goska, R., Seo, B. C., Domaszczynski, P., Baeck, M. L., Ra- mamurthy, M. K., Weber, J., Bradley, A. A., DelGreco, S. A., and Steiner, M.: Towards better utilization of NEXRAD data in hy- drology: an overview of Hydro-NEXRAD, J. Hydroinform., 13, 255–266, 2011. www.hydrol-earth-syst-sci.net/17/863/2013/ Hydrol. Earth Syst. Sci., 17, 863–871, 2013
You can also read