STOCK SPLITS AND THE IMPACT ON ABNORMAL RETURN - DIVA PORTAL
←
→
Page content transcription
If your browser does not render page correctly, please read the page content below
Stock Splits and the Impact on
Abnormal Return
 - A Quantitative Research on Nasdaq Stockholm

Adam Bratt, Giovanni Fausti & Gustaf Sandelin

Stockholm Business School
Bachelor’s Degree Thesis 15 HE Credits
Subject: Business Administration
Spring semester 2021
Supervisor: Sara Jonsson
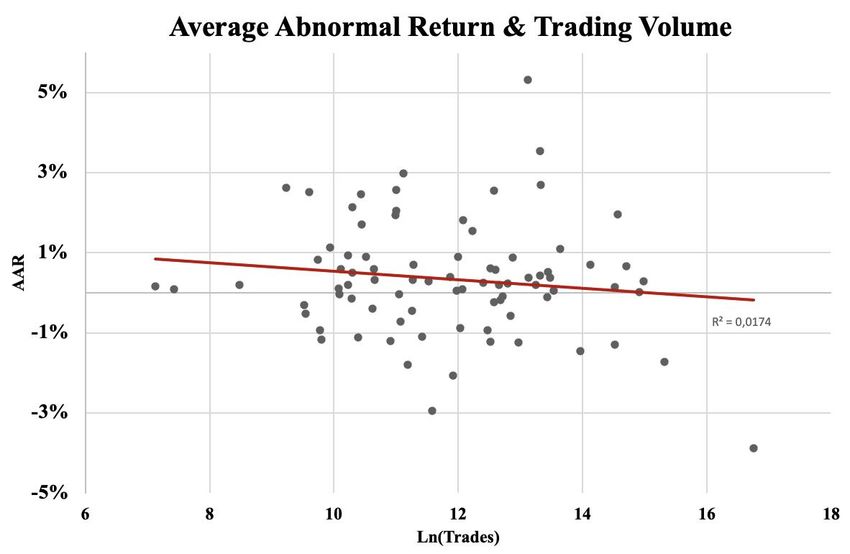
Table of contents

Abstract ................................................................................................................................................................... 5

1.0 Introduction ...................................................................................................................................................... 6
 1.1 Background ....................................................................................................................................................................... 6
 1.2 Problem Discussion ........................................................................................................................................................... 7
 1.3 Research Design ................................................................................................................................................................ 8
 1.4 Aim and Knowledge Contribution .................................................................................................................................... 8
 1.5 Limitations ........................................................................................................................................................................ 9
 1.6 Outline ............................................................................................................................................................................... 9

2.0 Literature Review ........................................................................................................................................... 10
 2.1 Introduction ..................................................................................................................................................................... 10
 2.2 Theoretical Framework ................................................................................................................................................... 10
 2.2.1 Efficient Market Hypothesis ................................................................................................................ 10
 2.3 Literature Survey and Development of Hypotheses ....................................................................................................... 11
 2.3.1 Abnormal Return and Announcement of Stock Splits ......................................................................... 11
 2.3.2 Abnormal Return and Split Quota ....................................................................................................... 12
 2.3.3 Abnormal Return and Firm Size .......................................................................................................... 14
 2.3.4 Abnormal Return and Trading Volume ............................................................................................... 14
 2.3.5 Criticism of Sources ............................................................................................................................. 16
 2.4 Conclusion....................................................................................................................................................................... 16

3.0 Research Design .............................................................................................................................................. 17
 3.1 Problem, Purpose and Contribution ................................................................................................................................ 17
 3.2 Scientific Perspective ...................................................................................................................................................... 17
 3.3 Data Selection ................................................................................................................................................................. 17
 3.4 Selection and Delimitation .............................................................................................................................................. 18
 3.5 Event Study ..................................................................................................................................................................... 19
 3.5.1 Estimation Window and Event Window .............................................................................................. 20
 3.5.2 Calculation Formulas Abnormal Return .............................................................................................. 21
 3.5.3 Significance Test .................................................................................................................................. 22
 3.6 Multivariate Regression .................................................................................................................................................. 23
 3.6.1 Construction of the Dependent Variable.............................................................................................. 24
 3.6.2 Construction of the Independent Variables .......................................................................................... 24
 3.6.3 Construction of the Control Variables ................................................................................................. 24
 3.7 Method Evaluation .......................................................................................................................................................... 25
 3.7.1 Event Study .......................................................................................................................................... 25
 3.7.2 Multivariate Regression ....................................................................................................................... 26
 3.8 Reliability and Validity ................................................................................................................................................... 27

4.0 Empirical Results ............................................................................................................................................ 27
 4.1 Descriptive statistics........................................................................................................................................................ 27
 4.1.1 Event Study .......................................................................................................................................... 27
 4.1.2 Multivariate Linear Regression............................................................................................................ 29
 4.2 Empirical Results ............................................................................................................................................................ 31
 4.2.1 Event Study .......................................................................................................................................... 31
 4.2.2 Multivariate Linear Regression............................................................................................................ 32

 2
5.0 Discussion and Critical Reflection ................................................................................................................ 35
 5.1 Event Study ..................................................................................................................................................................... 35
 5.2 Regression Analysis ........................................................................................................................................................ 36

6.0 Conclusions...................................................................................................................................................... 40
 6.1 Future Research............................................................................................................................................................... 41

7.0 Limitations ...................................................................................................................................................... 42

References.............................................................................................................................................................. 43

Appendix................................................................................................................................................................ 45

 3
Acknowledgements

The authors of this thesis would like to thank supervisor Sara Jonsson but also our opponents Robin
Blomqvist, Marcus Liedgren and Filippa Pettersson for providing valuable advice of improvement
during the writing process of the paper.

 4
Abstract

Throughout history stock splits have only been seen as a cosmetic change on how a firm express its
market value of equity. This study investigates if abnormal return occurs in connection with stock split
announcements on Nasdaq Stockholm and how the variations may be explained by selected factors. An
event study is performed on 83 stock splits during the time period 2010-2020 to establish if abnormal
return is present. With a multivariate linear regression, split quota, firm size and trading volume are the
selected factors which may explain the variations in abnormal return. The results from the event study
establish abnormal return one day prior to the announcement and the event day itself. Further, the
regression confirms at a statistically significant level the negative relationship between firm size and
abnormal return. For trading volume, the regression finds no statistically significant result and thereby
it does not explain the variations in abnormal return. As for split quota, no conclusion can be drawn
whether it affects abnormal return or not. The study concludes the occurrence of abnormal return in
connection with stock split announcements on Nasdaq Stockholm and firm size as one of the factors
explaining the variations.

Key words: stock splits announcements, abnormal return, split quota, firm size, trading volume, event
study, multivariate linear regression

 5

1.0 Introduction
1.1 Background
For almost half a century, stock splits have been widely analyzed in an attempt to quantify its value to
the issuing firms, to potential stockholders, and to existing stockholders (Reilly & Drzycimski, 1981).
It is generally believed that stock splits are purely cosmetic, since the firms’ cash flows are unaffected.
Therefore, each shareholder retains their proportionate ownership, and the claims of other classes of
security holders are unaltered (Brennan & Copeland, 1988). Even though there is no real change
following a stock split, the event sends positive signals to the market and can create a positive abnormal
return (Lamoureux & Poon, 1987). When firms perform stock splits new shares are issued and a lower
current market price is achieved. If a firm is trading at 1000 SEK prior to a 2-for-1 split, the result after
the split will be a stock price of 500 SEK. The investor who holds the stock will then have twice the
amount of the original number of shares pre-split. (Nasdaq, 2021).

Besides a regular stock split, there are also reverse stock splits, instead of splitting one share into two or
any other number, which decreases the overall stock price. The reverse stock split makes two shares or
any other number into one share, thus increasing the overall stock price (Han, 1995).

Stock splits have been heavily covered and studied throughout its existence. The motives for a firm to
perform a stock split are many and one is not better supported by data than others (Lakonishok & Lev,
1987). One reason that is widely accepted and often mentioned is to lower the share price and to keep it
within an optimal trading range (Baker & Gallagher, 1980). There are several reasons to keep the share
price at a certain level, the most important one is to keep the share attractive to different investors and
thereby keeping a broad ownership base (Baker & Gallagher, 1980).

Though stock splits are only a cosmetic change to the companies performing them, the market reacts to
the changes. A regular stock split sends signals to the market that there are future increased earnings
and hence an increased stock price, thereby creating an abnormal return (McNichols & Dravid, 1990).
This contradicts the fact that stock splits only are a cosmetic change. Furthermore, the efficient market
hypothesis presented by Fama (1970), concludes that markets are efficient and there are no possibilities
for abnormal return, therefore, contradicting the fact that stock splits create abnormal return.

 6
1.2 Problem Discussion
The case of stock splits is especially interesting due to the strong contradiction between earlier and later
empirical findings. Fama et al (1969) find no abnormal return following the announcement of stock
splits, whereas both Grinblatt et al (1984) and Brennan & Copeland (1988) report abnormal return.
Furthermore, there are plenty of more recent studies which finds support for the latter such as Ikenberry
et al (1996) and Hu et al (2017). On the other hand, the explaining factors behind abnormal return and its
variation, is something there is no consensus about. Abnormal return is described as the excess return which
cannot solely be explained by the expected market return (MacKinlay, 1997).

Prior studies on the US stock market have shown that the variations in abnormal return can be explained by
several factors. One factor is the choice of split quota by the company. Depending on the chosen split quota,
it gives the market different signals on future earnings. A higher split quota signals higher future earnings and
respectively a higher abnormal return (McNichols & Dravid, 1990). An additional factor that has been studied
is the share price; where the dominant theory is to keep the trading price at an optimal range (Baker &
Gallagher, 1980; Angel, 1997). Moreover, it has been concluded that the returns of stocks with high
trading volume lead returns of stocks with low trading volume, primarily because the high-volume
stocks adjust faster to market wide information. This is in accordance with the speed of adjustment
hypothesis. Consequently, trading volume plays an important role in the distribution of market wide
information. (Chordia & Swaminathan, 2000).

Most of the research around the chosen subject is conducted on the US market, whilst this study is made on
the Swedish market. The conclusions drawn for the US market cannot be directly applied on the Swedish
market, and there are several reasons for this. First and foremost, how the markets are structured, regulated
and situated in different countries. For example, under the tax laws in Sweden a private investor can trade
using an ISK portfolio only taxed at 0,375%. This will affect how much a single person is willing to trade on
the market. Secondly, the market size between the two countries differs considerably. The US market is
significantly larger, contains more firms, analyzed at a greater extent and it has a bigger international
participation. Lastly, there is the structuring of firms with different share types being traded on the market.
These factors affect how the sample size, the selection and delimitation process which further affects the
results.

For the Swedish market, there is limited research regarding stock splits and their effects. However, there
are some studies on the Swedish stock market which concludes that managers in Swedish companies
perform stock splits for the main reason to keep their share price at a certain desired level (Burnie & de
Ridder, 2011). For example, if the share price gets too high for their preference, they perform a stock
split to drive down the price and repeats the process if needed. An additional effect to the event of a

 7
stock split is the creation of abnormal return. This effect seems to be regarded as a bonus, not the main
objective for company managers. One of few studies on the Swedish stock market with regards to stock
splits and abnormal return indicates the relationship between stock split announcements and significant
positive price reactions (Liljeblom, 1989). Since the paper is published in 1989 it is interesting to
investigate the phenomena on more recent data. This thesis therefore investigates, firstly, do stock splits
create abnormal return on the Swedish stock market and secondly, if there are some factors that can
explain the variations in abnormal return. Hence, the following research questions:

 1) Do announcements of stock splits generate positive abnormal return on the Swedish stock
 market?
 2) Can split quota, firm size and trading volume explain the variations in abnormal return?

1.3 Research Design
The chosen approach for the research is deductive and quantitative. By performing a deductive
approach, theory about the subject is gathered and then hypotheses are formulated. Secondly, data is
collected and then analysed. In conclusion, the hypotheses can either be confirmed or rejected as a result
of the tests. The chosen sample consists of all listed stocks on the Nasdaq Stockholm stock exchange,
also called OMX Stockholm PI. The collected data will first be analyzed with an event study to test
whether there is positive abnormal return with stock split announcements. Then a multivariate linear
regression will be performed to test if split quota, firm size and trading volume can explain the variations
in abnormal return.

1.4 Aim and Knowledge Contribution
The intention of this thesis is to contribute to the research area of stock splits announcements and to
establish whether abnormal return is present in the Swedish stock market. Therefore, the aim is to
broaden the knowledge of abnormal return with regard to stock split announcements on the Swedish
stock market. There is an abundance of research on stock splits on the US market but relatively few
studies have been made on the Swedish market. Further, the variations in the eventual abnormal return
will be examined with the selected variables: split quota, firm size and trading volume. The research
and contributions will be for the time period, 2010-2020.

 8
1.5 Limitations
This study is limited to companies listed on Nasdaq Stockholm, announcing stock splits from 1 January
2010 to 31 December 2020. Further, this paper analyses theories concluded on older data and mostly
the US market to see if they are still applicable on recent data as well as on the Swedish market. This
further implies that the data sample is considerably smaller than other previous studies to examine the
occurrence of abnormal return. Additional limitations to this study are the number of factors that can be
mentioned and examined, which may affect the variations in abnormal return. Existing research presents
a large number of factors that can affect the variations, this study will only mention three of them.

1.6 Outline
The rest of the paper is divided into six parts and arranged in the following way:
Chapter 2.0 focuses on previous research, their methods and conclusions. From the previous research,
hypothesizes are formed with reference to the research questions.
Chapter 3.0 introduces the chosen research methods and their design. The selection of data with its
research methods will be motivated. Lastly, a critical review of the methods will be presented.
Chapter 4.0 presents the findings from the empirical research whereas chapter 5.0 analyzes the findings
and are discussed with regards to the presented theories and the formed hypothesis.
Chapter 6.0 concludes the findings, the answers to the research questions and suggestions for additional
research.
Chapter 7.0 discusses the study limitations in terms of the chosen methods, included factors and the
chosen sample.

 9
2.0 Literature Review

2.1 Introduction
The following parts are divided in accordance with how the study is performed. First, the efficient
market hypothesis is presented. It will give some insight to how financial markets are believed to act.
Then, other research will be presented which concludes that announcements of stock splits create
abnormal return, which deviates from the fact that financial markets are efficient. Lastly, prior studies
and their theories are examined which may explain some of the variations in the abnormal return.

In this study, special focus will be given to the selected factors: split quota, firm size and trading volume.
Split quota and firm size are both widely used variables by academics when investigating the variations
in the abnormal return due to their strong empirical findings (See Beladi et al., 2016; Ford et al., 2012;
Hu et al., 2017; Ikenberry et al., 1996; McNichols & Dravid, 1990; Brennan & Copeland, 1988;
Grinblatt et al., 1984). However, regarding the third variable, trading volume, the literature is rather
scarce with different definitions of its measure and contradictory empirical findings with no consensus
about its contribution. Hence, this article intends to broaden the understanding of this variable with a
unique construction of the measurement definition, which may explain some of the variations in the
abnormal return. Thus, adding valuable information which later studies ought to reflect upon.

Furthermore, there is an abundance of different factors which may be applied to analyze the variations
in the abnormal return such as volatility, liquidity, book-to-market ratio and P/E ratio (See Grullon et
al., 2012; Conroy & Harris, 1990; Beladi et al., 2016; Kelly et al., 2008). Since these factors are not as
deeply rooted in the academic literature as split quota and firm size and too many variables in the
regression alters the results, they will not be further analyzed.

2.2 Theoretical Framework

2.2.1 Efficient Market Hypothesis
The efficient market hypothesis suggests that at all times, all available information is fully reflected in
the prices on financial markets. The model is divided into three parts of market efficiency: weak, semi-
strong and strong form of efficiency. These three classes of market efficiency are created to examine at
which level of available information the market is efficient. The weak form defines that the current
available information is reflected in the stock price, the semi-strong form includes historical prices and
other publicly available information whilst the strong form of efficiency states that all information is
included, even inside information that is only available to a limited number of people (Fama, 1970).
Further, only the semi-strong form of market hypothesis will be presented more in depth, discussed and
analyzed. Announcements and related information about the stock split announcement is considered to

 10
be other publicly available information in coherence with the semi-strong form of efficient market. One
way to test whether the market is efficient, and if new information is absorbed into the prices, is to study
corporate events where new information is presented to the market and analyze whether new information
is adjusted efficiently into the prices. If some abnormal return is found, then the market is not efficient.
Hence, the actual return cannot be explained by the market return. Fama et al (1969) find that over
longer periods around corporate events there is no abnormal return.

Moreover, Fama (1970) states that the semi-strong form considers all historical prices and additional
publicly available information reflects the prices on financial markets. Other publicly available
information is corporate announcements and events such as stock splits, financial reports and issues of
new securities. Regarding stock splits, Fama (1970) refers to his previous study (Fama et al., 1969),
which concludes that a stock split is only to multiply the number of shares per share holder and no
change in real assets. Further, they test the returns by analyzing a large number of stock splits. The
cumulative average residuals in returns and the cumulative market model average residuals are
compared. The study concludes that from the period of 29 months prior to the announcement and 30
months after the announcement there is no significant change in cumulative average return between the
stock splitting firms and the market (Fama et al., 1969). On this basis Fama (1970) implicates that the
semi-strong market hypothesis holds. Continuing, Fama (1970) strengthens his arguments by analyzing
other types of public announcements by firms and concludes that the semi-strong form holds.

2.3 Literature Survey and Development of Hypotheses

2.3.1 Abnormal Return and Announcement of Stock Splits
The pioneering study of Fama et al (1969) concludes that stock splits have very often been associated
with substantial dividend increases. The evidence presented by the authors indicates that the market
realizes this and uses the announcement to re-evaluate the stream of expected income from the shares
(Fama et al., 1969). Moreover, the study finds no evidence that the announcement of stock splits would
yield an abnormal return. However, the latter has been criticized by more recent studies such as Grinblatt
et al (1984), Brennan & Copeland (1988), and Ikenberry et al (1996), whom all find evidence to support
that the announcement of stock splits yield a positive abnormal return. Grinblatt et al (1984) further
suggest that stock splits are associated with a firm’s future cash flows, rather than with expected
dividend increases as presented by Fama et al (1969). They also find that the average two-day abnormal
return on the announcement day and subsequent trading day is 4,3% for firms listed on New York Stock
Exchange and American Stock Exchange (Grinblatt et al., 1984). Brennan & Copeland (1988) provide
the academic literature with additional empirical evidence surrounding the occurrence of abnormal
return in relation to the announcement of stock splits. They present a model, where management is able
to communicate its private information about the firm’s prospects to investors by means of stock split

 11
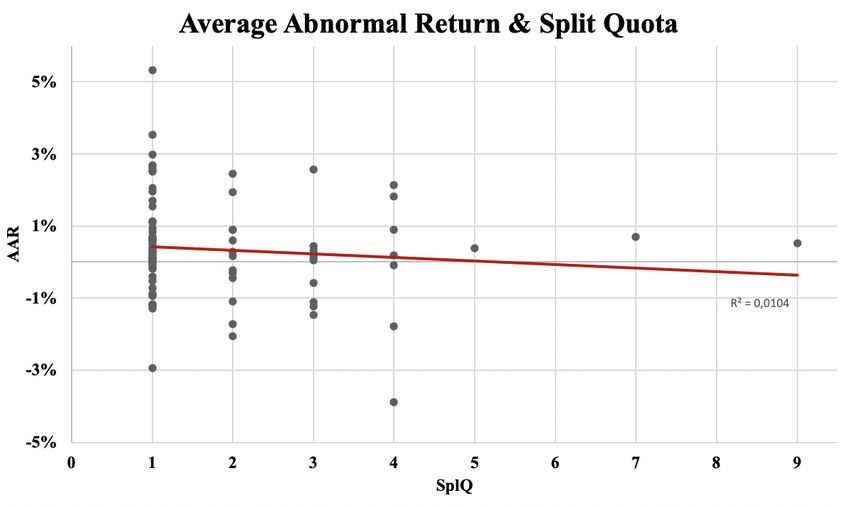
announcements, because the cost of trading depends on the stock price. Thus, the firm’s announced
number of shares acts as a costly signal of its value. Furthermore, the authors derive a positive average
abnormal return of 2,9% in connection with the announcement of stock splits. (Brennan & Copeland,
1988).

In addition, Ikenberry et al (1996) examines a sample of 1275 2:1 stock splits announced by New York
Stock Exchange and Amman Stock Exchange between the years 1975 and 1990. They find that stock
splits generally occur when stocks trade at higher prices. In the month preceding the split announcement,
almost four out of five sample firms traded at prices at or above the 80th percentile in comparison to
firms of comparable size. Moreover, the authors give evidence of a positive abnormal five-day
announcement return of 3,38%, which confirms prior academic research that stock splits convey
favorable information to the market. (Ikenberry et al., 1996). On the basis of the presented theories and
empirical results, this study anticipates to observe the following hypothesis:

 Hypothesis 1: Announcement of stock splits will generate positive abnormal return on the Swedish
 stock market.

2.3.2 Abnormal Return and Split Quota
Announcement by firms covers both the stock and split quota; the choice of split quota, lower or higher,
will affect the abnormal return. Three hypotheses will be presented that can partially explain the choice
of different split quotas. The first hypothesis is the Trading Range Hypothesis. It states that stock splits
are performed to keep the stock price within a specific trading range, either within a market average or
an industry average (Baker & Gallagher, 1980). Before the announcement, the specific firm has
experienced a larger than average growth and to keep the stock attractive to a large number of investors
some measures are applied, which will be presented. Firstly, the intended belief among practitioners, is
that stock splits are performed just to keep the stock price at normal levels, hence creating a balance
between smaller and larger investors. A lower price will enable smaller investors to buy the stocks. If
the price raises to higher levels, smaller investors might not be able to afford a single stock or deem it
too risky with such a hefty investment. Secondly, as opposed to what has been previously stated, if the
stock price becomes too low, it will not be as attractive for wealthy or institutional investors. This is a
consequence of the fixed per-share transaction cost component, which enables these investors to save
brokerage fees if securities are priced high. With this information, the stock splits are performed to keep
the stock attractive for both small and large investors. When a firm desires a specific trading range it is
important to choose the correspondent split quota that will result in the desired share price. (Lakonishok
& Lev, 1987).

 12
The second hypothesis is the Signaling Hypothesis, which states that when a firm decides to do a stock
split and choses the split quota, the size of split quota will signal to the market its level of future earnings
(McNichols & Dravid, 1990). As stated above, firms who perform a stock split have previous to the
announcement experienced an above average increase in their share price. Subsequently, when firms
perform a stock split to lower their share price and chooses a split quota according to the trading range
hypothesis, optimal range is achieved. The signaling hypothesis adds that it is not only the new share
price that will affect the firm’s chosen split quota, the split quota is also based on the private information
the firm have about its future earnings. When a firm chooses its split quota, it signals to the market about
its private information concerning earnings forecasts. A higher split quota will give signals of higher
future earnings, thus resulting in a larger abnormal return on the specific stock (McNichols & Dravid,
1990).

The third hypothesis is the Self Selection Hypothesis, which is based on both the trading range hypothesis
and signaling hypothesis. The management chooses split quota based on the optimal trading range but
conditions the choice based on forecasts about future earnings. They are aware of that if a split quota is
high and the forecasts of future earnings are higher than actual earnings it will then lead to a share price
being too low, therefore guiding the share price outside the optimal trading range. (Ikenberry et al.,
1996).

This implies that there is a positive relationship between the chosen split quota and abnormal return on
stock split announcements according to the signal hypothesis. For instance, a higher split quota will lead
to higher abnormal return on the announcement day. Firms are aware that if the split quota is too high
the share price will fall outside the trading range and the split will not have the desired effect of restoring
the share price to an optimal level, which is aligned with the self-selection hypothesis.

The study performed by McNichols & Dravid (1990) concludes that the abnormal return increases by
1,6% with an increase of one in split quota. Later studies have shown that companies performing stock
splits have experienced higher abnormal return with a higher chosen split quota. Beladi et al (2016)
present that if the split quota increases with one, instead of one share becoming two, one share becomes
three, then the abnormal return increases with 1,37%. Ford et al (2012) conclude that the abnormal return
increases between 1,30-1,37% when split quota increases with one. On the basis of the presented
theories and empirical results, this study anticipates to observe the following hypothesis:

Hypothesis 2: There is a positive relationship between split quota and abnormal return on the Swedish
 stock market.

 13
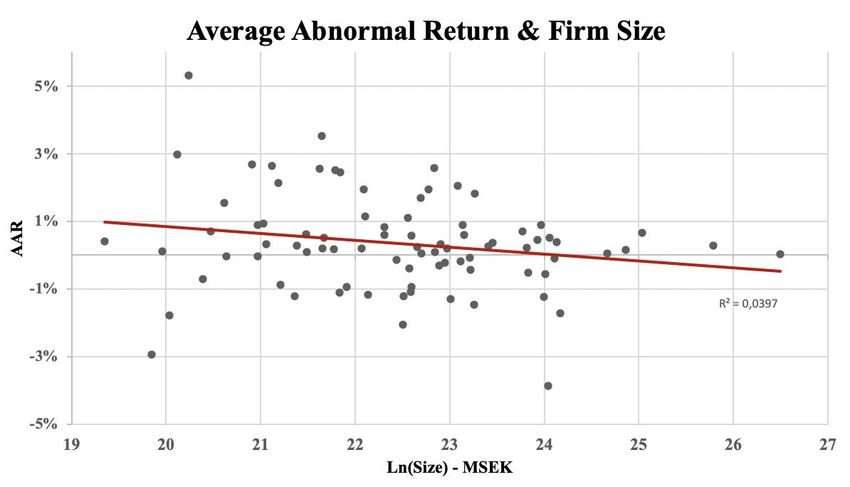
2.3.3 Abnormal Return and Firm Size
Firm size contributes to the variations in abnormal return with regards to announcements of stock splits.
Large firms are usually more exposed and followed by equity analysts and therefore exposed to a larger
political and public attention, which contributes to further monitoring compared to smaller firms on the
market (Watts & Zimmerman, 1990; Brennan & Hughes, 1991). Another peer-reviewed academical
article is the one written by Ford et al (2012), which investigates how abnormal return is affected by
announcement of stock splits and further how it is affected by analysts monitoring, which varies reliant
to firm size. The authors detect that firms which are monitored to a greater extent generates lower
abnormal return, but also that the negative relation is stronger for larger firms than smaller firms (Ford
et al., 2012). Firms that engage in stock splits are generally larger than the average, hence implying that
stock splits happens when stock prices are too high (Lakonishok & Lev, 1987).

Brennan & Copeland (1988) state in their study that the variables target price and firm value contribute
to 15-16% of the variance in announcement returns. They also mention that the coefficient of the firm
value is negative, which would suggest a lower abnormal return the larger the firm value. The reason
for this can be explained by small firms not publishing new information to the same extent as the larger
firms do in financial press, which contributes to a greater market interest compared to the larger firms
(Grinblatt et al.,1984). Ikenberry et al (1996) validates the result above by ranking firms into deciles
depending on if they are small firms (decile 1, 2, 3) or larger firms (decile 10). The result concludes that
small firms have an abnormal return of 10,04% and the larger firms have an abnormal return of only
1,01% (Ikenberry et al., 1996). Ikenberry et al (1996) also mention that this result is consistent with the
evidence reported by Grinblatt et al (1984) and Brennan & Copeland (1988). Further, recent studies
show that small firms usually generate higher abnormal return with regard to announcements of stock
splits compared to larger firms, since firm value has an inverted relationship to abnormal return (Beladi
et al., 2016). On the basis of the presented theories and empirical results, this study anticipates to observe
the following hypothesis:

Hypothesis 3: There is a negative relationship between firm size and abnormal return on the Swedish
 stock market.

2.3.4 Abnormal Return and Trading Volume
The analysis of trading volume ought to provide insights to the impact of the information given to the
public. Furthermore, it is essential to consider daily data rather than monthly, as it is possible that result
with monthly data could display that while stock prices adjust before the end of the month, there could
be numerous profit opportunities for investors who are able to trade during the days surrounding the
announcement. Hence, the announcement date is the relevant point for further analysis to test profit
opportunities for aggressive investors, rather than the split date that comes several weeks later. (Reilly

 14
& Drzycimski, 1981). Further, the results of the study regarding trading volume indicates a slight
increase prior to the split announcement, a major spike on the day of the public announcement, then a
drop on the subsequent day and generally declining volume thereafter (Ibid). From Reilly & Drzycimski
(1981) exhibit 2, it is observed that there is a 57% increase in mean volume relative to the New York
Stock Exchange volume from the day prior to the announcement and the subsequent public
announcement day. However, the direct effects that stock split announcements have on trading volume
are much disputed, with studies such as Conroy et al (1990) and Ikenberry et al (1996), whom report
that splits increase the number of stockholders and the number of trades. Although, there is little
evidence that splits lead to increased trading volume (Ikenberry et al., 1996).

Lakonishok & Lev (1987) find that compared with the peak volume during the eight to twelve months
preceding the split announcement, the post-announcement volume is lower, however, this peak volume
is obviously abnormal for the firms conducting a split, reflecting their unusual operational performance.
As stated by Morse (1981), there is ample evidence suggesting that trade volume increases abnormally
(relative to past “normal” volume) around the announcement of unexpectedly large earnings and
subsides thereafter. This is also supported by the findings of Lakonishok & Lev (1987) whom concludes
that splitting firms experienced particularly large earning increases during the year preceding the split
announcement. Thus, the findings support the signaling hypothesis which conveys that the choice of
split factor signals positive future earnings, hence affecting the abnormal return at the announcement
day (McNichols & Dravid, 1990). However, abstracting from the data presented by Lakonishok & Lev
(1987), the abnormal volume (approximately 12 months preceding the announcement), it is clear that
the splitting firms’ average post-announcement volume (roughly 4%) is very similar to the post-split
average volume for the control firms. Thus, stock splits do not seem to transmit a permanent effect on
the volume of trade.

Moreover, Chordia & Swaminathan (2000) find that daily or weekly return of stocks with high trading
volume lead daily or weekly return of stocks with low trading volume. Additional tests specify that this
effect is related to the tendency of high-volume stocks to respond swiftly, whereas low volume stocks
to respond slowly to market-wide information. Further, this is coherent with the speed of adjustment
hypothesis. Hence, trading volume plays a key role in the dissemination of market-wide information.
(Chordia & Swaminathan, 2000). On the basis of the presented theories and empirical results, this study
anticipates to observe the following hypothesis:

 Hypothesis 4: There is a positive relationship between trading volume and abnormal return on the
 Swedish stock market.

 15
2.3.5 Criticism of Sources
When conducting research regarding abnormal return and the announcement of stock splits, event
studies have been used in the majority of the academic articles and some modifications to the event
definition itself has been observed. Fama et al (1969) used a large event window, 29 months prior and
30 months subsequent to the public announcement. Later studies by Grinblatt et al (1984) and Brennan
& Copeland (1988) used a shorter event window; 10 days prior and 16 days following the
announcement. The most recent studies by Ikenberry et al (1996), Ford et al (2012) and Beladi et al
(2016) used an even shorter event window, only five days before to five days after the announcement.
The use of different event windows has led to different results. A longer event window as applied by
Fama et al (1969) will contain more corporate events than only the stock split announcement and
therefore exogenous factors may influence the results, furthermore, the study did not find any abnormal
return. Applying a shorter event window as later studies have done allows the stock split event itself to
be more isolated and less influenced by other corporate and external events (Grinblatt et al., 1984;
Ikenberry et al., 1996). Both Grinblatt et al (1984) and Ikenberry et al (1996) find empirical evidence of
abnormal return, in contrast to Fama et al (1969). The shorter event window can be criticized since it
only focusses on eleven days and in that short span abnormal return may often be observed. By
shortening the event window, it seems that the likelihood of abnormal return increases. Becoming even
more extreme and only examining the public announcement day of the stock split, abnormal return will
most likely be observed (See Grinblatt et al., 1984; Brennan & Copeland, 1988; Ikenberry et al., 1996;
Fort et al., 2012; Beladi et al., 2016). However, it seems that the short window of five days subsequent
and five days prior to the event is generally accepted and is continuously used in academic articles when
conducting an event study (see Ford et al., 2012; Beladi et al., 2016; Li et al., 2013).

2.4 Conclusion
Firstly, two conflicting theories regarding stock split announcements are presented. The first one is the
efficient market hypothesis which states that in an efficient market there are no abnormal return, only
the market return, even when there are corporate events that conveys new information to the market.
The efficient market hypothesis is then criticized by later studies who find abnormal return in the days
surrounding the announcement of a stock split. Secondly, evidence is presented that can explain the
variations in the observed abnormal return. The first factor that can affect the abnormal return is the
choice of split quota, in connection with split quota there are three main hypothesizes that tries to explain
the choice: Trading Range Hypothesis, Signaling Hypothesis and Self Selection Hypothesis. The second
factor that can explain the variations in abnormal return is the firm size. Theory within firm size is that,
depending on the size, firms publish information in different extent. Trading volume is the third and last
factor to be examined. Depending on the volume, prices adjust at different speeds when new information
is published. These theoretical dictums, mostly conducted on the US market, presents support for the

 16
mentioned theories and hypotheses, however, by investigating the scarcely analyzed Swedish market,
this paper intends to broaden the understanding of stock split announcements and its possible effects.

3.0 Research Design

3.1 Problem, Purpose and Contribution
The purpose of this thesis is to investigate whether the announcements of stock splits on the Swedish
stock market has any effect on abnormal return and further if split quota, firm size and trading volume
have an impact on the variations in abnormal return. From an investors’ point of view, it is relevant to
examine if positive abnormal return can be proven to exist on the Swedish stock market. Then investors
could apply this strategy to generate positive returns based only on stock splits announcements. This
thesis will contribute to previous research both by investigating the most recent time period, 2010-2020,
but also by only researching the Swedish market since most of the previous research is international.

3.2 Scientific Perspective
This thesis scientific perspective is quantitative in addition to a deductive and positivistic approach. A
quantitative research starts with particular theories which leads to specific hypotheses and lastly using
numerical data to further verify the hypotheses (Holton & Burnett, 2005). The existence of abnormal
return with regard to stock splits announcements is investigated by examining historical data such as
share price and testing the significance using a statistical test, a clear illustration of a quantitative
research method. A deductive research process aims to test a theory by collecting data and testing
whether the data can confirm or deny the theory. The advantage of the deductive approach is that, if
properly conducted, it will assure content validity. (Holton & Burnett, 2005). Lastly, positivism assumes
that the world is objective and that researchers seek out facts in terms of relationships among variables
(Holton & Burnett, 2005).

3.3 Data Selection
The aim of this study is to investigate stock splits on the Swedish stock market and for that quantitative
data on the number of stock splits, dates of announcements, split factors and historical stock prices are
needed. The data used in this study is retrieved from the database Thomson Reuters Eikon. The dates
for stock splits announcements and split factors for all listed companies on Nasdaq Nordic Sweden are
obtained through the tool for advanced event searches in Eikon. Daily closing prices for shares, market
values the day before the announcement and closing prices for the OMXSPI index are retrieved from
Eikon Datastream. Daily data is used as it improves the precision and quality in measurements of how

 17
stock splits affect share prices (Kothari & Warner, 2007). A total of 119 stock splits are included during
the period 2010-2020, before selection and delimitation.

3.4 Selection and Delimitation
To avoid skewness in the result, the selection of observations is made according to certain predetermined
criteria. The basis criteria is that all observations must have complete data about announcements of stock
splits and announced split quota used. Zero stock splits lacked complete data and are therefore excluded
from the sample. In the sample, some shares were listed on the Stockholm Stock Exchange, but they are
traded on other trading markets as well. These observations are excluded from the study as it only
examines stock splits on the Stockholm Stock Exchange, a total of 11 observations are removed.

This study only intends to examine stock splits of firms’ ordinary shares as previous studies (see Ford
et al., 2012; Beladi et al., 2016; Hu et al., 2017), which leads to excluding preference stocks from the
sample. Preference stocks do not affect the firm’s market value as it is constituted by the total value of
all ordinary shares. A total of one stock split of preference stocks are removed. Some companies also
have different types of shares outstanding on the market in the form of A and B stocks. The major
difference between these types of stocks is how the voting rights are distributed, where A stocks usually
have more voting rights in the company (Bolagsverket, 2019). The 20 observations where a company
has announced a stock split for both the A and B stock on the same day will be excluded from the
sample, as they in the event study would be observed as two different events when in reality, they are
only one. If these stocks are included, there is a risk of distorting the result, as only a few companies are
counted twice. Finally, the stock splits that did not have complete return data were also excluded, which
in total were two observations. After the selection, 83 observations for stock splits remain in the sample
during the period 2010-2020. The methodology for the selection is summarized in Table 1.

 18
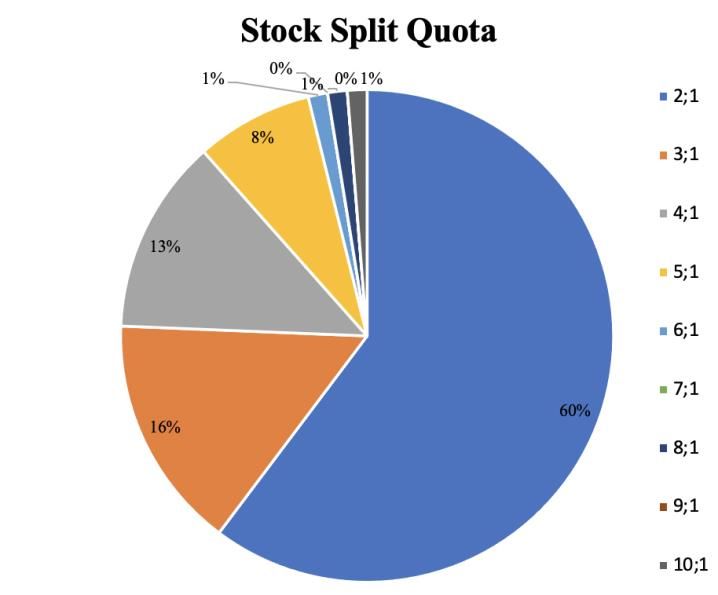
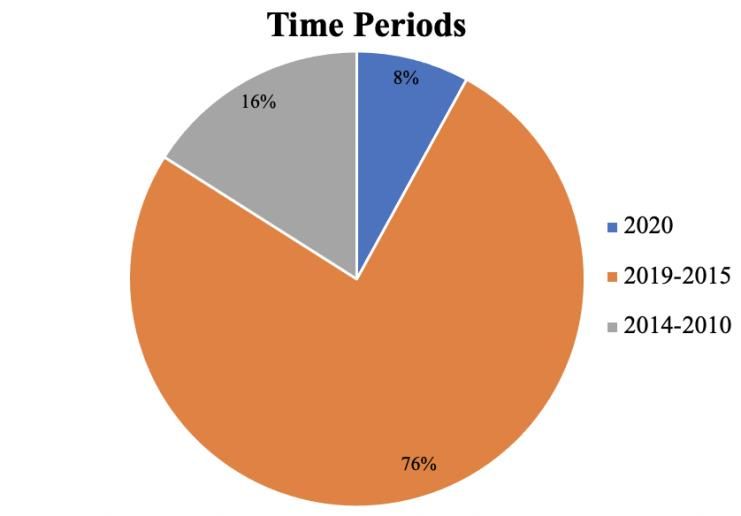
The time period for the study is 2010-2020. Since 2020 was affected by the Covid-19 pandemic, this
year will be divided later on in this study. The number of stock splits on the Stockholm Stock Exchange
sorted by year, split quota and share type are presented below in Table 2. For a more complete overview
of the sample see Appendix 1.

As Table 2 shows, the distribution of observations over the time period is uneven, since the majority of
all stock splits are announced during the period 2015-2020. Furthermore, there is a clear majority
regarding stock splits with a split quota of 2:1, which is the most common on the Stockholm Stock
Exchange. Lastly, the distribution of stock splits between A and B stocks are not the same, since B
stocks are in clear majority.

3.5 Event Study
To measure the occurrence of abnormal return in connection with announcements of stock splits on
Nasdaq Stockholm and test hypothesis 1, a quantitative approach will be used in the form of an event
study. Event studies observe the behavior of firms’ stock prices around chosen corporate events. As
presented by Kothari & Warner (2007), the usefulness of event studies ascends from the fact that the
magnitude of abnormal performance at the time of an event provides a measure of the unanticipated
impact this specific type of event has on the wealth of the firms’ shareholders. Consequently, event
studies focusing on announcement effects for a short time horizon around an event provides relevant

 19
support for understanding corporate policy actions (Kothari & Warner, 2007). Moreover, the chosen
method also serves a decisive purpose in capital market research as a way of testing market efficiency,
as systematic nonzero abnormal stock return that occurs after a particular corporate event are
inconsistent with market efficiency (Ibid). Within the research of how stock splits affect share prices,
event studies are commonly used and well cited (Ibid). With regards to previous research (See Beladi et
al., 2016; Li et al., 2013; Ford et al., 2012; Ikenberry et al., 1996) whom all perform event studies when
analyzing stock splits, thus this study will be coherent in the choice of method.

3.5.1 Estimation Window and Event Window
The initial task of an event study is to define the estimation window and the event window. The latter is
the time period over which the security prices of the chosen firms in the event will be examined, which
in this case is the return on individual stocks. The event window is often defined to be larger than the
specific period of interest, thus enabling examination of the periods surrounding the event. In practice,
the period of interest is commonly expanded to multiple days before and after the announcement. The
estimation window is the period prior to the event window which is used to estimate the normal return
which would be expected given that the event did not take place. The estimation period occurs before
the event window and contains a much larger time period because the expected normal return demands
more observations in order for the estimation to be as accurate as possible. Lastly, the event window is
not included in the estimation period, this is to prevent the event itself from influencing the estimates of
the normal performance model. (MacKinlay, 1997).

The event study intends to analyze the short-term abnormal return, which in this case is assumed to be
five trading days subsequent to the stock split announcement. A period consisting of five trading days
prior to the event is also added to examine whether there are any factors that may impact the return of
the security before the event has taken place. This definition of the event window is made accordingly
to Li et al (2013). T is the time over which this study will be conducted and the date of announcement
of the stock split is defined as (T = 0), where time is expressed in the number of trading days. Thus, the
event window that will be examined is defined as (T = -5) to (T = +5) and including the event day itself
consists of eleven trading days. The estimation period for the study can be observed as (T = -125) to (T
= -5) which in total is 120 trading days. The specific set of days contained in the estimation period is set
in respect to MacKinlay (1997). The timeline for the event study is in total 131 trading days and is
illustrated in figure 1.

 Figure 1. Illustration of estimation period and event window

 Estimation period Event window

 T
 -125 -5 0 +5

 20
3.5.2 Calculation Formulas Abnormal Return
This study will conduct all calculations for the event study in accordance with MacKinlay (1997).
Appraisal of the announcement of stock splits impact requires a measure for the abnormal return, which
is conducted by subtracting the normal return of the firm over the event window from the observed
return of the security over the same period. Further, the normal return is defined as the expected return
given that the event did not take place. This is expressed in equation (1),

 is the abnormal return for firm i during the time period T. , and ( | ) are the observed
return for firm i over the time period T, the actual return over the same period, and the normal return
given that the event did not take place respectively. Thus, the normal return needs to be estimated in
order to calculate the abnormal return.

There is an abundance of choices for modeling the normal return, however this study will apply the
Market Model where is the market return. The model is well cited and used in numerous academic
literatures (see Beladi et al., 2016; Ford et al., 2012; Li et al., 2013 Kothari & Warner, 2007; Ikenberry
et al., 1996), which makes it suitable for this kind of study. Moreover, the market model as presented
by MacKinlay (1997) is a statistical model which relates the return of any given stock to the return of
the market portfolio. The model’s linear specification follows from the assumed joint normality of
security returns, thus giving the estimates ( = 0) and ( ) = 2 , which when rearranged gives
equation (2),

 2 ( ) is the variance in abnormal return for stock i during time T. 2 is the variance for the error
term for stock i.

Given the assumptions in the Market Model, the returns for stock i can be estimated for time period T.
In accordance with MacKinlay (1997) the use of the market model for normal returns stated in the
following equation (3),

 21
 is the return for the period t for stock i, is the market return under the period t and is the
model’s error term. The parameters and are measures of non-systematic risk for stock i. As a proxy
for the market portfolio the index OMXSPI is used.

When the normal return has been calculated for the stocks in the sample with regard to the event window
abnormal return can be calculated in accordance with equation (4),

 is abnormal return, is the return for the period t for stock i and ̂ − ̂ is normal return for
stock i under period t.

When abnormal return is calculated for all the stocks under the event window, AAR is calculated in
accordance with equation (5),

 is average abnormal return under period t for stock i, is abnormal return for stock i under
period t, and N is the number of observations.

Lastly, it is required to calculate CAAR to be able to draw inferences regarding stock splits and abnormal
return, as an individual observation does not depict the general relationship (MacKinlay, 1997). This is
described in equation (6),

 ( 1, 2) is the cumulative average abnormal return from period t1 to t2 and is average
abnormal return under period t.

3.5.3 Significance Test
The announcement of stock splits on the Stockholm Stock Exchange has a positive effect on abnormal
return in the short term. This hypothesis is tested by performing a t-test in accordance with MacKinlay
(1997). This test makes it possible to statistically confirm whether the cumulative average abnormal

 22
return is significantly different from 0. The null hypothesis is that there is no abnormal return under the
investigated event and the hypothesis is rejected if the significance test reaches a critical value,
depending on the level of significance used (Kothari & Warner, 2007). The t-test in MacKinlay (1997)
requires that the variance for AAR is calculated, which is done in accordance with equation (7), then
CAAR is calculated with equation (8), and finally the t-value with equation (9).

 ( ) is the variance in average abnormal return for period t, 2 is the variance in abnormal return
under the estimation period for stock i and N is the number of observations. ( 1, 2 ) is the
variance in cumulative average abnormal return from period t1 to t2. 1 is the t-value.

3.6 Multivariate Regression
The conducted event study is only able to tell whether there is abnormal return or not when firms
announce a stock split. To test the variations in the abnormal return with regards to split quota, firm size
and trading volume, a multivariate regression will be performed. The multivariate regression will be
performed similar to previous studies (See Ikenberry et al., 1996; Beladi et al., 2016; Hu et al., 2017).
With the help of the multivariate regression, the above-mentioned factors will be examined and tested
to see if the variations in abnormal return is explainable. With the multivariate regression hypotheses 2,
3 and 4 are tested. The method will be the ordinary least squares (OLS) with a linear model, since prior
research has concluded that return on stocks is of a linear character (Beladi et al., 2016). First, the linear
regression will be made independently of each other, only having the dependent variable and one of the
explaining variables. Then the model will be tested as a whole, stated below:

 , the dependent variable, is the average abnormal return for two days before to two days after the
announcement for stock split i. The independent variables: is the split quota chosen by the firm i,
ln ( ) is the natural logarithm of the firm i size on the day before the announcement and ln ( )
is the natural logarithm of the average trading volume two days before to two days after the

 23
You can also read