The effects of the illicit market on the price-elasticity of cigarette consumption in Brazil
←
→
Page content transcription
If your browser does not render page correctly, please read the page content below
The effects of the illicit market on the price-elasticity of cigarette consumption in Brazil* José Angelo Divino Philipp Ehrl Osvaldo Candido Marcos Valadão§ Abstract Brazil has experienced a persistent and substantial reduction in the prevalence of smoking since 2006 due to a combination of anti-smoking public policies, including tobacco tax increasing. The effectiveness of these policies, however, is limited by the size of the illicit cigarette market in the economy. The objective of this paper is to provide unbiased estimates of both conditional and unconditional price elasticities of cigarette consumption in the licit and illicit markets in Brazil. We also combine these two elasticities to obtain the total price elasticity of cigarette demand. We use a rich data set by merging the National Household Sample Survey (PNAD) of 2008 and the National Health Survey (PNS) of 2013 and apply both pooled and Probit estimations. We also disaggregate the sample by income quartiles, age cohorts and year. We use the official minimum cigarette price defined by the government to identify the illicit market. The results indicate substantial differences in the estimated price elasticities across income quartiles and age cohorts in both licit and illicit markets. Specifically, individuals are less sensitive to price changes when purchasing cigarettes in the illicit market as the estimated price elasticities are significantly lower (in absolute values) than in the licit market. This finding has important implications for anti-smoking public policies, as they might not affect purchases of cigarettes in the illicit market as desirable. Keywords: Price elasticity; Licit cigarette market; Illicit cigarette market; Public policy. JEL Codes: I18; C21; H29. We are grateful to Frank Chaloupka, German Rodriguez Iglesias, Michal Stoklosa, Erika Siu, Alan Fuchs and seminar participants at the 2019-UIC and LAC partners meeting in Mexico City for their comments and suggestions. This research (grant number 17409) is funded by the University of Illinois at Chicago’s (UIC) Institute for Health Research and Policy to conduct economic research on tobacco taxation in Brazil. UIC is a partner of the Bloomberg Initiative to Reduce Tobacco Use. The views expressed in this document cannot be attributed to, nor do they represent, the views of UCB, FGV, UIC, the Institute for Health Research and Policy, or Bloomberg Philanthropies. Catholic University of Brasília (UCB), Brasilia-DF, Brazil. § Getulio Vargas Foundation (FGV), Brasilia-DF, Brazil.
1 Introduction

The empirical literature on tobacco economics is extensive and includes applications to several
countries around the world. Theoretically, it relies on the studies of addictive goods, as
pioneered by Stigler and Becker (1977), Becker and Murphy (1988), Becker (1996), among
others. Chaloupka (1991) applied the rationality model of Becker and Murphy (1988) and
argued that addiction increases the price-elasticity of demand by cigarettes in the long run.
Besides, the young and the less educated are myopic when compared to adults or those more
educated. For the Brazilian economy, there are a few empirical applications mostly focused on
the estimation of price and income elasticities of cigarette consumption.

Brazil is usually referred to as a successful case of tobacco control policies, having experienced
a persistent and substantial reduction in the prevalence of smoking since 2006. However, an
important element to consider in tobacco tax policy is the illicit market of cigarette sales. Data
from the Federal Revenue Service ((Receita Federal do Brasil - RFB) indicate a decrease close to
50 percent in the licit production of manufactured cigarettes from 2006 to 2018. At the same
time, the size of the illicit cigarette market in Brazil fluctuates, depending on the period and
method of estimation.1 Thus, to some extent, Brazil could be experiencing a substitution of licit
cigarettes by illicit ones, which would require additional policy measures focused on curbing
illicit trade.

The objective of this study is to provide unbiased estimations of both conditional and
unconditional own price-elasticities of cigarette consumption in the whole market as well as in
the licit and illicit markets of cigarette sales in Brazil. Based on the National Household Sample
Survey (PNAD) of 2008 and the National Health Survey (PNS) of 2013, we estimate conditional
price elasticities of cigarette consumption and the probability of smoking by quartile of income,
age cohorts and year. We apply a novel identification strategy for the illicit market based on
cigarettes purchases below the official floor price defined by the government.2 The potential
endogeneity problem is accounted for by using the average regional price instead of the unit
price in the regressions, as an adaptation of the Deaton (1988) method. By doing so, we reduce
the risk of reverse causality in the estimated models.

The results indicate that, considering the licit market of cigarettes and correcting for
endogeneity, the estimated conditional own price elasticity (or smoking intensity) of cigarette
consumption ranges from -0.37 in the first quartile of income to -0.44 in the fourth quartile. In
the illicit market, the estimates are -0.24 for the first quartile and -0.29 for the fourth quartile
of income. Not only are the values smaller (in absolute terms) within a given income quartile
but also the total variation between quartiles is lower in the illicit market. The unconditional
price elasticity, which considers the probability of starting or quitting smoking in the entire

1
 The attempts to measure the illicit cigarette market in Brazil show different estimations, as illustrated in
Table 9 of Ribeiro and Pinto (2019, p. 43-45).
2
 By identification strategy we mean a new approach used to uncover cigarettes traded in the illicit market,
which is unobservable. This does not have any relationship with the usual meaning in econometrics of a
method applied to the data to estimate causal effects.

 2
population and so does not allow to separate the illicit market, ranges from -0.27 to -0.30 from
the first to fourth income quartile, respectively. These elasticities suggest that individuals
purchasing cigarettes in the illicit market are less sensitive to price variations than individuals
purchasing in the licit market.

Considering age cohorts and the licit market, we found a conditional price elasticity of cigarette
consumption of -0.54 for individuals aged between 15 and 29 years old and an elasticity of -0.19
for individuals with 60 or more years old. In the illicit market, for these same age cohorts, the
conditional elasticities ranged from -0.30 to -0.17, respectively. The unconditional price
elasticity, which considers the whole market, ranged from -0.24 to -0.39 for individuals within
those same age groups, respectively. Again, these estimated values suggest a demand for
cigarettes that is sensitive to price variation among age groups in the licit market, but that is
less sensitive to price changes in the illicit market.

In contrast to many previous studies, we demonstrate that the total price-elasticity of cigarette
demand is not simply the sum of the conditional and unconditional elasticities. The total price-
elasticity indicates by how much the total cigarette consumption would decrease due to a tax
or price increase. We show it is equal to the sum of the conditional and unconditional elasticities
plus an interaction term between the two elasticities whose sign depends on whether a price
increase or decrease is considered.

To the best of our knowledge, there is no previous study in the literature that has explored the
effects of the illicit market on the estimation of cigarette price elasticity. Carvalho and Lobão
(1998) are among the first to estimate the demand for cigarettes in Brazil. They used aggregate
quarterly data from 1983 to 1994 and found price elasticities of -0.11 and -0.80 in the short and
long run, respectively. Using the so-called rational model, they found price and income
elasticities of -0.14 and 0.23, respectively, in the short run and -0.49 and 0.80 in the long run.

Iglesias (2006) analyzed the demand for cigarettes in the period from 1991 and 2003 and
estimated short-run price elasticity of -0.25 and long-run price elasticity of -0.42. The relation
between cigarette consumption and income, besides being positive, was not statistically
significant in their OLS estimates. Later on, Iglesias et al. (2007) extended the original sample
up to 2007 and found values of -0.27 and -0.48 for the re-estimated price elasticities in the short
and long run, respectively. The income elasticity suggests a positive income-cigarette
consumption relationship but it was not statistically not significant.

More recently, Ribeiro and Pinto (2019) also estimated aggregate price-elasticity of cigarette
consumption using data for the period from 2000 to 2018 and considering implicit per capita
consumption as a proxy of consumption and per capita disposable earnings as a proxy of
income. Their estimates for the licit tobacco consumption indicate price-elasticity ranging from
-0.55 to -0.65, depending on model specification and sample period.

An attempt to estimate the price elasticity of participation, i.e., the individual’s decision of
smoking or not, was made by Lampreia et al. (2015). They used household survey data from the
2008 National Household Sample Survey (PNAD) and found very low values for price and income

 3
elasticities of participation. Specifically, they estimated values of -0.05 and -0.06 for the price
and income elasticities of individuals’ participation in the consumption of cigarettes, but that
were not statistically significant at the standard 5 percent significance level. Conditional on
participation, that is, considering only individuals that reported a strictly positive consumption
of cigarettes in the sample, they estimated price and income elasticities of -0.06 and -0.04 for
the demand of cigarettes. Their results, however, could be biased because of the effects of the
illicit market of cigarette sales were not accounted for in the estimations. As we argued before,
one should account for the effects of the illicit market because it makes the cigarette demand
less sensitive to price variations.

The paper is organized as follows. The next section reports and discusses the data set and the
smoking behavior of the Brazilian population. The econometric method used in the estimations
of the price elasticity of demand is discussed in the third section. The fourth section reports and
analyses the estimated price elasticities by income quartiles, age cohorts and year, separating
estimations by type of market (licit, illicit, and both) and correcting for potential endogeneity.
Finally, the fifth section is dedicated to the concluding remarks.

2 Data and smoking behavior

To describe the smoking behavior of the Brazilian population and to estimate the sensitivity of
cigarette consumption to price changes, we used two individual level surveys: the PNAD from
2008 and the PNS from 2013.3 Both are repeated surveys for distinct purposes, but in the two
selected years, their questionnaires include a special section on smoking behavior. We select
the relevant items that are identical in both questionnaires to guarantee comparability between
the two years and uniformity of the analysis. The PNAD and the PNS are representative
individual surveys both conducted by the Brazilian Institute for Geography and Statistics (IBGE)
under the same sampling scheme. Both have a household and an individual component. We
focused on the latter questionnaire because smoking behavior is essentially an individual
choice. Using the provided sample weights, the driven statistics are representative for the entire
Brazilian population.4

The analysis focuses on individuals aged 15 and above who smoke cigarettes. The PNAD and
PNS provide the usual socioeconomics characteristics, such as gender, age, education, and
aggregate monthly income of the respondent. This latter variable will be particularly important
because the question of whether tax changes are progressive, regressive, or income neutral is
crucial for policy makers when it comes to gathering support for an eventual tax reform.

3
 In 2008, Brazilian real GDP grew 5.09% despite the beginning of the financial turmoil in the U.S. economy.
Only in 2009 the crisis affected the Brazilian economy with a decrease of -0.13% in the real GDP. In 2013,
after the crisis, the economic growth was 3.0% per year. Thus, assuming that there is a correlation of
smoking and recession, there are no effects from the international financial crisis on the cigarette
purchases from the licit or illicit market in our sample period.
4 For further details on these surveys, see INCA (2010) and Szwarcwald et al. (2014).

 4
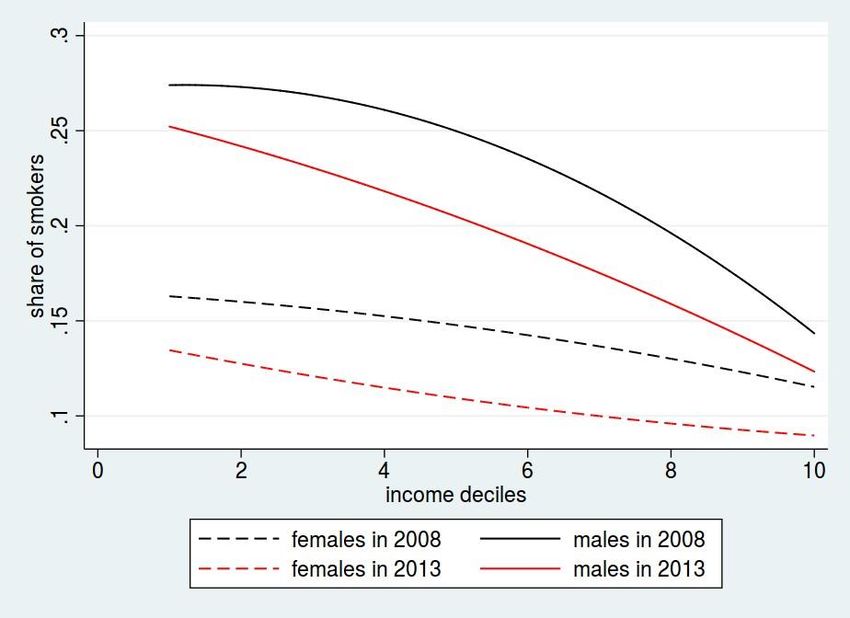
Moreover, the consumers’ price sensitivity may vary according to the income level and,
consequently, the outcome of any smoking cost-benefit analysis may be affected.

Figure 1 shows the proportions of regularly smoking men and women across income deciles in
2008 and 2013. The data confirm that women have a lower probability of smoking than men. In
2008, 14.2 percent of all women smoked cigarettes as compared to 22.1 percent of men. These
shares dropped to an average of 11.2 percent and 18.5 percent, respectively. Additionally,
regardless of gender, the propensity of smoking declines monotonically with income. About 17
percent of women and 27 percent of men in the lowest income decile smoked in 2008, as
compared to 12 percent and 15 percent in the highest income decile. Again, these shares
unambiguously decreased over time.

 Notes: The graph visualizes the share of individuals aged 15 and above who smoke cigarettes
 according to the PNAD and PNS survey in 2008 and 2013, respectively. The calculation uses
 the survey weights.

 Figure 1: Proportions of smokers by gender and income decile in 2008 and 2013

One reason for the observed reduction of cigarette smokers in Brazil is the continuous increase
in tobacco taxes and thus cigarette prices. Two features related to cigarette taxes are important
for the understanding of the changes in smoking behavior between 2008 and 2013. First, in
2011, Federal Law 12.546 allowed the Executive Power to establish a minimum price for a pack
of cigarettes through federal decrees, with the first decree issued in 2011. In 2013, year of the
PNS survey, this minimum price was equal to BRL 3.50. Secondly, there are specific tobacco
taxes that determine the retail price. The cigarette taxes are all charged at the retail price and
comprise of the tax on manufactured products (IPI) and the social contributions PIS/COFINS,
both at the federal level, and the tax on the circulation of goods and services (ICMS), at the state
level and ranging from 25 to 37% depending on the state. As the cigarette factories are located

 5
in the south or southeast regions, logistic costs and different tax burdens among states generate
heterogeneity in the retail prices across the country.

The survey respondents indicate how many cigarettes they smoke per day and at what age they
started smoking. A key distinction of the PNAD and PNS data in comparison to household survey
price data is that the information regarding the quantity and total price of cigarettes refers to
the last individual purchase. The first advantage of this type of question is that it includes all
kinds of markets where cigarettes are sold and thus prices are highly accurate and relevant.
According to the National Cancer Institute (INCA) and the Ministry of Health, the size of the illicit
market decreased recently from 37.5 percent in 2017 to 31.4 percent in 2018. A collection of
market prices is thus unlikely to reflect the actual prices that consumers face regularly. Second,
since the question concerns a single and individual purchase, the answer is precise and less likely
to be subject to measurement error. The calculated price per cigarette is therefore much closer
to the true market price of a cigarette than the unit values inferred in common household
survey data, where several household members may smoke distinct brands and pay different
prices.5

Consequently, it will be very fruitful to exploit the official minimum price for a 20-cigarette pack,
which in 2013 was equal to BRL 3.50. Purchases below this floor price shall have occurred in the
illicit market because it is forbidden by the law to sell cigarettes below this price in the legal
market. Prices are previously reported to the Federal Revenue Service and any change in the
retail price must also be informed because ad valorem taxes are based on this price. In addition,
cigarette packs are subject to tax stamps as a control system. No promotional sales are allowed
and no cigarette can be legally sold at a price below the official floor price. In the PNS data,
about one-third of all consumers purchased cigarettes below that official price floor. Since there
was no official minimum price in 2008, a price floor of BRL 2.6 was imputed by using the
assumption that the share of the illicit market remained constant.6 In a sensitivity analysis, we
relaxed this assumption and the major results were not affected.

This identification strategy might underestimate the size of the illicit market because there
might be illicit premium brands sold above the minimum price as well, which is not captured by
our procedure and could introduce a measurement error.7 However, as pointed out by
Figueiredo et al. (2021) and Iglesias et al. (2017), the illicit trade is basically composed by
cheaper cigarettes, with a negligible share of premium brands. In addition, this was not a
problem because we found statistically significant effects of the illicit cigarettes in the price
elasticity estimation even under a potentially underestimated illicit market.

5
 This self-reported price, however, is not free of criticism. Some might argue that it introduces another type of error
associated to self-report to the identification of the illicit market, as it is subject to recall bias and other problems of
self-report data. In the robustness check we address this issue by considering alternative measures of the illicit
cigarette trade.
6 The percentile in the reported cigarette price distribution in 2008 that corresponds to the percentile of the

minimum price in 2013 was used to impute the minimum price in 2008, resulting in a minimum price equal to BRL
2.10 at the 36th percentile.
7 Notice that there is no measurement error due to promotional sales of legal cigarettes below the minimum price

because this is forbidden by the law.

 6
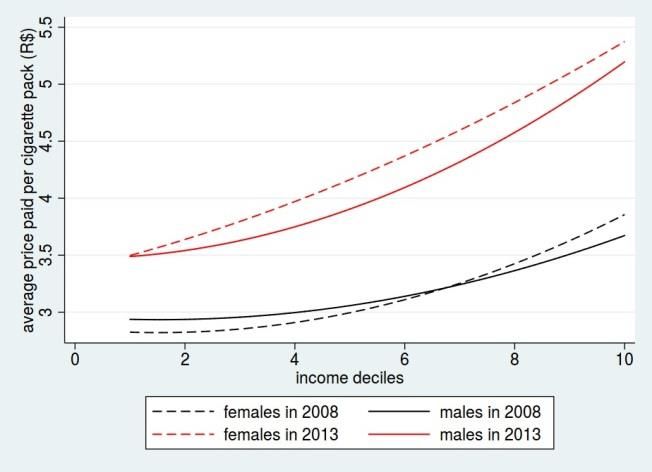
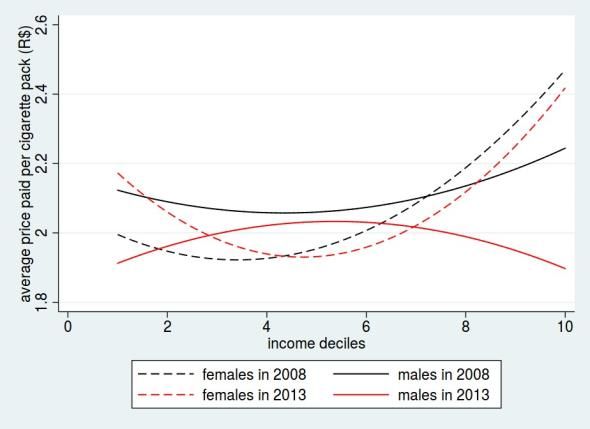
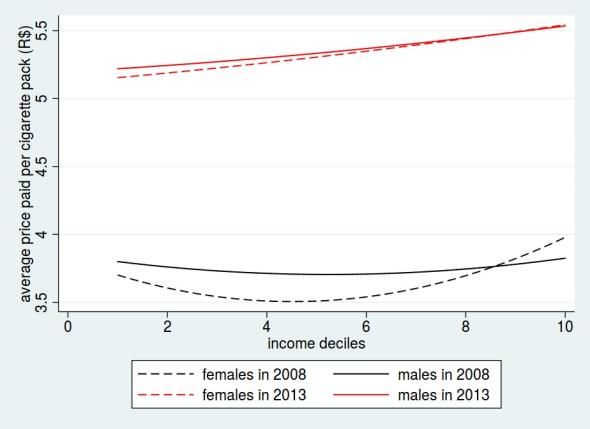
The illicit cigarette market in Brazil comprises of smuggling cigarettes (mostly from Paraguay)
and domestic counterfeiting industry (illegal cigarette manufacturers). The share of these two
streams is not well delineated and states in the country border suffer more with the smuggling
problem (Cavalcanti, 2016). Cigarette smuggling is classified as a crime, but illegal production is
not a criminal activity itself, being considered merely an administrative infraction. However, the
tax evasion resulting from both is regularly classified as tax crime. The risk for the illegal market
suppliers is high, but the profits from this activity are also very high (Cavalcanti, 2016). However,
the consumers buying cigarettes in the illicit market, at street markets and even at regular
shops, are not considered criminals. An individual may buy cigarettes in the illicit market
without any legal restriction on himself. Under this perspective, there is no difference between
the two markets for cigarettes, licit and illicit, except the retail prices.8

Figure 2 reports estimates of the illicit cigarette market across Brazilian states and geographical
regions by applying our identification strategy. States bordering South American countries
recognized as suppliers of illicit cigarettes to Brazil display the highest shares of the illicit market.
This is the case of Rondonia, Acre, Paraná and Mato Grosso do Sul, which border Peru, Bolívia
and Paraguay, respectively. Some of the poorest states in terms of per capita income, including
Maranhao, Piaui, Rio Grande do Norte and Alagoas, all located in the Northeast region, also
reveal higher share of the illicit cigarette market. Thus, there is important heterogeneity across
states regarding the size of the illicit trade.

Figure 2 – Share of the illicit cigarette market across Brazilian states and regions

Figure 3 illustrates how the prices for a cigarette pack in the last purchase differ by gender and
income decile in 2008 and 2013. Whereas panel (a) shows the results for all smokers, panels (b)

8
 Other tobacco products, such as e-cigarettes, cigars, chewing tobacco, and snus, were not common in Brazil during
the sample period and so disregarded in the analysis.

 7
and (c) distinguish between purchases in the licit and illicit markets. Cigarette purchased below
the minimum price fixed by the federal law number 12,546 from 2011 are considered illicit. In
2013, this price was BRL 3.50. The descriptive statistics indicate that individuals who buy their
cigarettes in the illicit market are heavier smokers. Moreover, these individuals are also older,
more likely to have lower educational attainment and lower income, and have smoked for more
years. All these characteristics support the claim that smokers from the illicit market are more
addicted to tobacco consumption and so less sensitive to price changes.

 (a) licit and illicit

 (b) illicit (c) licit

 Notes: It is considered individuals aged 15 and above who smoke regularly according to the PNAD and PNS survey
 in 2008 and 2013, respectively. The calculations use the survey weights.

 Figure 3: Cigarette prices by gender, income decile, and market in 2008 and 2013

The illicit cigarette market is of special interest for tobacco control policymaking because it
directly affects some of the most vulnerable groups in the society. Our identification strategy,
focused on the lower cigarette prices, captures the effects of the illicit sales on these social
groups. In all three cases, men and women in the same income decile spend about the same
amount of money for a 20-cigarette pack. Yet, there are important differences between the licit
and illicit markets. The aggregate representation in panel (a) suggests that a less constrained
budget leads smokers to buy more expensive brands. In 2013, for instance, the average price in
the lowest income decile is close to the minimum price of BRL 3.5, while consumers in the top
decile spend about BRL 5.0 per pack. The difference is reasonable but still lower than the one

 8
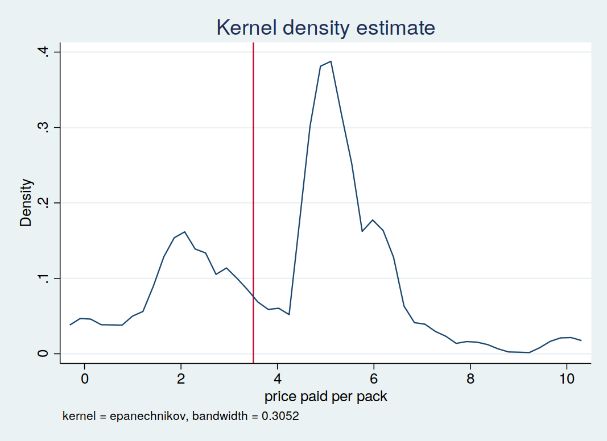
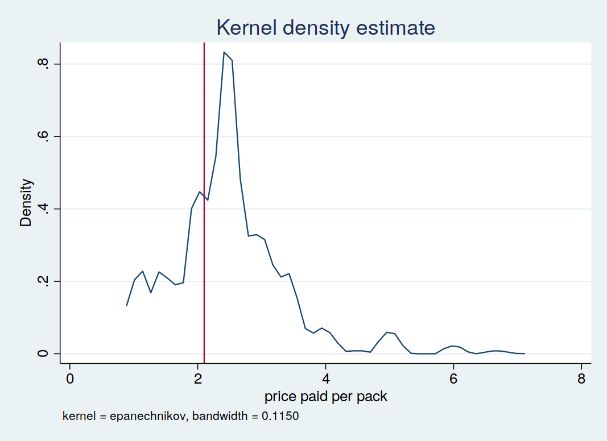
observed by Fuchs and Meneses (2018) in Moldova, where the average prices between the first
and last income decile differ by a factor of more than two.

However, the price paid per pack is almost constant along with the income distribution in the
licit market and not higher than 20 percent in the illicit market. Most importantly, the cigarette
tax increases between 2008 and 2013 mostly affected prices in the licit market, as illustrated by
Figure A.1 in the Appendix, which reports the entire distribution of cigarette prices in each year
of the sample. In the illicit market, prices could also have increased by a smaller fraction because
cigarettes are close substitutes between the two markets and sellers could have taken the
chance to raise profit margins in the illicit market. Considering the whole market, prices
increased by about 50 percent on average, while the general price level increased by 28.5
percent as measured by the official consumer price index (IPCA). The rising prices paid per pack
along the income distribution is because richer individuals tend to acquire their cigarettes in the
formal market, whereas low-income individuals resort to the illicit trade in order to avoid
restrictions from the price regulations and tax increases.

For the sake of completeness, Table 1 summarizes the descriptive statistics for the main
variables in the sample. The years of 2008 and 2013 are pooled but the sample is divided into
the three dimensions that are used in price elasticity estimations. Columns (1) to (4) divide the
sample according to income quartiles, columns (5) and (6) distinguish between the licit and illicit
markets and, finally, columns (7) and (8) show the characteristics for smokers and non-smokers.

 Table 1: Summary statistics by subgroups – 2008 and 2013
 (1) (2) (3) (4) (5) (6) (7) (8)
 Sample: Inc. Q1 Inc. Q2 Inc. Q3 Inc. Q4 Licit Illicit Non-sm. smokers
 0.18 0.18 0.17 0.14 1.00 1.00 0.00 1.00
 % Smokers
 [0.39] [0.38] [0.37] [0.34] [0.00] [0.00] [0.00] [0.00]
 % Income 0.16 0.08 0.06 0.03 0.10 0.08 0.00 0.09
 Cigarettes [0.24] [0.08] [0.05] [0.03] [0.16] [0.13] [0.00] [0.15]
 44.30 39.95 42.31 46.21 42.25 43.55 43.53 42.70
 Age
 [18.95] [16.36] [16.25] [14.93] [14.13] [14.54] [17.46] [14.28]
 0.38 0.21 0.18 0.07 0.16 0.34 0.21 0.22
 Educ. [1]
 [0.48] [0.41] [0.39] [0.26] [0.36] [0.47] [0.41] [0.41]
 0.35 0.34 0.32 0.20 0.38 0.45 0.29 0.40
 Educ. [2]
 [0.48] [0.47] [0.46] [0.40] [0.48] [0.50] [0.45] [0.49]
 0.23 0.37 0.37 0.31 0.32 0.18 0.32 0.27
 Educ. [3]
 [0.42] [0.48] [0.48] [0.46] [0.46] [0.38] [0.47] [0.44]
 0.04 0.08 0.13 0.41 0.15 0.04 0.18 0.11
 Educ. [4]
 [0.20] [0.27] [0.34] [0.49] [0.36] [0.19] [0.38] [0.31]
 0.38 0.46 0.58 0.63 0.62 0.63 0.48 0.63
 % Male
 [0.49] [0.50] [0.49] [0.48] [0.48] [0.48] [0.50] [0.48]
 440.9 717.1 1119.1 3986.5 1781.0 872.8 1590.9 1467.8
 Income
 [199.3] [101.8] [232.8] [5972.0] [2992.6] [946.1] [3480.1] [2522.2]
 Obs. 28,809 11,846 20,472 20,126 6,473 3,335 68,086 9,808
 Notes: The table shows average values and standard deviation (in brackets) for the main variables in different
 subsamples using the sample weights. Columns 1 to 4 refer to the four income quartiles. Columns 5 and 6 divide the
 subgroup of smokers into those that bought their cigarettes in the licit and illicit markets, respectively. Columns 7
 and 8 divide the entire sample according to smokers and non-smokers, respectively.

 9
Despite the observations from the previous figures, the share of income spent on cigarette consumption varies between 16 percent in the lowest quartile and 3 percent in the fourth quartile. Males are misrepresented in the two highest income quartiles. Women represent 62 percent of the smokers in the lowest income quartile. The Table 1 confirms that male smokers, poorer individuals, and those from the lower educational groups are more likely to buy cigarettes from the illicit market. Finally, the socioeconomic characteristics are more balanced between smokers and non-smokers. 3 Methodology The price elasticity of cigarette consumption (ε) measures the percentage decrease in cigarette consumption due to a one percent increase in the final price of cigarette. To account for the potentially different effects of a tobacco price increase over the income and age distributions, price elasticities are estimated for income quartiles and age cohorts, as specified in eq. (1). The conditional price elasticities are derived from the following estimation: ln Qidt d ln Pidt I dt X idt eidt (1) d where Qidt is the number of cigarettes smoked per day by individual i in income decile d and year t, Pidt is the price that individual i actually paid per cigarette, Idt is a binary variable that indicates to which income quartile (or age cohort) the individual belongs and the vector Xidt includes control variables for age, education, years of smoking, income, gender, and federal state fixed effects. eidt is the compound random error term of the regression. Some changes are then made to this baseline equation. Among others, eq. (1) is estimated for the two years and gender groups either in combination or separately. The sample also is divided into further subgroups according to age cohorts and the source of cigarette purchase, either the licit or illicit market. A critical issue with eq. (1) is that tax and price increases could induce individuals to either reduce consumption, change to cheaper brands or both. In theory, the price elasticity should only indicate how much price affects individuals’ actual consumption, correcting for an expenditure reduction based on substitution in favor of cheaper brands. Deaton (1988) proposed a solution to this problem. Under two relatively restrictive assumptions it is possible to impute the quality substitution using the income elasticities of quality and quantity: (1) household utility is weakly separable and (2) it is possible to identify local markets between which prices vary but within a local market, individuals face the same prices. Deaton’s method is applied in many empirical papers, including the estimation of cigarette price elasticities. For instance, see McKelvey (2011) for a critical discussion. The Deaton (1988) correction was developed for household survey data, whereas this study uses individual survey with a different questionnaire structure. First, under the plausible assumptions that smokers did not buy different brands in their last purchase and that it is representative of their usual consumption behavior, the inferred unit price for cigarettes Pid is more precise than those inferred in household consumption surveys. Unit values could not be 10
equal to the actual price because it is an approximation from the households’ total expenditure divided by total physical quantity, which is usually measured in kilograms (John et al. 2019). Second, it is likely that more than one member of a household smokes and that the different smokers consume cigarettes of different brands. Moreover, the expenditure share for this product class may be mixed with other tobacco-related products. Thus, average unit values do not indicate how much prices, brand, and quality vary within the household. The problem of varying unit values is more pronounced for more heterogeneous goods and categories with a broader definition, such as meat. The average unit values also tend to be less precise, the longer the observation period in the household survey, whereas in this case, a single purchase is identified. Since the product is highly similar but prices between different brands vary quite substantially, consumers may adjust to price changes by switching to a cheaper brand. To deal with a possible endogeneity bias and the problem of misreporting the price of the individuals’ last purchase, leading to measurement error and the well-known attenuation bias in the coefficients towards zero, reported prices are substituted with average prices in each federal state. Prices differ substantially between federal states because part of the tobacco tax burden is state-specific and logistic, distribution and transportation costs to the interior of the country are quite high due to poor infrastructure (Ehrl and Monasterio, 2019) and continental size of the country. Table A.1 in the Appendix reports a simple regression of federal state dummies on cigarette prices. The highly significant estimated coefficients confirm the price variation across states, which ranges from an average price of BRL 2.6 in Mato Grosso do Sul close to the Paraguay border to BRL 5.4 in Amapa located in the Amazonas rain forest. These state average prices can be seen as exogenous to the individual consumer and this procedure can be understood as an adaptation of the Deaton (1988) method to the context of individual-level data. Another threat to the correct identification of tax adjustments is that a price change may induce individuals either to start smoking or to quit. This issue is also well known in the literature on tobacco, although, mainly due to data availability, not all studies are able to deal with those problems. Following the exposition in WHO (2010), this study estimates the unconditional price elasticity related to the number of smokers from the following Probit model. Pr(Sist ) ( 1Pst X ist ) (2) The dependent variable is an indicator of whether individual i is a smoker or not, and Pst is the average price in federal state s and year t. The explanatory variables X are essentially the same as in the conditional price elasticity estimation by equation (1). The price elasticity from the 1 smoking decision model for an individual with average characteristics ̅ = ∗ ∑ =1 is calculated as follows: E ( S | X ) Pst u Pst E (S | X ) 11
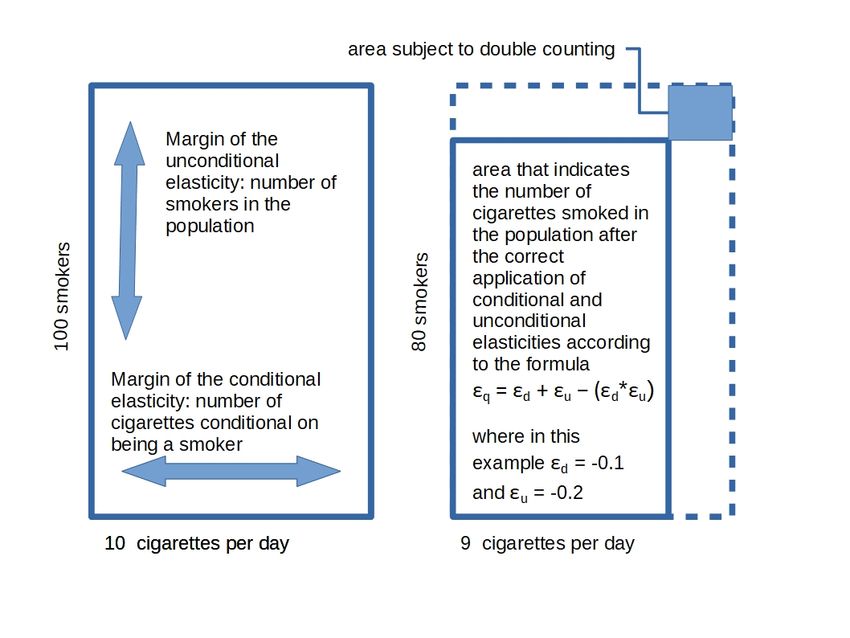
It is important to note that this elasticity indicates how many percentage points smoking prevalence would change after a 1 percent alteration in cigarette prices. Having estimated both equations (1) and (2), we calculate the total price elasticity that allows us to discover how a price increase would affect total cigarette consumption. It is important to highlight how the two equations are correctly combined because, in fact, the total price- elasticity of consumption is not simply the sum of the conditional and unconditional elasticities. The total price elasticity thus reflects adjustments along two dimensions: (1) the consumption quantity (smoking intensity), that is, the intensive margin; (2) the smoking prevalence, that is, extensive margin. Total consumption is the product of the number of smokers and the number of cigarettes consumed per smoker. Since both dimensions change at the same time, the total effect of a price increase is not simply the sum of the conditional and the unconditional elasticity. In fact, the calculation of the total elasticity value depends on whether prices increase or decrease, as follows: P 1, if P 0 P P P q d u sgn d u , sgn 0, if 0, (3) P P P P 1, if 0 P where sgn() is a function that takes the sign of the price change. Considering a price increase, for instance, the absolute value of the total price elasticity is a little bit lower because the quantity reduction does not apply to the previous number of smokers but to the lower number of smokers after the price increase. Likewise, the unconditional price elasticity also has to be adjusted for the concurrent change in quantity. The following numerical example and its visual exposition in Figure 4 clearly show this aspect which is hardly explicit in papers that apply the price-elasticity of tobacco consumption. The number of cigarettes smoked can be represented as the area of a rectangle where the length of on side is equal to the number of smokers (equal to 100 in our stylized example) and the length of the other side is equal to the average number of cigarettes smoked (10 cigarettes per day). Let us further assume that the elasticities are given by = −0.1 and = −0.2. A price increase of 100 percent will thus reduce the number of smokers by 20 percent to 80 who smoke 9 cigarettes per day, on average, instead of 10. Therefore, the total sum of cigarette consumption is equal to 720 and not 700 as the application of + = −0.3 would erroneously indicate. As Figure 3 indicates, the difference results from the double counting of the small upper right corner rectangle. 12
Figure 4 – Stylized example of how to combine conditional and unconditional elasticity

In other words, by simply using the sum of conditional and unconditional elasticity, without
adjusting the double counting according to equation (3), we are neglecting that the base of
smokers has shrunk. Thus, the conditional elasticity of smoking cannot be applied as if the
number of smokers remained unchanged.

4 Results
4.1 Conditional price elasticity of cigarette consumption

The illicit (or illegal) market for cigarettes in Brazil is one of the largest in the world. Therefore,
a major concern for policy makers is to what extent a potential tax increase that leads to a price
raising actually affects cigarette consumption. The possibility to resort to the informal market
might help to explain relatively inelastic price elasticities in the cigarette market.

When policymakers raise tobacco taxes, the price in the licit market certainly increases. In the
illicit market, however, prices might not follow the same behavior, even considering that
cigarettes are substitute goods between these two markets and illicit sellers have an incentive
to also increase prices in order to rise profit margins. Consumers that used to buy cigarettes in
the legal market could start purchasing them illicitly at a lower price, thus avoiding the intended
consumption reduction with the tax and price increases. The detailed data enable us to
differentiate between cigarette purchases in the licit and illicit markets, according to the

 13
reported price being above or below the official minimum price.9 The estimations reported in
Table 2 show that the differences between the licit and illicit markets are substantial.

 Table 2: Conditional price elasticities by income quartile and market type
 (1) (2a) (2b) (3) (4a) (4b)
 Market: Both Legal Illegal Both Legal Illegal
 Price measure: Unit price State average
 -0.11*** -0.30*** -0.15*** -0.29*** -0.42*** -0.11
 1st quartile
 (0.02) (0.05) (0.05) (0.05) (0.07) (0.09)
 -0.12*** -0.29*** -0.14*** -0.31*** -0.43*** -0.13
 2nd quartile
 (0.02) (0.05) (0.05) (0.05) (0.06) (0.08)
 -0.14*** -0.32*** -0.16*** -0.34*** -0.47*** -0.16*
 3rd quartile
 (0.02) (0.05) (0.05) (0.04) (0.06) (0.08)
 -0.18*** -0.36*** -0.17*** -0.36*** -0.49*** -0.17**
 4th quartile
 (0.03) (0.05) (0.06) (0.04) (0.06) (0.08)
 Observations 8254 8254 8254 8254
 R-squared 0.09 0.10 0.05 0.06
 F-Quartiles 3.33** 0.34 1.73 2.91** 0.70 1.63
 F-Markets 1.71 2.68**
Notes: The Table reports coefficients of price elasticities by income quartile according to the estimation of eq. (1). The
White-Huber heteroscedasticity robust standard errors are in parenthesis. The second row indicates whether the
individuals purchase cigarettes in the licit or illicit market or if both markets are considered. The third row indicates
whether the price of cigarettes is the unit price or state average. The last two rows report the F-statistics for testing if
the estimated elasticities are equal. When both markets are considered separately in columns (2a), (2b), (4a) and (4b),
the equation is estimated jointly with all variables being interacted with a market indicator dummy variable. The
estimations are based on pooled data from 2008 and 2013. All regressions include controls for gender, age group,
education group, years of smoking, and log income. Federal state fixed effects were only included in the estimations in
columns (1) and (2). *, **, and *** indicate statistical significance at the 10 percent, 5 percent, and 1 percent levels,
respectively.

As expected, consumers in the illicit market are less sensitive to price changes. Plausible
explanations are that the smaller number of brands and lower price dispersion in the illegal
market limit the smokers’ flexibility to adjust their consumption behavior due to price changes.
It might also be due to intrinsic characteristics of the illegal cigarette consumers, such as lower
income and more years of smoking, as also pointed out by Ribeiro and Pinto (2019). Based on
the observed unit price of cigarettes, price elasticities in the illegal market vary between -0.15
and -0.17, whereas in the legal market they range from -0.29 to -0.36. Notice that the estimated
elasticities by income quartile are not statistically different from each other within the legal or
illegal market in columns (2a) and (2b), respectively. However, they are different when
considering the entire cigarette market in column (1).

There is also no statistical difference between the estimated price elasticities for the licit and
illicit markets when considering unit price, as illustrated in the last row of Table 2. This is
expected because prices in the illicit market, according to our identification strategy, are below

9Note that although the price floor in 2008 is imputed, as explained earlier, estimations of the regression in Table 2
separately for 2008 and 2013, produces similar results, as reported in Table A.4 from the Appendix. The similarity
between the price elasticities in 2008 and 2013 in both segments of the market thus supports the assumption that
the minimum price imputation is valid.

 14
the minimum price fixed by the government and so do not suffer the same fluctuations as the
prices in the licit market. One of the possible explanations for the lower sensitivity of price
changes is the difference in consumption behavior and individual characteristics in line with the
descriptive statistics discussed in section 2. It is also possible that the sub-estimation of the illicit
market based on the minimum price alone creates some bias in the estimates. The differences
between price elasticities between both types of consumers are statistically significant in all
income quartiles, at least in the pooled sample. Finally, the estimated price elasticities in
absolute values increase by income quartile, as observed previously.

Columns (3), (4a) and (4b) of Table 2 report the results when unit cigarette prices are replaced
by average price within each federal state.10 As a consequence, the elasticities unambiguously
increase in magnitude. This change is expected because the regional prices eliminate the
endogeneity bias caused by possible adjustments to cheaper brands under a price increase. The
price elasticities are now statistically different between the two markets, legal and illegal, as
indicated by the F-statistics reported in the last row of Table 2. However, there is still no
statistical difference between the estimated price elasticities by income quartile within a given
market, except for the whole cigarette market.

Another potential concern about the results from Table 2 is the imputation of the price floor for
2008 when no official minimum price existed yet. We address this issue by two extensions.
Notwithstanding, illegal cigarettes have been a major problem long before the introduction of
the minimum cigarette price in 2011. Thus far, we assumed that the percentage of illicit
cigarettes in the entire market is about the same in both years (2008 and 2013), which was
identified by the observed prices below the official price floor in 2013.

We relax this assumption in Table A.2 of the Appendix by changing the percentile of the illicit
market from 36 percent to +/-2.5 and +/-5 percent. This variation seems most plausible in the
light of other estimates of the illegal cigarette market in Brazil, such as Szklo at al. (2020) and
Iglesias et al. (2017). The results are much in line with those from Table 2 and our previous
observations. The price elasticities in the illegal market are about 10 percent lower in absolute
terms than those in the legal market, and the magnitude of the price elasticities tend to increase
as personal income rises. The price elasticities in the same income quartile and market do not
show statistical differences in the two specifications of the cigarette market.

Second, Table A.4 in the Appendix estimates eq. (1) with a year dummy variable that iterates
with all other variables. Unfortunately, the low variability of regional price averages limits the
identification of price elasticities to the case of individual prices. This second exercise may also
tell us something about how much the introduction of the minimum price in 2011 affected
demand, although this is just a rough idea because several other changes occurred between
2008 and 2013. The results from Table A.4 indicates that consumers of legal cigarettes became
less price sensitive, although the confidence intervals of the estimates overlap.

10 The estimation of the price-elasticities now stems exclusively from variations between state average prices and
income quartiles.

 15
With respect to illegal cigarettes, the evidence is even more inconclusive. To facilitate the
interpretation of these results, Figure A.1 in the Appendix reports the distribution of cigarette
pack prices for both years. One apparent difference is that the entire market presents a greater
overall price variability after the introduction of the minimum price in 2011. We also see that
the bulk of the illegal cigarette prices in 2013 is more distant from the formal market than in
2008. This fact might lead consumers to switch less within the formal market and more between
markets. Notwithstanding, Figure A.1 shows that the most frequently purchased kind of
cigarettes in both years are the ones closely to the right, from where we identified the
distinction between the licit and illicit markets. That is, most consumers tend to buy the lowest
priced cigarettes in the legal market. This evidence along with the similarity between the price
elasticities in 2008 and 2013 from Table A.4 support the assumption that the minimum price
imputation for 2008 is indeed reasonable.

Table 3 provides another extension from the baseline estimation in eq. (1). Price elasticities are
estimated for five different age cohorts. Based on the previous findings, the distinction between
licit and illicit markets is maintained. Regardless of unit price or state average price as a
regressor, the five price elasticities estimated by age cohorts are statistically different among
themselves, as illustrated by the calculated F-statistics. They are also statistically different when
considering the legal and illegal markets according to the F-test in the last row of Table 3.

 Table 3: Conditional price elasticities by age cohorts and market type
 (1) (2a) (2b) (3) (4a) (4b)
 Market: Both Legal Illegal Both Legal Illegal
 Price measure: Unit price State average
 Aged 15-29 -0.20*** -0.43*** -0.16*** -0.43*** -0.54*** -0.30**
 (0.03) (0.05) (0.05) (0.05) (0.06) (0.13)
 Aged 30-39 -0.19*** -0.39*** -0.18*** -0.40*** -0.49*** -0.32**
 (0.02) (0.05) (0.05) (0.05) (0.06) (0.13)
 Aged 40-49 -0.14*** -0.35*** -0.14*** -0.35*** -0.43*** -0.27*
 (0.02) (0.05) (0.05) (0.04) (0.05) (0.13)
 Aged 50-59 -0.12*** -0.29*** -0.16*** -0.32*** -0.37*** -0.27**
 (0.02) (0.05) (0.05) (0.05) (0.06) (0.13)
 Aged 60+ 0.01 -0.12** -0.08 -0.16*** -0.19*** -0.17
 (0.03) (0.06) (0.06) (0.05) (0.06) (0.13)
 Observations 8,254 8,254 8,254 8,254
 R-squared 0.08 0.09 0.05 0.05
 F-Quartiles 16.71*** 3.53*** 12.40*** 17.04*** 4.00*** 13.29***
 F-Markets 4.84*** 4.38***
Notes: The Table reports coefficients of price elasticities by income quartile according to the estimation of eq. (1).
The White-Huber heteroscedasticity robust standard errors are in parenthesis. The second row indicates whether the
individuals purchase cigarettes in the licit or illicit market or if both markets are considered. The third row indicates
whether the price of cigarettes is the unit price or state average. When both markets are considered separately in
columns (2a), (2b), (4a) and (4b), the equation is estimated jointly with all variables being interacted with a market
indicator dummy variable. The estimations are based on pooled data from 2008 and 2013. All regressions include
controls for gender, age group, education group, years of smoking, and log income. Fixed effects for federal states
were only included in the estimations in columns (1) and (2). *, ** and *** indicate statistical significance at the 10
percent, 5 percent, and 1 percent levels, respectively.

 16
In the pooled sample and for the consumers in the licit market, price sensitivity decreases with
age. While consumers below the age of 29 show a price elasticity of -0.42, the oldest cohorts
aged 60 and above present the value of only -0.11. As previously found, the elasticities observed
for consumers in the illicit market are lower. Columns (4) to (6) in Table 3 report the results for
the price elasticities by age cohort using the average regional cigarette prices in the pooled
sample and the licit and illicit market, respectively. The regressions in columns (4) and (5) are
based on the observed average prices in the licit market. Comparing these three estimations to
the ones in the remainder three columns of Table 3 confirms that endogeneity bias seems to be
a relevant problem. As before, the absolute value of virtually all elasticities increases once the
correction by state average prices is applied. While the overall age-sensitivity pattern and
previous conclusions are maintained, the price elasticities range from -0.54 to -0.19 in the licit
market and from -0.3 to 0 in the illicit cigarette market. These observations regarding table 3
continue to hold once we change the definition of the legal/illegal market by +/-2.5 and +/-5
percent in table A.3.

4.2 Unconditional price elasticity of smoking probability

Table 4 reports estimations for the unconditional price elasticities as defined by a single Probit
estimation according to eq. (2). Because it is a non-linear regression, indicator variables for
income quantiles or age groups are not included, but by using the average values ̅ in each
of the groups, one can directly calculate the respective price elasticities. The surprising increase
of the price elasticity for people aged 60 and above can be explained by using the sample
statistics from Table 1. Among this group of individuals, the prevalence of smoking drops to 13
percent, as compared to 22 percent among the 50 to 59 years-old individuals. Dictated by
demographics, the oldest cohort also contains a considerably higher share of women, who were
shown to smoke less and to have a more elastic price elasticity. For the remaining age groups,
as for the income quartiles, one observes little differences in price elasticities. That is, for the
majority of Brazilians, a 10 percent cigarette price increase should reduce the number of
smoking individuals by about 2.6 percent.

 Table 4: Unconditional price elasticities from the smoking-probability model by subgroups
 Age cohorts: 15-29 30-39 40-49 50-59 60+
 -0.24*** -0.25*** -0.25*** -0.26*** -0.39***
 (0.10) (0.10) (0.10) (0.10) (0.16)
 Income quartiles: Q1 Q2 Q3 Q4
 -0.27*** -0.27*** -0.27*** -0.30***
 (0.11) (0.11) (0.11) (0.12)
 Notes: The table shows the estimated price elasticities and their White-Huber heteroscedasticity robust standard
 errors in parenthesis. All elasticities are calculated from a single Probit estimation according to eq. (1), where the
 smoking indicator is regressed on the observed price of cigarettes in each region and controls for year, gender,
 education group, years of smoking, and log income. The estimations are based on the entire sample of smokers and
 non-smokers pooled for the years 2008 and 2013 that contains 77,894 observations. *** indicates significance at the
 1 percent level.

 17
4.3 Total price elasticity of smoking

Table 5 reports the total price elasticities, for either price increases or decreases, by age cohorts
and income quartiles along with a 95 percent confidence interval for each model specification.
As eq. (2) does not allow us to separate the illicit market in the estimation of the unconditional
price-elasticity, given that it refers to the probability of smoking, we have to consider the
conditional price elasticity estimated for both licit and illicit markets in the calculation of the
total price elasticity. Differently from other studies, however, we incorporate the interaction
term displayed in equation (3) and discussed in section 3. It is worth to mention that, while there
are significant differences in the conditional price elasticity across age cohorts and income
quartiles according to the results reported in Table 3, the same is not true for the disaggregated
estimated values of the total price elasticity. Average values for price increases are around -0.48
and -0.57 across age groups and income quartiles, respectively. This finding reinforces the
importance of identifying and controlling for the effects of the illicit cigarette market in the
estimation of the conditional price elasticity of cigarette consumption in Brazil.

 Table 5: Total price elasticities by subgroups considering price increase and decrease
 Panel A: total elasticities for price increases
 Age cohorts: 15-29 30-39 40-49 50-59 60+
 -0.57*** -0.55*** -0.51*** -0.50*** -0.49***
 (0.11) (0.11) (0.11) (0.11) (0.17)
 Income quartiles: Q1 Q2 Q3 Q4
 -0.48*** -0.50*** -0.52*** -0.55***
 (0.12) (0.12) (0.12) (0.13)
 Panel B: total elasticities for price decreases
 Age cohorts: 15-29 30-39 40-49 50-59 60+
 -0.77*** -0.75*** -0.69** -0.66*** -0.61***
 (0.11) (0.11) (0.11) (0.11) (0.17)
 Income quartiles: Q1 Q2 Q3 Q4
 -0.64*** -0.66*** -0.70*** -0.77***
 (0.12) (0.12) (0.12) (0.13)
Notes: The total price elasticity is the sum of values in column (4) in Table 3, the bottom panel in Table 4, and their
product, for income quartiles, and the sum of values in column (4) in Table 3, the top panel in Table 4, and their
product, for age groups. Lower-bound and upper-bound stand for 95 percent confidence interval. The value of the
standard error is calculated under the assumption that the two estimates are independent of each other. Thus, the
standard error in the combined case is equal to the square root of the sum of squared standard errors in the
estimation of the conditional and unconditional price elasticity.

5 Conclusion

We used two detailed individual surveys—the PNAD from 2008 and the PNS from 2013—to
estimate cigarette price elasticities and account for the effects of the illicit cigarette market in
Brazil. Both are repeated surveys for distinct purposes, but in the two selected years, their
questionnaire includes a special section on individual smoking behavior. We considered those
relevant items that are identical in both questionnaires to guarantee comparability between the
two years and uniformity of analysis. Additionally, we used the official minimum price for a 20-

 18
cigarette pack to identify those consumers engaged in the illicit market. That is, purchases below
this floor price are considered to have occurred in the illicit market. In the PNS data, for instance,
more than one-third of all consumers purchased cigarettes below that minimum official price.

According to the results, there is a significant difference in the price elasticity estimations from
the licit and illicit cigarette markets. Specifically, the consumption of cigarettes is more sensitive
to price variation in the licit market than in the illicit market of manufactured cigarettes. This
difference is robust to controls for income quartile and age cohorts. This happens because the
cigarette price in the illicit market is below the minimum price defined by the government and
it might not be affected by any excise tax policy on tobacco products. Thus, price variation is
smaller in the illicit market, resulting in a more inelastic price elasticity of cigarette demand.

In the licit market of cigarettes, the estimated conditional price elasticity of demand ranged from
-0.37 percent in the first quartile to -0.44 percent in the fourth quartile of income. The same
elasticity calculated for the illicit cigarette market, which considers only cigarettes sold at prices
below the minimum official price, ranges from -0.24 percent to -0.29 percent. Thus, not only the
coefficients are smaller for a given quartile of income between the two markets but also
variations in estimated values are smaller among quartiles of income within the illicit market.

The estimated price elasticities indicate that illicit cigarette consumers are less sensitive to price
variations. Besides, any tax increase that affects prices of cigarettes in the licit market might
have a smaller effect, if any, on prices in the illicit market. As also claimed by Ribeiro and Pinto
(2019), the illegal cigarette market most likely plays a role, as consumers tend to be more price
sensitive in their legal consumption decisions. Individuals buying cigarettes in the illicit market
would face a limited impact on consumption due to tax increases or any other price-oriented
anti-smoking policy because prices in the illicit market might not be affected by this kind of
policy. However, smokers of illicit cigarettes are still demanding medical treatment for tobacco-
related diseases and losing future years of productive life because of cigarette-related diseases.
Thus, the illicit cigarette market not only refrain the government from tobacco tax revenue but
also overloads the public health system with tobacco-related diseases and weakens the social
reach of anti-smoking public policies.

For further research, it would be interesting to investigate and estimate the cross-price elasticity
between the licit and illicit cigarette consumption. Since we used a threshold price (the
minimum legal price for a cigarette pack) in the identification strategy, the cigarette market was
split into two disjoint sets. By assumption, considering that all individual face both market prices,
we estimated the cross-product price elasticity using the described Deaton method. However,
all estimates (using unit prices and state averaged prices) were not statistically significant. The
main reason might be the decreasing in variability of the illicit market prices resulting not only
from the identification strategy but also from the above-mentioned assumption. In this way, we
only could successfully estimate indirectly the effect of the illicit market on the licit cigarette
price elasticity. We leave the estimation of the cross price elasticity for further research.

 19
References
Becker, G. (1996). Accounting for tastes. Cambridge: Harvard University Press.
— and Murphy, K. (1988). A theory of rational addiction. Journal of Political Economy, 96 (4),
 675–700.
Botallo, Eduardo D. 2002. Fundamentos do IPI: (Imposto sobre Produtos Industrialziados). São
 Paulo: Rev. dos Tribunais ed.
Brasil. 2011. Lei nº 12.546, de 14 de dezembro de 2011. Available at
 http://www.planalto.gov.br/ccivil_03/_ato2011-2014/2011/lei/l12546.htm
Brasil. 2016. Decreto nº 8.656, de 29 de janeiro de 2016. Available at
 http://www.planalto.gov.br/ccivil_03/_Ato2015-2018/2016/Decreto/D8656.htm
Brasil, RFB (Secretaria da Receita Federal do Brasil). 2019. Solução de Consulta
 COSIT nº 49, de 18 de fevereiro de 2019. Available at
 http://normas.receita.fazenda.gov.br/sijut2consulta/link.action?idAto=98973&visao=anota
Carvalho, J. L. and Lobão, W. (1998). Vício privado e políticas públicas: a demanda por cigarros
 no Brasil. Revista Brasileira de Economia, 52 (Esp), 67–104.
Cavalcanti, Tania (2016). Protocolo para eliminar o comércio ilícito de produtos de tabaco da
 Convenção-Quadro da Organização Mundial da Saúde para o Controle do Tabaco: Notas
 Técnicas para o controle do tabagismo. (Ed.) Rio de Janeiro: Instituto Nacional de Câncer
 (INCA). Available at https://docs.bvsalud.org/biblioref/2020/08/971844/notas-tecnicas-
 protocolo-para-eliminar-o-comercio-ilicito-de-pr_sjLBqrN.pdf
Chaloupka, F. (1991). Rational addictive behavior and cigarette smoking. Journal of Political
 Economy, 99 (4), 722–42.
Deaton, A. (1988). Quality, quantity, and spatial variation of price. American Economic Review,
 78 (3), 418–430.
Ehrl, P. and Monasterio, L. (forthcoming). Skill concentration and persistence in Brazil. Regional
 Studies.
Figueiredo, V. C.; Drope, J.; Iglesias, R.; Szklo, A. S. Borges, P.; Stoklosa, M.; Welding, K.;
 Nascimento, H. and Cortes, C. (2021) Consumo de cigarros ilegais em cinco cidades
 brasileiras. Mimeo. Centro de Estudos sobre Tabaco e Saúde, Fundação Oswaldo Cruz.
Fuchs, A., Gonzalez Icaza, M. F. and Paz, D. P. (2019). Distributional Effects of Tobacco Taxation:
 A Comparative Analysis. Policy Research Working Paper Series 8805, The World Bank.
—, Matytsin, M. and Obukhova, O. (2018). Tobacco taxation incidence: Evidence from the
 Russian Federation. Policy Research Working Paper Series 8626, The World Bank.
— and Meneses, F. (2018). Tobacco price elasticity and tax progressivity in Moldova. World Bank
 Policy Research Paper, No. 8327.
— and Meneses, F. J. (2017). Regressive or progressive? The effect of tobacco taxes in Ukraine´s.
 Policy Research Working Paper Series 8227, The World Bank.
Iglesias, R. (2006). A economia do controle do tabaco nos países do Mercosul e associados:
 Brasil. Washington: Opas.
Iglesias R. M., Szklo A. S., Souza M. C., Almeida, L. M. (2017) Estimating the size of illicit tobacco
 consumption in Brazil: findings from the global adult tobacco survey. Tobacco Control, 26,
 53–9.
—, Jha, P., Pinto, M., da Costa e Silva, V. L. and Godinho, J. (2007). Tobacco control in Brazil.
 Washington: The World Bank.
INCA (2010). Global adult tobacco survey Brazil 2008. Rio de Janeiro: Instituto Nacional de
 Câncer. Mimeo.
John, R., Chelwa, G., Vulovic, V. and Chaloupka, F. (2019). Using Household Expenditure Surveys
 for Research in the Economics of Tobacco Control. A Tobacconomics Toolkit. Chicago, IL:
 Tobacconomics, Health Policy Center, Institute for Health Research and Policy, University of
 Illinois at Chicago.

 20
You can also read