Regional Disparities and Spatial Dependence of Bankruptcy in Spain - MDPI
←
→
Page content transcription
If your browser does not render page correctly, please read the page content below
mathematics

Article
Regional Disparities and Spatial Dependence of Bankruptcy
in Spain
Manuel Rico, Santiago Cantarero and Francisco Puig *

                                          Department of Management, University of Valencia, 46020 Valencia, Spain; manuel.rico@uv.es (M.R.);
                                          santiago.cantarero@uv.es (S.C.)
                                          * Correspondence: francisco.puig@uv.es

                                          Abstract: Firm survival, bankruptcy, and turnaround are of great interest nowadays. Bankruptcy is
                                          the ultimate resource for a company to survive when it is affected by a severe decline. Thus, deter-
                                          minants of firm turnaround and survival in the context of bankruptcy are of interest to researchers,
                                          managers, and policy-makers. Prior turnaround literature has broadly studied firm-specific factors
                                          for turnaround success. However, location-specific factors remain relatively unstudied despite their
                                          increasing relevance. Thus, this paper aims to evaluate the existence of spatial dependence on the
                                          outcome of the bankruptcy procedure. Economic geography and business literature suggest that lo-
                                          cation matters and closer companies behave similarly to further ones. For this purpose, we designed
                                          a longitudinal analysis employing spatial correlation techniques. The analyses were conducted on a
                                          sample of 862 Spanish bankrupt firms (2004–2017) at a regional level (province). For overcoming the
                                          limitations of the broadly usually logistic model employed for the turnaround context, the Moran’s
                                          Index and the Local Association Index (LISA) were applied with gvSIG and GeoDa software. The
                                          empirical results show that the predictors GDP per capita and manufacturing specialization are
                                related to higher bankruptcy survival rates. Both characteristics tend to be present in the identified

                                          cluster of provinces with better outcomes located in the North of Spain. We suggest that location
Citation: Rico, M.; Cantarero, S.;
                                          broadly impacts the likelihood of the survival of a bankrupt firm, which can condition the strategic
Puig, F. Regional Disparities and
                                          decision of locating in one region or another. Our findings provide policy-makers, managers, and
Spatial Dependence of Bankruptcy in
                                          researchers with relevant contributions and future investigation lines.
Spain. Mathematics 2021, 9, 960.
https://doi.org/10.3390/math9090960
                                          Keywords: bankruptcy; provincial clusters; geostatistics; Moran’s Index; spatial dependence; sur-
Academic Editor: Maria                    vival; Spain
Jesus Campion

Received: 23 March 2021
Accepted: 21 April 2021                   1. Introduction
Published: 25 April 2021                       At least once in its life, every company experiences a decline such that its survival is
                                          threatened [1]. During this period, a turnaround situation is faced, and the company can
Publisher’s Note: MDPI stays neutral      also become insolvent, or even bankrupt, understood as a formal court proceeding [2,3]
with regard to jurisdictional claims in
                                          possibly being required. Turnaround outcomes can range from complete failure to suc-
published maps and institutional affil-
                                          cess, with several intermediate outcomes. Bankruptcy and disappearance of firms is a
iations.
                                          pervasive problem for economy and society. Therefore, research on bankruptcy and sur-
                                          vival is essential, and determinants for successful turnarounds are of interest to bankrupt
                                          firms [4–7].
                                               However, in a bankruptcy procedure, only success or failure (liquidation) is possible,
Copyright: © 2021 by the authors.         and the probability of success depends on different factors. In this study, similarly to [3],
Licensee MDPI, Basel, Switzerland.        success has been defined as a firm’s survival after going through the bankruptcy procedure.
This article is an open access article
                                               Prior studies have identified as main determinants for successful turnarounds in
distributed under the terms and
                                          bankruptcy procedures firm-specific factors (size, age, ownership, among others). However,
conditions of the Creative Commons
                                          after the Great Recession and the consequent increase in firm bankruptcies, additional
Attribution (CC BY) license (https://
                                          factors appeared to affect the outcome. Those factors are location-specific, such as the
creativecommons.org/licenses/by/
                                          region’s industrial specialization where the firm is located or the economic wealth of
4.0/).

Mathematics 2021, 9, 960. https://doi.org/10.3390/math9090960                                          https://www.mdpi.com/journal/mathematics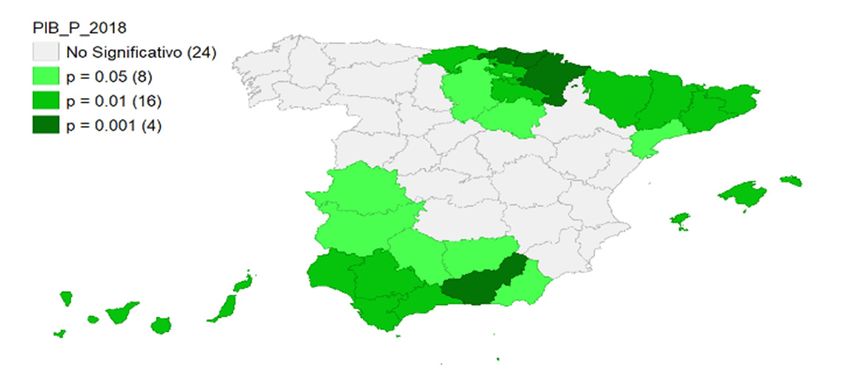
Mathematics 2021, 9, 960                                                                                              2 of 20

                           the place. To our knowledge, few papers have assessed the spatial relationship between
                           turnaround and bankruptcy [8].
                                 As proposed by economic geography and business literature, the place where a
                           company develops its activity is key to predicting its survival in the short and long term.
                           The basic hypothesis is that “everything is related to everything else, but close things are
                           more related than distant things” [9]. Geographic proximity favors commercial interactions,
                           especially between companies related to the activity, reduces search and negotiation costs,
                           and increases competitiveness. For this reason, companies set up, locate, and grow in
                           territories where they can enjoy more significant external economies, creating their own
                           competitive and institutional contexts [10]. However, in a general crisis, the higher the
                           business density of a territory, the greater the scarcity of resources (clients, suppliers,
                           financing), causing an increase in the rivalry between its members (cannibalization) [11].
                           In this context of intense competition, as pointed in the review carried out by [7], the
                           retrenchment strategy is the most implemented by managers of companies facing a crisis;
                           however, its effectiveness is very uneven.
                                 Hence, this paper aims to determine the existence of spatial correlation in bankruptcy
                           outcomes in Spain. Also, two objectives were defined: first, to map the bankruptcies in
                           Spain and second, to explain the regional disparities in the success rates. Due to differences
                           in the legal systems and laws, we focus on the bankrupt Spanish companies filed from
                           2004 through 2017. Our database (862 Spanish bankrupt firms) was obtained from different
                           secondary sources. Data of the companies, location, activity, and status were derived from
                           Orbis. The GDP per capita data were extracted from the INE database and the Bank of Spain.
                           Data regarding the bankruptcy declaration and the procedure’s outcome were obtained
                           from the Public Bankruptcy Register. We implemented the gvSIG and GeoDA programs
                           and the methodology of the Moran’s Index and the Local Association Index (LISA).
                                 Our results show that although the firm-specific factors and activity sector explain part
                           of the regional disparity in failures, it is also essential to consider the regional institutional
                           environment to predict the outcome. Notably, higher GDP per capita and manufacturing
                           specialization proved to be related to higher success rates in bankruptcy procedures.
                           Both characteristics tend to concentrate in Northern Spain due to structural and cultural
                           factors. Our contributions guide politicians and managers to be more effective when facing
                           an economic crisis, bankruptcy, and turnaround. For researchers interested in spatial
                           analysis, we present valuable techniques to evaluate the dependence and association
                           among variables.
                                 The paper is structured as follows: in Section 2, the context of business turnaround
                           and bankruptcy is exposed along with the materials and methods chosen for the analyses;
                           Section 3 provides detailed information for the experiment and the main results. Section 4
                           presents the results and discussion; Section 5 exposes the main conclusions.

                           2. Theoretical and Conceptual Framework
                           2.1. Bankruptcy and Turnaround
                                Companies attempt a turnaround process when they suffer a decline of such intensity
                           that their survival is under threat [12]. The decline may be rather rapid or slow, severe or
                           slight, but always directs the company towards disappearance unless decisive actions are
                           taken. Turnaround scholars have studied the likelihood to survive a steep performance
                           decline through the responses adopted by declining firms [13]. Those responses have been
                           analyzed focusing on content, retrenchment-recovery [12,13], context [14–17], intensity [18],
                           and timing [19,20]. All of them are firm-specific factors that may consider only marginally
                           the surrounding factors that affect firm survival and decline responses.
                                Nonetheless, as the Great Recession and COVID-19 crises have highlighted, location-
                           specific factors also impact the outcome of a turnaround attempt. Due to cultural, economic,
                           or geographical reasons present in a territory, the business density has similarly been
                           considered a risk factor. This phenomenon is visible in the agglomerations of companies
                           that seek and benefit from external economies derived from geographic proximity to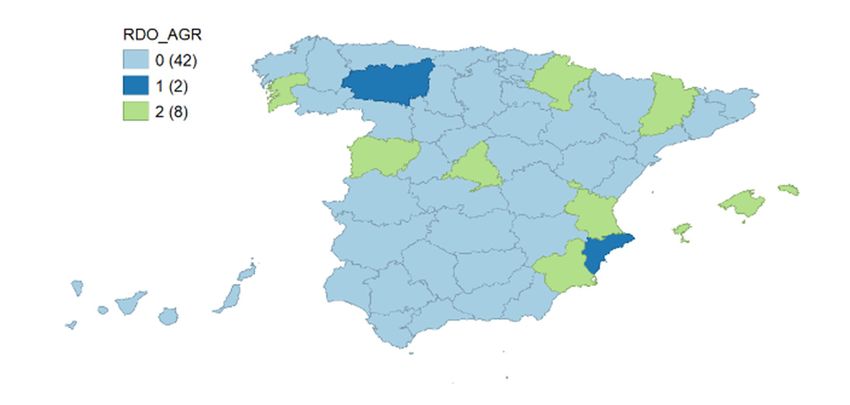
Mathematics 2021, 9, 960                                                                                             3 of 20

                           customers and suppliers, as well as to related and unrelated sectors [21]. Examples of these
                           concentrations are industrial parks, tourist destinations, hotels, or territories specializing
                           in a particular activity (for example, economic clusters).
                                 The business economics literature has recognized in the geographical agglomerations
                           of activity and external economies derived from them (dependent on other companies’
                           existence and actions) a source of competitive advantages that would translate into more
                           remarkable survival [22]. However, this relationship is neither linear nor homogeneous in
                           all sectors of activity. For example, [23] showed the highest risk of mortality in Spanish
                           textile regions with medium levels of geographic density, and [24] showed that among
                           similar hotels, the higher the business density, the higher the intensity of competition the
                           risk of failure.

                           2.2. The Spanish Bankruptcy System
                                Bankruptcy is considered the most severe form of decline in a turnaround process
                           in [17] since the gravity of decline is such that the firm cannot repay its debts. Bankruptcy
                           figures in Spain drastically increased during the Great Recession. The peak was reached in
                           2013 when GDP plummeted during a second recession. Bankrupt firms in Spain represent
                           nearly 65 billion assets in the period 2004–2017 [25]. Bankruptcy is different from insolvency
                           (financial status), and we assumed it as a legal procedure (Concurso de acreedores). In
                           Spain, bankruptcy allows only two outcomes: (i) success by reaching an agreement with
                           creditors (convenio), and (ii) liquidation and disappearance of the firm. This paper, thus,
                           focuses on Spanish bankrupt firms during 2004–2017.
                                Spain was selected for this study, according to [26], given the significant influence of
                           the institutional context on the bankruptcy system. Spain is characterized by, principally,
                           two features. On the one hand, the bankruptcy procedure is rarely used by insolvent
                           firms [27]. On the other hand, the bankruptcy system’s effectiveness, measured with
                           success rates, is far inferior to that of other developed countries [8]. In consequence, in
                           Spain, only 6% of bankruptcies succeed, while the USA Chapter 11 presents survival rates
                           of about 24% [2]. Thus, it is crucial to examine the regional differences in this minority of
                           Spanish firms to extend the broader majority’s findings.
                                Additionally, significant regional disparities were observed in bankruptcy efficiency.
                           While assuming that firm-specific factors have been reported as relevant by prior eco-
                           nomic literature, location-specific factors need to be considered to capture the effect of
                           geographical impact on the turnaround outcome.

                           2.3. Spatial Autocorrelation and Bankruptcy
                                 Prior studies such as [28] analyzed the spatial autocorrelation to predict bankruptcy
                           likelihood through companies’ interconnection (economic environment) by employing
                           decision trees. Other studies such as [29], assessed the spatial relationship between com-
                           panies’ financial health and the judicial system’s efficiency (institutional environment)
                           through logistic regression. While both studies reveal spatial dependence between location
                           and the company’s failure, we believe that these methods partially cover this phenomenon.
                                 Thus, to analyze whether the outcome of a bankruptcy procedure is dependent on a
                           firm’s location or not, we based our study on the principle of regional disparity in terms
                           of business density, industrial specialization, and temporal perspective. In contrast with
                           prior studies, this paper uses geostatistics to apply regionalized variables [30]. Geostatistics
                           focuses on data variability analysis looking for relationships of dependence, behavior
                           patterns, and correlations with the spatial variable. We consider that the existing limitations
                           when using logistic regression or decision trees can be overcome with spatial statistics. The
                           reason is that spatial statistics classify the observations between those by discerning failure
                           likelihood with distinguishing covariance and also takes into consideration environmental
                           influence (neighborhood with other locations). Also, the coefficient sign allows for the
                           determining of whether the relationship between a location and its environment is direct
                           or inverse to the assessed fact.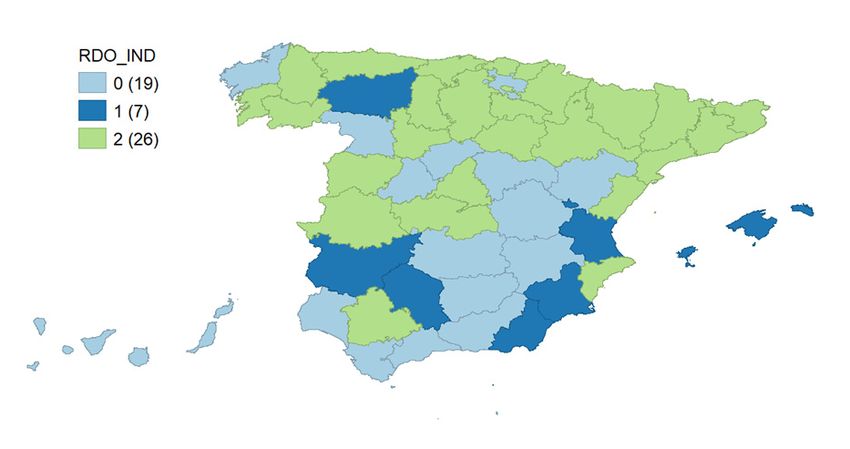
Mathematics 2021, 9, 960                                                                                             4 of 20

                                This last aspect is particularly relevant. As we argued, the bankruptcy outcome is
                           influenced far beyond by its individuality and depends on the economic and institutional
                           context in which it develops its activity. This becomes especially true in decline and crisis
                           contagion situations and can help predict future liquidity problems that cause pervasive
                           chain reactions.

                           3. Materials and Methods
                           3.1. Sample and Data
                                 The Spanish bankruptcy was enacted in 2004 [31]. Accordingly, our sample was
                           obtained from the population of Spanish firms that became bankrupt during the period
                           2004–2017. The cut-off date for data collection was set at the end of 2017, given that
                           no complete accounting data was available for those procedures that started in 2018.
                           Consequently, the sample consisted of bankrupt firms that reached an outcome (i.e., success
                           or liquidation) between 2004 and 2017. In this study, we define success as a firm’s survival
                           after going through a bankruptcy procedure and liquidation as the closure and end of
                           its activity. Firms were required to have been operating for at least five years to avoid
                           gathering data related to failures due to liability of newness [32].
                                 Financial data were obtained from the Sistema de Análisis de Balances Ibéricos (SABI)
                           database. SABI captures financial information from financial statements of two million
                           Spanish firms and half a million Portuguese firms, collected from the Public Commercial
                           Register (Registro Mercantil). SABI allows for the distinguishing of firms that have filed
                           for bankruptcy at some time in their business life (“incidences/current status/concurso”).
                           This database is widely used for research focused on Spanish companies due to its broad
                           financial-accounting information and reliability. Data regarding the bankruptcy declaration
                           and the procedure’s outcome were collected from the Public Bankruptcy Register (Registro
                           Público Concursal). The register covers data including the declaration, convenio approval,
                           and/or liquidation date. Unfinished procedures due to the continuation of liquidation
                           were not considered. In that case, the turnaround attempt would be complete (failure),
                           but the formal procedure would continue. Firms that had instantaneously entered the
                           bankruptcy procedure and gone into liquidation were also rejected.
                                 We also discarded firms with particular features. On the one hand, both sports clubs
                           and state-owned firms were excluded. State companies need a turnaround that differs
                           substantially from privately held firms [33]. Sports clubs were discarded, given the specific
                           features that may affect their turnaround attempt [34]. The final sample contained 862
                           bankrupt firms, from which 354 (41.1%) failed (were liquidated), and 508 (58.9%) succeeded
                           (survived). Thus, the sample is biased towards bankrupt firms that succeeded (58.9% vs.
                           6% of the entire population of bankrupt Spanish firms). The same situation was found
                           in similar studies of Spanish firms [35,36], taking into account the problems in obtaining
                           data from firms that were liquidated at some point in the proceeding. Given that most
                           bankrupt firms (around 94%) are liquidated and disappear, few data are available once
                           they fail during bankruptcy.
                                 Concerning industrial province distribution (main activity), GDP per capita data,
                           business factor (size), and employment levels, they were obtained from the Instituto
                           Nacional de Estadística (INE) database in the regional and national accounting year 2017.

                           3.2. Variables and Standardization of Variables
                                In line with most of the studies, the province is the spatial unit of analysis in [8,23,27].
                           The province is an administrative division that splits Spain into 50 different territories
                           or regions. At the EU level, a province is called NUT-III. This disaggregation level has
                           the advantage of its operationalization and a sufficient level of detail to contrast the
                           neighborhood’s effect in the analyses.
                                As we focus on firm survival, we have distinguished two types of variables: a) the
                           outcome and b) the predictors or explanatory variables (province specialization, the GDP
                           per capita, average size of firms or business factor, and unemployment).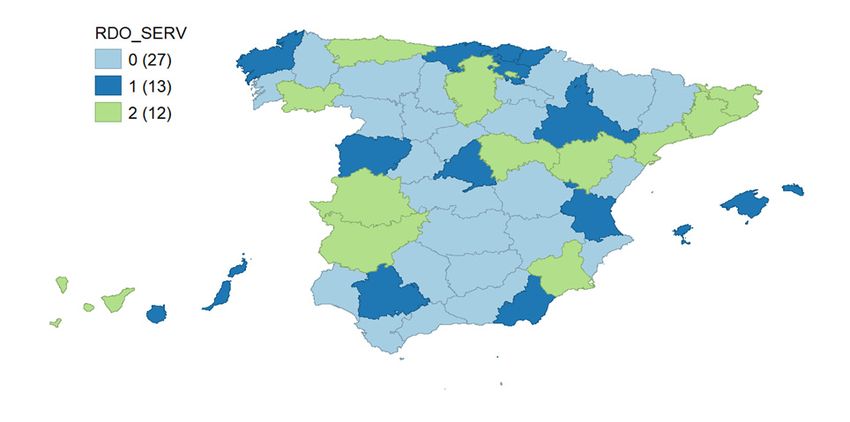
Mathematics 2021, 9, 960                                                                                                      5 of 20

                                    (a)   Outcome
                                          In line with the objectives, the outcome is a variable that takes two values: liquidation
                                    and success in [21]. To distinguish in which provinces the companies in proceedings tend
                                    to liquidate from those who tend to succeed, we have constructed a location coefficient
                                    (LQ) (Iag) [35,36]. The LQ is an estimator that measures the spatial concentration with the
                                    advantages of easy calculation and interpretation [37]. The LQ can be used as an index
                                    to evaluate the level of presence of a characteristic (outcome or predictor) in a particular
                                    space (provincial) concerning the total (Spain).
                                          For the LQ of the outcome proceedings, we have done two analyses, one for the
                                    liquidation and another for the success (see Equations (1) and (2)).

                                                Iag liquidation = (numberofliquidatedfirmsintheprovince/number
                                                   ofinsolventfirmsintheprovince)/(numberofliquidatedfirmsin                           (1)
                                                               Spain/numberofinsolventfirmsinSpain),

                                                  Iag success = (numberofsuccessfulfirmsintheprovince/number
                                                   ofinsolventfirmsintheprovince)/(numberofsuccessfulfirmsin                           (2)
                                                              Spain/numberofinsolventfirmsinSpain),
                                           When the indexes take values near or equal to 1, this indicates that this province
                                     or place has for the characteristic analyzed a similar presence in the space or country of
                                     reference (random dispersion). When it takes a value over 1, they indicate that the province
                                     has an overrepresentation, agglomeration, or concentration of this trait in the province. In
                                     this case, the variable is dispersed, forming clusters (clumped dispersion). In other words,
                                     the higher the index, the higher the relative importance of liquidation or success in that
                                     province with respect to the same indicator in relationship with Spain. On the contrary, the
                                     nearer to zero, the less relevant the liquidation or success will be.
                                           When calculating specialization indices, it is necessary to establish categories to classify
                                     them in homogeneous ways [38]. Considering that the central value is 1, the value implies
                                     that a particular province has no specialization in one of the outcomes; three categories
                                     were established. The central one, ranging from 0.16 points over and under 1, determines a
                                     similar behavior to the country’s rest. The higher interval, over 1.16, indicates the existence
                                     of specialization, and the lower one, under 0.84, reveals no specialization.
                                           Figure 1 shows maps representing the specialization indexes for success and liquida-
                                     tion according to the three defined intervals. These indexes can be interpreted as indicators
                                     of a territory’s business density in a given activity [23,39]. Both maps show in green the
                                     provinces with a particular specialization in liquidation (left) or success (right) and the
                                     clusters of provinces characterized for one or other tendencies. Clear blue shows those
                                     provinces with no specialization, while dark blue represents the provinces with
Mathematics 2021, 9, x FOR PEER REVIEW                                                                                         similar
                                                                                                                            6 of  20
                                     rates as the rest of the country. At first sight, northern provinces tend to specialize in the
                                     success outcome (on the right figure, green colors).

                                   Figure 1. Spatial distribution of specialization indexes of convenio and liquidation by provinces.
                                Figure 1. Spatial distribution of specialization indexes of convenio and liquidation by provinces.
                                         In contrast, southern provinces show higher liquidation rates (on the left figure, green
                                (b) colors). This firstor
                                      The predictors    mapping   shows
                                                          explanatory    a north/south trend, with mortality being lower in the
                                                                       variables
                                    regions
                                      Province specialization measures the of
                                             in the north  than in the south    Spain.
                                                                             main       Thisof
                                                                                    activity evidence   requires
                                                                                               the territory.    a deeper
                                                                                                              Given Spain’sstudy
                                                                                                                            eco- of
                                    the reasons  behind   such regional disparities in bankruptcy   outcomes.
                                nomic structure, we have distinguished four types of activity (agriculture, building, ser-
                                vices, and manufacturing). Expression (3) describes the LQ or levels of specialization of
                                this variable in Spain. Table 1 shows the values.
                                           Iag IE (industry specialization) = (value of the industry in the province/total
                                                                                                                                 (3)
Mathematics 2021, 9, 960                                                                                            6 of 20

                           (b) The predictors or explanatory variables
                                Province specialization measures the main activity of the territory. Given Spain’s
                           economic structure, we have distinguished four types of activity (agriculture, building,
                           services, and manufacturing). Expression (3) describes the LQ or levels of specialization of
                           this variable in Spain. Table 1 shows the values.

                                    Iag IE (industry specialization) = (valueoftheindustryintheprovince/total
                                                                                                                       (3)
                                      GDPoftheprovince)/(valueoftheindustryinSpain/totalGDPinSpain),

                           Table 1. Specialization indexes by industry and province.

                                                AGRI             BUIL            SERV       MANU            Iag IE
                                Álava            0.64             0.50            0.72       1.97               4
                              Albacete           3.31             0.84            0.84       0.83               1
                               Alicante          0.60             1.15            0.97       0.55               3
                               Almería           5.67             1.08            0.78       0.52               1
                               Asturias          0.39             1.04            8.68       1.13               3
                                Ávila            0.99             1.30            0.95       0.55               2
                               Badajoz           3.22             0.91            0.86       0.66               1
                            Balears, Illes       0.20             1.18            1.04       0.34               3
                             Barcelona           0.17             0.76            0.91       1.09               3
                               Bizkaia           0.08             1.30            0.87       1.08               4
                               Burgos            0.97             1.06            0.71       1.74               4
                               Cáceres           2.46             1.36            0.82       0.86               1
                                Cádiz            1.06             0.85            0.91       0.89               1
                             Cantabria           0.48             1.02            0.85       1.20               4
                               Castelló          0.79             0.87            0.70       1.90               4
                            Ciudad Real          3.54             1.07            0.75       1.09               1
                              Córdoba            3.05             0.89            0.87       0.68               1
                             Coruña, A           1.22             1.10            0.86       0.98               1
                               Cuenca            4.98             1.06            0.73       0.88               1
                             Gipuzkoa            0.18             1.01            0.81       1.44               4
                                Girona           0.87             1.03            0.89       0.93               3
                              Granada            2.29             1.00            0.94       0.45               1
                            Guadalajara          1.13             0.90            0.78       1.43               4
                               Huelva            2.39             0.97            0.78       1.20               1
                               Huesca            4.54             0.89            0.73       1.04               1
                                 Jaén            3.72             0.91            0.84       0.69               1
                                 León            0.86             0.96            0.93       0.80               3
                                Lleida           1.59             1.13            0.88       0.83               1
                                 Lugo            2.95             1.19            0.81       0.88               1
                               Madrid            0.02             0.75            1.03       0.57               3
                               Málaga            0.96             1.30            1.01       0.30               2
                               Murcia            1.73             0.93            0.71       1.05               1
                               Navarra           1.19             0.87            0.73       1.69               4
                               Ourense           2.09             1.06            0.82       1.01               1
                               Palencia          1.00             0.81            0.73       1.71               4
                            Palmas, Las          0.37             0.81            1.05       0.39               3
                            Pontevedra           1.57             1.03            0.82       1.13               1
                              Rioja, La          1.84             0.89            0.74       1.51               4
                            S. Cruz de T.        0.66             1.00            1.04       0.32               3
                             Salamanca           1.46             0.89            0.94       0.65               1
                               Segovia           1.45             1.59            0.86       0.76               2
                                Sevilla          1.86             0.81            0.89       0.85               1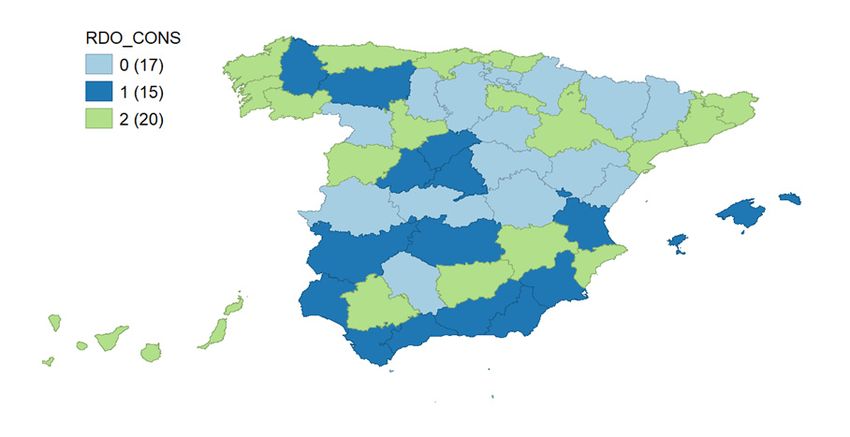
Palencia 1.00 0.81 0.73 1.71 4
Palmas, Las 0.37 0.81 1.05 0.39 3
Pontevedra 1.57 1.03 0.82 1.13 1
Rioja, La 1.84 0.89 0.74 1.51 4
Mathematics 2021, 9, 960 S. Cruz de T. 0.66 1.00 1.04 0.32 3 7 of 20
Salamanca 1.46 0.89 0.94 0.65 1
Segovia 1.45 1.59 0.86 0.76 2
Sevilla 1.86 0.81 0.89 0.85 1
Table 1. Cont.
Soria 1.45 1.12 0.77 1.33 4
Tarragona 0.44
AGRI 0.88
BUIL 0.82
SERV 1.41
MANU 4 IE
Iag
Teruel
Soria 1.87
1.45 1.58
1.12 0.80
0.77 0.97
1.33 24
Toledo
Tarragona 2.03
0.44 1.15
0.88 0.79
0.82 1.16
1.41 14
Teruel
Valencia 1.87
0.72 1.58
0.94 0.80
0.86 0.97
1.15 32
Toledo 2.03 1.15 0.79 1.16 1
Valladolid 0.80 0.73 0.84 1.32 4
Valencia 0.72 0.94 0.86 1.15 3
Zamora
Valladolid 1.86
0.80 1.46
0.73 0.86
0.84 0.72
1.32 14
Zaragoza
Zamora 1.35
1.86 0.85
1.46 0.82
0.86 1.24
0.72 41
Zaragoza 1.35 0.85 0.82 1.24 4
Table 1 has six columns. The first one has the list of the 50 Spanish provinces; the
following Tablefour capture
1 has the indexThe
six columns. value forone
first eachhasindustry
the list by province
of the (Equation
50 Spanish (3)). The
provinces; the
last column informs the industry in which the particular province
following four capture the index value for each industry by province (Equation (3)). is specialized. To oper-
The
ate thecolumn
last variableinforms
(Iag IE),thetheindustry
results were
in whichcategorized into three
the particular levels (near
province to 1, underTo
is specialized.
0.84, and over
operate 1.16). Code
the variable (Iag 1IE),
wastheassigned to agriculture,
results were categorized 2 building,
into three3levels
services, and
(near to 41,man-
under
ufacturing.
0.84, and overFor instance,
1.16). Codeconsidering Álava, we
1 was assigned observe that2the
to agriculture, highest3index
building, wasand
services, ob- 4
tained for manufacturing
manufacturing. (1.97),considering
For instance, so code 4 was assigned.
Álava, we observe that the highest index was
Suppose
obtained forwe map at a province-level
manufacturing (1.97), so code the4 spatial distribution of the activity in Spain
was assigned.
(FigureSuppose
2). In that case, it can be said that its distribution
we map at a province-level the spatial distribution is not homogeneous among
of the activity the
in Spain
country,
(Figuregiven
2). In that
that there are
case, it provinces
can withits
be said that higher rates ofisspecialization
distribution not homogeneousin manufactur-
among the
ing (for example,
country, given thatAlava orare
there Burgos, 1.97 with
provinces and 1.94,
higher respectively, coded as 4in
rates of specialization inmanufacturing
Table 2, and
dark
(forgreen on the
example, figure)
Alava that are1.97
or Burgos, located
and in therespectively,
1.94, North and form codeda cluster. For other
as 4 in Table 2, andactiv-
dark
ities,
greenthisontendency
the figure)is also
thatobserved,
are located especially
in the Northin theandoneform
specialized
a cluster.inFor
agriculture (light
other activities,
this tendency is also observed, especially in the one specialized in agriculture (light blue).
blue).
Figure 2. Spatial specialization of activities in Spain by provinces.
Figure 2. Spatial specialization of activities in Spain by provinces.
Another explanatory variable in the analysis is the GDP per capita, which captures
each province’s
Another wealth level
explanatory in [7].inIt the
variable is a analysis
continuous variable
is the that capita,
GDP per takes values
whichfrom 18.050
captures
euros
each (Cadiz) to
province’s 36.404
wealth (Álava).
level in [7]. It is a continuous variable that takes values from 18.050
Similarly,
euros (Cadiz) to to contrast
36.404 the “business factor,” we have used the average size of companies
(Álava).
in the region as an indicator [40]. It has been operating as in Expression (4)
Iag SS (size specialization) = (numberbusinessmedium + largeinthe
province/totalnumberbusinessintheprovince)/(numberbusinessmedium + large (4)
inSpain/totalnumberbusinessinSpain),
Lastly, unemployment is used as an indicator of the economic development in each
analyzed province [41]. As for the GDP, As for the GDP, the unemployment variable is
continuous and it takes values from 7.1% (Gipuzkoa) to 24.4% (Jaén).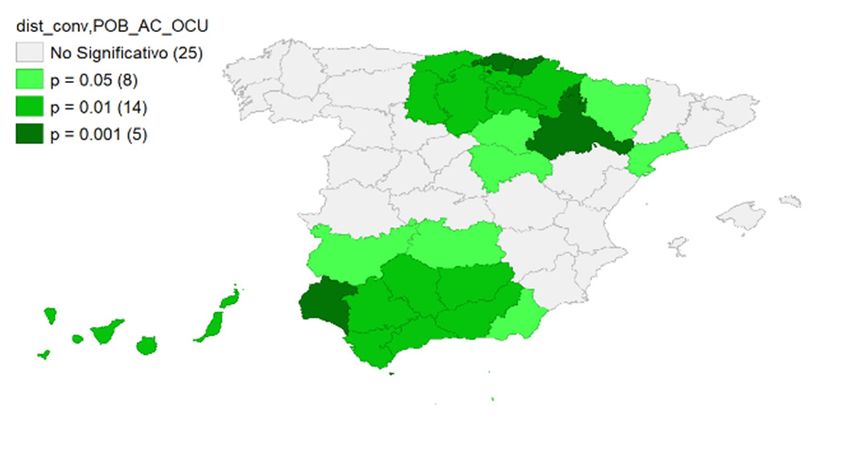
Mathematics 2021, 9, 960                                                                                         8 of 20

                           Table 2. Bankruptcy outcome by province and industry.

                                Province              AGRI             BUID            SERV             MANU
                                  Álava                                               0.00%             0.00%
                                Albacete                              33.00%          0.00%
                                 Alicante         −100.00%            33.33%          0.00%            100.00%
                                 Almería                             −100.00%        −100.00%          −33.33%
                                 Asturias                             75.00%         100.00%            50.00%
                                   Ávila                             −100.00%         0.00%
                                 Badajoz                             −100.00%        100.00%           −100.00%
                              Balears, Illes       100.00%           −66.67%          8.33%            −50.00%
                               Barcelona                              76.47%         175.56%            87.34%
                                 Bizkaia                              20.00%          0.00%             77.78%
                                 Burgos                                              100.00%           100.00%
                                 Cáceres                                             100.00%           100.00%
                                  Cádiz                              −100.00%        −100.00%            0.00%
                               Cantabria                             100.00%         −100.00%           33.33%
                                Castellón                              0.00%          0.00%             33.33%
                              Ciudad Real                            −100.00%         0.00%              0.00%
                                Córdoba                                0.00%          0.00%            −33.33%
                               Coruña, A                               9.09%         −93.33%             0.00%
                                 Cuenca               n/a               n/a            n/a                n/a
                               Gipuzkoa                              100.00%         −60.00%            33.33%
                                  Girona                              33.33%         100.00%            50.00%
                                Granada                              −100.00%         0.00%
                              Guadalajara                                             0.00%
                                 Huelva                              −100.00%         0.00%
                                 Huesca                               0.00%           0.00%             33.33%
                                   Jaén                              100.00%         −100.00%
                                   León           −100.00%           −45.45%         −100.00%          −45.45%
                                  Lleida          100.00%                                              100.00%
                                   Lugo                              −100.00%         0.00%             20.00%
                                 Madrid            33.33%            −15.79%         −29.82%           12.20%
                                 Málaga                              −100.00%        100.00%
                                 Murcia            100.00%           −57.14%         100.00%           −45.45%
                                 Navarra           100.00%                           100.00%           100.00%
                                 Ourense                              100.00%        100.00%           100.00%
                                 Palencia                             33.33%          33.33%            0.00%
                              Palmas, Las                                              0.00%           100.00%
                              Pontevedra           100.00%           100.00%         100.00%           100.00%
                                Rioja, La                            100.00%         −100.00%          100.00%
                              S. Cruz de T.                           60.00%         133.33%            0.00%
                               Salamanca           100.00%            50.00%         −100.00%          100.00%
                                 Segovia                             −33.33%           0.00%
                                  Sevilla                             81.82%         −133.33%           33.33%
                                   Soria                                               0.00%           100.00%
                               Tarragona                              100.00%        100.00%           100.00%
                                  Teruel                                             100.00%
                                  Toledo                                               0.00%           100.00%
                                 Valencia          100.00%           −57.14%         −98.46%           −20.00%
                               Valladolid                            100.00%           0.00%            33.33%
                                 Zamora               n/d              n/d              n/d              n/d
                                Zaragoza                             71.43%          −66.67%           42.86%

                           (c) Preliminary analysis
                                Finally, intending to assess in an explorative way whether the companies dedicated to
                           a given province’s sector mark a trend towards success or liquidation, we made a prelimi-
                           nary analysis. According to the company sector, the variable “result of proceeding” was
                           operational considering companies’ aggregate results in the same industry and province.
                           The results are depicted in Table 2. Positive figures show that companies of that industry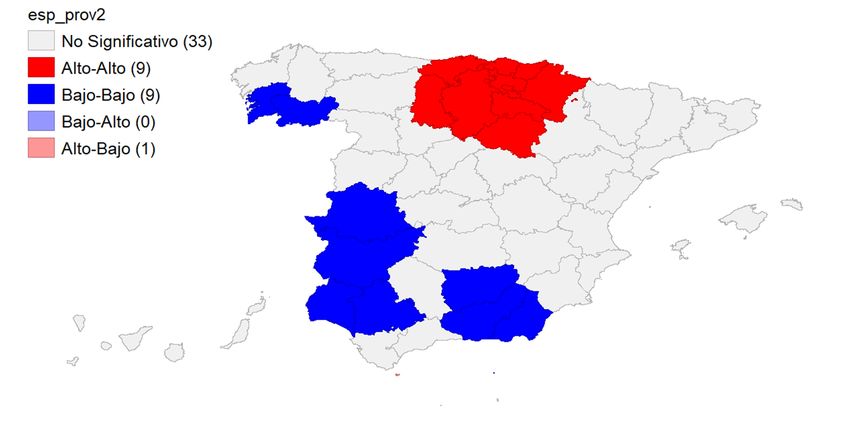
Mathematics 2021, 9, 960                                                                                               9 of 20

                           and province had a successful bankruptcy, while negative ones show those that ended in
                           liquidation. Empty cells of Table 2 indicate that there are no bankrupt companies for the
                           particular province. For instance, Alicante has a value of −100% in agriculture. This value
                           represents that all the companies in that industry ended in liquidation. On the contrary, also
                           for Alicante, manufacture has a value of 100%, meaning that all manufacturing companies
                           succeeded. In the case of building, there is a probability of 33% that building companies
                           reach success rather than liquidation.

                           3.3. Methods
                                 To study the territory and evaluate whether different behaviors depended on the
                           firm’s location, the free software GeoDa was used (v1.16 October 2020). We follow the
                           recommendations and suggestions of [42,43] and also present in GeoDa Center for Analysis
                           and Computation (http://GeoDacenter.asu.edu (accessed on 30 June 2020)). This software
                           allows us to under-take spatial studies and reports their results in graphics and maps,
                           making their interpretation easier.
                                 To better interpret the results, two indexes were applied: (1) the Moran’s Global Index
                           and (2) Local Indicators of Spatial Association (LISA) with contiguity or neighborhood
                           type 1. The choice of these statistical techniques is due to two main methodological reasons.
                           On the one hand, it allows for measuring the spatial correlation between two variables, one
                           of them being location and others being general variables of the companies, such as size,
                           industry, or economic environment variables, as GDP per capita or employment levels.
                           On the other hand, it identifies those variables that explain statistically more significant
                           robustness in the bankruptcy outcome in that spatial context [44,45].
                                 It is important to note that this research method has advantages and disadvantages.
                           It allows for the correlation of variables vis-a-vis considering the location. This means
                           that the methods show the spatial distribution of variables as well as their correlation.
                           This circumstance permits making comparisons both by provinces and during the time.
                           However, derived from the correlation studies’ nature, the number of variables included
                           is only two. This fact allows for the correlation of several combinations of variables and
                           extraction of conclusions from those correlations.
                           (a)   Moran’s Global Index and Local Indicators of Spatial Association (LISA)
                                 To calculate these indices, it is necessary to define the neighborhood structure of the
                           considered spatial units. In this paper, the neighborhood structure used is Queen, which
                           means that the standardized connectivity matrix is W with ωij = 1/ni, if j shares a border
                           with i, where ni is the total number of neighbors. Besides, ωii = 0 means no spatial unit is
                           considered a neighbor of itself [46].
                                 Once both indexes are obtained, a Moran bivariate analysis is done by correlating the
                           variables Aggregation Index and GDP per capita with the variable territory [41].
                                 This tool of spatial correlation must be interpreted in the context of the null hypothesis.
                           When the Moran’s Index takes a value of 0, the outcome distribution is random. On the
                           contrary, when the value is different to 0, a significant spatial correlation exists. To contrast
                           the null hypothesis (value of 0), the z- statistic is obtained; if z is out of the interval [−1.96,
                           1.96], then we can assume a spatial correlation. The index (1) has the following expression:

                                                                       ∑ni=1 ∑nj=1 wJi · (xi − x) xj − x

                                                             n
                                                 I= n                                                                      (5)
                                                      ∑i=1 ∑nj=1 wJi ·           ∑ni=1 (xi − x)
                                                                                                2

                           where n is the number of spatial units, and xi is the corresponding value of the studied
                           variable X and its average x.
                                Expression (5) is used to determine whether the bankruptcy outcome presents diverse
                           behaviors depending on the territory.
                                Spatial positive autocorrelation is evidenced when Ii> 0. In these cases, the neighbor-
                           ing provinces tend to be similar and indicate a spatial grouping of similar values (either
                           high HH or low LL) around the spatial unit (province). When Ii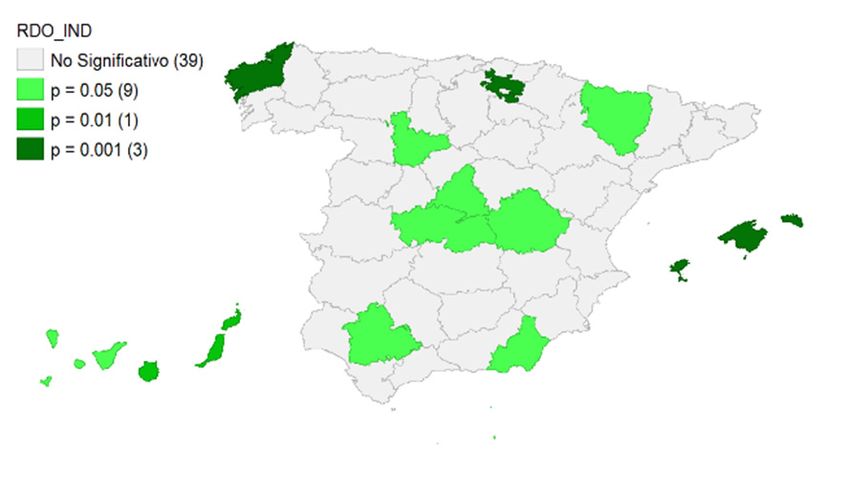
Mathematics 2021, 9, 960 10 of 20
province and its neighboring are dissimilar indicating outliers (either HL or LH). Finally,
it is noteworthy that when Ii = 0 indicates randomness of the data, so there is no spatial
correlation.
Index (6), LISA, is useful to determine the existence of local groups or clusters, the
establishment of relationships of a neighborhood of a cluster with surrounding territories,
and the kind of relationship. The mathematic expression is proposed by [41], which is as
follows:
n
(x − x)
Ii = n i ∑
2
ωij xj − x for i 6= j (6)
∑ i = 1 ( xi − x ) j = 1
Autocorrelation may take positive values when other groups surround the territory
with positive or high values. It also establishes a correlation when the values are negative
or low.
(b) Moran’s Bivariate Index and Bi Local Indicators of Spatial Association (LISA)
Moran’s Bivariate Index measures the degree to which a variable x in a particular
location is correlated with its neighbors with a different variable y, and values the effect
produced in a central location. This is used to measure the neighborhood effect and the
influences to establish the relationship between both variables. It is a complementary
analysis that allows knowing how a phenomenon can vary through geographical space
(the spatial dependence of the bankruptcy) considering the effects that this phenomenon
presents due to changes of second variables, such as per capita income, size, sector of
activity, or level of occupation in [38,40,41]. In this way, it is intended to see how the result
of the creditors’ bankruptcy was modulated by considering other variables (in our case
industry, GDP per capita, business factor, or employment) and assessing provincial clusters’
existence based on the result and the indicated variables. It seeks to evaluate whether there
is a repetition of clusters with different variables and establish the geographic variable as
one more explanatory variable of the bankruptcy result.
This index is expressed as follows:
n n
∑ ∑
n i=1 j=1 iJ w · X i − X yj − y
I= q
W
Σ(xi − e x ) 2 ∑ ( yi − y ) 2
p
where x is variable 1, y is variable 2, and W=∑i ∑j wij .
Thus, it allows us to know how the phenomenon evolves along with space, in our
case, the bankruptcy outcome, but considers the effect of other variables, such as GDP per
capita, size, industry, or employment.
4. Results
4.1. Industrial Specialization by Province and the Bankruptcy Outcome
To assess the value and provincial clusters’ existence, the Moran’s Index is analyzed
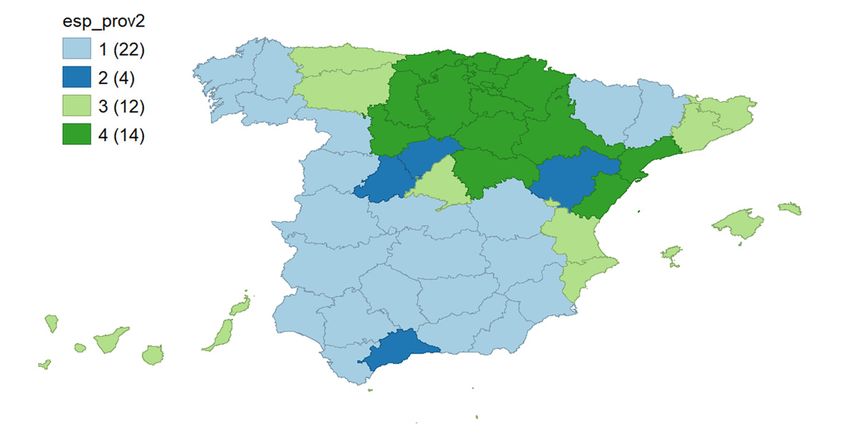
and mapped (see Figure 3). Moran’s index shows a value of 0.555, with a z of 6.432, so
clusters’ existence is well established. These results complement and are in line with those
obtained previously (see Figure 2) and show Spain’s spatial specialization. Specifically,
the northern provinces take high values (4 = manufacturing), and the second one in the
southern province shows low values (1 = agriculture) and is significantly higher than 95%.4.1. Industrial Specialization by Province and the Bankruptcy Outcome
andTomapped (see
assess the Figure
value and3).provincial
Moran’s clusters’
index shows a value
existence, theofMoran’s
0.555, with
Indexa is
z of 6.432, so
analyzed
and mapped (see Figure 3). Moran’s index shows a value of 0.555, with a z of 6.432,those
clusters’ existence is well established. These results complement and are in line with so
obtained
clusters’ previously
existence (see
is well Figure 2) These
established. and show Spain’s
results spatial specialization.
complement Specifically,
and are in line with those
the northern
obtained provinces
previously take high
(see Figure values
2) and show(4 =Spain’s
manufacturing), and the second
spatial specialization. one in the
Specifically,
Mathematics 2021, 9, 960 southern province shows low values (1 = agriculture) and is significantly higher than11 95%.
of 20
the northern provinces take high values (4 = manufacturing), and the second one in the
southern province shows low values (1 = agriculture) and is significantly higher than 95%.
Figure3.3.Clusters
Figure Clustersmap
mapfor
forprovince
provincespecialization.
specialization.
Figure At
3. Clusters map the
for province specialization.
At this
this point,
point, the question
question ofififthere
of thereare
arespatial
spatialcorrelations
correlations with
with thethe success
success or
or liq-
liquidation
uidation of
thethe bankruptcies emerges. The variables
IagIag success
andand Iag liquidation
are At thisofpoint,
related to Iag
bankruptcies
the question
industrial
emerges.
of if thereThe
specialization.
variables
areMoran’s
spatial Local success
correlations with
Bivariate
Iagsuccess
the
Index
liquidation
was or liq-are
applied to
related
uidation to
of Iag
the industrial
bankruptcies specialization.
emerges. Moran’s
The Local
variables Bivariate Index
Iag success does
and Iagwas applied
liquidation toare
ana-
analyze
lyze thisthis situation.
situation. The result is
Thespecialization. that
result is that the the spatial
spatial dependence
dependence does exist,
exist, given that the
related to Iag
obtained industrial
value is higher than 1, with Moran’s
z = 4.615 Local
(see Bivariate
Figure 4). Index wasgiven
appliedthat
tothe
ana-ob-
tained
lyze this value is higher
situation. than 1,
The result is with z = 4.615
that the spatial(see Figure 4). does exist, given that the ob-
dependence
tained value is higher than 1, with z = 4.615 (see Figure 4).
(a) (b)
Figure4.4.Significance
Figure Significancemap (a)
map(a)(a) and
and cluster
cluster map
map (b)(b)
forfor Moran’s
Moran’s Local
Local Bivariate
Bivariate Index
Index (b)
for success
for success and and industrial
industrial specializa-
specialization.
tion.
Figure 4. Significance map (a) and cluster map (b) for Moran’s Local Bivariate Index for success and industrial specializa-
tion.
The maps show that when the variable Iag success takes a high value (higher than 1)
The maps show
and simultaneously thethat whenIag
variable theindustry
variable specialization
Iag success takes
too, aa high value (higher
correlation thanso1)
is detected,
aand simultaneously
relationship can be the variable
established Iag industry
between specialization
convenio and too, a
manufacturing correlation
in these
The maps show that when the variable Iag success takes a high value (higher than 1) is detected,
provinces.
Thesimultaneously
and maps show (redthe color) the provinces,
variable thespecialization
Iag industry northern ones,too,
specialized in manufacturing
a correlation is detected,
activities that have a higher likelihood of a successful bankruptcy procedure outcome.
The same exercise was done for Iag liquidation and Iag industry specialization. In this
case, a Moran’s Local Bivariant Index was obtained with a value of −0.201 and z = 3.0209,
so spatial dependence exists as well as provincial clusters (see Figure 5). These results
complement those obtained and shown in Figure 4. An apparent disparity is shown
between the northern and southern provinces.
Results of the first of the analyses show that spatial dependence and disparities exist.
Northern provinces specialize in manufacturing activities and tend to have higher suc-
cess rates in a bankruptcy procedure (convenio outcome). On the other hand, southern
provinces show specialization in the primary sector (agriculture) and present higher liq-
uidation rates. These results are in line with previous investigations that show a spatial
dependence on the bankruptcy solution among countries in [26] or countries with similar
systems, such as Spain and Italy in [27–29]. At this point, the question is what factors can
explain the regional disparities in the success rate?facturing activities that have a higher likelihood of a successful bankruptcy procedure
outcome.
The same exercise was done for Iag liquidation and Iag industry specialization. In
this case, a Moran’s Local Bivariant Index was obtained with a value of −0.201 and z =
Mathematics 2021, 9, 960 3.0209, so spatial dependence exists as well as provincial clusters (see Figure 5).12These
of 20
results complement those obtained and shown in Figure 4. An apparent disparity is
shown between the northern and southern provinces.
(a)
(b)
Figure 5. Significance map (a) and cluster map (b) for Moran’s Local Bivariate Index for liquidation and industrial spe-
cialization.
Results of the first of the analyses show that spatial dependence and disparities exist.
Northern provinces specialize in manufacturing activities and tend to have higher success
rates in a bankruptcy procedure (convenio outcome). On the other hand, southern prov-
inces show specialization in the primary sector (agriculture) and present higher liquida-
(a)
tion rates. These results are in line with previous investigations (b) that show a spatial de-
Figure5.5. Significance pendence on the bankruptcy solution among countries in [26] or countries withspe- similar
Figure Significance map
map (a)
(a)and
andcluster
clustermapmap(b)(b)forfor
Moran’s
Moran’s Local Bivariate
Local Bivariate Index for for
Index liquidation
liquidationandandindustrial
industrial
cialization. systems, such as Spain and Italy in [27–29]. At this point, the question is what factors can
specialization.
explain the regional disparities in the success rate?
Results of the first of the analyses show that spatial dependence and disparities exist.
4.2. GDP Specialization
Northern by Province
provinces specialize Bankruptcy
and the Bankruptcy
in manufacturing Outcome
Outcome
activities and tend to have higher success
ratesOnce
in a bankruptcy
we had mapped procedure (convenioheterogeneity
bankruptcy
the bankruptcy outcome). Onin
heterogeneity inthe other
Spain,
Spain, inhand,
in southern
line with
line with prov-
the second
the second
inces show
objective specialization
of this research, we in the
we primary
intended
intended to sector
to explain
explain (agriculture)
which factors
which factorsandcould
present
could higherit
elucidate
elucidate itliquida-
as we
as we
tion rates.
noted These
(Figure
(Figure 6) resultsindustry
6)neither
neither are in line
industry with previous
distribution
distribution nornor GDPinvestigations
GDPperpercapita inthat
capita in show
Spain. a spatial
Northern
Spain. de-
prov-
Northern
pendence
inces
provinces on
havehave the
higher bankruptcy
GDPGDP
higher per capita
persolution
figures
capita among countries
thanthan
figures southern in [26]
ones.
southern Toorverify
ones. countries
To withfact,
this fact,
verify this thesimilar
Mo-
the
systems,
ran’s
Moran’s Indexsuch
wasas
Index wasSpain
obtained and
obtained forItaly
GDP
for inper
GDP [27–29].
capita
per At this point, therevealing
(PIB_P_20182),
capita (PIB_P_20182), question
revealing is what
a value
a valuefactors
of of
0.671 can
(z
0.671
(z = 7.6828).
=explain
7.6828).the Thus,
regional
Thus, spatial dependence
disparities
spatial dependence in the exists asaswell
success
exists wellas
rate? asdifferent
different behaviors.
behaviors. Figure 6 allows allows
us to clearly distinguish
distinguish those differences,
differences, showing
showing aa cluster
cluster of of provinces
provinces with with higher
higher GDP GDP
4.2.capita
per GDP Specialization
capita in
in the North by
the North Province
during
during and the
aa cluster
cluster ofBankruptcy
of lower
lower GDP GDPOutcome
per
per capita
capita inin southern
southern provinces.
provinces.
Once we had mapped the bankruptcy heterogeneity in Spain, in line with the second
objective of this research, we intended to explain which factors could elucidate it as we
noted (Figure 6) neither industry distribution nor GDP per capita in Spain. Northern prov-
inces have higher GDP per capita figures than southern ones. To verify this fact, the Mo-
ran’s Index was obtained for GDP per capita (PIB_P_20182), revealing a value of 0.671 (z
= 7.6828). Thus, spatial dependence exists as well as different behaviors. Figure 6 allows
us to clearly distinguish those differences, showing a cluster of provinces with higher GDP
per capita in the North during a cluster of lower GDP per capita in southern provinces.
(b)
(a)
Figure 6.
Figure 6. Significance
Significance map
map (a)
(a) and
and clusters
clusters map
map (b)
(b) for
for GDP
GDP per
per capita.
capita.
The Moran’s Bivariate Local Analysis was applied to evaluate the correlation between
the liquidation/success specialization, the GDP per capita, and the bankruptcy outcome.
The index took a value of 0.420 (z = 6.125) for successful outcomes, while it took a value of
0.242 (z = −3.6107) for liquidation. Thus, it can be concluded that spatial dependence exists.
Figure 7 shows the maps that determine the existence of province (b) clusters associated with
(a) of result. Panels (a) and (b) depict success province distribution and also reveals a
a type
cluster
Figure in the northmap
6. Significance (high-high), whichmap
(a) and clusters corresponds
(b) for GDPtoper
provinces
capita. with higher success rates
as well as high GDP per capita. Those panels also reveal that southern provinces present
low success rates and low GDP per capita levels.and also reveals a cluster in the north (high-high), which corresponds to provinces with
higher success rates as well as high GDP per capita. Those panels also reveal that southern
provinces present low success rates and low GDP per capita levels.
On the other hand, panels (c) and (d) relate to the liquidation specialization with GDP
Mathematics 2021, 9, 960 per capita and reveal the same idea. Green tones indicate the p-value. Low p-values13indi-of 20
cate a rejection of the null hypothesis, thus concluding that clusters exist, as shown in the
red and blue in panels (b) and (d).
(a) (b)
(c) (d)
Figure 7. Significance
Figure 7. Significance and
and clusters
clusters maps
maps for Moran’s
Moran’s Bivariant
Bivariant Index
Index with
with Iag convenio
convenio and
and GDP per capita (a,b) and
significance and clusters maps for Moran’s Bivariant Index with Iag liquidation and GDP per capita (c,d).
significance and clusters maps for Moran’s Bivariant Index with Iag liquidation and GDP per capita (c,d).
The results
On the otheragain
hand,pose significant
panels (c) anddifferences
(d) relate among provinces when
to the liquidation relating bank-
specialization with
ruptcy
GDP per outcomes
capita and with GDPthe
reveal per capita.
same idea.ItGreen
could tones
be asserted
indicatethattheprovinces
p-value. Low withp-values
higher
GDP peracapita
indicate tendoftothe
rejection obtain
null higher success
hypothesis, rates,
thus while those
concluding thatwith lower
clusters GDP
exist, asper
showncapita
in
tend to and
the red obtainbluehigher liquidation
in panels (b) and rates.
(d). For instance, Álava, Bizcaia, Gipuzcoa, Navarra,
The Lleida,
Huesca, results again poseBarcelona,
Girona, significantor differences
Tarragona among provinces
(northern when relatingFigure
provinces—see bankruptcy
7a,b)
outcomes
present with GDP
higher GDPper percapita.
capitaItand could
alsobehigher
asserted that provinces
success with
rates in the higher GDPprocedure.
bankruptcy per capita
tendthe
On tocontrary,
obtain higher success rates,
the provinces fromwhile those and
Andalucía withExtremadura
lower GDP per capita tend
(Almería, to obtain
Granada, Má-
higher liquidation rates. For instance, Álava, Bizcaia, Gipuzcoa,
laga Cádiz, Sevilla, Huelva, Córdoba, and Badajoz) show lower GDP per capita values Navarra, Huesca, Lleida,
Girona,
and Barcelona,
lower success or Tarragona (northern provinces—see Figure 7a,b) present higher GDP
rates.
per capita
Panelsand(c) also
and higher success7 rates
(b) of Figure showinthetheclusters
bankruptcy formed procedure. On the contrary,
for the liquidation outcome the
provinces
and fromsimilar
also show Andalucía
resultsand to Extremadura
panels (a) and(Almería,
(b). Granada, Málaga Cádiz, Sevilla,
Huelva, Córdoba,
At this point,anda newBadajoz)
question show lower GDP
emerges pertocapita
related if therevalues
is a and
spurialower success rates.
relationship be-
Panels (c) and (b) of Figure 7 show the clusters formed
tween provincial wealth (measured by GDP) and proceeding success, or if it is an for the liquidation outcome
expli-
and also
cative show
cause. similar
For results we
this reason, to panels
develop (a)aand (b).
complementary analysis that can serve to ex-
At this point, a new question emerges
plain more robustly the logic of this spatial dependence related to ifandthere
canisserve
a spuria relationship
as a basis to start
between
the provincial
discussion. wealth (measured
This analysis is formed ofbythree GDP) and (a)
levels: proceeding success, or if vs.
industry specialization it isout-
an
explicative cause. For this reason, we develop a complementary
come, (b) business factor vs. outcome, (c) unemployment vs. outcome. analysis that can serve
to explain more robustly the logic of this spatial dependence and can serve as a basis to
start the discussion. This analysis is formed of three levels: (a) industry specialization vs.
outcome, (b) business factor vs. outcome, (c) unemployment vs. outcome.
4.3. Contrasting Industry Specialization with the Bankruptcy Outcome by Province
We mapped the distribution by industries as shown in Figure 8, subfigures a–d. Green
provinces are those with higher success rates, while blue shows those with liquidation
predominance. Clear blue provinces are those with no specialization or who do not
have data.4.3.Contrasting
4.3. ContrastingIndustry
IndustrySpecialization
Specializationwith
withthe
theBankruptcy
BankruptcyOutcome
OutcomebybyProvince
Province
Wemapped
We mappedthe thedistribution
distributionby byindustries
industriesasasshown
shownininFigure
Figure8,8,subfigures
subfiguresa–d.
a–d.
Green provinces are those with higher success rates, while blue shows those with
Green provinces are those with higher success rates, while blue shows those with liquida-liquida-
Mathematics 2021, 9, 960 14 of 20
tionpredominance.
tion predominance.Clear
Clearblue
blueprovinces
provincesarearethose
thosewith
withno
nospecialization
specializationororwho
whododonotnot
havedata.
have data.
(b)Manufacturing
(b) Manufacturing
(a)Agriculture
(a) Agriculture
(c)Building
(c) Building (d)Services
(d) Services
Figure8.
Figure
Figure 8.8.Industry
Industrydistribution
Industry distributionof
distribution ofofbankruptcy
bankruptcyoutcomes.
bankruptcy outcomes.
outcomes.
Whencalculating
When calculatingthetheMoran’s
the Moran’sIndex,
Moran’s Index,spatial
Index, spatialdependence
spatial dependenceisisrevealed
dependence revealedonly
onlyfor
formanu-
manu-
man-
facturing
ufacturing firms,
firms,
facturing firms, with
with
with a value
a value
a value of 0.183
of 0.183
of 0.183 (z =
(z =(z 2.4461) (details
= 2.4461)
2.4461) at
(details
(details a province are
at a province
at a province shown in
are shown
are shown Figure
in
in Figure
9b).InIn9b).
Figure
9b). Figure
Figure 9b9b(right),
In Figure(right), provinces
9b (right), ininred
provinces
provinces redinshow high-high
red show
show values,
high-high
high-high values, which
values,
which means,
which highhigh
means,
means, high con-
con-
centrationofofmanufacturing
concentration
centration ofmanufacturing
manufacturing firms
firms
firms and
andand high success
highsuccess
high rates
successrates thebankruptcy
ratesofofthe
the bankruptcyprocedure.
bankruptcy procedure.
procedure.
Also,
Also,
Also, those
those provinces
provinces are
are surrounded
surrounded by
by provinces
provinces with
with similar
similar results.
results. On
On the
the contrary,
contrary,
blue
blue provinces have manufacturing specialization, but provinces with similar results also
blue provinces
provinces have
have manufacturing
manufacturing specialization,
specialization, but
butprovinces
provinces with
withsimilar results
similar results also
also
surround
surround low
low success
success rates
ratesininthe
thebankruptcy
bankruptcy
surround low success rates in the bankruptcy procedure. procedure.
procedure.
(a) (b)
(b)
(a)
Figure
Figure 9.9.Significance
Figure9. Significancemap
Significance map(a)
map (a)and
(a) andcluster
and clustermap
cluster map(b)
map (b)for
(b) formanufacturing
for manufacturingfirms.
manufacturing firms.
firms.
To deepen in the causes that produce higher success rates in manufacturing companies,
the manufacturing specialization variable was related to success/liquidation specialization.
Figure 10 depicts the maps of these correlations, which show a Moran’s Index of 0.252
(z = −3.4562) for success and −0.143 (z = −2.2607) for liquidation, so both results are
significant.To deepen in the causes that produce higher success rates in manufacturing compa-
nies, the manufacturing specialization variable was related to success/liquidation special-
Mathematics 2021, 9, 960 ization. Figure 10 depicts the maps of these correlations, which show a Moran’s Index of
15 of 20
0.252 (z = −3.4562) for success and −0.143 (z = −2.2607) for liquidation, so both results are
significant.
(a) (b)
(c)
(d)
Figure 10. Maps of significance and clusters with Iag success for manufacturing firms (a,b) and maps of significance and
Figure 10. Maps of significance and clusters with Iag success for manufacturing firms (a,b) and maps of significance and
clusters with Iag liquidation for manufacturing firms (c,d).
clusters with Iag liquidation for manufacturing firms (c,d).
The maps in Figure 10 (panels a and b) reveal that companies in the northern provinces
The maps in Figure 10 (panels a and b) reveal that companies in the northern prov-
(Lleida, Huesca, Navarra, and Zaragoza) have higher success rates (red), while southern
inces (Lleida, Huesca, Navarra, and Zaragoza) have higher success rates (red), while
(Ciudad Real and Sevilla) and northwest provinces (Pontevedra and Orense) (pink) show
southern (Ciudad Real and Sevilla) and northwest provinces (Pontevedra and Orense)
a higher manufacturing specialization and also lower success rates. In these latter areas,
(pink) show a higher manufacturing specialization and also lower success rates. In these
manufacturing firms usually end in liquidation. From the perspective of liquidation, panels
latter
(c) andareas,
(d) ofmanufacturing
Figure 10 show, firms usually end
particularly in liquidation.
those From the perspective
in red, manufacturing firms that of liq-
tend
uidation, panels (c) and (d) of Figure 10 show, particularly those in red,
to end in liquidation. In those provinces, both variables (liquidation and manufacturing manufacturing
firms that tendtake
specialization) to end
highinvalues.
liquidation. In those provinces, both variables (liquidation and
manufacturing specialization)
In light of these results, theretake highavalues.
exists substantial difference between the northern and
southernIn light of these
provinces results,
related to there exists a substantial
the bankruptcy outcome difference betweencompanies.
for manufacturing the northern and
Thus,
southern provinces related to the bankruptcy outcome for manufacturing
the bankruptcy outcome does not seem to be related only to industrial activity, but it also companies.
Thus, to
seems thebebankruptcy
influencedoutcome doesThis
by location. notresult
seem isto in
beline
related
withonly to industrial
studies of [23]. activity, but
it also seems to be influenced by location. This result is in line with studies of [23].
4.4. Contrasting Business Factor (Size) with the Bankruptcy Outcome by Province
4.4. Contrasting
Size has alsoBusiness Factor (Size)
been suggested with
as the thedeterminant
main Bankruptcy Outcome by Province
for firm survival and bankruptcy
Size[14,23,40].
success has also been suggested
As shown as the
by the main
data, the determinant
proportion of forsmall,
firm survival
medium,and bank-
or large
ruptcy success
companies [14,23,40].
across provincesAs shown by the data, theso
is not homogeneous, proportion
it would ofnotsmall, medium,that
be expected or large
the
bankruptcy
companies outcome is homogeneous
across provinces as well.
is not homogeneous, so it would not be expected that the
When mapping
bankruptcy outcomethe clusters for business
is homogeneous as well.size, the results show as expected. Northern
provinces
Whenhave a higher
mapping the proportion
clusters for of medium
business and
size, thelarge companies
results show as than the rest
expected. of the
Northern
country.
provinces Moran’s
have aindex
higherfor this variable
proportion (I_MED_GRND)
of medium and largehas a value ofthan
companies 0.350the
(z rest
= 4.0799),
of the
while Moran’s Index for small companies is 0.348 (z = 4.0721). Therefore,
country. Moran’s index for this variable (I_MED_GRND) has a value of 0.350 (z = 4.0799), in both cases,
spatial dependence
while Moran’s is revealed
Index for small(see Figure 11),isand
companies 0.348maps
(z =are complementary
4.0721). Therefore,between
in both them.
cases,
spatial dependence is revealed (see Figure 11), and maps are complementary between
them.You can also read