Net Zero Existing Building s Strategy - City of Toronto Impact Modeling & Assessment Technical Appendix - Windfall Centre
←
→
Page content transcription
If your browser does not render page correctly, please read the page content below
City of Toronto
Net Zero Existing Buildings Strategy
Impact Modeling & Assessment Technical Appendix

Final Draft
May 2021
Prepared for:

                Environment and Energy Division

Prepared by:
Purpose of the Technical Appendix
This technical appendix is a companion document to the City of Toronto’s Net Zero Existing
Buildings Strategy. It is organized around two main purposes:
      1. Technical index to the main report. This document offers definitions for
         acronyms, technical terms and study-specific concepts and connects readers of the
         main report to additional material referenced in the report, particularly relating to
         Chapters 2 and 4.
    For readers with this purpose, please use the section Technical Index as a guide to
    appropriate material.
      2. Summary of overall impact analysis process. The flow of the material past the
         Technical Index is used to summarize the analysis and assessment work conducted
         throughout the project. This material is organized in two pieces:
             •   FACILITY-SCALE – Facility Archetype Identification & Package Analysis
                 – Summary of facility-scale analysis work to identify zero carbon performance
                 packages and quantify the impacts of those packages at the facility level.
             •   CITY-SCALE - City-wide Impact Assessment – Summary of city-wide
                 analysis work and results associated with the prototype recommended
                 pathway to zero carbon illustrated in the report and used to set preliminary
                 emissions reduction targets by major sector.

1
CONTENTS
PURPOSE OF THE TECHNICAL APPENDIX ............................................................... 1
CONTENTS .............................................................................................................. 2
LIST OF FIGURES ................................................................................................... 3
LIST OF TABLES ..................................................................................................... 4
TECHNICAL INDEX – DEFINITIONS AND LINKS FOR KEY STUDY TERMS ................ 5
1. FACILITY-SCALE - ARCHETYPE IDENTIFICATION & ZERO CARBON PACKAGE
ANALYSIS............................................................................................................. 11
  1.1. FACILITY-LEVEL DATA ANALYSIS & PREPARATION ..................................................... 11
    1.1.1. Process, Data Sources and Assumptions .................................................. 11
  1.2. CLUSTERING (TYPOLOGY DEVELOPMENT) ............................................................... 12
    1.1.2. Process, Data Sources and Assumptions. ................................................. 12
    1.1.3. Calculated Data / Results ...................................................................... 12
  1.3. CALIBRATED MODELING ................................................................................... 19
    1.1.4. Process, Data Sources and Assumptions .................................................. 19
    1.1.5. Calculated Data / Results ...................................................................... 21
  1.4. MEASURES - ENERGY & COST ANALYSIS ................................................................ 25
    1.1.6. Process, Data Sources and Assumptions .................................................. 25
    1.1.7. Calculated Data / Results ...................................................................... 27
  1.5. PACKAGES – ENERGY & COST ANALYSIS ................................................................ 39
    1.1.8. Process, Data Sources and Assumptions .................................................. 39
  1.6. FACILITY-SCALE PERFORMANCE RESULTS ............................................................... 39
    1.1.9. Key Individual Facility Metric Performance By Package and Major Category .. 39
    1.1.10.   Package 25-year ILLC Sensitivity Analysis ............................................ 46
    1.1.11.   MURB and SFH Comparative Results With/Without Embodied Impact
    Improvements. ................................................................................................ 49
2.   CITY-SCALE - CITY-WIDE IMPACT ASSESSMENT ............................................ 52
     2.1.1. City Wide Assessment Assumptions ........................................................ 52
     2.1.2. Grid emissions ..................................................................................... 52
     2.1.3. Natural Gas emissions .......................................................................... 53
     2.1.4. Impact of Climate Change ..................................................................... 53
     2.1.5. Financial Assumptions .......................................................................... 54
     2.1.6. Cost of Carbon .................................................................................... 54
3.   EMISSIONS REDUCTION SCENARIOS ............................................................. 55
     3.1.1. Business-As-Planned (BAP) Scenario....................................................... 55
     3.1.2. Least-Capital Scenario .......................................................................... 55
     3.1.3. Aggressive Scenario ............................................................................. 56
     3.1.4. Prototype Recommended Scenario ......................................................... 58
     3.1.5. Overall Reduction Results By Scenario .................................................... 62
4.   CITY-WIDE RESULTS ...................................................................................... 63
     4.1.1. Overall 2050 and Accumulated Results .................................................... 63
     4.1.2. Micro-Economic Results ........................................................................ 66
     4.1.3. Macro-economic results ........................................................................ 72
     4.1.4. Co-benefits/Co-harms – Facility-scale ..................................................... 74
     4.1.5. Co-benefits/Co-harms – City-scale ......................................................... 75
5.   DRAFT TEMPORAL TARGET-SETTING RESULTS BY SECTOR............................. 76
     5.1.1. Setting Emissions Targets Based On City-Wide Roll-Out Assumptions .......... 76

2
List of Figures
Figure 1: Planning-Level Analysis Process Overview .................................................... 11
Figure 2: Large/High-Rise ICI emissions reductions by package .................................... 40
Figure 3: Small/Low-Rise ICI emissions reductions by package ..................................... 40
Figure 4: MURB emissions reductions by package ....................................................... 41
Figure 5 SFH emissions reductions by package ........................................................... 41
Figure 6: Large/High-Rise ICI Package 25-Year ILCC/Tonne Saved................................ 46
Figure 7: Small/Low-Rise ICI Package 25-Year ILCC/Tonne Saved ................................ 47
Figure 8: MURB Package 25-Year ILCC/Tonne Saved ................................................... 47
Figure 9: SFH Package 25-Year ILCC/Tonne Saved ..................................................... 48
Figure 10: Embodied Carbon Emission Impact for Clusters 12 (MURB) & 28 (SFH) ........... 49
Figure 11: 25-Year Life-Cycle Emissions with Average and Best Embodied Carbon for Cluster
28 (SFH) .............................................................................................................. 50
Figure 12: MURB and SFH Best Case Enclosure Material Embodied Emissions Impact ....... 51
Figure 13: Grid Emission Factors .............................................................................. 52
Figure 14: Overall Results by Scenario and Summary of Emissions Metrics ..................... 62
Figure 15: Prototype Recommended Scenario Total Emissions in 2050 by Sector ............. 63
Figure 16: Prototype Recommended Scenario Accumulated Emissions by 2050 by Sector . 64
Figure 17: Total Emissions in 2050 by Scenario .......................................................... 64
Figure 18: Accumulated Emissions by 2050 by Scenario .............................................. 64
Figure 19: Sensitivity of Total Emissions in 2050 by Scenario to Grid Emissions .............. 65
Figure 20: Cumulative Emissions with Operational and Scope 3 Emissions ...................... 65
Figure 21: Total Emissions in 2050 for Prototype Recommended Scenario including Scope 3
Methane Emissions................................................................................................. 66
Figure 22: Overall Capital Costs by Scenario .............................................................. 66
Figure 23: Average Annual Energy Cost Savings per Area by Scenario ........................... 67
Figure 24: Sectoral 25-Year Cost of Ownership by Scenario ......................................... 67
Figure 25: Sectoral MACC by Package for Large/High-rise Commercial ........................... 68
Figure 26: Sectoral MACC by Package for Institutional ................................................. 68
Figure 27: Sectoral MACC by Package for MURB ......................................................... 69
Figure 28: Sectoral MACC by Package for SFH ............................................................ 69
Figure 29: Sectoral MACC by Package for Low-Rise ICI ................................................ 70
Figure 30: Overall Recommendation 25 Year Total Cost of Ownership by Sector .............. 70
Figure 31: TCO/Tonne Sensitivity Analysis ................................................................. 71
Figure 32: Total Economic Activity by Scenario ........................................................... 72
Figure 33: Retrofit-Related Job Hours Created by Sector and Citywide ........................... 73
Figure 34: Sectoral and Citywide TEDI Impact............................................................ 74
Figure 35: Sectoral and Citywide CEDI Impact ........................................................... 74
Figure 36: Sectoral and Citywide Peak Demand Impacts – Heating................................ 75
Figure 37: Sectoral and Citywide Peak Demand Impacts –Cooling ................................. 75
Figure 38: Large/High-Rise Sector Targets Distributions .............................................. 76
Figure 39: Institutional Sector Target Distributions ..................................................... 77
Figure 40: SFH Sector Targets Distributions ............................................................... 78
Figure 41: MURB Sector Targets Distributions ............................................................ 79
Figure 42: Small Commercial Sector Targets Distributions ........................................... 80

3
List of Tables
Table 1: Clustering Analysis Summary ...................................................................... 14
Table 2: Cluster Summary Subsector % Breakdown .................................................... 16
Table 3: EUI Performance by Fuel Type ..................................................................... 18
Table 4: Key data points in cluster analysis............................................................... 20
Table 5: Cluster Input Parameters Envelope - 1st and 3rd Quartile Values ...................... 22
Table 6: Cluster Input Parameters Occupancy, ACH, Schedule and Power Density - 1st and
3rd Quartile Values ................................................................................................ 23
Table 7: Cluster Input Parameters HVAC - 1st and 3rd Quartile Values .......................... 24
Table 8: Single Family Homes - Major Category Measure Descriptions ........................... 28
Table 9: Single Family Homes – Package Measures ..................................................... 28
Table 10: Single Family Homes – EC Options ............................................................. 30
Table 11: MURBs - Major Category Measure Descriptions ............................................. 31
Table 12: MURBs – Package Measures ...................................................................... 32
Table 13: MURBs – EC Options................................................................................. 33
Table 14: Small / Low-Rise ICI - Major Category Measure Descriptions .......................... 34
Table 15: Small / Low-Rise ICI – Package Measures.................................................... 35
Table 16: Large / High-Rise ICI - Major Category Measure Descriptions ......................... 37
Table 17: Large/ High-Rise ICI – Package Measures .................................................... 38
Table 18 Large/High-Rise ICI SFH Focal Cluster Package Cost Results............................ 42
Table 19: Small/Low-Rise ICI SFH Focal Cluster Package Cost Results ........................... 43
Table 20: MURB SFH Focal Cluster Package Cost Results ............................................. 44
Table 21: SFH Focal Cluster Package Cost Results ...................................................... 45
Table 22: LFS, ZCR and Max Site Embodied Carbon .................................................... 50
Table 23: ILCC/tonne Impact - MURB ....................................................................... 51
Table 24: ILCC/tonne Impact - SFH .......................................................................... 52
Table 25: Grid Emission Factors by Year .................................................................... 53
Table 26: Climate Change Impact to HDD and CDD .................................................... 54
Table 27: Capital Cost Escalation Rate ...................................................................... 54
Table 28: Utility Rate Costs and Escalation Rate ......................................................... 54
Table 29: Cost of Carbon Timeline and Average Cost................................................... 55
Table 30: BAP Final Existing Building Package Mix in 2050 ........................................... 55
Table 31: BAP New Build Performance Assumptions .................................................... 55
Table 32: Least-Capital Final Existing Building Package Mix in 2050 .............................. 56
Table 33: Least-Capital New Build Performance Assumptions........................................ 56
Table 34: Aggressive Final Existing Building Package Mix in 2050 .................................. 57
Table 35: Aggressive New Build Performance Assumptions ........................................... 57
Table 36: Prototype Recommended Final Existing Building Package Mix in 2050 .............. 58
Table 37: Prototype Recommended New Building Performance Assumptions ................... 59
Table 38: Summary of Approximate Number of Building Undertaking Retrofit Actions in
Recommended Scenario (by decade) ........................................................................ 60
Table 39: Retrofit-related Job Hours and Estimated Number of Full Time Jobs ................. 73
Table 40: Large/High-Rise Sector Average Performance and Draft Targets ..................... 76
Table 41: Institutional Sector Average Performance and Draft Targets ........................... 77
Table 42: SFH Sector Average Performance and Draft Targets ...................................... 78
Table 43: MURB Sector Average Performance and Draft Targets ................................... 79
Table 44: Small Commercial Sector Average Performance and Draft Targets .................. 80

4
Technical Index – Definitions and Links for Key Study Terms
This section includes a summary of key terms and definitions that have been used within
the report. The definitions are organized chronologically instead of alphabetically to more
effectively link to the report content.
REPORT SECTION 2.1 & 2.2 – CITY-SCALE GHG EMISSIONS AND BREAKDOWN
Report pg. 9-16)
GHG EMISSIONS
Greenhouse Gas (GHG) Emission: Release of emissions from a process, typically
expressed in equivalent Global Warming Potential to Carbon Dioxide (i.e. expressed in the
gases CO2 Equivalency). Within the report all emissions assume a 100-year average for the
Global Warming Potential of GHGs.
Scope 1 Emissions: GHG emissions from sources located within the site or city boundary
(depending on where the boundary is drawn).
Scope 2: GHG emissions occurring as a consequence of the use of grid-supplied electricity,
heat, steam and/or cooling within the site/city boundary.
Scope 3: All other GHG emissions that occur outside the city boundary as a result of
activities taking place within the city boundary. In this study, Scope 3 emissions were
limited to the enclosure building material embodied carbon, operational refrigerant
emissions from cooling equipment and upstream methane emissions.
Enclosure upgrades - Embodied Carbon: In this study Embodied Carbon is defined as
the emissions associated with the material extraction and manufacturing of systems
installed for enclosure (building envelope) upgrades only. See discussion in the Facility-
Scale section for more insight.
Refrigerant leakage: Emissions associated with leakage of refrigerants from Heating,
Ventilation, and Air-Conditioning (HVAC) equipment during building operations. Though this
source can be considered a Scope 1 emission, it is not typically tracked well by operators or
included in many GHG inventories.
Upstream emissions: The emissions associated with upstream energy use and direct
methane emissions from natural gas extraction, production and transportation. These
emissions are applied to be both the electricity and natural gas emission factors used for the
study.
For further discussion on the data sources and analysis process for Scope 3 emissions see
the Facility-Scale section.
CITY-SCALE GHG PERFORMANCE METRICS
Key metrics of performance for GHG reduction for City-Scale analysis were originally defined
as part of the TransformTO quantification process, following the Global Report Initiative’s
recommendations for community inventories. The specific metrics explored in this study
are:
Study GHG emissions reduction: The overall savings in GHG emissions in a given year
relative to a baseline year. The baseline year for the study is the 2016 TransformTO
emissions.
City Targeted GHG emissions reduction: Similarly, emissions reductions relative to a
1990 baseline year are important to City of Toronto because they have set a 65% reduction
target by 2030.
Accumulated Carbon / Carbon Budget: Instead of reporting the annual emissions vs. a
target or baseline year, another more absolute measure of a given action is the reduction in
total accumulated carbon over the study period. This metric is used implicitly in financial

5
analysis (e.g. see LCC/tonne, as discussed below) but could be more explicitly used to
assess the GHG implications of actions.
Note: This metric also motivates exploration of annual (or at least periodic) GHG emission
factor changes associated with electricity, instead of using an average factor over the next
30 years. This is especially true in Ontario where emissions from electricity are scheduled to
increase in the next 20 years during the refurbishment of nuclear plants. For more
discussion on GHG factor changes, see the City-Scale section.
MAJOR BUILDING SECTOR GROUPINGS
There are four main groupings of buildings within the study, reflecting a variety of factors
including size, building type and principal use and ownership model. Based on the clustering
exercise outlined below, we have assigned all buildings in the available data set from 2016
to one cluster and each cluster to one of the four groupings above.
High-Rise / Large Institutional, Commercial & Industrial (High-rise ICI):
Institutional, Commercial, Industrial (ICI) buildings are typically based on MPAC
designations (see below) between 400 and 899. The typical building size of this sectoral
group is around 100,000 ft² or larger and typically having more than one storey.
Low-Rise / Small Institutional, Commercial and Industrial (Low-rise ICI): All other
ICI buildings fit into this category.
Multi-Unit Residential (MURB): Mostly MPAC designations 340, 341 for multi-unit
residential buildings with sever or more units that are not row housing (i.e. typically fall
under Part 3 of the building code).
Single Family Home / Dwelling (SFH or SFD): Most other residential occupancy types
(within MPAC category 300).
For the exact detail on how facilities across Toronto have been assigned to each sector, see
the Facility-Scale section discussion.
FACILITY-SCALE ENERGY & GHG INTENSITY PERFORMANCE METRICS
Report Figures 5, 6, and 7 show results for EUI, TEDI and GHGI comparing existing building
sectoral results to their closest counterpart within the Toronto Green Standard (TGS) -
Version 3. These metrics are defined as follows:
Thermal Energy Demand Intensity (TEDI): Annual energy load per unit area required to
be delivered through the heating, ventilation and air-conditioning (HVAC) systems of a
building in order to satisfy demands for ventilation air heating and zonal heating based on
scheduled set-points and after accounting for all losses through the enclosure and all
internal gains.
Passive Survivability (TEDI-related): This metric, borrowed from the City of Toronto’s
Zero Emissions Framework report connects the TEDI of a given facility to the amount of
time a building remains habitable during a power outage when heating is no longer
available.
Cooling Energy Demand Intensity (CEDI or TEDI-C): Identical definition to TEDI, but
reflecting energy load for cooling needs and cooling of ventilation air instead of heating.
Energy Use Intensity (EUI): All annual on-site energy used from all sources per unit area
including on-site generation.
GHG Intensity (GHGI): Annual Scope 1 and 2 GHGs (associated with on-site building
energy use) per unit area.
For more information, see the Facility-Scale section.

6
FACILITY CLUSTERING
For clarity on clustering process see the Facility-Scale section or follow the links below.
Archetype: A set of assumptions about form, operating procedure and building system
features that can be considered representative of a given group of buildings within an actual
building stock.
Cluster: Groups of buildings with similar characteristics. Clusters are based on multiple
parameters – better suited to capture variations in building performance rather than only on
building use or program type. For more information, see Clustering (Typology
Development).
Typology: Subgroup based on the underlying characteristics of properties within each
group. The fuel and electricity energy use intensity of each typology, for example, would be
based on the median energy use intensity values of all the properties contained in that
typology group.
Focal / Focal Point Cluster: Clusters selected to be representative clusters for facility
level energy analysis or for financial analysis. For more information, see Clustering
(Typology Development).
BUILDING ENERGY DATA SOURCES
EWRB: Ontario’s Energy and Water Reporting and Benchmarking program. Under Reporting
of Energy Consumption and Water Use regulation, large building owners need to report their
building’s energy and water use once a year to the Ministry of ENDM for buildings 100,000
square feet and larger.
EnerGuide: EnerGuide is the program developed by Natural Resources Canada to support
energy efficiency in homes, products, etc. The EnerGuide rating process for residential
homes produces a rich data set of modeled performance for existing residential buildings in
Toronto and the data set is shared with the City. We have used this data set to characterize
the energy use of Part 9 buildings.
MPAC: The Municipal Property Assessment Corporation supports municipalities to designate
the classification of buildings mostly for the purpose of accurate taxation. The definition of
MPAC numerical designations for properties can be found here. In some cases, MPAC-
designated properties are aggregated into addresses (e.g. as with Condos) reflecting
multiple properties within the same building.
BUILDING ENERGY BREAKDOWN
Fuel-specific Energy Use: Breaking a building’s energy use down by the different sources
of energy (e.g. electricity, natural gas, district heating, district cooling).
End-use Breakdown: Components of the energy use specific to different purposes (e.g.
lighting, heating, cooling, equipment, domestic hot water, etc.)
BUILDING SYSTEM BREAKDOWN
User-driven energy: Systems affected directly by space occupants (e.g. lighting, domestic
hot water fixtures, equipment of various types).
Enclosure: System of walls, windows, doors, roof, floors, etc. - both above and below
ground level – that separate the building’s spaces from the outdoor environment.
Heating, Ventilation and Air-conditioning (HVAC) – Delivery: Air- and water-based
systems (typically made up of coils, pumps, fans, ductwork and piping) used to connect the
space/zonal needs for heating, cooling and ventilation with the energy-transforming
systems of the Plant.
HVAC Plant: Systems used to transform the energy sources of the building (typically

7
electricity and natural gas) into heating and cooling energy. Examples include hot water and
domestic hot water (DHW) boilers, chillers, cooling towers, heat pumps, direct-expansion
(DX) cooling units, refrigeration systems, etc.
Electricity Generation: Equipment used to generate electricity on site and either use it on
site directly (behind the meter) or send it back to the electricity grid (grid-tied / grid-
connected). For this study the most important type of electricity generation is that of
Photovoltaic (PV) panels installed on roofs and over parking areas at the studied
buildings/sites.
For assumptions about how these system parameters varied across the cluster models see
the Facility-Scale section.
NOTE: There are many industry-specific terms used to describe specific technologies and
implementation strategies for building systems. We will endeavor to provide, if desired, a
separate glossary of these terms for the final report.
REPORT SECTION 2.3.1 & 2.3.2 - SYSTEM- AND FACILITY-LEVEL ACTIONS (Report
pg. 16-31)
BUILDING SYSTEM IMPROVEMENTS
Measures: A measure is an individual energy conservation, energy efficiency, fuel-
switching, renewable generation, or embodied impact transformation that can be applied to
a building in a specific way for each archetype / focal cluster.
Levels of Action: Categories of retrofit efforts towards achieving emission reductions used
in this study:
Level 1 - Represents a minimum level of investment effort
Level 2 - Represents a level of improvement effort equivalent to typical new construction
Level 3 - Represents a “best in class” effort and the most aggressive investment in
performance that can be made for a given system based on market-ready technology and
know-how
For detailed descriptions of the levels of action within each system breakdown across the
major sub-sectors, see the Facility-Scale section.
WHOLE FACILITY IMPROVEMENTS
Measure Packages (or just Packages): A package is a collection of measures that
achieves a specific set of goals (e.g. a 50% GHG reduction target) in a specific way. For
more information, see the Key Individual Facility Metric Performance By Package and Major
Category. For this analysis, the packages are defined as:
Like-for-Similar (LFS) – Package aligning targeted measure-level improvements with
systems and equipment that are expected to require replacement in a 30-year window of
service life (e.g. windows & roof)
LFS + Easy Fuel Switch (LFS+FS-1) – Package starting with Like-for-Similar and adding
1 or 2 (max) measures/improvements (representing approximately Level 1 enclosure effort)
as well as implementing a Level 1 fuel switch effort (fuel switch with natural gas
support/backup)
LFS + Full Fuel Switch (LFS+FS-2) – Package starting with Like-for-Similar and adding 1
or 2 (max) measures/improvements (representing approximately Level 1 enclosure effort)
as well as implementing a Level 2 fuel switch effort and DHW fuel switch.
Fuel Switch Ready (FSR) – Package with enclosure improvements and upgrades needed
to ready the facility for future fuel switching as well as Level 2 HVAC delivery upgrades
(including heat recovery)

8
Zero Carbon Ready (ZCR) – Package starting with Fuel Switch Ready and implementing
Level 2 Fuel Switch (cold climate, minimal gas back up required) as well as including DHW
fuel switch.
Max Site – Package of Level 3 enclosure upgrades, best HVAC upgrades and fuel switch
with geo-exchange (including DHW fuel switch).
Full Fuel Switch Only (FS-2 only) – Level 2 Fuel Switch as well as DHW fuel switch with
no enclosure or other load improvements
FACILITY-SCALE FINANCIAL PERFORMANCE METRICS
Example results for financial performance are included in Report Table 7 and Figure 15 of
the report with additional results across all focal clusters and sectors provided in the
Facility-Scale results. The financial metrics used at the facility scale are:
Incremental Capital Cost: The additional capital required to achieve the measures
proposed energy reductions relative to the base case. For all of the results shown in this
study at the facility-scale the base case is the LCS package.
Incremental Life-cycle Cost (ILCC): The net cost of a measure over its lifespan including
upfront capital cost, operation and maintenance costs and residual (end-of-life value) as
compared to base case. In our study Net Present Value (NPV) calculations are done with a
3% discount rate and residual value of capital is calculated using linear depreciation. The
study period of all ILCC calculations is 25 years as this is a typically planning horizon for
capital investment at a building scale.
ILCC/tonne: The incremental life-cycle cost to abate a tonne of carbon dioxide equivalent
emissions. For building scale, this metric is most appropriate to measure packages. The
denominator of this metric is the accumulated operational GHG emissions over the study
period (i.e. excluding Scope 3).
REPORT SECTION 2.3.3, 2.4 and 4.1.1/4.1.2 – CITY LEVEL ANALYSIS (Report pg.
31-50 and 77-78)
Pathway: A package or sequence of packages for a facility towards near zero emissions.
Many facilities will not likely be able to achieve zero emissions operations in a single retrofit
action and will therefore require multiple transformations to achieve near-zero emissions.
Emissions Reduction Scenario: A scenario is the roll-out/enaction of a suite of programs
over time and its associated impacts. A scenario is not a prediction, but a possible future (or
futures, with sensitivity analysis) based on the potential of the programs identified. It is also
based on external factors and assumptions (e.g. grid decarbonization, climate change).
Because of the uncertainty associated with scenario analysis, scenarios have multiple
directions or pathways that can be considered that achieve the same (or similar) results. For
more information, see the City-Scale section.
Business-as-planned: A scenario reflecting the use of LFS packages/levels of
improvement across all sectors. There was also a similar scenario as part of the
TransformTO Report #2 that described the actions and policy as planned by the City prior to
significant action initiated by TransformTO. An updated version of the TransformTO
modeling exercise aligns with the BAP defined as part of this study.
Least Capital Net-Zero Ready: A low or virtually least-cost, net-zero scenario reflecting a
constant pace of change across all buildings between 2022 and 2050.
Aggressive Net-Zero Ready: A net-zero scenario reflecting the level of acceleration and
action needed to achieve a 60% chance of avoiding greater than 1.5°C of global warming,
while maximizing investment in holistic upgrades.
Prototype/Recommended: A customized net-zero scenario developed by reflecting on the
performance differences of the above three scenarios and via dialogue with the broader

9
study team. The prototype recommended scenario is not an optimal scenario and will
require further refinement as conditions change.
CITY-SCALE FINANCIAL & RESILIENCE PERFORMANCE METRICS
Report Section 2.4 is dedicated to summarizing city-scale performance in key decisions-
making metrics. Several of those metrics are mimics of the Facility-scale Financial metrics.
Those metrics are:
Total Cost of Ownership (TCO): The net cost incurred including upfront capital cost,
operation and maintenance costs and residual (end-of-life value) over a set period. This
metric is identical to Life-cycle Cost but without the time value of money analysis.
TCO/Tonne: The total cost of ownership to abate a tonne of carbon dioxide equivalent
emissions. Similar to the facility-scale analysis, the TCO/Tonne in the study excludes Scope
3 emissions associated with the various packages implemented in the scenario.
Marginal Abatement Cost (MAC) Curves: Analysis of actions, reflecting a combination of
carbon and life-cycle-cost implications. MAC Curves are a deconstructed version of the
combined TCO/Tonne of a given emissions reduction scenario. In Report Figure 24 an
example MAC Curve for the MURB sector is provided. For additional curves, see City-wide
Results.
Overall Economic Activity (Construction Activity): This aggregated metric reflects the
sum of all upgrade package capital costs expended during the period of 2016 to 2030 for a
given reduction scenario. Energy-related cost, maintenance and renewal costs are excluded
from this metric.
Direct, Retrofit-related Job-Hours: Assuming a simple labour fraction of 50% for
enclosure upgrades, 30% HVAC and fuel switching upgrades and 20% for solar PV and an
average labour rate of $110/hour we have estimated the number of construction-related job
hours from the package-level analysis of measures for each scenario.
Direct, Full Time Jobs Created: The number of jobs created takes the number of Job-
Hours and divides by 1,985 for number of full-time hours per year and then takes an
average of this annual full-time jobs number over a 30-year study period (which was
selected to align with the TransformTO planning horizon).
Grid resilience support / Grid stewardship: To accurately reflect grid resilience involves
a grid-wide assessment of the impact of changes to the grid associated with energy
conservation, electrification of heating systems, increases in distributed electricity
generation and possible on-site battery storage systems. This level of effort was outside the
scope of the study; however, a high-level proxy of grid impact was estimated from the
change in heating and cooling peak loads estimated from the facility-scale modeling
described in more detail in the Facility-Scale section. This proxy metric is used to give a
high-level quantification of the potential grid implications / grid stewardship offered by the
various scenarios. The units of this proxy metric are “Mega-Watts”, but it does not reflect
the actual estimated change in grid power demand within each of the heating and cooling
seasons.
SECTORAL EMISSIONS REDUCTION TARGETS
Facility GHGI Emissions Reduction Targets: As discussed in Section 4.1.1 of the report
and further detailed in the City-Scale section of this report, 5-year average facility-scale
emissions reduction targets are calculated from the Recommended emissions reduction
scenario results and estimates of the distribution of facility-scale GHGI performance for the
major sectors. The process for calculating the targets assumes all non-compliant facilities
reach, but do not exceed, the target by the end of the 5-year period.

10
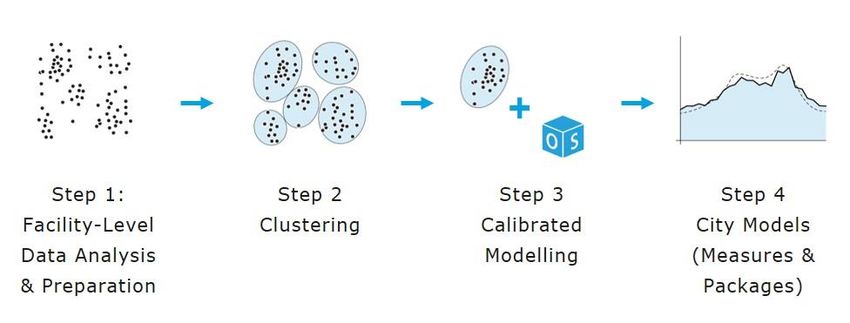
1. FACILITY-SCALE - Archetype Identification & Zero Carbon
   Package Analysis
To evaluate the impact of existing building retrofits, there needed to be processes in place
to reasonably estimate the underlying performance characteristics of the existing building
stock. The challenge was how to use the limited set of information that is publicly available
from the city of Toronto to estimate performance characteristics and subsequently model
the impact of building retrofits.
The methodology used in this analysis is a four-step process that is designed for a planning-
level analysis of existing building retrofits. Further details for each step is provided below
and in the following sections.

Figure 1: Planning-Level Analysis Process Overview

Facility-level Data Analysis & Preparation: Creating a linear regression model to
estimate annual energy use for each building in the city based on known building attributes.
Clustering: Grouping facilities based on program type, fuel use, and electricity use to
establish relevant building typologies.
Calibrated Modelling: Creating an energy model for each typology that is calibrated
against the median energy use intensity of each or cluster.
Measure and Package Modelling: Using the calibrated energy models for each typology
to model various retrofit interventions and bundling measures to represent various retrofit
packages options.

1.1.Facility-Level Data Analysis & Preparation

1.1.1. Process, Data Sources and Assumptions
The first step was to create a linear regression model to estimate annual energy use for
each building in the city. The regression model, which was used to create energy use
estimates for each property, was based on common attributes across the MPAC, EWRB,
EnerGuide, and MURBS datasets. Common attributes included: property type (program
type), year of construction or major renovations, and building size (gross area). The
regression model was used to generate estimates for fuel and electricity energy use
intensity for each property in the MPAC dataset. To validate that the regression model
created a reasonable prediction of energy use, the aggregate results (total fuel and
electricity estimates) were compared against measured data from the city’s greenhouse gas
inventory. The model was within 10% of the measured data from the greenhouse gas
inventory.

11
The regression model was developed using three datasets: EWRB data, which covers large
ICI buildings, a MURBS database of approximately 130 MURB properties, and the EnerGuide
rating system data, which covers single-family homes. One notable gap in these three
datasets is small ICI buildings that are not adequately captured in the EWRB dataset.
Roughly 95% of the buildings in the EWRB dataset were greater than 50,000 ft2. Though
the effect of this will likely be to overestimate building energy use from the regression
model, no adjustments were made to the regression model, as it was felt to be a
conservative assumption.
Data Sources: EWRB data for multifamily (2018), commercial, industrial, and institutional
properties; EnerGuide rating data for single family homes (2018); MURB audit data for
mixed-use residential buildings (2008-2019); MPAC data for all properties (2016).

1.2.Clustering (Typology Development)

1.1.2. Process, Data Sources and Assumptions.
The goal of the clustering process was to identify groups of buildings that have similar
performance characteristics. These groups form the basis of building typologies, which was
used to evaluate the impact of energy efficiency retrofits in different building sectors.
Groups were created from a k-means clustering process that used program type, fuel use,
and electricity use as the clustering variables. Furthermore, the variables were standardized
before using the k-means clustering algorithm. The variables were chosen to capture the
most statistically significant differences in energy use across the building stock, with energy
being the primary focus of this analysis. The number of groups was determined through a
sensitivity analysis to find the optimal trade-off between modeling speed (more groups
require more modeling time) and fidelity (fewer groups result in a wider margin-of-error).
There is no significant benefit to having more groups or more typologies for the purposes of
this analysis. The result of this process was 32 groups of buildings, with each group
forming the basis of a distinct building typology.
Each building typology is based on the underlying characteristics of properties within each
group. The fuel and electricity energy use intensity of each typology, for example, is based
on the median energy use intensity values of all the properties contained in that typology
group. For the most part, the groups are composed of similar property types (e.g. office,
retail, etc.). However, in some instances there is a heterogenous mix of property types
within the group, which simply means that those properties theoretically have similar
performance characteristics and will respond similarly to various retrofit measures.
The typical approach to urban energy modeling relies on archetypal building definitions that
take into account program, size, and vintage. The only difference in the approach in this
study is the use of an additional two parameters – electricity and gas use – that can say
more about how a building might respond to individual retrofits. By using energy use as a
key parameter for archetypal definition, through a process of statistical clustering, the most
significant differences in energy use can better capture across buildings in the city. While
this process results in some definitional ambiguity with respect to individual clusters, or
archetypes, it results in a much more robust set of results at the aggregate, urban scale.
Data Sources: MPAC data with fuel and electricity use intensity estimates for each
property.

1.1.3. Calculated Data / Results
The following table outlines the results of the clustering analysis. The clusters were
organized into four main sectors: Institutional & Large Commercial Buildings, Multi-Unit
Residential Buildings, Single Family Homes and Small Commercial & Industrial Buildings. As
well, for each cluster the number of buildings, total floor area and GHG emissions are

12
shown. Of note is that six clusters account for almost half of the total annual emissions from
Toronto’s building stock. These represent key clusters within each building sector. Each
cluster has a predominant program type and the breakdown of each cluster by percent floor
area of each sub-sector within the cluster is also provided in the table below.
Each cluster was assigned a focal cluster for energy efficiency measures and for costs. (e.g.
Cluster 6 was assigned to Cluster 10 energy efficiency measures and Cluster 22 costs) and
these assignments are summarized in the table below.

13
Table 1: Clustering Analysis Summary
    Sector         Cluster   Description – Predominant Program        No. of      Total Area     GHG                 Cluster Assignments1
                   No.       Type and Age                             Buildings   (m2)           Emissions
                                                                                                 (tCO2e)         EE Measure        Cost
                                                                                                                 Set               Cluster
                      4      Education c. 1975                           768       8,160,365       426,498             4/22              4
                     16      Education c. 1960                           362       4,937,845       252,132             4/22              4
    Institutiona
                             Large mixed-use developments,
    l & Large        22                                                  100       7,892,828       494,693             4/22              22
                             c.1980
    Commercial
    Buildings        14      Large office buildings c. 1975              18        1,690,068       101,278             4/22              22
                             Large properties, non-specific use,
                      6                                                  19        1,026,393        53,154             4/22              22
                             c.1965
                                                                                   28,414,64
                      8      Multifamily housing, c. 1960               3,761                     1,311,510            8/12              8
                                                                                       8
                                                                                   15,480,37
    Multi-Unit       12      Large multifamily properties, c. 1990      1,332                      611,972             8/12              12
                                                                                       7
    Residential
    Buildings                Mid-size multifamily, higher
                     15                                                 1,051      5,162,980       199,250             8/12              12
                             performance, c. 2000
                             Large multifamily properties, low
                     20                                                  18        1,774,967       117,122             8/12              12
                             performance, c. 1970
                             Single-family housing, low                            10,229,96
                     28                                                88,949                      430,924              28               28
                             performance, c. 1960                                      2
                             Single-family housing, better-
    Single           31                                                60,794      8,913,759       311,439              29               28
                             performance, c. 1960
    Family
    Homes            23      Single-family housing, c. 1975            51,677      9,350,217       272,938              28               28

1
 Five sets of energy efficiency measures and nine costing models were defined for nine focal-point clusters. Remaining non-focal clusters were
assigned a focal cluster to be used for measure and costing analysis (e.g. cluster 14 is defined by energy efficiency measure set for cluster 10
and costing for cluster 22).

14
Sector Cluster Description – Predominant Program No. of Total Area GHG Cluster Assignments1
No. Type and Age Buildings (m2) Emissions
(tCO2e) EE Measure Cost
Set Cluster
30 Single-family housing, c. 1990 34,007 6,907,071 189,478 28 28
Single-family housing, better
32 31,993 7,088,389 164,336 28 28
performance, c. 2000
New single-family housing, high
24 12,189 4,532,129 84,075 28 28
performance, c. 2010
Old single-family housing, low
29 60,176 8,142,153 410,198 29 29
performance, c. 1920
Single 26 Single-family housing, c. 1945 46,816 5,984,849 253,962 29 29
Family
Homes Old single-family housing, low
25 40,739 4,673,169 238,792 28 29
performance, c. 1910
Larger single-family housing, c.
27 8,777 2,510,355 96,186 29 29
1930
5 Retail c. 1980 1,683 7,884,831 353,936 10 5
17 Mid-size retail, c. 1960 779 1,548,213 56,810 10 5
7 Small retail c. 1950 643 1,012,047 32,619 10 5
9 Small Retail c. 1990 890 469,468 12,762 10 5
Small properties, non-specific use, c.
Small 21 3,359 4,417,690 194,199 10 10
1970
Commercial
& Industrial 10 Mid size office, c. 1970 1,630 3,996,549 141,385 10 10
Buildings
19 Small mixed-use properties, c. 1940 8,560 2,774,253 130,858 4/22 10
1 Mixed use hotel and office c. 1975 1,477 2,108,322 76,937 8/12 10
2 Small commercial properties c. 1900 2,572 1,043,583 62,772 4/22 10
11 Small mixed-use properties, c. 1920 888 1,409,494 36,188 4/22 10
18 Small properties, non-specific use, c. 637 724,967 20,792 10 10
15Sector Cluster Description – Predominant Program No. of Total Area GHG Cluster Assignments1
No. Type and Age Buildings (m2) Emissions
(tCO2e) EE Measure Cost
Set Cluster
2000
Manufacturing and warehousing c. 13,252,15
13 7,028 506,762 10 13
1980 6
Manufacturing and warehousing c.
3 2,445 4,111,970 146,289 10 13
1960
Table 2: Cluster Summary Subsector % Breakdown
Sub Sector % Floor Area
Building Sector Cluster Manufacturin Mixed Multifamil Single
Educatio
Hotel g/ Use y Office Other2 Retail Family
n
Warehouse Property Housing Dwelling
18.8
4 39.8% - 17.5% - - 19.5% 4.3% -
%
89.4
Institutional & 6 - 10.6% - - - - - -
%
Large Commercial 91.0
Buildings 14 - - - - - 9.0% - -
%
16 82.0% - - - - 9.0% 4.8% 4.1% -
13.1
22 30.0% 1.5% 23.0% - - 29.2% 3.2% -
%
Multi-Unit 8 - - - 0.1% 99.9% - - - -
Residential 12 - - - - 100.0% - - - -
2
The term “Other” is defined by MPAC. “Other” includes building designations that do not fit in with the predominant program types otherwise
identified and were clustered based on median energy use intensity such that they could be grouped together. While a predominant program
type cannot be identified, this highlights the benefit of applying the clustering method over traditional archetyping as there are four distinct
clusters that are primarily defined by “Other” that will theoretically have similar performance characteristics and will respond similarly to various
retrofit measures.
16Sub Sector % Floor Area
Building Sector Cluster Manufacturin Mixed Multifamil Single
Educatio
Hotel g/ Use y Office Other2 Retail Family
n
Warehouse Property Housing Dwelling
Buildings 15 - - - 3.6% 96.4% - - - -
20 - - - 24.5% 67.5% - 7.9% - -
Single Family 23 to
Homes - - - - - - - - 100.0%
32
1 - 31.0% 0.3% - - 48.3% 20.4% - -
2 - - - 74.0% 15.4% - 10.6% - -
3 - - 100.0% - - - - - -
26.5
5 - - 54.8% - - 18.6% - -
%
30.8
7 69.2% - - - - - - -
%
16.2
9 0.2% 10.1% 58.0% - - 15.5% - -
Small Commercial %
& Industrial 10 0.8% - - - - 99.2% - - -
Buildings 25.3 24.6
11 28.8% - 21.3% - - - -
% %
13 - - 80.0% - - 20.0% - - -
51.4
17 8.0% - 30.0% - - - 10.5% -
%
95.1
18 - - - 4.9% - - - -
%
19 - - - 94.0% - - 6.0% - -
96.8
21 - 0.7% - - - 2.5% - -
%
17Table 3: EUI Performance by Fuel Type
Building Sector Clust Electric Energy Fuel Energy TEUI
er (kWh/m²) (kWh/m²) (kWh/
Numb m²)
er
4 284 201 485
6 184 226 410
Institutional & Large
14 219 270 489
Commercial Buildings
16 281 167 448
22 322 268 590
8 107 234 341
12 93 215 308
Multi-Unit Residential Buildings
15 102 189 290
20 152 336 488
23 47 169 216
24 22 92 114
25 59 261 320
26 55 223 278
27 38 203 241
Single Family Homes
28 55 206 262
29 56 243 299
30 43 147 190
31 51 190 241
32 41 122 163
1 174 161 335
2 121 229 349
3 228 140 368
5 254 178 433
7 248 127 375
9 183 120 303
Small Commercial & Industrial
10 204 149 353
Buildings
11 226 97 323
13 231 159 389
17 253 151 404
18 141 131 272
19 130 226 356
21 155 195 350
181.3.Calibrated Modeling
1.1.4. Process, Data Sources and Assumptions
Given the limited information for each typology (there was only information about the
program type and energy use intensity), the goal of the calibrated modelling process was to
create an energy model for each typology that reflects the performance characteristics of
the underlying properties. The models were calibrated against the median energy use
intensity of each group, or cluster. The calibrated modelling process relies on statistical
surrogate models that help determine the input parameters of each energy model and was
designed to take that limited set of information and predict the right set of input parameters
for the energy model.
The general process involved using a machine learning model to identify the appropriate set
of model input parameters for each typology. The process started by running EnergyPlus
simulations for the full design space of possible solutions – roughly 10,000 simulations using
energy plus that are designed to capture all possible combinations of input parameters. Half
of these simulations are used to train the machine learning model, and half are used to test
the model. For this process a random forest algorithm was deployed as the basis of the
surrogate model. This process is described in detail in the following published papers:
- Shreshth Nagpal, Caitlin Mueller, Arfa Aijazi & Christoph F. Reinhart (2018): A
methodology for auto-calibrating urban building energy models using surrogate
modeling techniques, Journal of Building Performance Simulation, DOI:
10.1080/19401493.2018.1457722.
- Shreshth Nagpal, Jared Hanson & Christoph F. Reinhart (2019): A framework for
using calibrated campus-wide building energy models for continuous planning and
greenhouse gas emissions reduction tracking.
To develop a training set for the machine learning model, energy simulations were run using
a randomized set of input parameters, representing the full set of possible solutions. The
model then used the training data set to look for patterns in the data, which allowed
identification of the most likely set of input parameters, or building attributes, for each
typology. The input parameters identified through this process are listed below.
• Window to wall ratio (WWR)
• Window U value
• Window solar heat gain coefficient (SHGC)
• Wall R value
• Roof R value
• Occupant density
• Occupancy schedule
• Outside air flowrate (ACH)
• Equipment usage schedule
• Equipment power density
• Lighting usage schedule
• Lighting power density
• Heat recovery
• Economizer
• Cooling coefficient of performance (COP)
19• Heating COP The machine learning process then finds the combination of input parameters that yield the expected electricity and fuel energy use intensity for each cluster. The automated process yields ten least-error models (i.e. 320 models in total, 10 for each cluster), which are aggregated to better capture the extremes likely present in each cluster and therefore more accurately represent energy savings potential. The EnergyPlus simulation engine was used to generate the calibrated energy models, which were set as shoebox models with fixed width perimeter zones. The Toronto-City weather file was applied. Table 4: Key data points in cluster analysis Relevant Data Point EWRB EnerGuide Year built ○ ○ Occupancy ○ Primary property type ○ ○ GFA (ft2) ○ ○ Electricity use (annual) ○ ○ Fuel use (annual) ○ ○ Total site energy (annual) ○ ○ Heating energy (annual) ○ System descriptions ○ System efficiencies ○ Air tightness (ACH@50pa) ○ Envelope insulations values ○ EnerGuide rating ○ Energy use for all buildings in the city was provided by Enbridge and Toronto Hydro. These utility-scale data were only subdivided by broad type classification (e.g. MURBs, low-rise residential, commercial, industrial) and the electricity and gas classifications are not well- aligned. Archetypes which fit within the even broader, harmonized utility classifications were adjusted as a group to ensure that the energy use from the calibrated models matches the overall utility-scale data. The set of calibrated energy models by archetype and fuel, were spot-checked and refined based on other datasets available (i.e. SHEU/SCIEU, BPS, EWRB) and project team experience. The model occasionally has trouble differentiating between model parameters that have similar thermodynamic implications. For some of the typologies composed of mixed-use residential buildings, for example, the model assumed a certain level of heat recovery, which could equally be explained by reduced ventilation airflow rates or a faulty ventilation air system. The best way to think about the model input parameters, as they relate to actual system performance, is an effective level of performance. The systems are not modeled explicitly in EnergyPlus, but rather based on a simple abstraction using a coefficient of performance (COP) value. A COP of 1 or less represents a mixed-fuel system, while a COP of 1 or greater represents an all-electric system. If the COP is 1, the model determines whether the system should be mixed-fuel or all-electric depending on the relationship between fuel and electricity energy use intensity. The COP includes all fan and pumping energy associated with meeting the heating and cooling demand. Based on an initial review of the results, mixed-fuel systems for all typologies was decided to be used. Accommodations for the prevalence of electric resistance heating were 20
made by attributing a portion of the thermal energy demand intensity to electricity in
instances where the model was unable to clearly differentiate between mixed-fuel and all-
electric systems.
Since domestic hot water is difficult to predict with the surrogate model, domestic hot water
usage rates were manually assigned for each typology based on the project team’s
experience working on buildings with similar program distributions.

1.1.5. Calculated Data / Results
The model does not predict a single set of results, but rather a number of ‘high-probability’
input parameter combinations. Therefore, when representing the results of the calibration
process, it’s helpful to review the distribution of results for each parameter, rather than
single, empirical values. The tables in this section show the first and third quartile results,
which gives a sense of the range of results produced by the calibration routine. When there
is a small difference between the first and third quartile values (or when they are the same)
it generally indicates a high degree of confidence in the results. In cases where there is a
larger difference, there is more uncertainty about the value. Note that these are all effective
performance values used in planning-level energy models.

21
Table 5: Cluster Input Parameters Envelope - 1st and 3rd Quartile Values
     Cluster
               WWR          Window U       Window         Wall R value     Roof R value
                            value (W/m2-   SHGC           (m2-K/W)         (m2-K/W)
                            K)
               Q1     Q3    Q1      Q3     Q1       Q3    Q1       Q3      Q1      Q3
 1             0.4    0.6   3       5      0.5      0.5   1.67     1.67    2.50    2.50
 2             0.6    0.6   3       3      0.4      0.4   0.40     0.40    0.83    0.83
 3             0.6    0.6   5       5      0.4      0.5   3.33     3.33    2.50    2.50
 4             0.4    0.6   1.875   3      0.4      0.5   1.67     0.40    0.83    0.83
 5             0.45   0.6   5       5      0.5      0.5   0.93     0.40    0.83    0.83
 6             0.4    0.6   3       5      0.4      0.5   0.93     0.40    2.50    2.50
 7             0.4    0.6   5       5      0.4      0.5   1.67     1.67    4.00    2.50
 8             0.4    0.6   1.5     1.5    0.5      0.5   1.67     0.49    0.83    0.83
 9             0.4    0.6   3.5     5      0.4      0.4   0.40     0.40    0.83    0.83
 10            0.6    0.6   5       5      0.4      0.4   1.67     0.40    2.50    2.50
 11            0.45   0.6   5       5      0.4      0.5   0.93     0.40    0.83    0.83
 12            0.25   0.6   3.5     5      0.5      0.5   1.67     0.40    1.67    0.83
 13            0.45   0.6   3       3      0.325    0.4   0.93     0.40    2.50    2.50
 14            0.45   0.6   3.5     5      0.425    0.5   0.93     0.40    0.83    0.83
 15            0.6    0.6   3       3      0.5      0.5   3.33     1.90    5.00    2.50
 16            0.6    0.6   5       5      0.4      0.4   0.40     0.40    2.50    2.50
 17            0.4    0.6   1.5     3      0.5      0.5   0.40     0.40    2.50    1.00
 18            0.4    0.6   5       5      0.5      0.5   0.40     0.40    0.83    0.83
 19            0.4    0.6   1.5     1.5    0.5      0.5   0.40     0.40    0.83    0.83
 20            0.4    0.4   1.5     3      0.4      0.4   3.33     3.33    2.50    2.50
 21            0.4    0.6   1.875   5      0.425    0.5   1.67     0.40    0.83    0.83
 22            0.2    0.4   3       3      0.325    0.4   2.67     1.67    0.83    0.83
 23            0.4    0.4   5       5      0.5      0.5   1.67     1.67    0.83    0.83
 24            0.4    0.4   5       5      0.5      0.5   1.67     0.40    2.50    2.50
 25            0.4    0.6   3       4.5    0.4      0.4   1.67     1.67    0.83    0.83
 26            0.2    0.4   5       5      0.5      0.5   1.67     1.67    2.50    2.50
 27            0.2    0.4   5       5      0.5      0.5   1.67     1.67    4.00    2.50
 28            0.4    0.6   1.5     1.5    0.5      0.5   1.67     1.67    2.50    2.50
 29            0.4    0.4   1.875   3      0.5      0.5   1.67     1.67    0.83    0.83
 30            0.2    0.2   5       5      0.5      0.5   1.67     1.67    0.83    0.83
 31            0.4    0.4   1.875   5      0.5      0.5   1.67     1.67    2.50    2.50
 32            0.2    0.6   5       5      0.5      0.5   1.67     1.67    2.50    2.50

22
You can also read